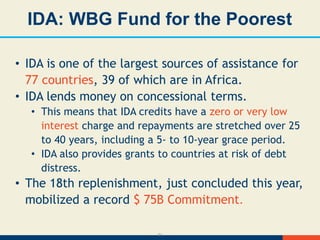
Download to read offline


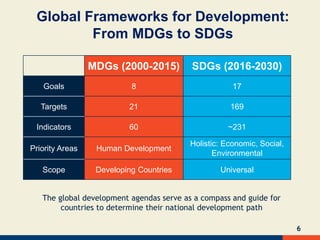

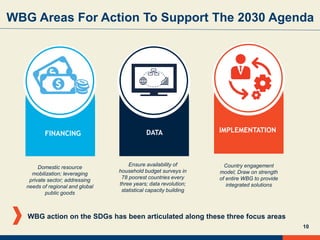


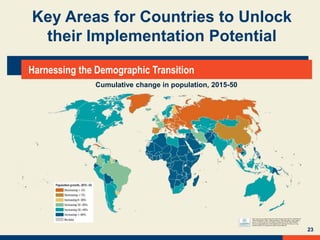
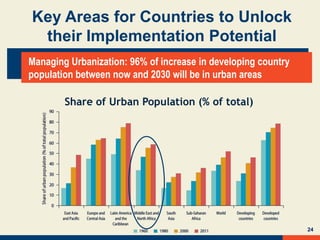
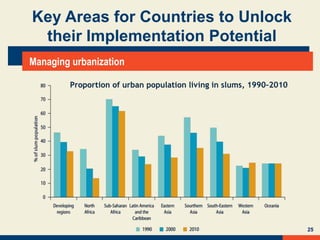


The document discusses key aspects of implementing the Sustainable Development Goals (SDGs). It outlines that global frameworks have evolved from the Millennium Development Goals (MDGs) to the more comprehensive SDGs. It also notes that financing development and improving data availability will be critical to supporting implementation of the SDGs. Key implementation areas highlighted include managing population growth, urbanization, and ensuring better development outcomes.