1. FINANCING THE POST-2015
DEVELOPMENT FRAMEWORK
World Bank Roundtable on Post-2015 Development
Agenda in China
Beijing – July 23, 2013
The World Bank
2. Lessons from the existing MDGs framework
• The original MDGs were articulated independently of a
financing framework (Monterrey 2002).
• In a context of fiscal consolidation, discussion of post-2015 goals
must be integrated with consideration of supporting financing.
• No quantity of financing, whether grant, concessional, or non-
concessional, can achieve the development goals without
supporting policies and a credible commitment to combating
poverty.
• Costing MDGs requires too many assumptions (WDR 2004),
and is not the objective of this exercise.
2
3. 3
China’s MDGs and Indicators Progress
Goal 1: Eradicate Extreme Poverty and Hunger
A: Halve, between the proportion of people whose income is less than one dollar a day
B: Achieve full and productive employment and decent work for all, including women and young people
C: Halve the proportion of people who suffer from hunger
Already met
Potentially
Already met
Goal 2: Achieve Universal Primary Education
Children everywhere, boys and girls alike, will be able to complete a full course of primary schooling Already met
Goal 3: Promote Gender Equality and Empower Women
Eliminate gender disparity in primary and secondary education, preferably by 2005, and in all levels of
education no later than 2015
Likely
Goal 4: Reduce Child Mortality
Reduce by two-thirds the under five mortality rate Already met
Goal 5: Improve Maternal Health
A: Reduce by three quarters the maternal mortality ratio
B: Achieve universal access to reproductive health
Likely
Potentially
Goal 6: Combat HIV/AIDS, Malaria and Other Diseases
A: Have halted by 2015 and begun to reverse the spread of HIV/AIDS
B: Achieve, by 2010, universal access to treatment for HIV/AIDS for all those who need it
C: Have halted by 2015 and begun to reverse the incidence of malaria and other major diseases
Likely
Potentially
Likely
Goal 7: Ensure Environmental Sustainability
A: Integrate the principles of sustainable development into country policies and programmes and reverse
the loss of environmental resources
B: Reduce biodiversity loss, achieving, by 2010, a significant reduction in the rate of loss
C: Halve the proportion of people without sustainable access to safe drinking water and basic sanitation
D: By 2020, to have achieved a significant improvement in the lives of at least 100 million slum dwellers.
Likely
Potentially
Likely
Likely
Goal 8: Develop a global partnership for development On-going
Source of Information: Millennium Development Goal Report 2010
4. A two-pronged approach to supporting a
post-2015 development framework
Increase impact of available resources
Leverage additional resources
Good policies and credible institutions enhance the impact of
available resources and leverage additional resources from
both domestic and foreign sources.
Good policies and credible institutions to:
4
5. Parameters to consider in the post-2015
financing framework
What can developing
countries do?
What can the international
community do?
• Design targeted, evidence-
based policies and support
sound institutions
• Generate more revenues
• Ensure efficient public
spending
• Promote financial deepening
and inclusion
• Maximize the impact of ODA
• Support new development
partners
• Leverage the private sector
• Tap into new sources of finance
• Deliver global public goods
5
6. Generate more revenues
Taxation capacity improving in MICs, progress needed in LICs
21.2
28.4 28.4 29.3
18.8
17.1
19 19.3
11.3
10 10.5
13.6
0
5
10
15
20
25
30
35
1994 1998 2003 2009
High Income Middle Income Low Income
Tax Revenue (in % of GDP) by Income Groups, 1994-2009
Source: World Development Indicators
7. Ensure efficient public spending
Fossil fuel subsidies do not target the poor
Source: World Energy Outlook, IEA, 2011
Subsidies are an inefficient means of assisting the poor: only 8% of the $409 billion spent on
fossil-fuel subsidies in 2010 went to the poorest 20% of the population.
Fossil fuel consumption subsidies measure what developing countries spend to provide below-
cost fuel to their citizens. High-income countries offer support to energy production in the form of
tax credits or loan guarantees, which are not included in these calculations since they are
directed towards production rather than consumption of the fuel.
7
8. Financial sector development for growth
A thriving private sector creates opportunities for entrepreneurship and job creation
How do financial
institutions contribute to
economic growth?
Lower the cost of
financial and nonfinancial
transactions
Facilitate efforts to
reduce and trade risks
8
9. Financial Inclusion
Access to finance is a major constraint to growth for entrepreneurs in LICs
21
9 3 10
#Total MSMEs (formal
andinformal)
#with Checking account #with Loan/Overdraft #Unserved+
Underserved
52
25
13
27
# Total MSMEs (formal
and informal)
# with Checking account # with Loan/Overdraft # Unserved +
Underserved
20 12 6 10
#Total MSMEs (formal
andinformal)
#with Checking account #with Loan/Overdraft #Unserved+
Underserved
188
62
23
92
# Total MSMEs (formal
and informal)
# with Checking account # with Loan/Overdraft # Unserved +
Underserved
78
34
11
36
#Total MSMEs (formal
andinformal)
#with Checking account #with Loan/Overdraft #Unserved+
Underserved
40
18
4
22
# Total MSMEs (formal
andinformal)
# with Checking account # with Loan/Overdraft # Unserved+
Underserved
LAC
MNA
ECA EAP
SAR
AFR
# of MSMEs (in Mn)
# Total MSMEs
(formal and
informal)
# with Checking
account
# with
Loan/Overdraft
# Unserved +
Underserved
Source: Two trillion and counting, IFC & McKinsey, 2010
10. Source: MDG Gap Taskforce Report, 2012 and OECD
IDS 2012
Maximize the impact of ODA
Total net ODA, already short of Monterrey targets, has declined by 4% in 2012
10
0.00 0.20 0.40 0.60 0.80 1.00 1.20
United States
Germany
United Kingdom
France
Japan
Netherlands
Sweden
Canada
Australia
Norway
DAC Members' Official Development Assistance as a percentage of GNI,
2000-2012
2000-2001
2007
2009
2011
2012
UN Target:
0.7% of GNI
11. Collaborate with new development partners
Emerging donors, led by China, provide relatively limited aid as defined by the OECD, but
contribute to development through other external flows and in-kind assistance
Source: World Bank CFP Working Paper No. 8, Finance for Development
11
For the purpose of comparison, in 2009, net ODA from DAC members was 119.8 bn USD.
0.00
0.50
1.00
1.50
2.00
2.50
3.00
3.50
4.00
4.50
2003 2004 2005 2006 2007 2008 2009
Estimated aid from BRICS, 2003-2009 (USD billion)
China India Russia Brazil South Africa
12. Chinese Financing Commitment in African Infrastructure,
2001-2010 (million USD)
12
Source: Chen Chuan, 2013 based on World Bank-PPIAF Chinese Projects Database
13. International flows to developing countries
International capital flows to developing countries dominated by foreign direct investment
Total capital inflows in 2012: USD 1,007 billion
13
Remittances, which are not part of capital inflows but are an important source of foreign currency for developing countries,
were an estimated USD 399 bn in 2012.
Inflows refer to flows from non-residents to developing countries. FDI inflows are net of disinvestments by non-residents.
Debt inflows are debt disbursements net of repayments. Official flows include bilateral and multilateral lending and are not
equivalent to ODA. Data on official capital inflows are “debt enhancing official assistance” and, thus, not the same as ODA,
which is concessional in character with a grant element.
Source: Long-term financing for
growth and development. G20
Umbrella Paper, Feb. 2013 and
Global Economic Prospects 2013,
World Bank.
FDI inflows, 600.1,
60%
Portfolio equity
inflows, 44.4, 4%
Bonds, 143.3,
14%
Banks, 71.5, 7%
Short-term debt
flows, 126.7, 13%
Other private, 7.1,
1%
Official (World Bank,
IMF, and other), 14.1,
1%
14. ODA and remittances are especially
critical for fragile states
14
Foreign
direct
investment
505.7, 40%
Portfolio
investment
128.4, 10%
Long-term
debt (private)
155.8, 12%
ODA grants
89, 7%
Long-term
debt
(official)
69.2, 5%
Worker
remittances
319, 25%
Net financial flows to developing
countries, 2010
Total: USD 1,267 billion
Foreign direct
investment
27.59, 22%
ODA
50.04,
40%
Worker
remittances
47.38, 38%
Gross financial flows to fragile states,
2010
Total: USD 125 billion
Source: World Bank CFP Working
Paper No. 8, Finance for Development
Source: Fragile States 2013, OECD
NB: Based on OECD definition of fragile states
15. The official sector has a particularly important
role to play in LICs and fragile states
15
0.9
6.4
7.8
Net official capital flows and transfers, 2012 (% of GDP)
Emerging market countries Low-income countries Fragile states
Source: Global Monitoring Report 2013, World Bank
The classification of countries is the one used in the IMF‘s World Economic Outlook. Emerging market and developing countries are those countries that
are not designated as advanced countries. Countries that are eligible for financial assistance under the IMF‘s Poverty Reduction and Growth Trust
constitute a subset of emerging market and developing countries; these countries are denoted low-income countries although eligibility is based on other
considerations in addition to income levels. Emerging market and developing countries that are not eligible for financial assistance under the Poverty
Reduction and Growth Trust are designated as emerging market countries. Fragile states are countries included in the World Bank‘s list of Fragile and
Conflict-Affected States as of early 2013.
16. Leverage the private sector: partnerships
Well-structured initiatives with a diverse range of partners help governments raise the large
sums of capital required to meet infrastructure needs and consequently spur development
16
Maharashtra & Tamil Nadu, India
CLIFF COMMUNITY SANITATION PROJECT
Total initial investment: 
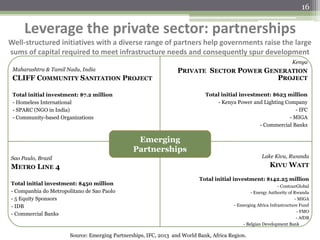
$7.2 million
- Homeless International
- SPARC (NGO in India)
- Community-based Organizations
Kenya
PRIVATE SECTOR POWER GENERATION
PROJECT
Total initial investment: $623 million
- Kenya Power and Lighting Company
- IFC
- MIGA
- Commercial Banks
Sao Paulo, Brazil
METRO LINE 4
Total initial investment: $450 million
- Companhia do Metropolitano de Sao Paolo
- 5 Equity Sponsors
- IDB
- Commercial Banks
Lake Kivu, Rwanda
KIVU WATT
Total initial investment: $142.25 million
- ContourGlobal
- Energy Authority of Rwanda
- MIGA
- Emerging Africa Infrastructure Fund
- FMO
- AfDB
- Belgian Development Bank
Source: Emerging Partnerships, IFC, 2013 and World Bank, Africa Region.
Emerging
Partnerships
17. 4%
29%
25%
13%
22%
41%
6%
14%
23%
8%
21%
24%
0%
5%
10%
15%
20%
25%
30%
35%
40%
45%
1 to 5 years 5 to 10 years 10+ years
Percent of international syndications to the private sector in developing countries
where an IFI participated, by income level and maturity, 2007-2010
Lower Lower middle Upper middle BRICT
Leverage the private sector: syndications
IFI participation in syndications contributes to extending maturities of private flows to
developing countries and therefore financing long-term productive investments
Source: International Finance Institutions and Development through the Private Sector, IFC, 2011
17
18. Key Messages
• Promote targeted policies and support accountable, efficient institutions
• Mobilize domestic resources for development through:
▫ Broader tax coverage
▫ Increased taxation capacity
▫ Greater accountability
▫ Efficient public spending
▫ Natural resource revenue
▫ Deeper domestic financial sector
▫ A more vibrant private sector
• The international community must use ODA and other resources to:
▫ Leverage more private resources
▫ Deliver global public goods
▫ Draw on emerging and innovative sources of finance
• Financial instruments have different properties and comparative advantages. Selecting
the right combination of instruments to meet a given goal, in a given country context,
might be one of the most important tasks ahead to enable full implementation of the next
development framework post-2015.
18
20. China Financed “Bottleneck-releasing” Hydropower Projects in Africa
• Particular focus on hydropower generation, roads, ports, and
railways
• 50% of all Chinese infrastructure commitments in SSA between
2001 and 2010 were on electricity
20
Editor's Notes
China has done very well in progress towards reaching the MDGs
The MDG 1a target would not have globally been met if it weren’t for the impressive work done by China
However, we are also conscious that this does not mean that everybody (whether in China or globally) is addressed, particularly the most impoverished and marginalized
.
China is also helping developing countries reach some of their development goals, especially “eradicating extreme poverty and promoting shared prosperity”.
Economists, including your own Justin Lin, tells us that building infrastructure provides a clear path to development as it facilitates addressing other developmental issues, such as reaching marginalized people and providing access to basic services and markets
China’s focus has been on Sub-Saharan Africa and has now emerged as the largest financer of infrastructure in Sub-Saharan Africa, followed by three multilateral organizations: IDA, EC, and AfDF
China alone accounts for 34% of total official financing for infrastructure in SSA, but only 3% of the number of aid projects, indicating that Chinese funded projects are much larger than projects funded from other sources