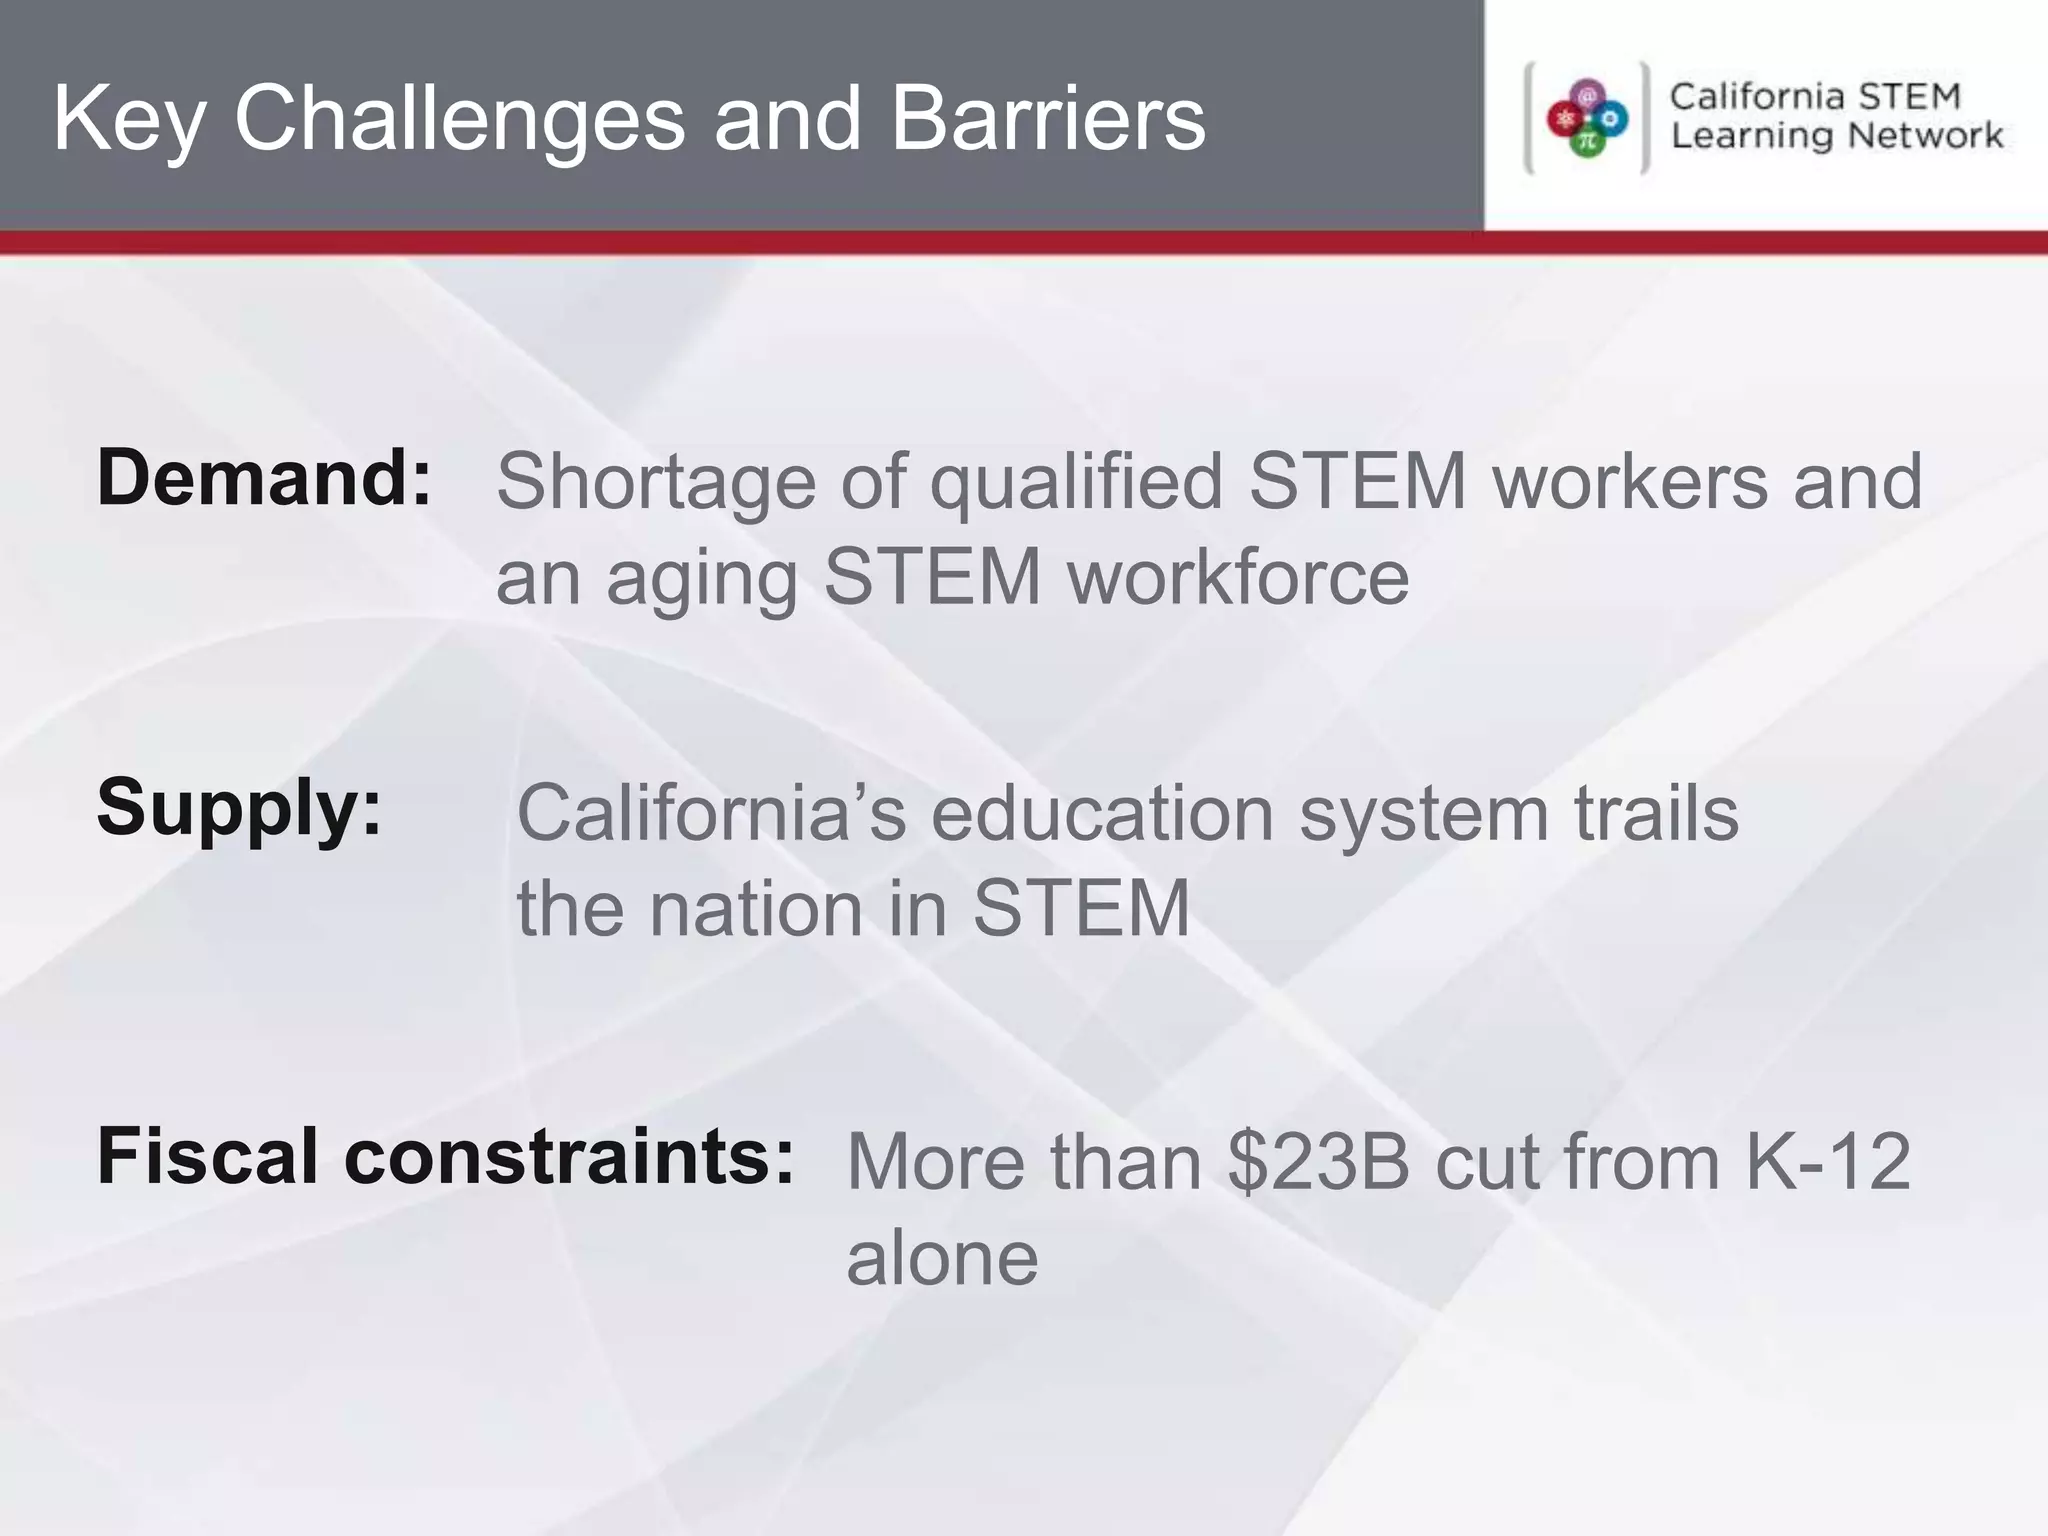
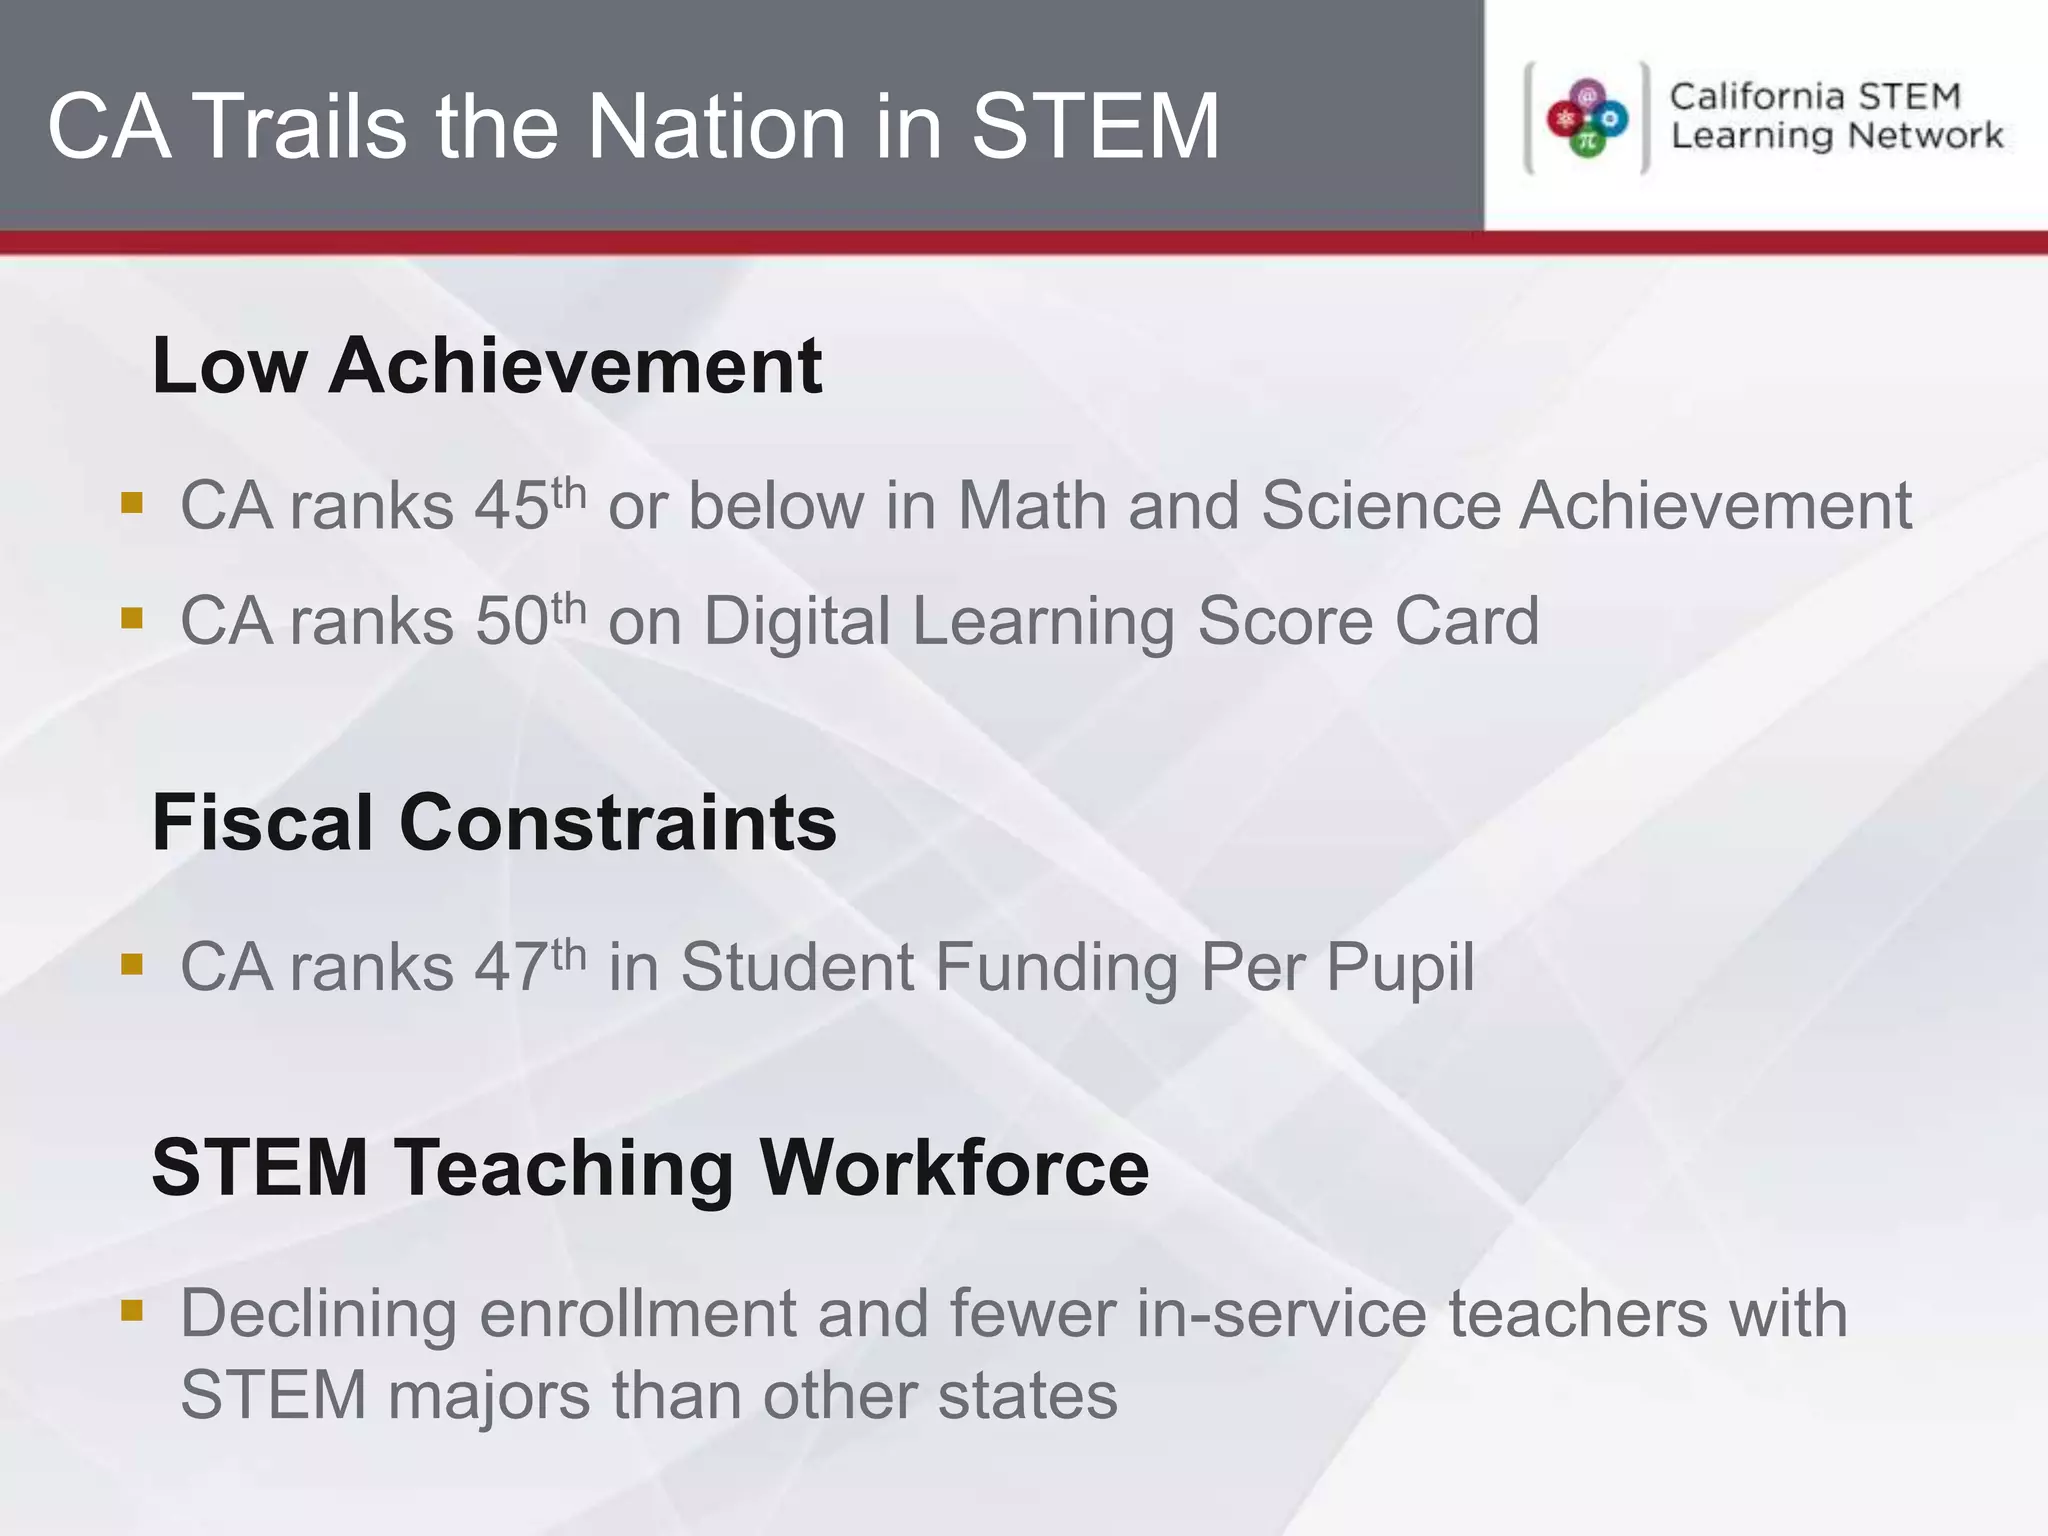
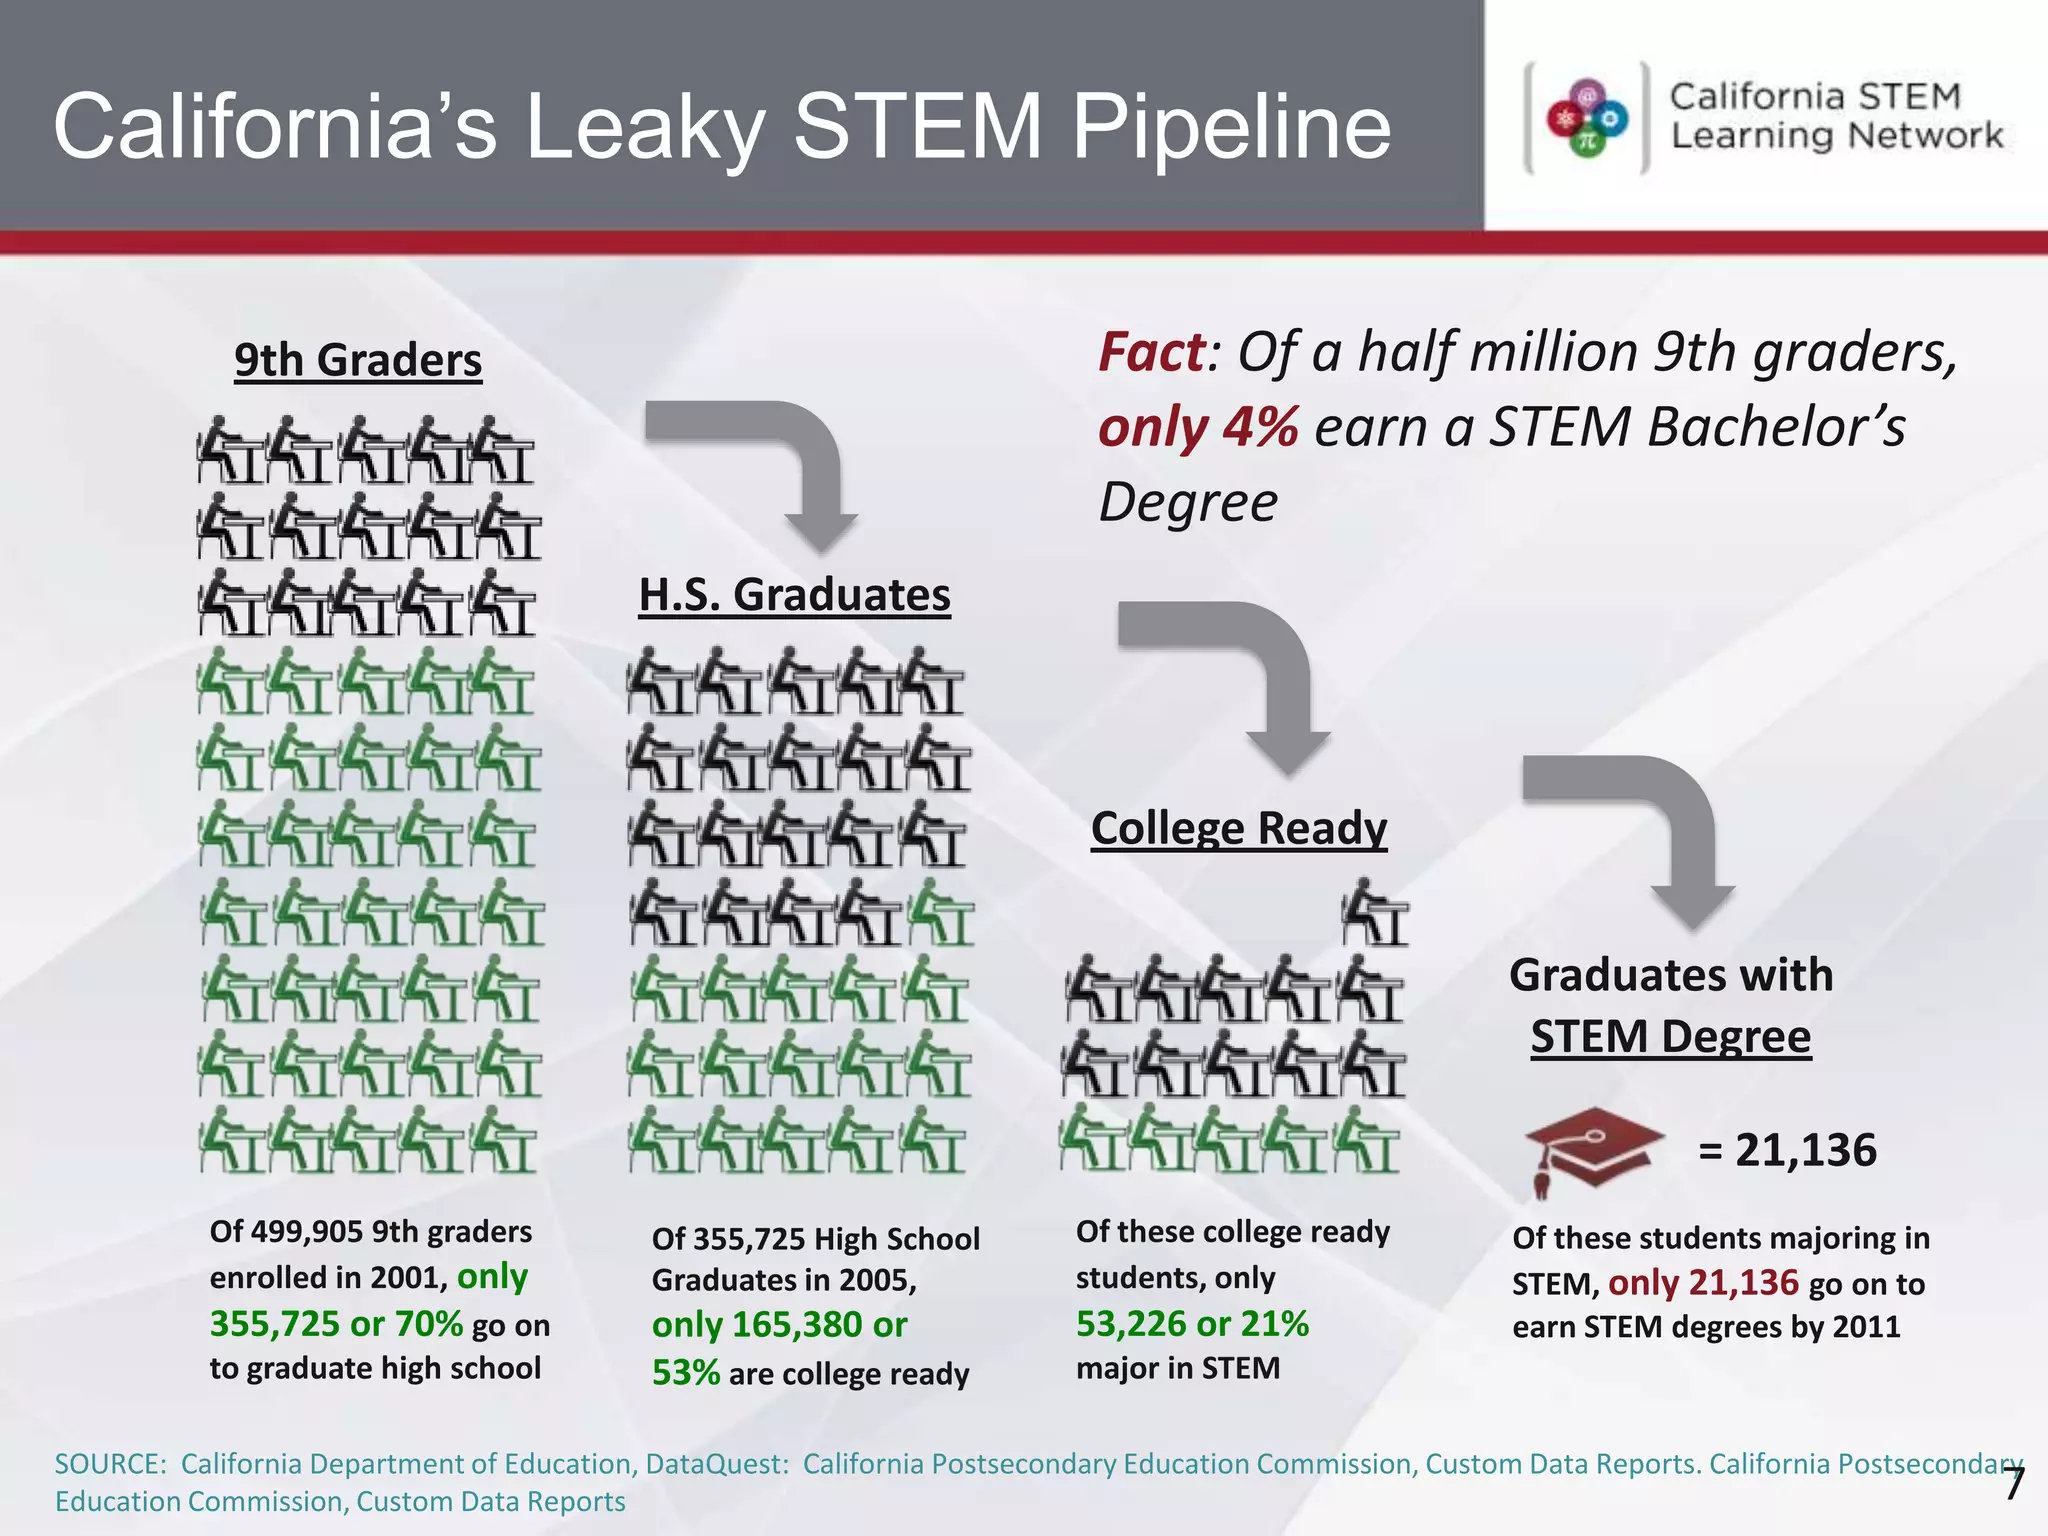
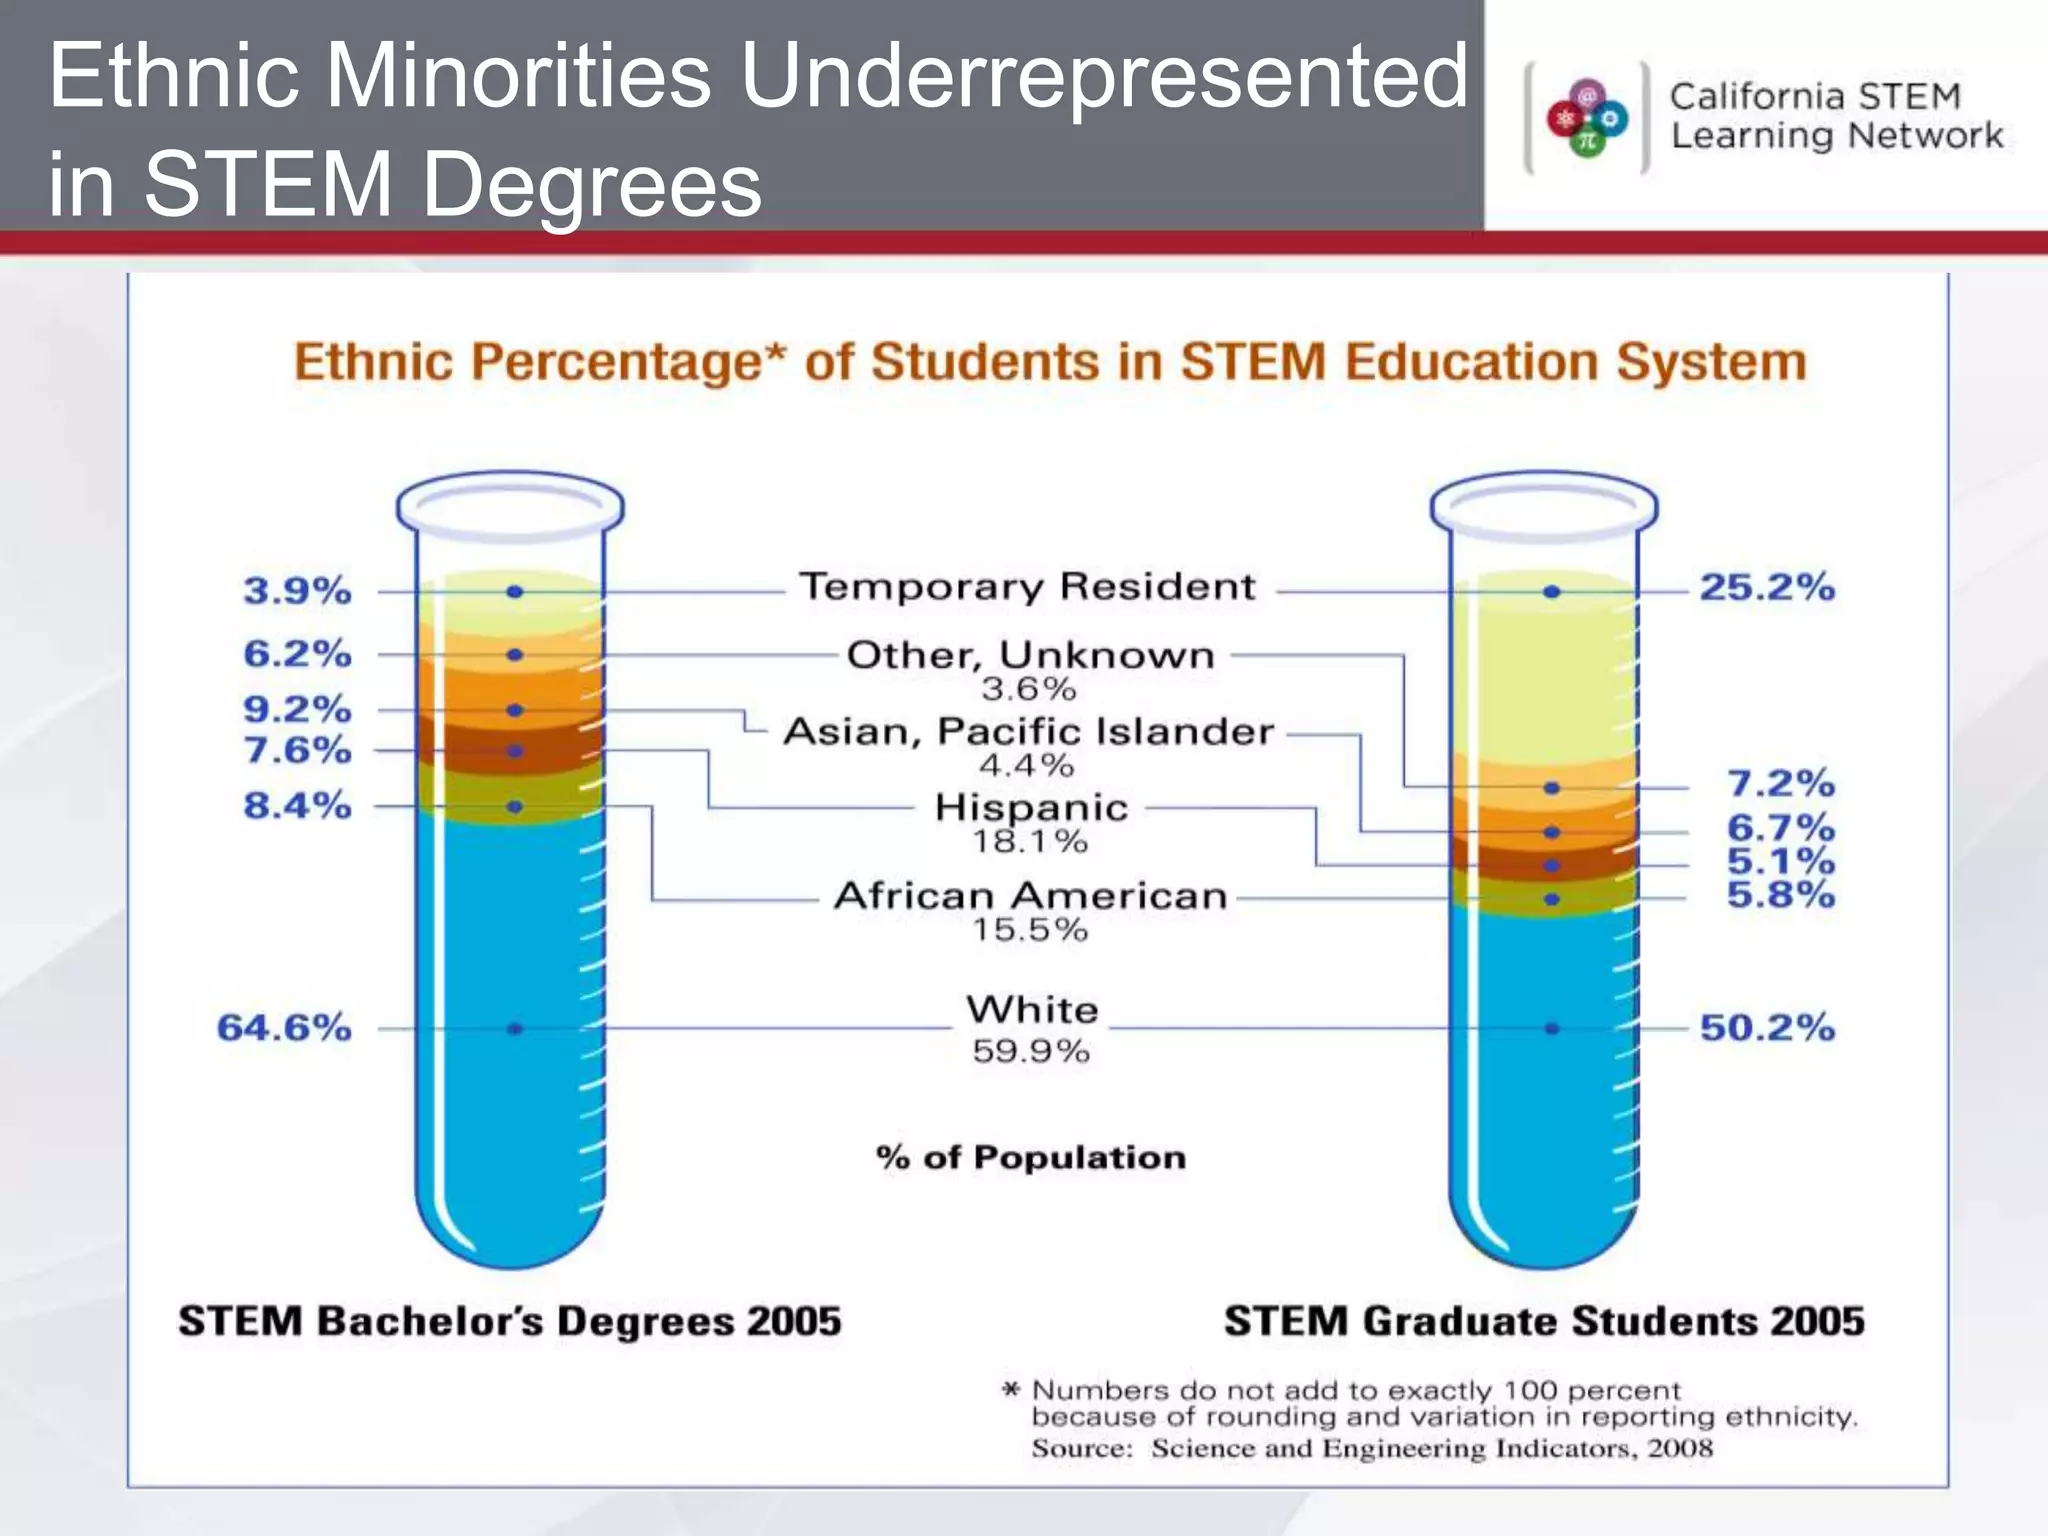
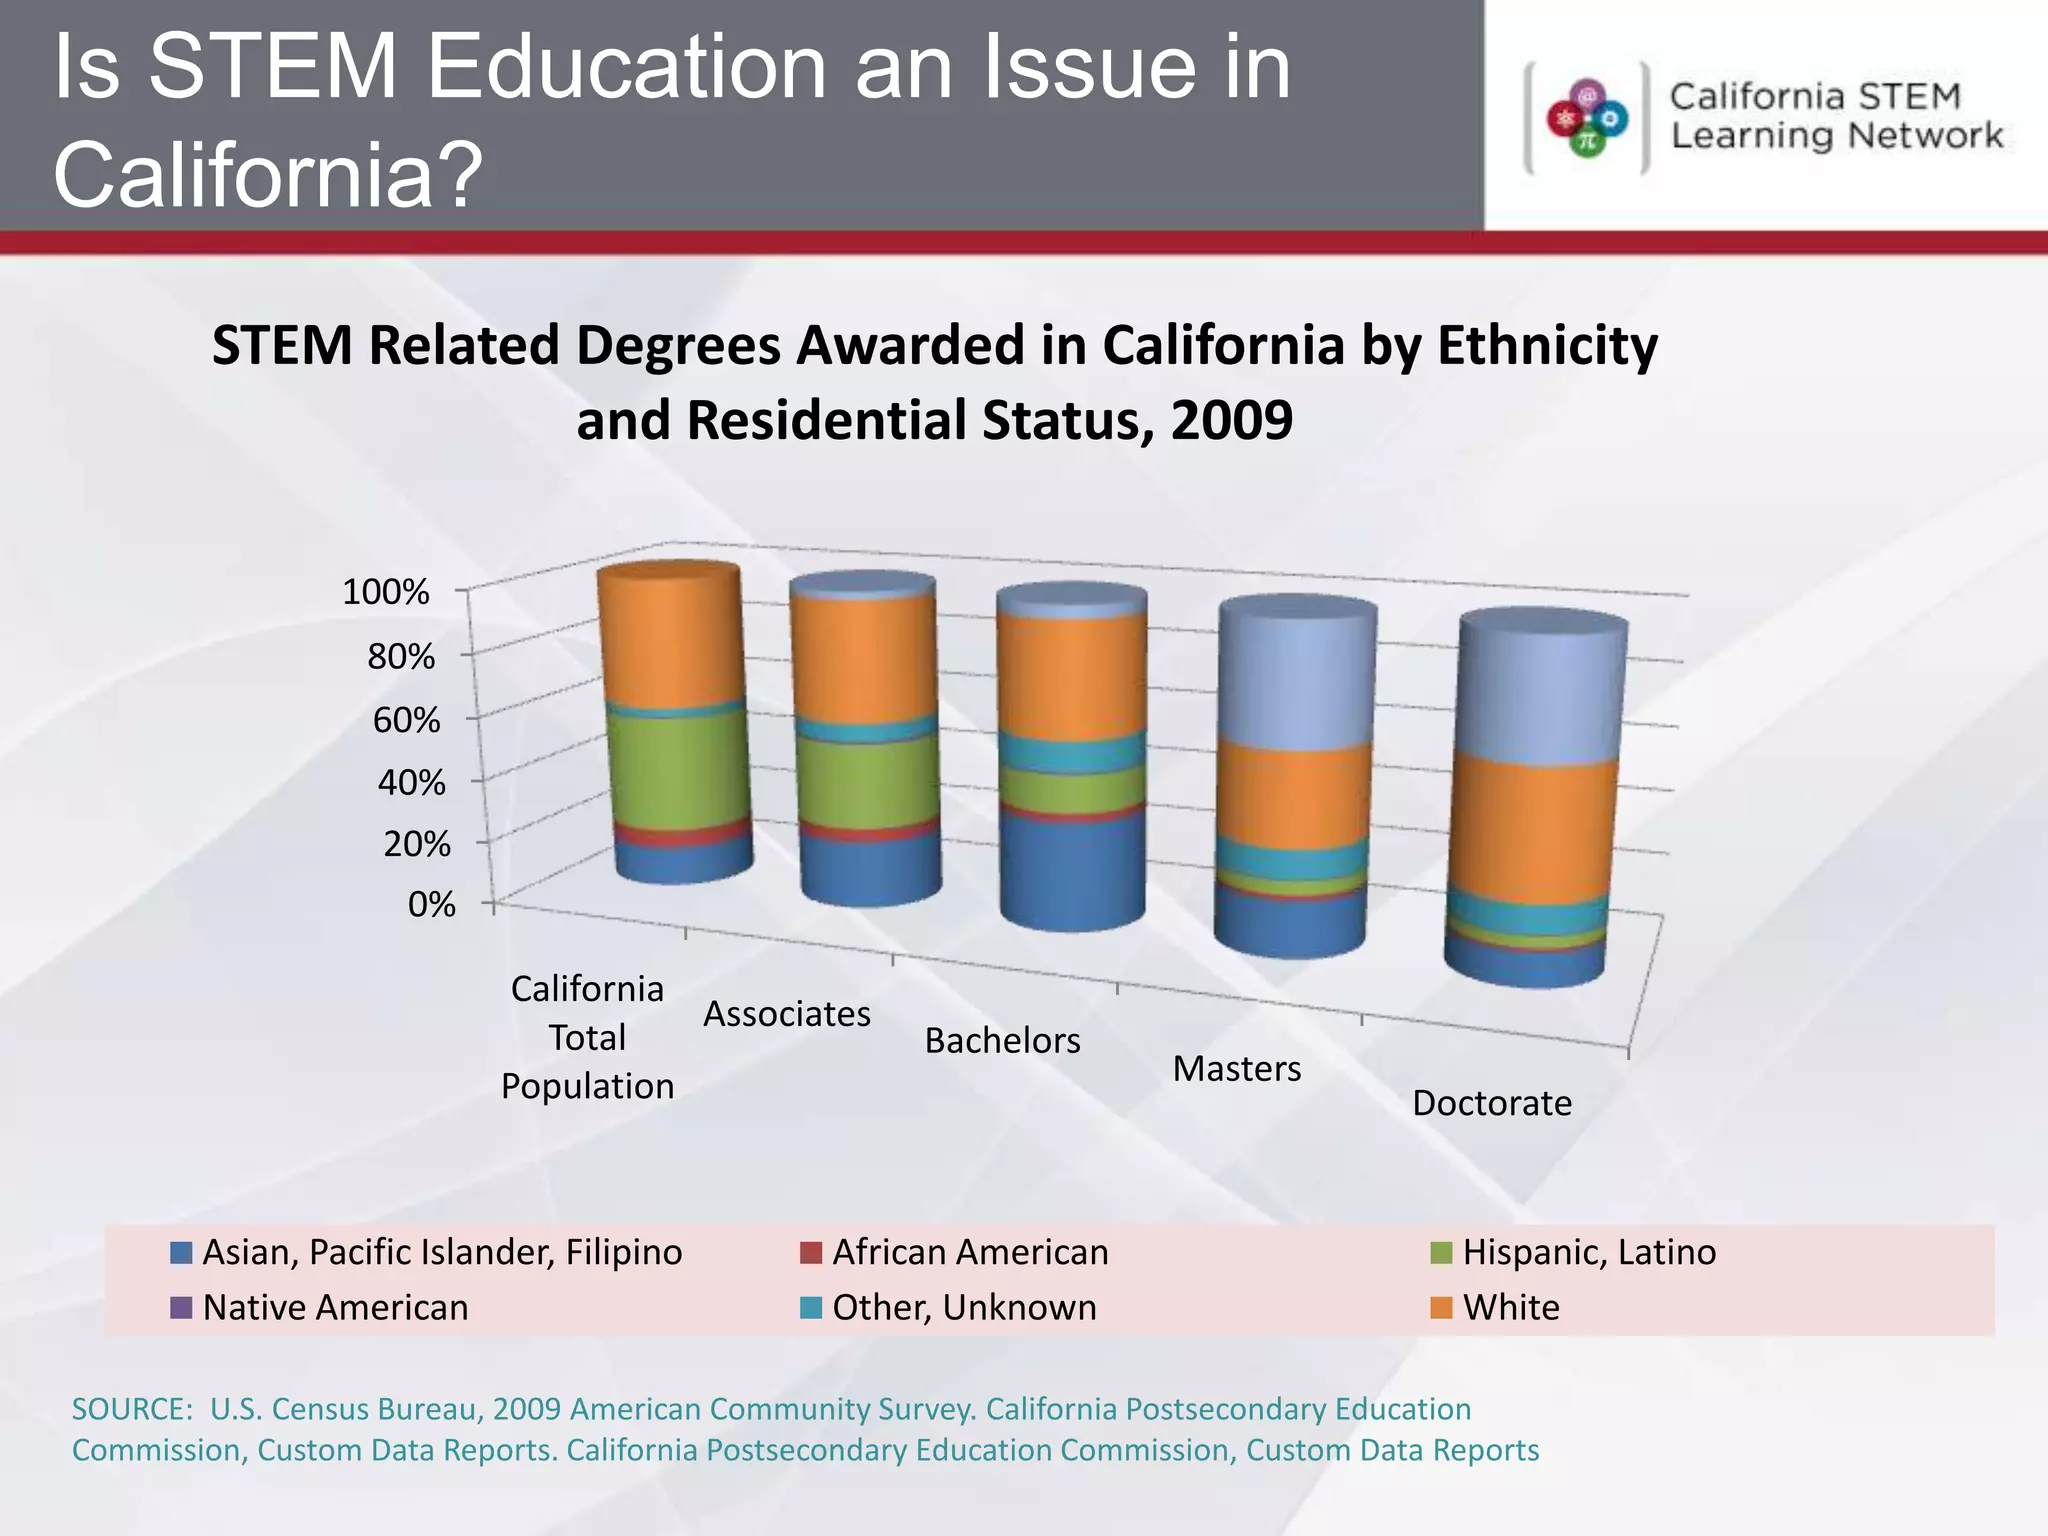
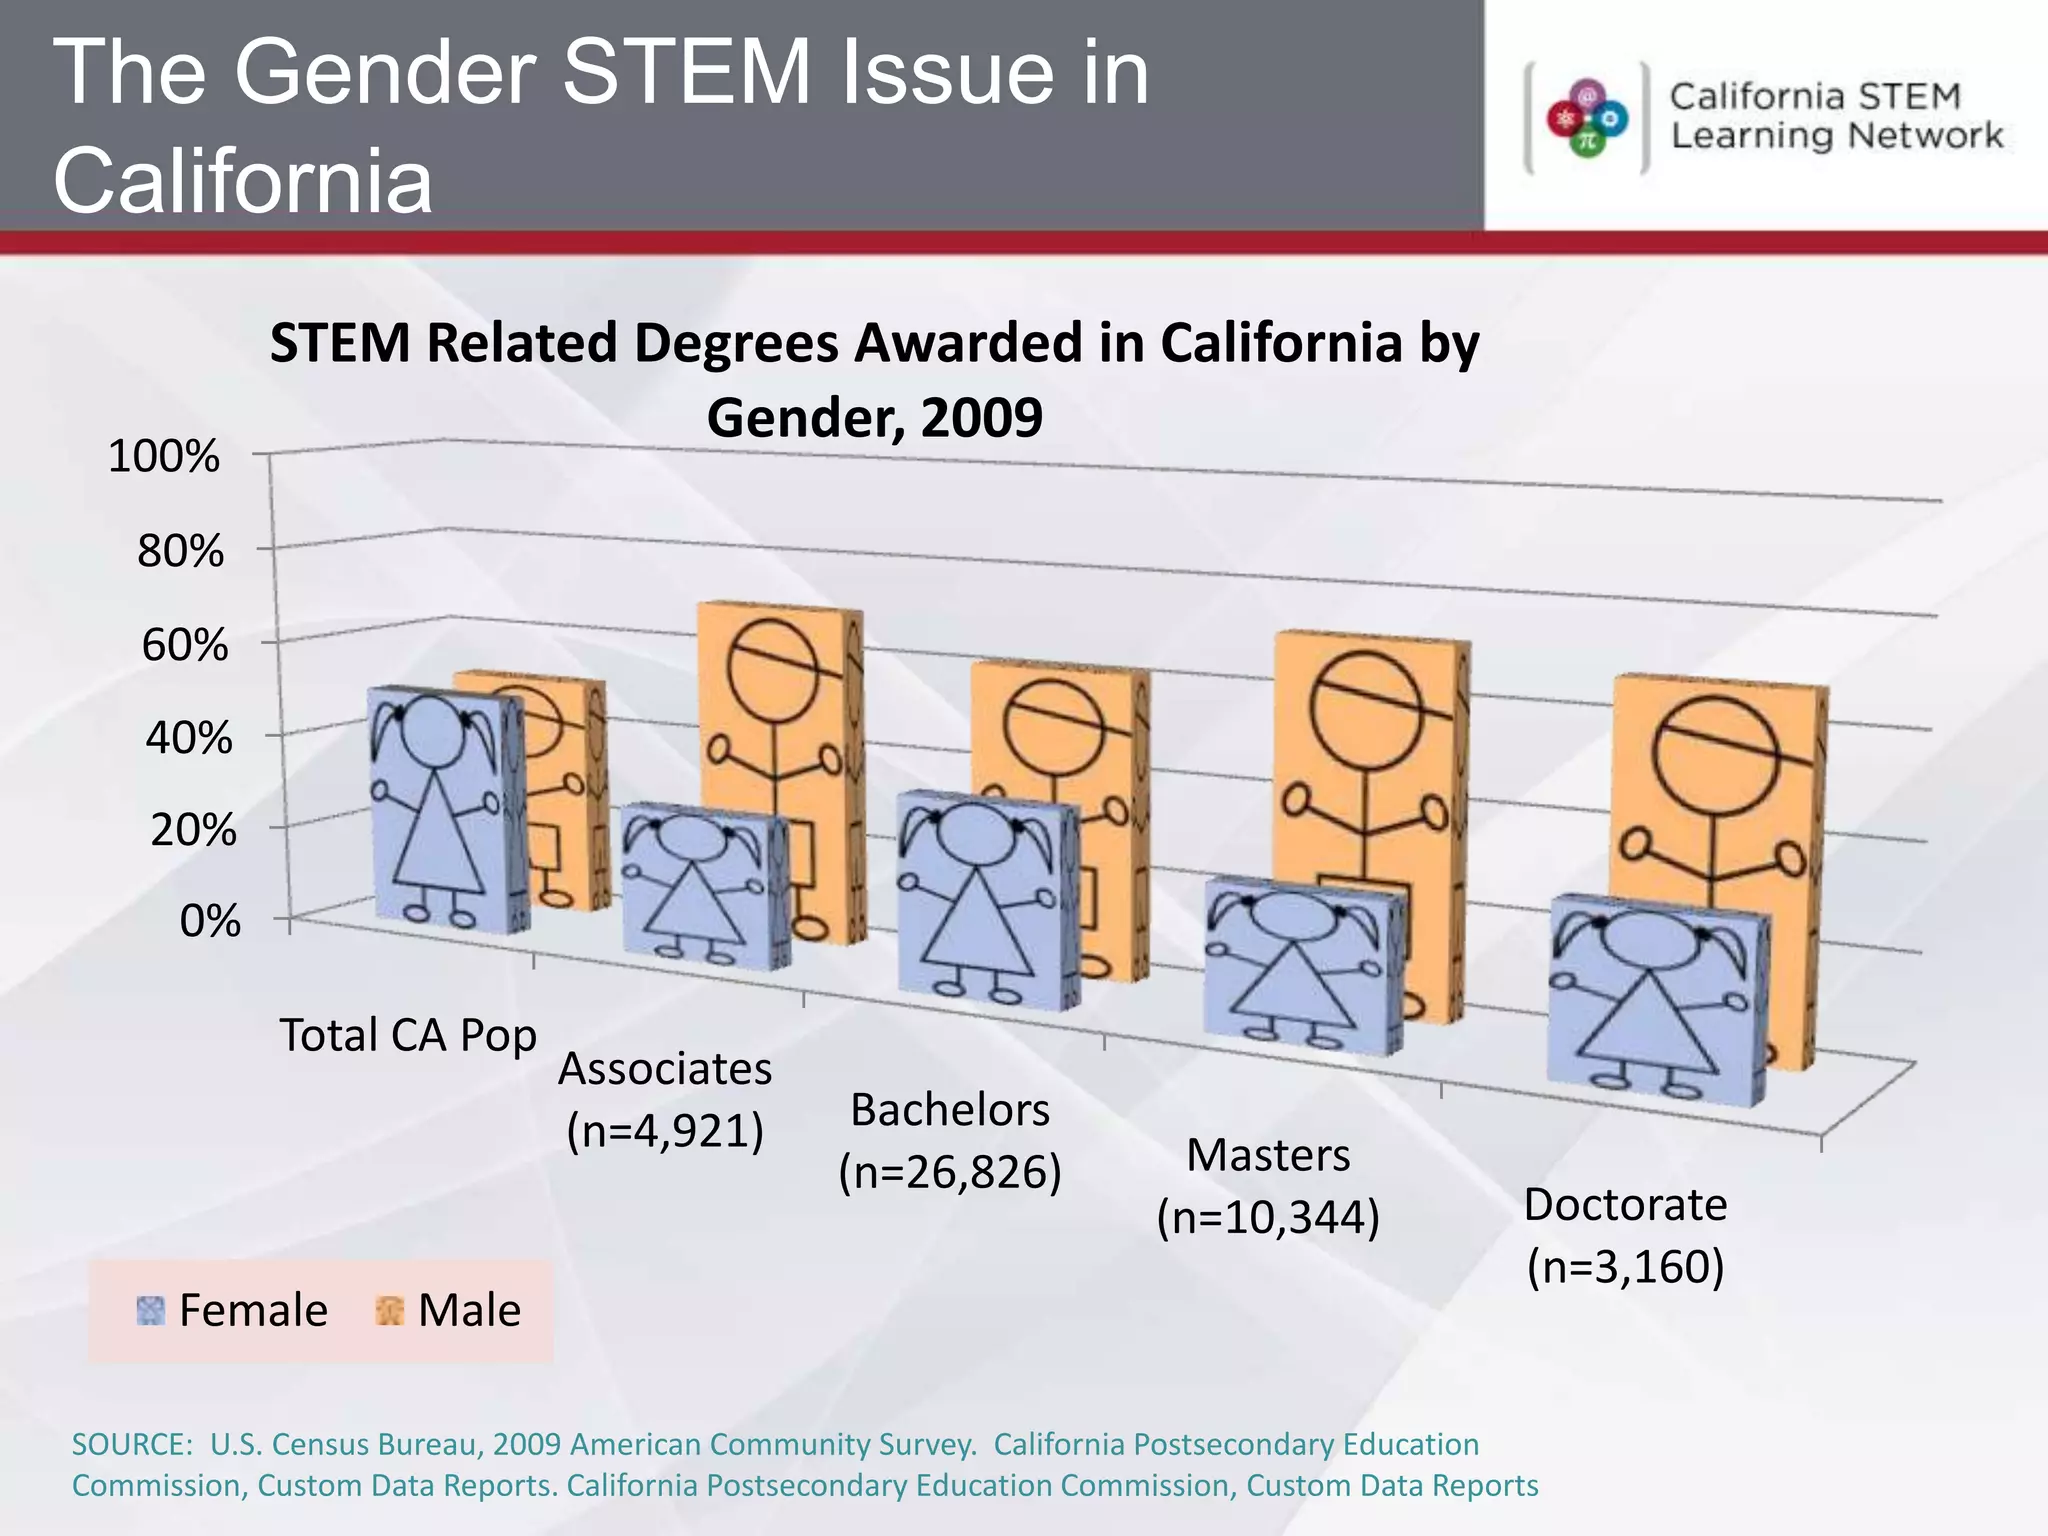
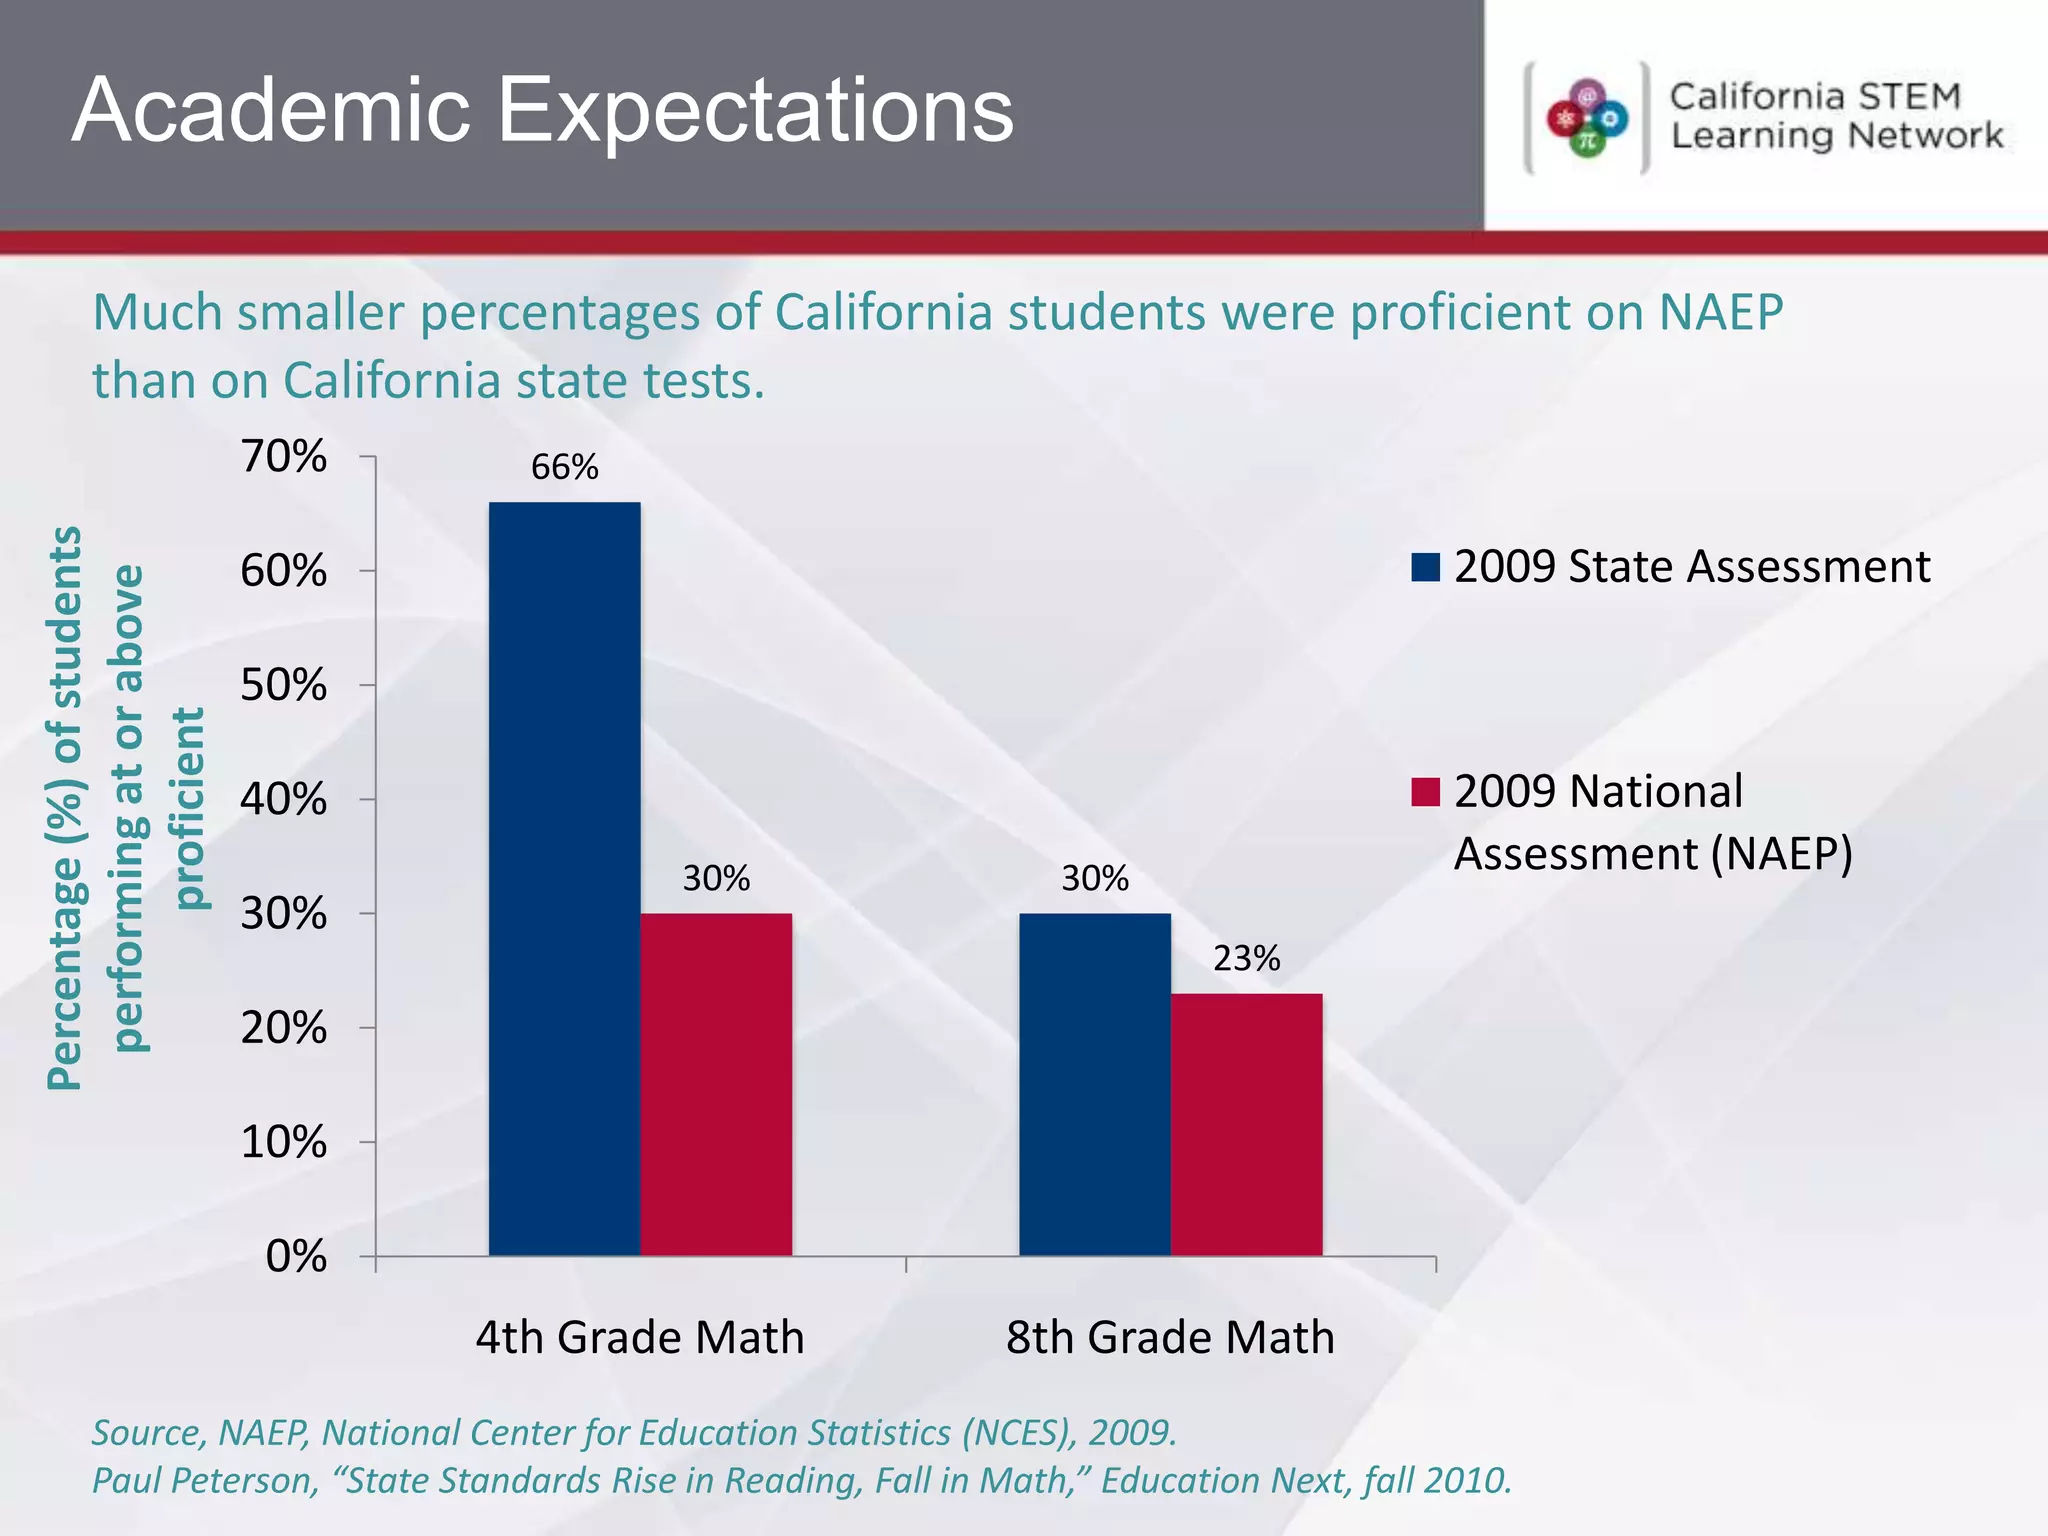
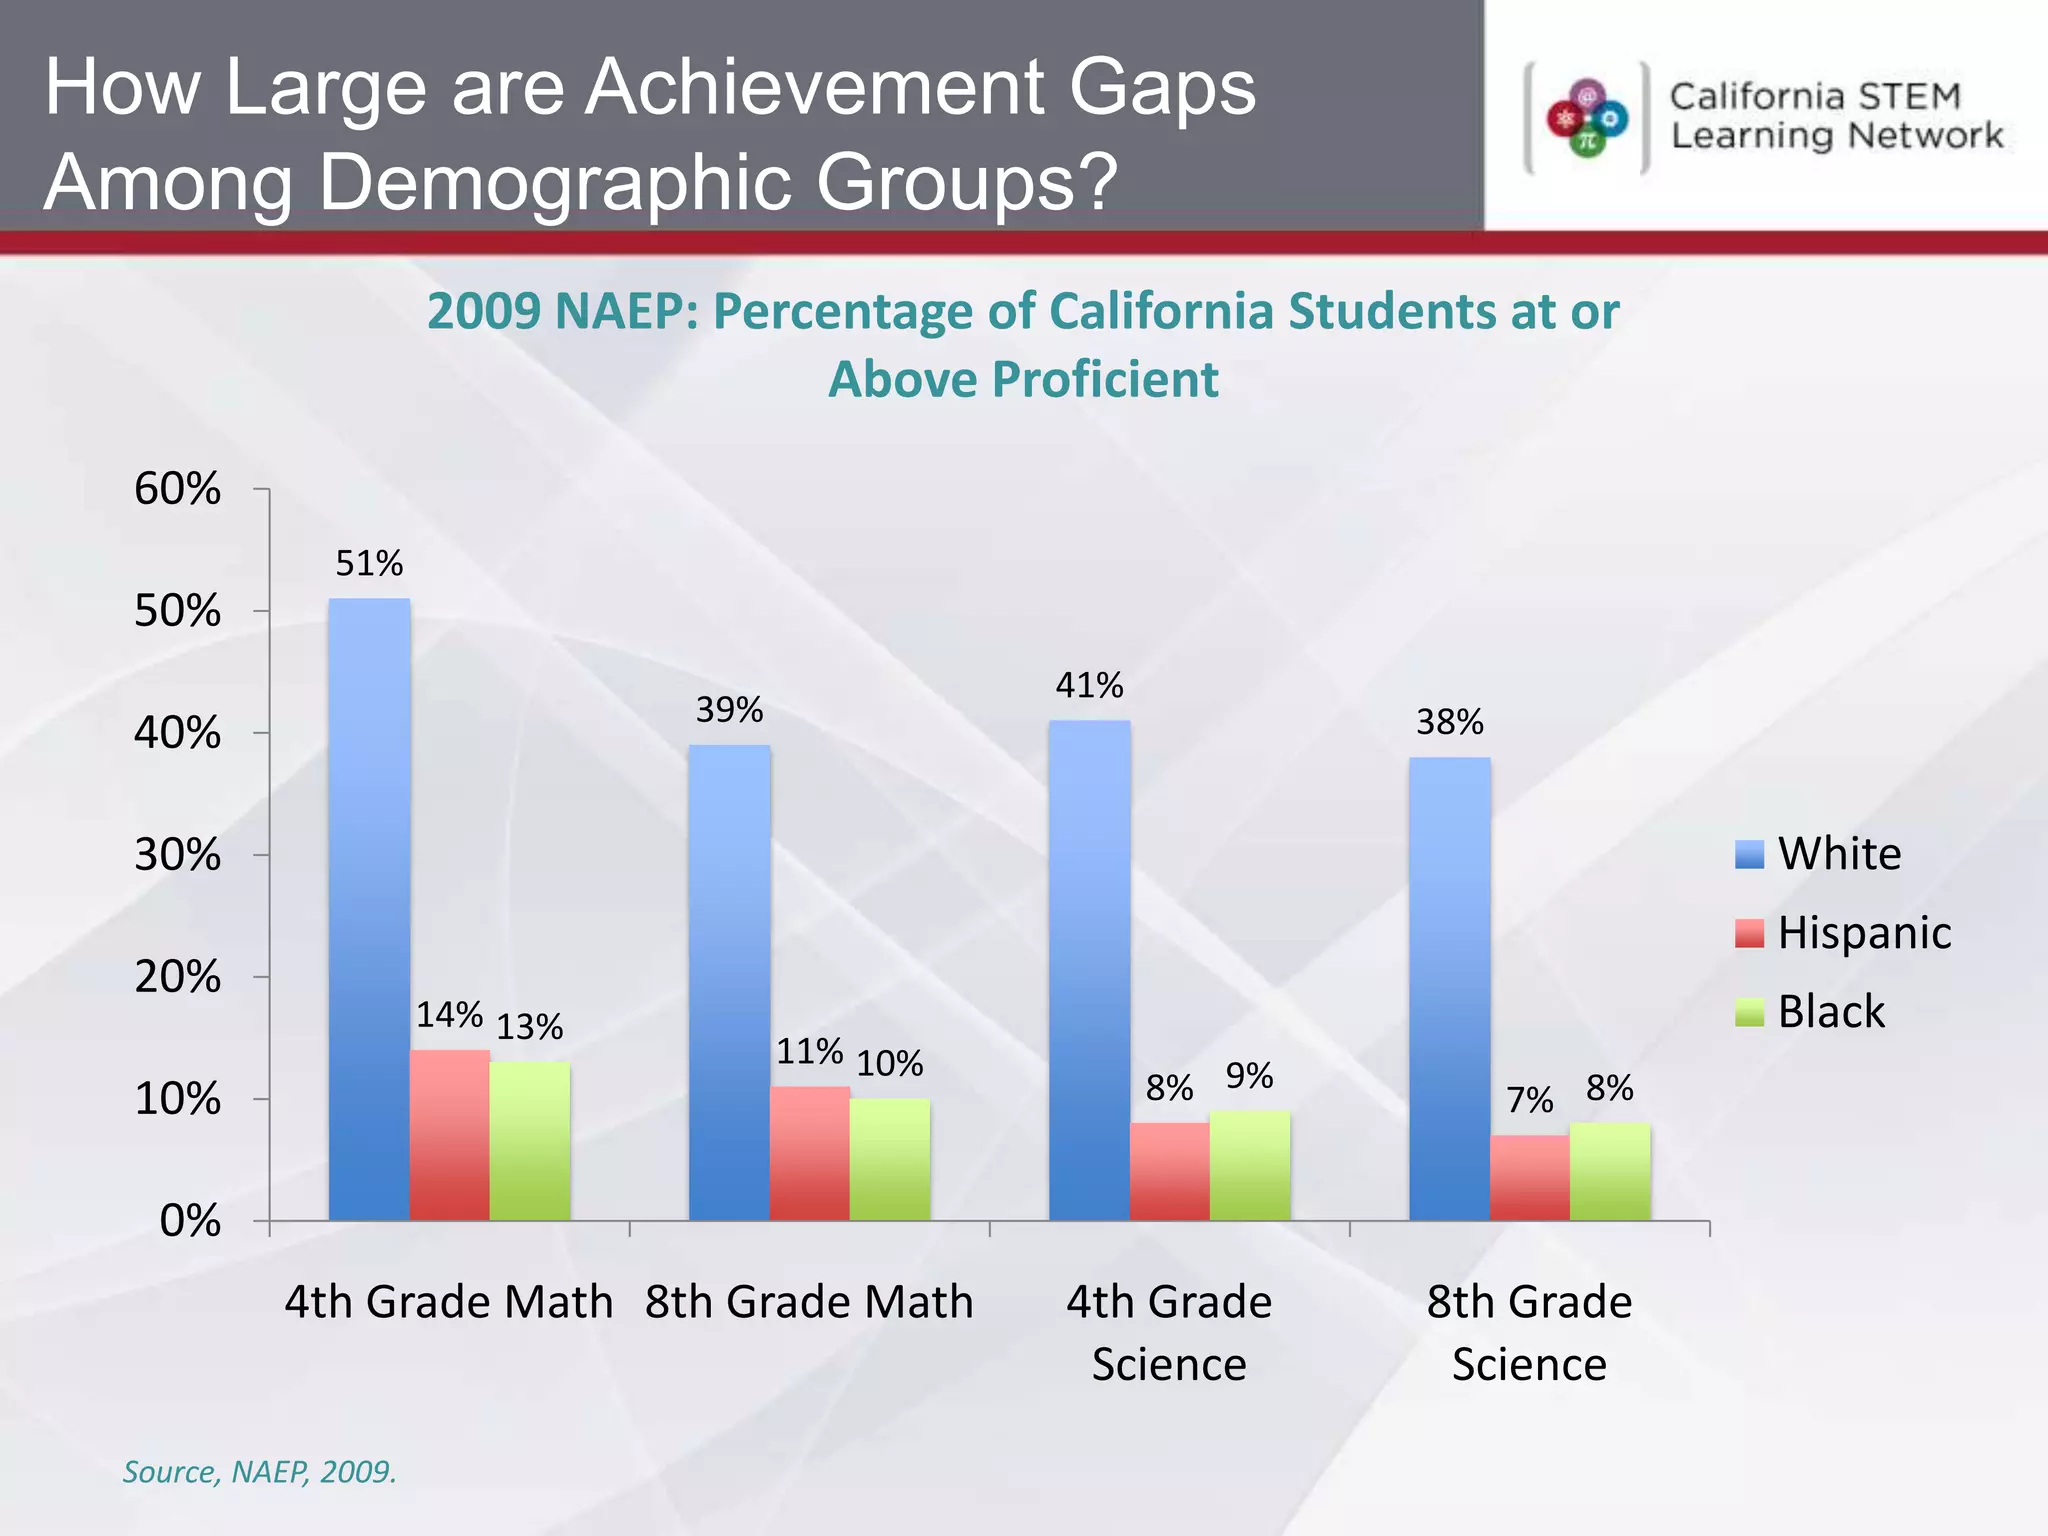
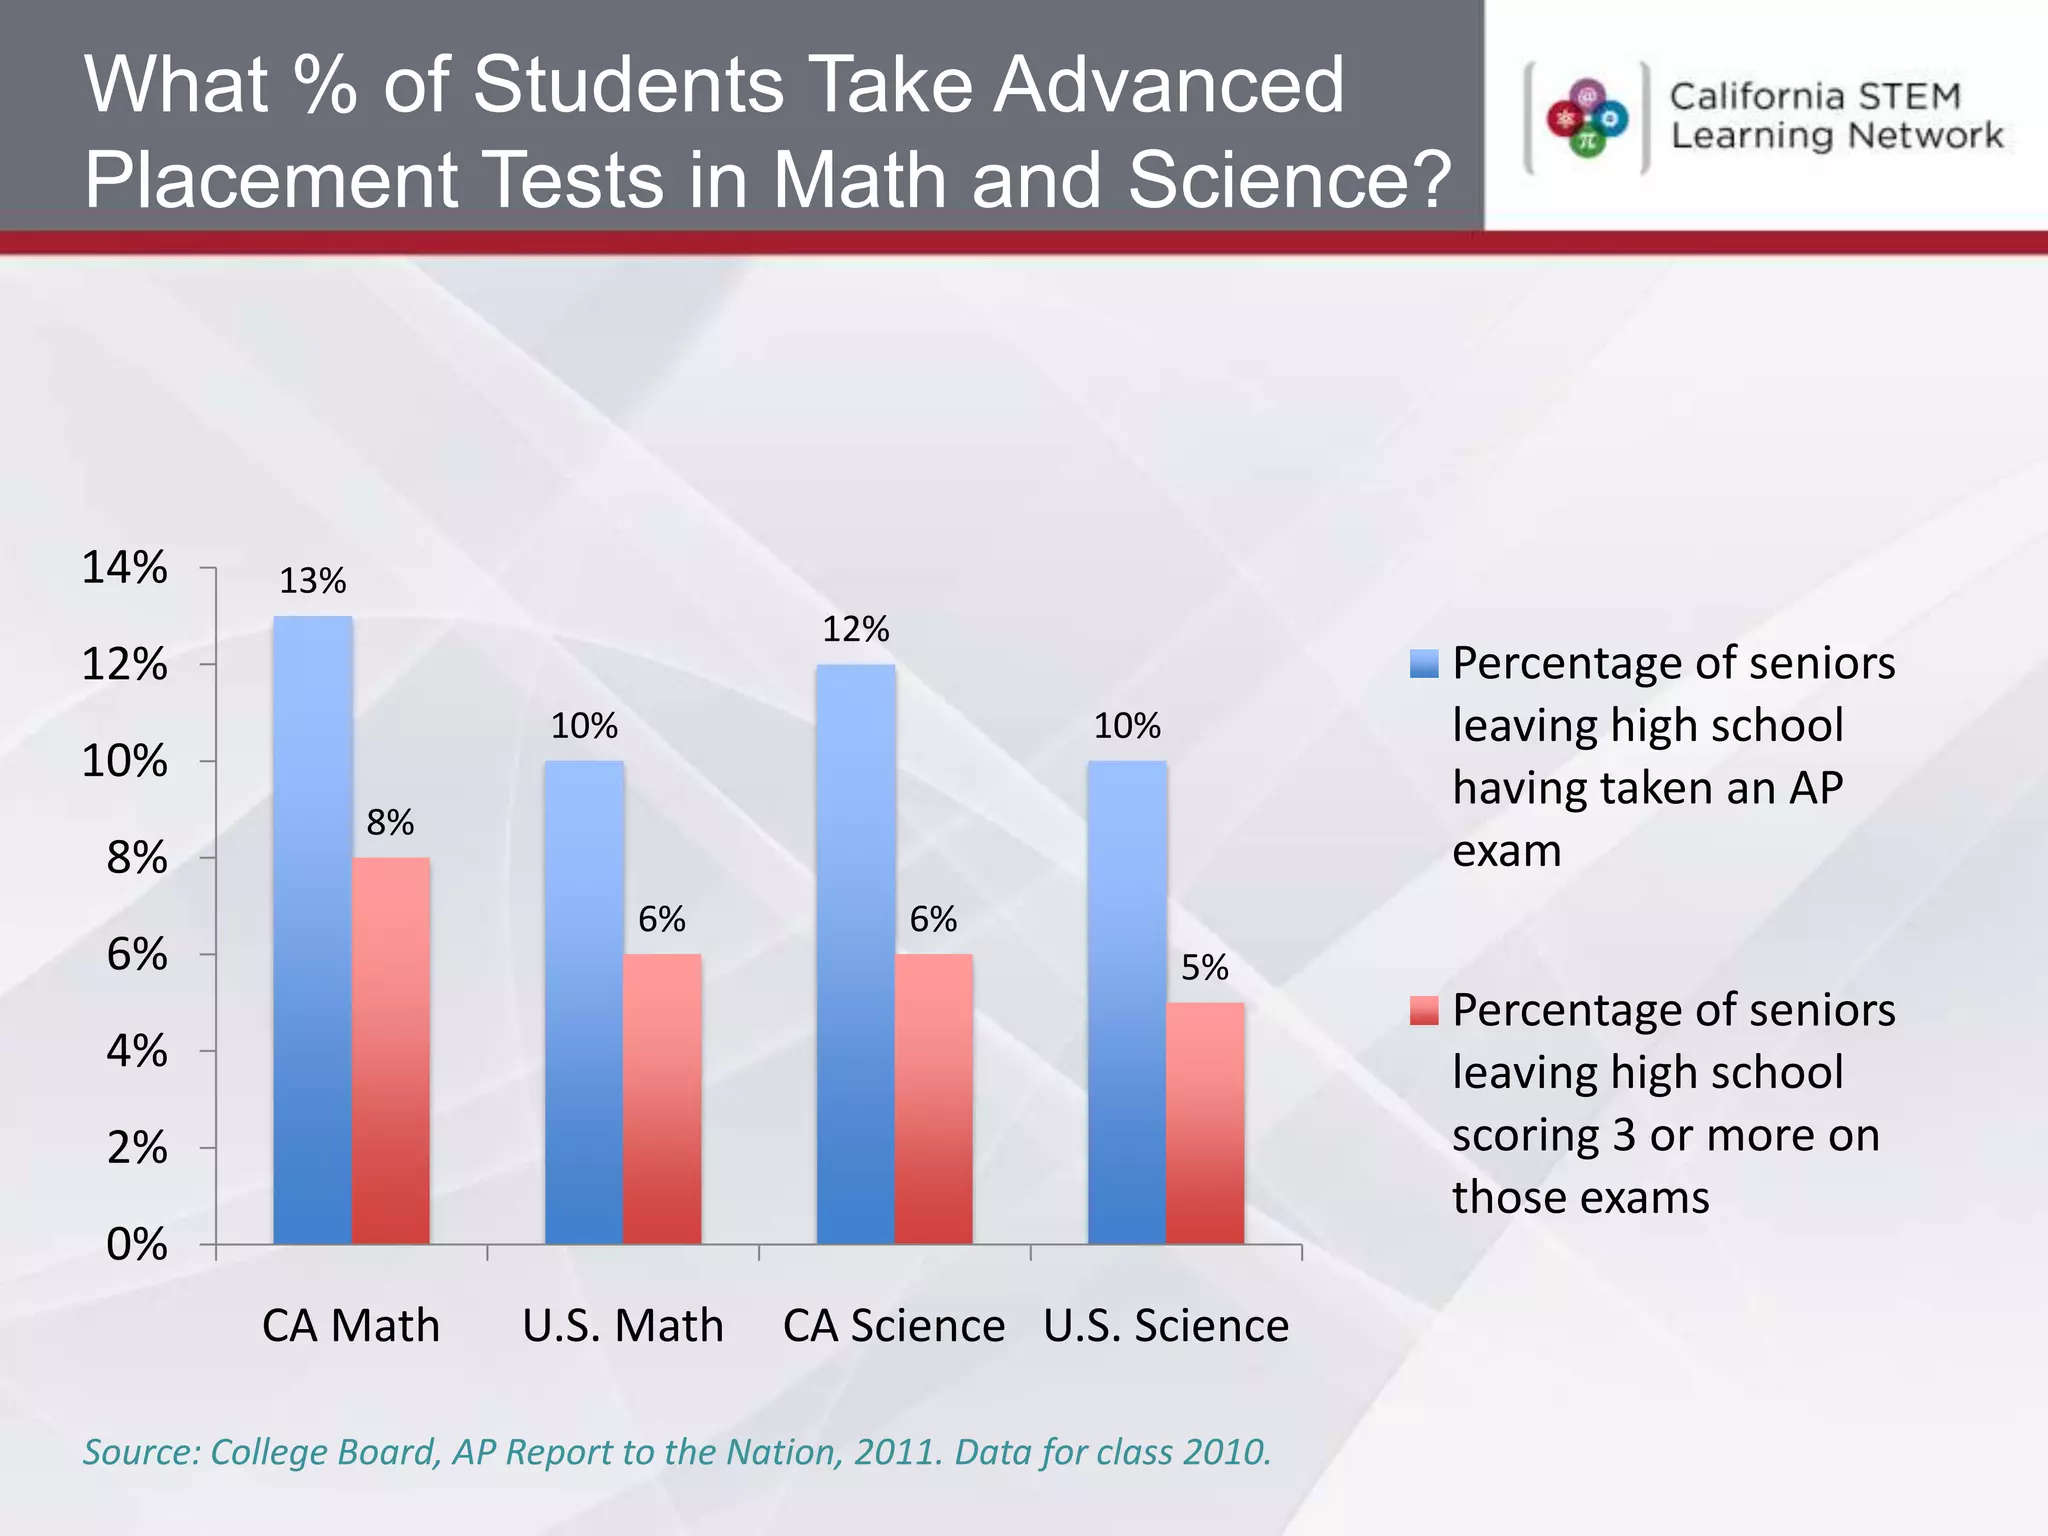
CSLNet Mission
Key Challenges and Barriers


 Demand: Shortage of qualified STEM workers and
         an aging STEM workforce

 Supply:    California’s education system trails
            the nation in STEM


 Fiscal constraints: More than $23B cut from K-12
                     alone
CA Trails the Nation in STEM

  Low Achievement
  CA ranks 45th or below in Math and Science Achievement
  CA ranks 50th on Digital Learning Score Card

  Fiscal Constraints
  CA ranks 47th in Student Funding Per Pupil

  STEM Teaching Workforce
  Declining enrollment and fewer in-service teachers with
   STEM majors than other states
California’s Leaky STEM Pipeline

             9th Graders                                                     Fact: Of a half million 9th graders,
                                                                             only 4% earn a STEM Bachelor’s
                                                                             Degree
                                           H.S. Graduates


                                                                             College Ready

                                                                                                            Graduates with
                                                                                                             STEM Degree

                                                                                                                          = 21,136
           Of 499,905 9th graders           Of 355,725 High School          Of these college ready          Of these students majoring in
           enrolled in 2001, only           Graduates in 2005,              students, only                  STEM, only 21,136 go on to
           355,725 or 70% go on             only 165,380 or                 53,226 or 21%                   earn STEM degrees by 2011
           to graduate high school          53% are college ready           major in STEM

SOURCE: California Department of Education, DataQuest: California Postsecondary Education Commission, Custom Data Reports. California Postsecondary
Education Commission, Custom Data Reports                                                                                                        7
Ethnic Minorities Underrepresented
in STEM Degrees
Is STEM Education an Issue in
California?
         STEM Related Degrees Awarded in California by Ethnicity
                      and Residential Status, 2009

                  100%
                   80%
                    60%
                    40%
                    20%
                      0%

                             California
                                        Associates
                               Total                     Bachelors
                            Population                                    Masters
                                                                                          Doctorate


        Asian, Pacific Islander, Filipino          African American                          Hispanic, Latino
        Native American                            Other, Unknown                            White

SOURCE: U.S. Census Bureau, 2009 American Community Survey. California Postsecondary Education
Commission, Custom Data Reports. California Postsecondary Education Commission, Custom Data Reports
The Gender STEM Issue in
California
             STEM Related Degrees Awarded in California by
                            Gender, 2009
  100%
    80%
    60%
    40%
     20%
       0%

             Total CA Pop
                                Associates
                                (n=4,921)           Bachelors
                                                   (n=26,826)              Masters
                                                                         (n=10,344)              Doctorate
                                                                                                 (n=3,160)
       Female          Male

SOURCE: U.S. Census Bureau, 2009 American Community Survey. California Postsecondary Education
Commission, Custom Data Reports. California Postsecondary Education Commission, Custom Data Reports
Relationship Between STEM
Education & California’s Economy
         As California’s economy is becoming more knowledge-
          based, STEM employment is increasing at a faster rate
          than non-STEM employment
         Between 1999-2007,
          o STEM employment increased by 25%
          o Non-STEM employment increased by only 16%

SOURCE: The Campaign for College Opportunity. Technical Difficulties: Meeting California’s Workforce Needs in
Science, Technology, Engineering, and Math (STEM) Fields Executive Summary. (2009)
Academic Expectations

       Much smaller percentages of California students were proficient on NAEP
       than on California state tests.
                             70%     66%
Percentage (%) of students


                             60%                                                             2009 State Assessment
 performing at or above


                             50%
        proficient


                             40%                                                             2009 National
                                            30%                     30%
                                                                                             Assessment (NAEP)
                             30%
                                                                             23%
                             20%

                             10%

                             0%
                                   4th Grade Math               8th Grade Math
       Source, NAEP, National Center for Education Statistics (NCES), 2009.
       Paul Peterson, “State Standards Rise in Reading, Fall in Math,” Education Next, fall 2010.
How Large are Achievement Gaps
Among Demographic Groups?
                       2009 NAEP: Percentage of California Students at or
                                      Above Proficient
  60%
               51%
  50%
                                                  41%
                                  39%                           38%
  40%

  30%                                                                         White
                                                                              Hispanic
  20%
                       14% 13%                                                Black
                                        11% 10%
  10%                                                   8% 9%         7% 8%


   0%
            4th Grade Math 8th Grade Math         4th Grade     8th Grade
                                                   Science       Science
 Source, NAEP, 2009.
What % of Students Take Advanced
Placement Tests in Math and Science?


14%         13%
                                             12%
12%                                                                          Percentage of seniors
                             10%                              10%            leaving high school
10%
                                                                             having taken an AP
                  8%
 8%                                                                          exam
                                   6%              6%
 6%                                                                 5%
                                                                             Percentage of seniors
 4%                                                                          leaving high school
 2%                                                                          scoring 3 or more on
                                                                             those exams
 0%
           CA Math         U.S. Math       CA Science U.S. Science

Source: College Board, AP Report to the Nation, 2011. Data for class 2010.

The STEM Challenge

  • 1.
  • 2.
    Key Challenges andBarriers Demand: Shortage of qualified STEM workers and an aging STEM workforce Supply: California’s education system trails the nation in STEM Fiscal constraints: More than $23B cut from K-12 alone
  • 3.
    CA Trails theNation in STEM Low Achievement  CA ranks 45th or below in Math and Science Achievement  CA ranks 50th on Digital Learning Score Card Fiscal Constraints  CA ranks 47th in Student Funding Per Pupil STEM Teaching Workforce  Declining enrollment and fewer in-service teachers with STEM majors than other states
  • 4.
    California’s Leaky STEMPipeline 9th Graders Fact: Of a half million 9th graders, only 4% earn a STEM Bachelor’s Degree H.S. Graduates College Ready Graduates with STEM Degree = 21,136 Of 499,905 9th graders Of 355,725 High School Of these college ready Of these students majoring in enrolled in 2001, only Graduates in 2005, students, only STEM, only 21,136 go on to 355,725 or 70% go on only 165,380 or 53,226 or 21% earn STEM degrees by 2011 to graduate high school 53% are college ready major in STEM SOURCE: California Department of Education, DataQuest: California Postsecondary Education Commission, Custom Data Reports. California Postsecondary Education Commission, Custom Data Reports 7
  • 5.
  • 6.
    Is STEM Educationan Issue in California? STEM Related Degrees Awarded in California by Ethnicity and Residential Status, 2009 100% 80% 60% 40% 20% 0% California Associates Total Bachelors Population Masters Doctorate Asian, Pacific Islander, Filipino African American Hispanic, Latino Native American Other, Unknown White SOURCE: U.S. Census Bureau, 2009 American Community Survey. California Postsecondary Education Commission, Custom Data Reports. California Postsecondary Education Commission, Custom Data Reports
  • 7.
    The Gender STEMIssue in California STEM Related Degrees Awarded in California by Gender, 2009 100% 80% 60% 40% 20% 0% Total CA Pop Associates (n=4,921) Bachelors (n=26,826) Masters (n=10,344) Doctorate (n=3,160) Female Male SOURCE: U.S. Census Bureau, 2009 American Community Survey. California Postsecondary Education Commission, Custom Data Reports. California Postsecondary Education Commission, Custom Data Reports
  • 8.
    Relationship Between STEM Education& California’s Economy  As California’s economy is becoming more knowledge- based, STEM employment is increasing at a faster rate than non-STEM employment  Between 1999-2007, o STEM employment increased by 25% o Non-STEM employment increased by only 16% SOURCE: The Campaign for College Opportunity. Technical Difficulties: Meeting California’s Workforce Needs in Science, Technology, Engineering, and Math (STEM) Fields Executive Summary. (2009)
  • 9.
    Academic Expectations Much smaller percentages of California students were proficient on NAEP than on California state tests. 70% 66% Percentage (%) of students 60% 2009 State Assessment performing at or above 50% proficient 40% 2009 National 30% 30% Assessment (NAEP) 30% 23% 20% 10% 0% 4th Grade Math 8th Grade Math Source, NAEP, National Center for Education Statistics (NCES), 2009. Paul Peterson, “State Standards Rise in Reading, Fall in Math,” Education Next, fall 2010.
  • 10.
    How Large areAchievement Gaps Among Demographic Groups? 2009 NAEP: Percentage of California Students at or Above Proficient 60% 51% 50% 41% 39% 38% 40% 30% White Hispanic 20% 14% 13% Black 11% 10% 10% 8% 9% 7% 8% 0% 4th Grade Math 8th Grade Math 4th Grade 8th Grade Science Science Source, NAEP, 2009.
  • 11.
    What % ofStudents Take Advanced Placement Tests in Math and Science? 14% 13% 12% 12% Percentage of seniors 10% 10% leaving high school 10% having taken an AP 8% 8% exam 6% 6% 6% 5% Percentage of seniors 4% leaving high school 2% scoring 3 or more on those exams 0% CA Math U.S. Math CA Science U.S. Science Source: College Board, AP Report to the Nation, 2011. Data for class 2010.

Editor's Notes

  • #4 ADDITIONAL NOTE: STEM IS MORE THAN JUST SCIENCE & MATH - RECENT DIGITAL LEARNING NOW SCORECARD RANKED CA 50TH, DESPITE HAVING THE WORLD’S LEADING TECHNOLOGY ECOSYSTEMSO WHAT IS CSLNET FOCUSING ON TO ADDRESS THESE MASSIVE CHALLENGES?