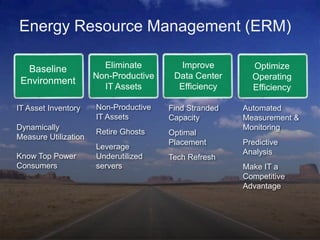
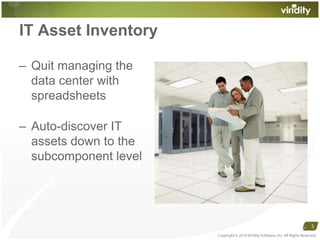
Copyright © 2010 Viridity Software, Inc. All Rights Reserved The Road ToData Center Efficiency
Energy Center connects equipment utilization and business value to power consumptionTime-to-value in hours, not monthsDeploys in minutes, not weeksNo additional hardware requiredNo server agents required Copyright © 2010 Viridity Software, Inc. All Rights Reserved 2The Leader in EnergyResource Management
Energy Resource Management (ERM)Eliminate Non-Productive IT AssetsImproveData CenterEfficiencyOptimizeOperating EfficiencyBaseline EnvironmentNon-Productive IT AssetsRetire GhostsLeverage Underutilized serversIT Asset InventoryDynamically Measure UtilizationKnow Top PowerConsumersFind Stranded CapacityOptimal PlacementTech RefreshAutomated Measurement & MonitoringPredictive AnalysisMake IT a Competitive AdvantageSource: Forrester “Five Data Center Efficiency Moves To Make Today”
Copyright © 2010 Viridity Software, Inc. All Rights Reserved BaselineEnvironment
IT Asset InventoryQuit managing thedata center withspreadsheetsAuto-discover ITassets down to thesubcomponent levelCopyright © 2010 Viridity Software, Inc. All Rights Reserved 5
Dynamically Measure UtilizationTrend powerusage and utilization over timeEliminate snapshots that gather point in time dataCopyright © 2010 Viridity Software, Inc. All Rights Reserved 6EnergyCenter: Power Utilization Profile
Know Top Power ConsumersCopyright © 2010 Viridity Software, Inc. All Rights Reserved 7Identify equipment in the data center using the most powerMap power consumption to utilizationEnergyCenter: Top Power Consumers
Copyright © 2010 Viridity Software, Inc. All Rights Reserved EliminateNonproductive Assets
Retire Ghosts From Data CenterCopyright © 2010 Viridity Software, Inc. All Rights Reserved 9Remove servers thatare not contributingto the businessIdentify thecandidates fordecommissioning or virtual consolidation
Consolidate NonproducersCopyright © 2010 Viridity Software, Inc. All Rights Reserved 10Consolidateapplications andstacks of gearEnable additionalapplicationdeployment in existing data centerEnergyCenter: Underutilized Server Identification
Leverage Underutilized ServersCopyright © 2010 Viridity Software, Inc. All Rights Reserved 11Remove, consolidate or virtualize applicationsAchieve peakperformance withthe equipment in theexisting data center
Copyright © 2010 Viridity Software, Inc. All Rights Reserved Improve Data CenterEfficiency
Find Stranded CapacityCopyright © 2010 Viridity Software, Inc. All Rights Reserved 13Add years to the life of existing data centerFacilities is heating and cooling for1,000 kWAvailable CapacityCould add 1000 Additional ServerskWMax Draw480 kWMin Draw250 kWUtilization
Optimal Placement of Equipment$17,450*$12,750*Savings of $1.8k - $7.7kPer Rack / Per yearAVERAGE PUEAVERAGE PUEEnergyCenterVIIRIDITY5.7kW5.7kWSource: Georgia Tech Study*Note: Total annual power cost per rack
Tech RefreshUpgrade power consuming equipment to new, energy efficient modelsInvestment made is returned through the reduction of power and cooling expensesCopyright © 2010 Viridity Software, Inc. All Rights Reserved 15“We estimate, in fact, that the conversion to the energy-efficient Intel Core micro-architecture saved up to 26 terawatt-hours of electricity between 2006 and 2009, compared to the technology it replaced.”-- Intel Annual Report, 2009
Copyright © 2010 Viridity Software, Inc. All Rights Reserved Achieve Optimal OperatingEfficiency
Automated Measurement & ReportsInformation isgathered dynamicallyand reports aregenerated for analysisof:Server utilizationTop power consumersUnderutilized serversPower distributionunitsCopyright © 2010 Viridity Software, Inc. All Rights Reserved 17
Predictive AnalysisIdentify trends overtime using historicalchartsActionableinformation helps todrive down costs,manage risk, andextend the life ofexisting facilitiesCopyright © 2010 Viridity Software, Inc. All Rights Reserved 18
Make IT a Competitive AdvantageDemonstrate how ITsaves money, energyand resources andhow that goes straightto the bottom lineLead corporatesustainability effortsCopyright © 2010 Viridity Software, Inc. All Rights Reserved 19
Learn More at Viridity.comDownload Viridity white papersRegister for a Viridity webinarTry our NEW ROI calculator!Copyright © 2010 Viridity Software, Inc. All Rights Reserved 20

The Road to Data Center Energy Efficiency

  • 1.
    Copyright © 2010Viridity Software, Inc. All Rights Reserved The Road ToData Center Efficiency
  • 2.
    Energy Center connectsequipment utilization and business value to power consumptionTime-to-value in hours, not monthsDeploys in minutes, not weeksNo additional hardware requiredNo server agents required Copyright © 2010 Viridity Software, Inc. All Rights Reserved 2The Leader in EnergyResource Management
  • 3.
    Energy Resource Management(ERM)Eliminate Non-Productive IT AssetsImproveData CenterEfficiencyOptimizeOperating EfficiencyBaseline EnvironmentNon-Productive IT AssetsRetire GhostsLeverage Underutilized serversIT Asset InventoryDynamically Measure UtilizationKnow Top PowerConsumersFind Stranded CapacityOptimal PlacementTech RefreshAutomated Measurement & MonitoringPredictive AnalysisMake IT a Competitive AdvantageSource: Forrester “Five Data Center Efficiency Moves To Make Today”
  • 4.
    Copyright © 2010Viridity Software, Inc. All Rights Reserved BaselineEnvironment
  • 5.
    IT Asset InventoryQuitmanaging thedata center withspreadsheetsAuto-discover ITassets down to thesubcomponent levelCopyright © 2010 Viridity Software, Inc. All Rights Reserved 5
  • 6.
    Dynamically Measure UtilizationTrendpowerusage and utilization over timeEliminate snapshots that gather point in time dataCopyright © 2010 Viridity Software, Inc. All Rights Reserved 6EnergyCenter: Power Utilization Profile
  • 7.
    Know Top PowerConsumersCopyright © 2010 Viridity Software, Inc. All Rights Reserved 7Identify equipment in the data center using the most powerMap power consumption to utilizationEnergyCenter: Top Power Consumers
  • 8.
    Copyright © 2010Viridity Software, Inc. All Rights Reserved EliminateNonproductive Assets
  • 9.
    Retire Ghosts FromData CenterCopyright © 2010 Viridity Software, Inc. All Rights Reserved 9Remove servers thatare not contributingto the businessIdentify thecandidates fordecommissioning or virtual consolidation
  • 10.
    Consolidate NonproducersCopyright ©2010 Viridity Software, Inc. All Rights Reserved 10Consolidateapplications andstacks of gearEnable additionalapplicationdeployment in existing data centerEnergyCenter: Underutilized Server Identification
  • 11.
    Leverage Underutilized ServersCopyright© 2010 Viridity Software, Inc. All Rights Reserved 11Remove, consolidate or virtualize applicationsAchieve peakperformance withthe equipment in theexisting data center
  • 12.
    Copyright © 2010Viridity Software, Inc. All Rights Reserved Improve Data CenterEfficiency
  • 13.
    Find Stranded CapacityCopyright© 2010 Viridity Software, Inc. All Rights Reserved 13Add years to the life of existing data centerFacilities is heating and cooling for1,000 kWAvailable CapacityCould add 1000 Additional ServerskWMax Draw480 kWMin Draw250 kWUtilization
  • 14.
    Optimal Placement ofEquipment$17,450*$12,750*Savings of $1.8k - $7.7kPer Rack / Per yearAVERAGE PUEAVERAGE PUEEnergyCenterVIIRIDITY5.7kW5.7kWSource: Georgia Tech Study*Note: Total annual power cost per rack
  • 15.
    Tech RefreshUpgrade powerconsuming equipment to new, energy efficient modelsInvestment made is returned through the reduction of power and cooling expensesCopyright © 2010 Viridity Software, Inc. All Rights Reserved 15“We estimate, in fact, that the conversion to the energy-efficient Intel Core micro-architecture saved up to 26 terawatt-hours of electricity between 2006 and 2009, compared to the technology it replaced.”-- Intel Annual Report, 2009
  • 16.
    Copyright © 2010Viridity Software, Inc. All Rights Reserved Achieve Optimal OperatingEfficiency
  • 17.
    Automated Measurement &ReportsInformation isgathered dynamicallyand reports aregenerated for analysisof:Server utilizationTop power consumersUnderutilized serversPower distributionunitsCopyright © 2010 Viridity Software, Inc. All Rights Reserved 17
  • 18.
    Predictive AnalysisIdentify trendsovertime using historicalchartsActionableinformation helps todrive down costs,manage risk, andextend the life ofexisting facilitiesCopyright © 2010 Viridity Software, Inc. All Rights Reserved 18
  • 19.
    Make IT aCompetitive AdvantageDemonstrate how ITsaves money, energyand resources andhow that goes straightto the bottom lineLead corporatesustainability effortsCopyright © 2010 Viridity Software, Inc. All Rights Reserved 19
  • 20.
    Learn More atViridity.comDownload Viridity white papersRegister for a Viridity webinarTry our NEW ROI calculator!Copyright © 2010 Viridity Software, Inc. All Rights Reserved 20

Editor's Notes

  • #2 Hello, my name is Mike Rowan. I’m the Chief Technology Officer at Viridity Software and I’ll be taking you through today’s webinar “The Road to Energy Resource Management Software.”Data centers are huge consumers of power. According to Nemertes Research, “half of organizations with mid-sized data centers (5,000 – 50,000 square feet) will have insufficient power in 2011. Yet, only 45% of organizations actually measure their power usage.” They do not know how muchpower they are using and where it is being used. Ask a manager how much power is being consumed in the data center, you’ll quickly find out that most of them have no visibility into the problem. They do not have the basic information about equipment utilization or power consumption to deal with this challenge.
  • #3 Viridity Software is the leader in Energy Resource Management.Our software connects equipment utilization and business value to power consumption in the data center.Customers are finding time to value in hours, not months.And, because we are a software solution, there is no additional hardware or agents required.
  • #4 As we head out on the road to energy resource management, it’s important to look at the milestones along the way.The first step is to baseline the environment. Next, you begin to eliminate all non-productive assets. It’s in achieving these first two milestones, our customers find immediate value from Viridity EnergyCenter.After you’ve begun to be more efficient, you can begin to utilize the information from Viridity EnergyCenter to plan tech refreshes so that you’re purchasing the most efficient equipment and that you are placing it most efficiently within the rack and the aisles of your data center.Lastly, to achieve optimal operating efficiency, you want to build models that will improve your power and cooling and will measure your data center efficiency over time. This helps to tie IT objectives to the objectives of the business.
  • #5 Hello, my name is Mike Rowan. I’m the Chief Technology Officer at Viridity Software and I’ll be taking you through today’s webinar “The Road to Energy Resource Management Software.”Data centers are huge consumers of power. According to Nemertes Research, “half of organizations with mid-sized data centers (5,000 – 50,000 square feet) will have insufficient power in 2011. Yet, only 45% of organizations actually measure their power usage.” They do not know how muchpower they are using and where it is being used. Ask a manager how much power is being consumed in the data center, you’ll quickly find out that most of them have no visibility into the problem. They do not have the basic information about equipment utilization or power consumption to deal with this challenge.
  • #6 It’s hard to manage a data center when you don’t know where everything is located. View data center inventory of assets including servers, power distribution units (PDU's), branch circuit monitors (BCM), and more. Then filter system types by data center, rack row, or IP address range. This provides intelligent on-going asset and facility management.
  • #7 Viridity EnergyCenter dynamically monitors data center power status on the power draw of your assets and the utilization and power consumption for the networked equipment in the data center. Snapshots look at data at a specific point in time so you wouldn’t be able to see when servers have spikes in workload unless you capture data at a particular moment.
  • #8 Track equipment in the data center and identify what is consuming the most energy. Now, you can identify the best performing servers and placed where they’ll run most efficiently in the data center. You many also do a tech refresh to newer, more efficient servers to replace the least efficient ones.
  • #9 Hello, my name is Mike Rowan. I’m the Chief Technology Officer at Viridity Software and I’ll be taking you through today’s webinar “The Road to Energy Resource Management Software.”Data centers are huge consumers of power. According to Nemertes Research, “half of organizations with mid-sized data centers (5,000 – 50,000 square feet) will have insufficient power in 2011. Yet, only 45% of organizations actually measure their power usage.” They do not know how muchpower they are using and where it is being used. Ask a manager how much power is being consumed in the data center, you’ll quickly find out that most of them have no visibility into the problem. They do not have the basic information about equipment utilization or power consumption to deal with this challenge.
  • #10 Identify underused, orphaned, or inefficient servers and highlights the server candidates for removal, consolidation, or virtualization to drive out underutilized capacity throughout the data center. With Viridity EnergyCenter, you can filter down to the component level of an individual server to see how effectively each one is performing and how efficiently it is being used.
  • #11 Identify underused, orphaned, or inefficient servers and highlights the server candidates for removal, consolidation, or virtualization to drive out underutilized capacity throughout the data center. With Viridity EnergyCenter, you can filter down to the component level of an individual server to see how effectively each one is performing and how efficiently it is being used.
  • #12 Identify underused, orphaned, or inefficient servers and highlights the server candidates for removal, consolidation, or virtualization to drive out underutilized capacity throughout the data center. With Viridity EnergyCenter, you can filter down to the component level of an individual server to see how effectively each one is performing and how efficiently it is being used.
  • #13 Hello, my name is Mike Rowan. I’m the Chief Technology Officer at Viridity Software and I’ll be taking you through today’s webinar “The Road to Energy Resource Management Software.”Data centers are huge consumers of power. According to Nemertes Research, “half of organizations with mid-sized data centers (5,000 – 50,000 square feet) will have insufficient power in 2011. Yet, only 45% of organizations actually measure their power usage.” They do not know how muchpower they are using and where it is being used. Ask a manager how much power is being consumed in the data center, you’ll quickly find out that most of them have no visibility into the problem. They do not have the basic information about equipment utilization or power consumption to deal with this challenge.
  • #14 Key Points:Data centers do not have utilization & consumption data today. As a result, excess capacity is frequently built into the data center.The opposite is also true…little to NO excess capacity resulting in a potential cascading “Brown-out” situation (Wikidedia in March)Bottom line….without this basic data, you are either running high risk or high waste in your data center. With Viridity, you identify this “Available (or stranded) Capacity” allowing you to add years to your existing data center.
  • #15 Key Points:Georgia Tech study showed big impact on costs based on placement within the rack.Utilization data is required to optimally placeOngoing operational dependency – achieve and maintain optimal placementMany data centers are being managed by spreadsheets and Visio drawings. These manually updated systems have a hard time keeping up with rack server equipment changes. With Viridity EnergyCenter, you have an easy-to-use, graphical view of your data center complete with utilization and automatic updates to server rack inventories. This helps optimize server capacity and avoid over-provisioning and underutilization of installed server rack systems. It also provides placement assistance for consolidations and new equipment.
  • #16 The barriers to getting information can be organizational: silos of ownership between facilities and data center management.IT managers are responsible for supporting the business with technology. They are responsible for servers, storage, and virtualization in the data center. They need to keep the aisles cool and the data backed up. Facilities managers are responsible for overall site. They manage lighting, heating, ventilation, air conditioning systems, and most often, the electric bill. It’s their goal to drive down power consumption, reduce overall floor space, and keep the building operational.Energy efficiency initiatives require close alignment and participation of both departments. With Viridity EnergyCenter, everyone gets actionable information to do their jobs better together.
  • #17 Hello, my name is Mike Rowan. I’m the Chief Technology Officer at Viridity Software and I’ll be taking you through today’s webinar “The Road to Energy Resource Management Software.”Data centers are huge consumers of power. According to Nemertes Research, “half of organizations with mid-sized data centers (5,000 – 50,000 square feet) will have insufficient power in 2011. Yet, only 45% of organizations actually measure their power usage.” They do not know how muchpower they are using and where it is being used. Ask a manager how much power is being consumed in the data center, you’ll quickly find out that most of them have no visibility into the problem. They do not have the basic information about equipment utilization or power consumption to deal with this challenge.
  • #18 Viridity EnergyCenter deploys in minutes, not weeks. Within hours, you can discover data center power draw, events triggering jobs, average server utilization, and the number of underutilized servers across the data center. You get actionable information that improves energy efficiency and space utilization right away.When you consider that each watt of IT energy requires at least as much energy in infrastructure support, it’s easy to see a huge potential for savings and energy reduction without risking operations.
  • #21 [NOTE: After the demo, switch to this slide . Leave this slide up during the Q&A portion.]We look forward to speaking with you about any challenges you may be having with energy in your data center and how we might help. I would also urge you to go to viridity.com and use our free underutilized server ROI calculator to gauge how much you could save annually in energy costs by shutting down servers which are not contributing to your business.