Downloaded 361 times


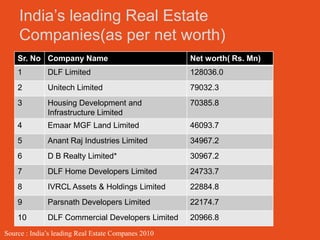


![• Total area- 10000 sq. ft.
• Construction cost- Rs. 2500 per sq. ft.
• Land cost – Rs. 2500 per sq. ft.
• Other expenses- Rs. 600 per sq. ft.
• Considering 30% area sold while booking or bhoomi poojan.
• Interest = around 10-12%
• Therefore total cost= 10000 * 5600= 5.6 cr
• Total sales cost = 9800* 11000= 10.78 cr(avg out)
• Booking sales= 4200(30%) * 8000= 3.36 cr[Construction cost
averages out]
• Total sales revenue= 10.78 + 3.36= 14.14 cr
• Total profit % = 152% profit](https://image.slidesharecdn.com/therealestate-sectorpresentation-120819120555-phpapp02/85/The-real-estate-sector-presentation-37-320.jpg)


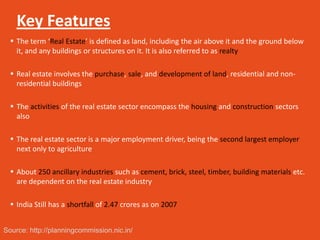
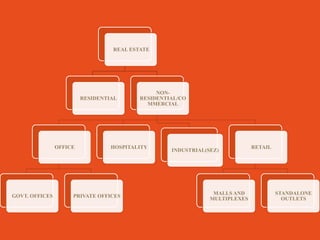
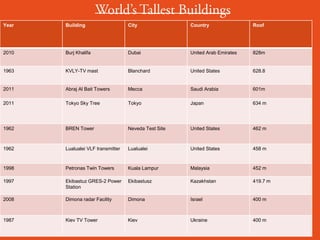
The document discusses the real estate sector, noting that early human dwellings were found in caves dating back hundreds of thousands of years. It defines real estate as land and structures on it, and describes how the sector involves the purchase, sale, and development of residential and commercial property. The real estate industry has significant impacts on other sectors like retail, hospitality, and healthcare through the development of malls, hotels, and hospitals.


