Download as PDF, PPTX
![© 2008 Haim Michael 20150729
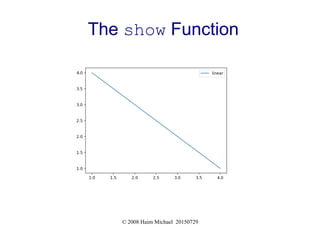
The show Function
Once completed, calling show will draw the diagram on the
screen.
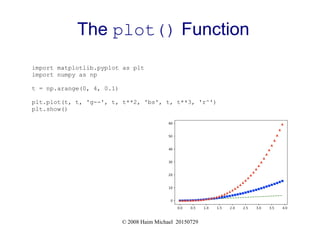
import matplotlib.pyplot as plt
import numpy as np
plt.plot([1,2,3,4], [4,3,2,1], label='linear')
plt.legend()
plt.show()](https://image.slidesharecdn.com/matplotlibmeetup20201014-201016020502/85/The-matplotlib-Library-5-320.jpg)
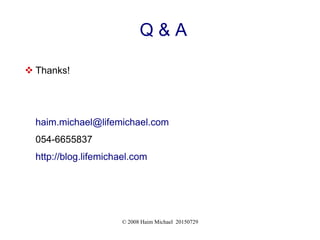
![© 2008 Haim Michael 20150729
The add_subplot Method
import matplotlib.pyplot as plt
import numpy as np
fig = plt.figure()
ax = fig.add_subplot()
ax.scatter([1,2,3,4,5],[4,3,7,8,20])
plt.show()](https://image.slidesharecdn.com/matplotlibmeetup20201014-201016020502/85/The-matplotlib-Library-9-320.jpg)

The document provides an introduction to the matplotlib library, detailing its capabilities for creating visualizations in Python. It discusses installation via pip, basic functions such as plot and show, and how to create figures and subplots. Additionally, it addresses turning on interactive mode for real-time programming feedback.


![Getting Started with Apache Spark: Big Data Made Simple [Free Meetup]](https://cdn.slidesharecdn.com/ss_thumbnails/apachesparkgettingstarted-260203175547-8361bcc3-thumbnail.jpg?width=640&height=640&fit=bounds)


![Vibe Coding vs. Spec-Driven Development [Free Meetup]](https://cdn.slidesharecdn.com/ss_thumbnails/vibecodingvsspecdrivendevelopment-251209105622-43f455e7-thumbnail.jpg?width=640&height=640&fit=bounds)

![Learning Programming with ChatGPT [Free Meetup]](https://cdn.slidesharecdn.com/ss_thumbnails/learningprogrammingwithchatgpt20250930-250930090922-6c25145f-thumbnail.jpg?width=640&height=640&fit=bounds)
![Getting Started with Typer: Building Modern CLIs in Python [Free Meetup]](https://cdn.slidesharecdn.com/ss_thumbnails/typer20250902-250902092143-083883db-thumbnail.jpg?width=640&height=640&fit=bounds)
![Prompt Engineering Jump Start [Free Meetup]](https://cdn.slidesharecdn.com/ss_thumbnails/promptengineeringbasics20250708-250807095210-d5891b09-thumbnail.jpg?width=640&height=640&fit=bounds)

![The Visitor Classic Design Pattern [Free Meetup]](https://cdn.slidesharecdn.com/ss_thumbnails/thevisitordesignpattern20250603-250603091504-a29cefc7-thumbnail.jpg?width=640&height=640&fit=bounds)
![Typing in Python: Bringing Clarity, Safety and Speed to Your Code [Free Meetup]](https://cdn.slidesharecdn.com/ss_thumbnails/haimpythontypes20250401-250401101822-2acdbf8f-thumbnail.jpg?width=640&height=640&fit=bounds)
![Introduction to Pattern Matching in Java [Free Meetup]](https://cdn.slidesharecdn.com/ss_thumbnails/javapatternmatchingmeetup20250304-250304131144-9588cdc2-thumbnail.jpg?width=640&height=640&fit=bounds)
![Mastering The Collections in JavaScript [Free Meetup]](https://cdn.slidesharecdn.com/ss_thumbnails/javascriptcollections20250204-250205161759-5a1365e2-thumbnail.jpg?width=640&height=640&fit=bounds)

![JavaScript Promises Simplified [Free Meetup]](https://cdn.slidesharecdn.com/ss_thumbnails/promises20241001-241001092110-ceaab0a2-thumbnail.jpg?width=640&height=640&fit=bounds)
![Scala Jump Start [Free Online Meetup in English]](https://cdn.slidesharecdn.com/ss_thumbnails/scalajumpstart202407-240806123226-086f5431-thumbnail.jpg?width=640&height=640&fit=bounds)
![The MVVM Architecture in Java [Free Meetup]](https://cdn.slidesharecdn.com/ss_thumbnails/themvvmarchitecture20230702-240709115838-c4912ba1-thumbnail.jpg?width=640&height=640&fit=bounds)


