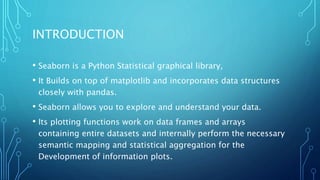
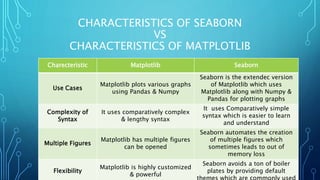
SUBMITTED BY : SUBMITTED
TO:
MANISH SINGH DR. PRAGYA TEWARI
MA’AM
MASTERS OF COMPUTER APPLICATION
ASSISTANT PROFESSOR
CONTENTS
• Introduction
• Characteristics of Seaborn vs Matplotlib
• Various plots in Seaborn
• Seaborn plots
• Displots
INTRODUCTION
• Seaborn is a Python Statistical graphical library,
• It Builds on top of matplotlib and incorporates data structures
closely with pandas.
• Seaborn allows you to explore and understand your data.
• Its plotting functions work on data frames and arrays
containing entire datasets and internally perform the necessary
semantic mapping and statistical aggregation for the
Development of information plots.
• It makes the charts more appealing and promotes some of the
common needs for data visualization (like mapping a color to a
variable).
• Importing seaborn:
import seaborn as sns
• To check the version of seaborn on your system:
print(sns.version)
CHARACTERISTICS OF SEABORN
VS
CHARACTERISTICS OF MATPLOTLIB
Charecteristic Matplotlib Seaborn
Use Cases
Matplotlib plots various graphs
using Pandas & Numpy
Seaborn is the extendec version
of Matplotlib which uses
Matplotlib along with Numpy &
Pandas for plotting graphs
Complexity of
Syntax
It uses comparatively complex
& lengthy syntax
It uses Comparatively simple
syntax which is easier to learn
and understand
Multiple Figures
Matplotlib has multiple figures
can be opened
Seaborn automates the creation
of multiple figures which
sometimes leads to out of
memory loss
Flexibility
Matplotlib is highly customized
& powerful
Seaborn avoids a ton of boiler
plates by providing default
VARIOUS PLOTS IN SEABORN
• Wide range of plots can be plotted using seaborn for
visualization.
• Here are some of them:
• Univariate Data: Plotting a graph for single variable
• Distplot
• Rug Plot
• Bivariate Data : Plotting a graph for multiple variables
• Scatter Plot
• Hexabin Plot
• Kde Plot
SEABORN PLOTS
DISTPLOT
• DISTPLOT stands for Distribution Plot, It takes as input an array
and plots a curve corresponding to the distribution of points in
the array.
• We will be using distplot() function for this purpose.
• The output plot will have basically 2 graphs.
• Histogram
• Kdeurve – kernel density
EXAMPLE
• Import matplotlib.pyplot as plt
• Import seaborn as sns
• Sns.distplot([0,1,2,3,4.5])
• Plt.show()
OUTPUT
• We can also separately visualize both the plots.
• sns.distplot([0,1,2,3,4,5],kde = False)
only histogram curve will be observed.
• sns.distplot([0,1,2,3,4,5],hist=False)
only kde curve will be observed
Seaborn.pptx

Seaborn.pptx

  • 1.
    SUBMITTED BY :SUBMITTED TO: MANISH SINGH DR. PRAGYA TEWARI MA’AM MASTERS OF COMPUTER APPLICATION ASSISTANT PROFESSOR
  • 2.
    CONTENTS • Introduction • Characteristicsof Seaborn vs Matplotlib • Various plots in Seaborn • Seaborn plots • Displots
  • 3.
    INTRODUCTION • Seaborn isa Python Statistical graphical library, • It Builds on top of matplotlib and incorporates data structures closely with pandas. • Seaborn allows you to explore and understand your data. • Its plotting functions work on data frames and arrays containing entire datasets and internally perform the necessary semantic mapping and statistical aggregation for the Development of information plots.
  • 4.
    • It makesthe charts more appealing and promotes some of the common needs for data visualization (like mapping a color to a variable). • Importing seaborn: import seaborn as sns • To check the version of seaborn on your system: print(sns.version)
  • 5.
    CHARACTERISTICS OF SEABORN VS CHARACTERISTICSOF MATPLOTLIB Charecteristic Matplotlib Seaborn Use Cases Matplotlib plots various graphs using Pandas & Numpy Seaborn is the extendec version of Matplotlib which uses Matplotlib along with Numpy & Pandas for plotting graphs Complexity of Syntax It uses comparatively complex & lengthy syntax It uses Comparatively simple syntax which is easier to learn and understand Multiple Figures Matplotlib has multiple figures can be opened Seaborn automates the creation of multiple figures which sometimes leads to out of memory loss Flexibility Matplotlib is highly customized & powerful Seaborn avoids a ton of boiler plates by providing default
  • 6.
    VARIOUS PLOTS INSEABORN • Wide range of plots can be plotted using seaborn for visualization. • Here are some of them: • Univariate Data: Plotting a graph for single variable • Distplot • Rug Plot • Bivariate Data : Plotting a graph for multiple variables • Scatter Plot • Hexabin Plot • Kde Plot
  • 7.
  • 8.
    DISTPLOT • DISTPLOT standsfor Distribution Plot, It takes as input an array and plots a curve corresponding to the distribution of points in the array. • We will be using distplot() function for this purpose. • The output plot will have basically 2 graphs. • Histogram • Kdeurve – kernel density
  • 9.
    EXAMPLE • Import matplotlib.pyplotas plt • Import seaborn as sns • Sns.distplot([0,1,2,3,4.5]) • Plt.show()
  • 10.
  • 11.
    • We canalso separately visualize both the plots. • sns.distplot([0,1,2,3,4,5],kde = False) only histogram curve will be observed. • sns.distplot([0,1,2,3,4,5],hist=False) only kde curve will be observed