The document provides an overview of data visualization in Python using the matplotlib library, particularly focusing on the pyplot interface for creating various plots like line charts and bar charts. It outlines the installation steps for matplotlib, how to create and customize different types of plots, and includes examples of visualizing data with customization options such as color and marker types. Additionally, it explains the process of creating horizontal bar charts and modifying bar width and colors.
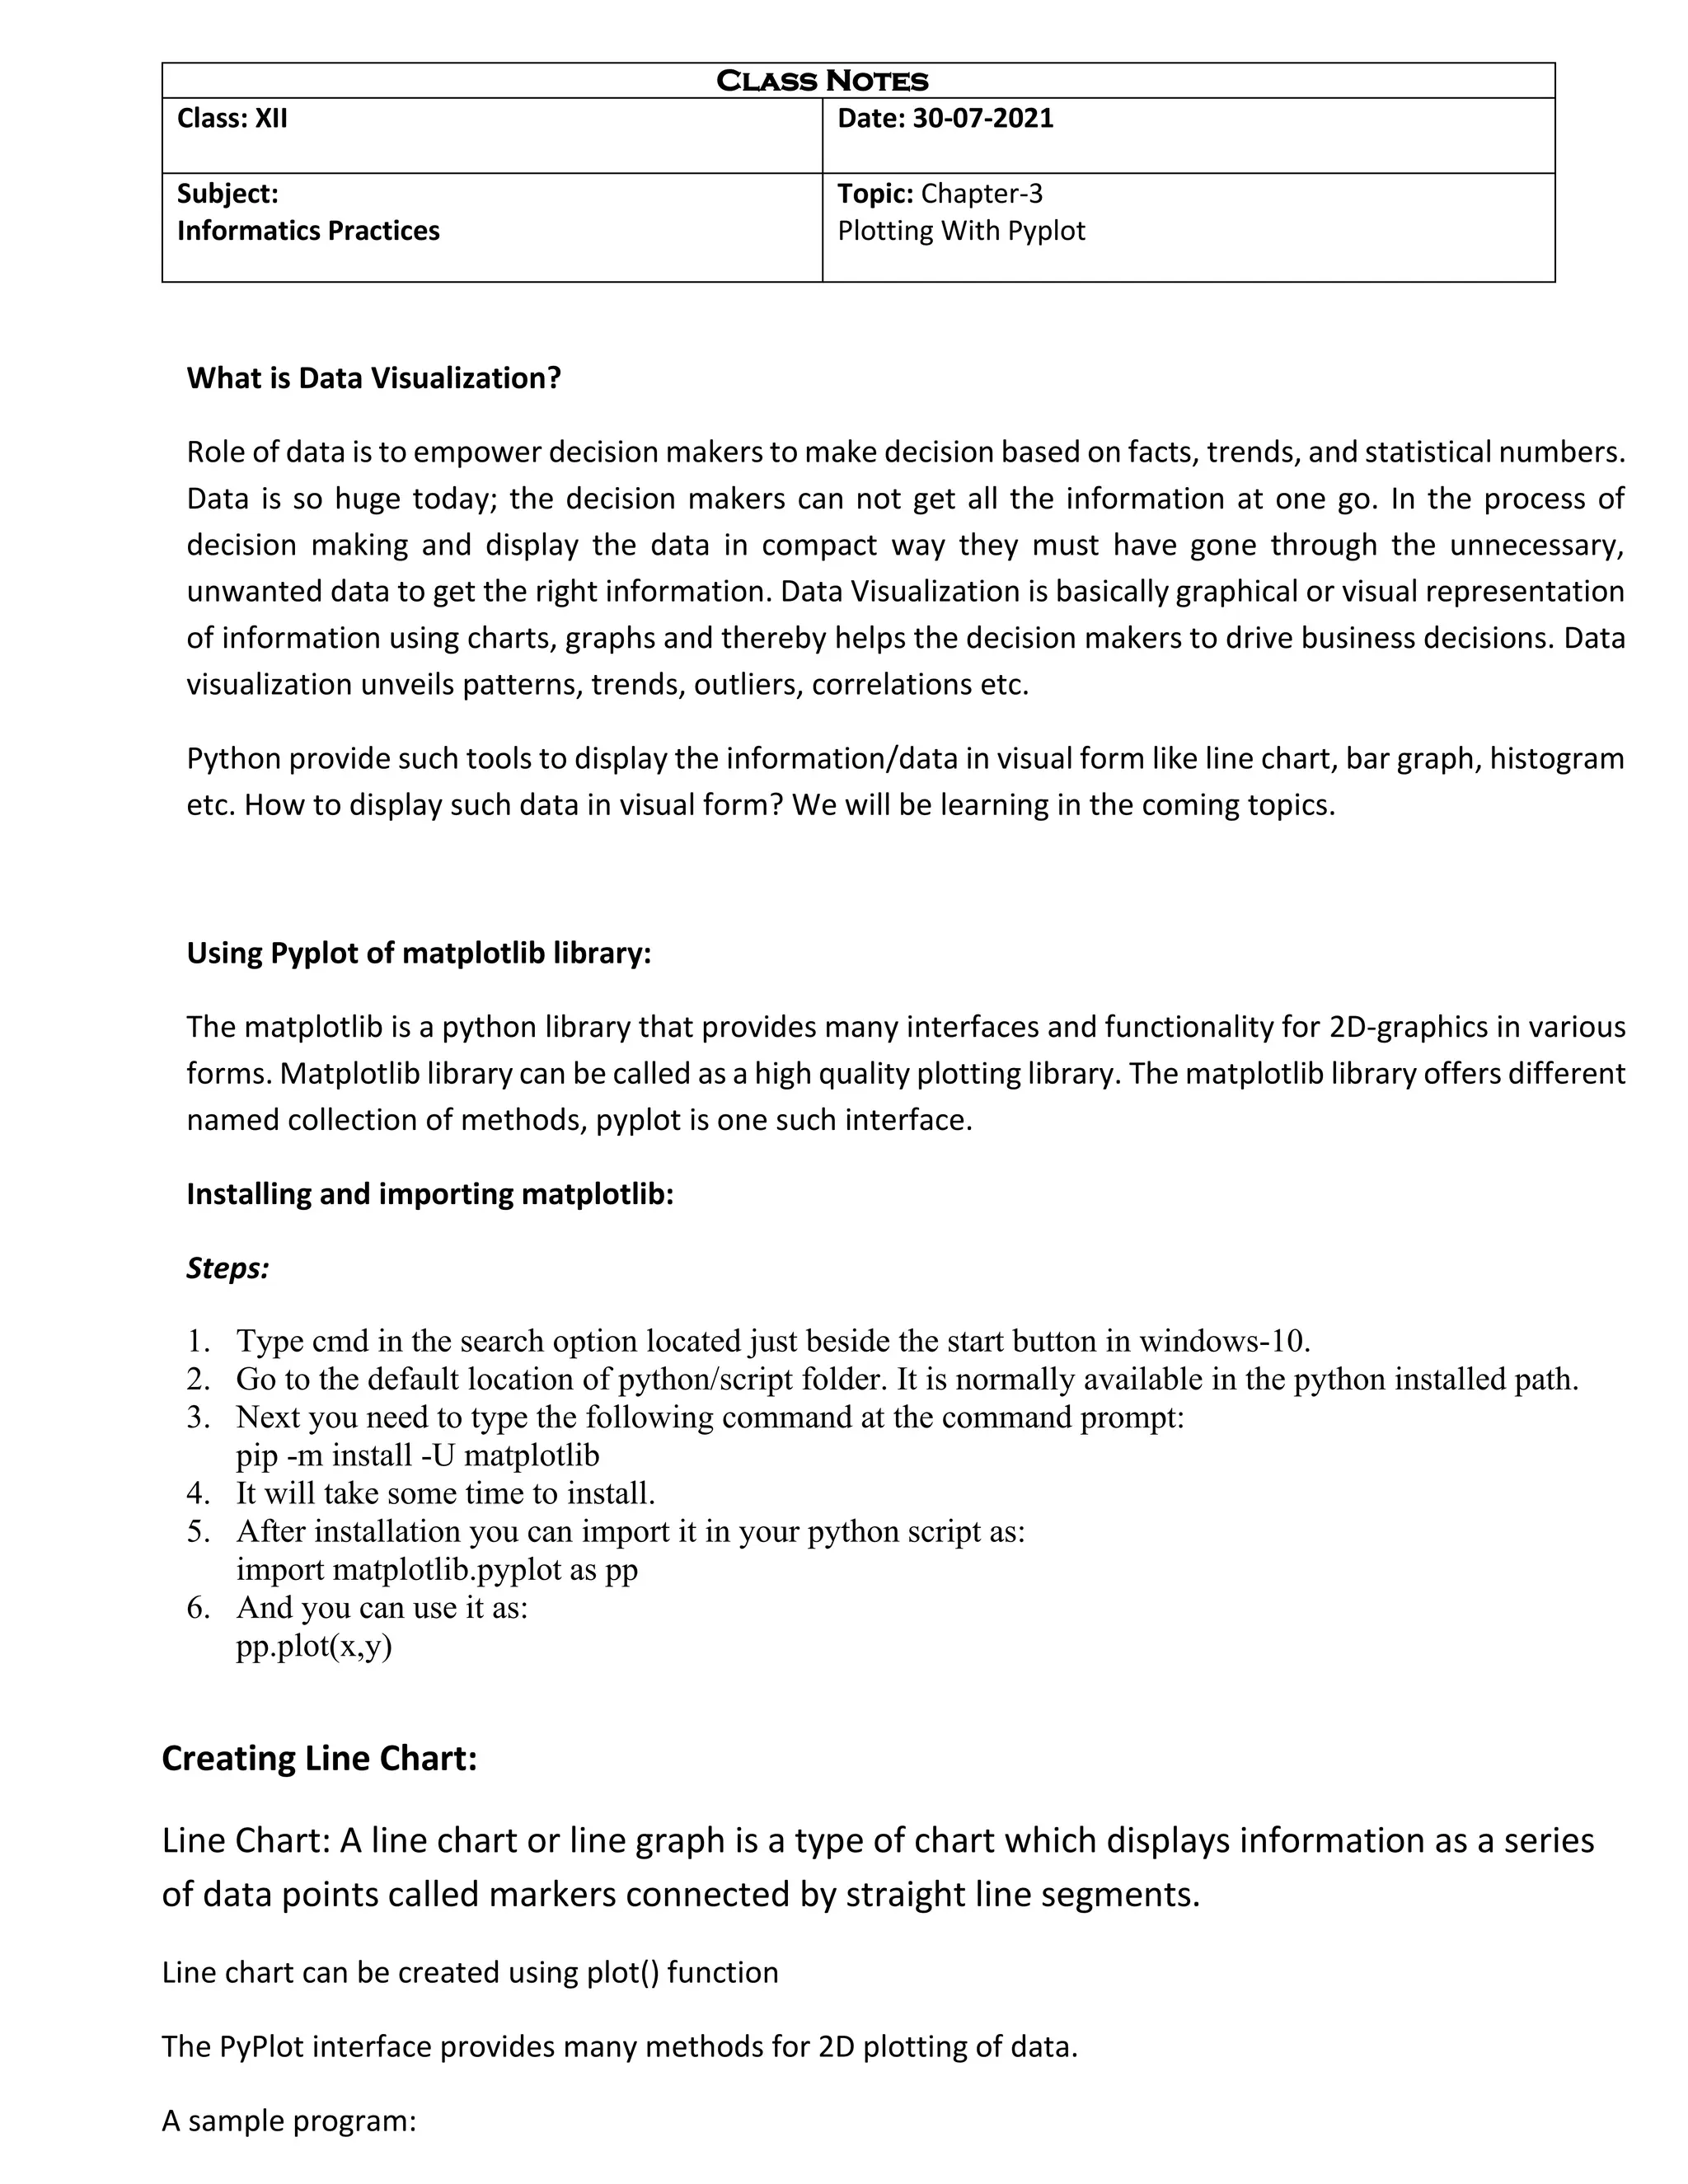
![import matplotlib.pyplot as pp
x=np.linspace(1,5,6) # To generate an array in range 1..5 having 6 elements
y=np.log(x)
pp.plot(x,y)
pp.show()
Changing Label of X and Y axis
This can be achieved through xlabel() and ylable() functions of matplotlib.[yplot library. In the
given example has been used these two functions.
import matplotlib.pyplot as p1
a=[1,2,3,4]
b=[2,4,6,8]
p1.xlabel("X axis values")
p1.ylabel("Y axis values")
p1.plot(a,b)
p1.show()](https://image.slidesharecdn.com/12-ip-231122132503-0d8af421/75/12-IP-pdf-2-2048.jpg)
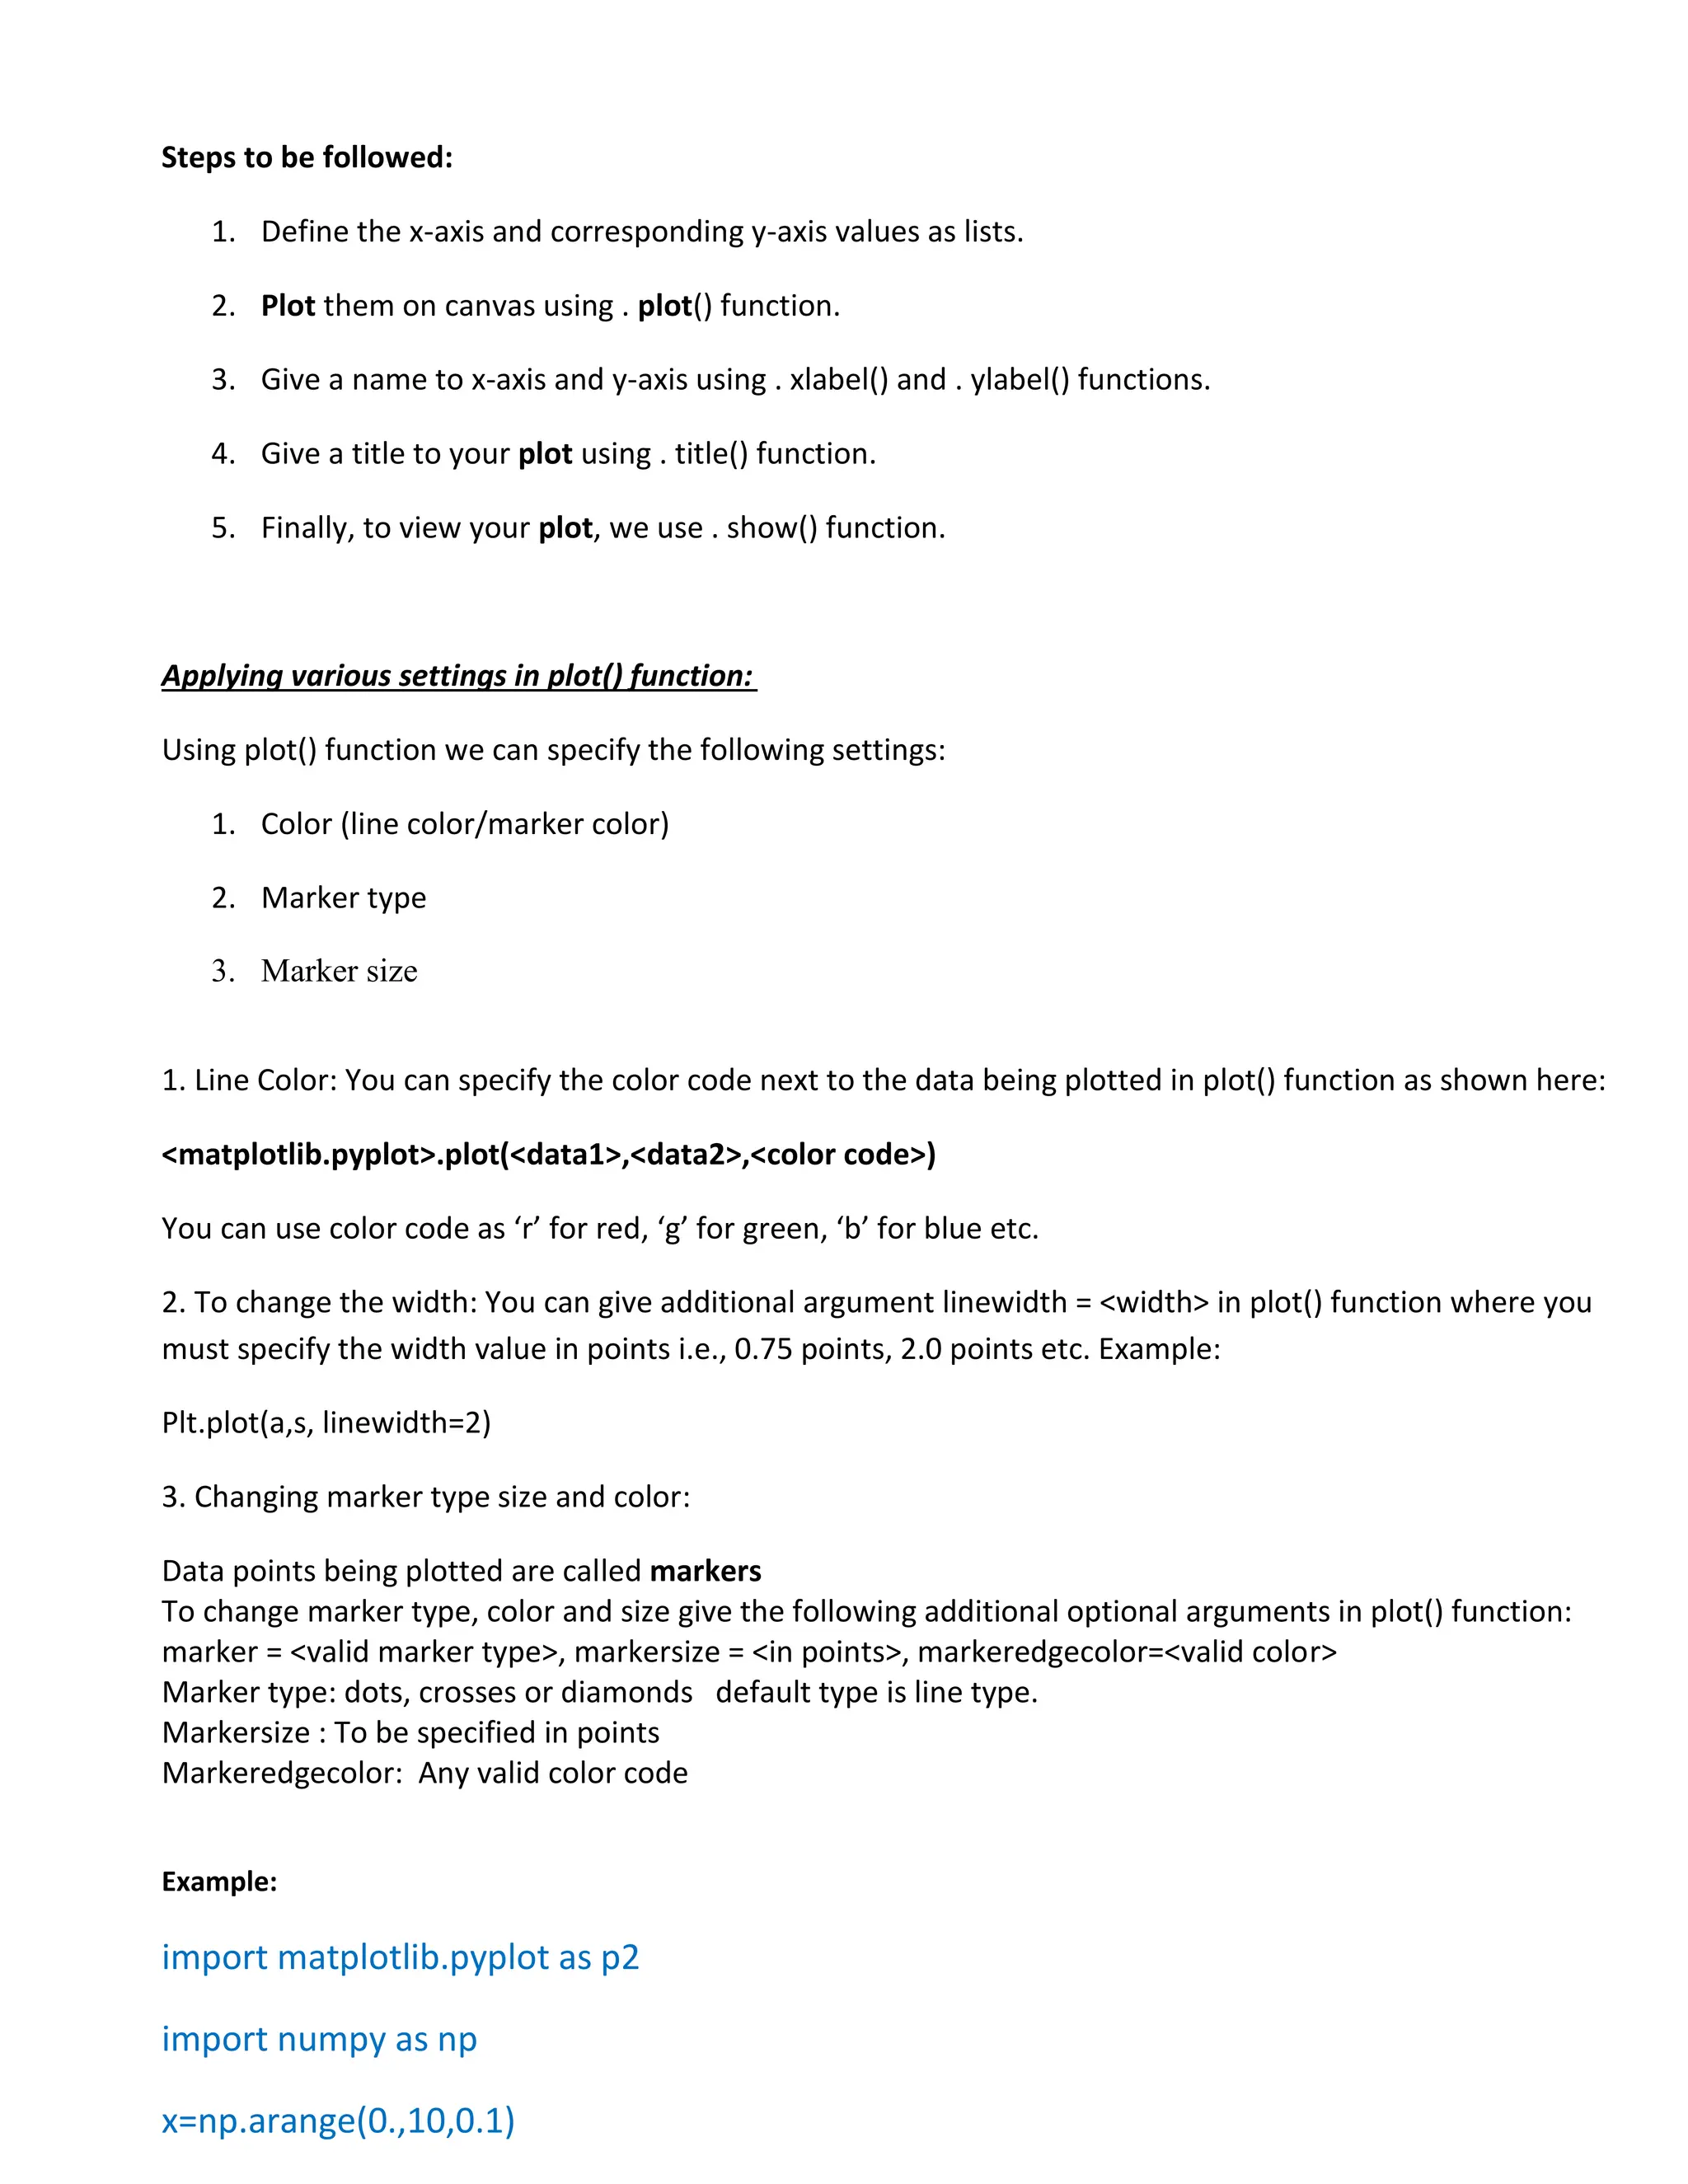
![a=np.cos(x)
b=np.sin(x)
p2.plot(x,a,'b',ls='dashed',marker='d', markersize=5, markeredgecolor='r')
p2.plot(x,b,'c',ls='dotted')
p2.show()
Creating Bar Charts
A BAR chart is graphical display of data using bars of different heights.
For Example:
import matplotlib.pyplot as p2
import numpy as np
x=[1,2,3,4]
y=[2,4,6,8]
p2.bar(x,y)
p2.show()](https://image.slidesharecdn.com/12-ip-231122132503-0d8af421/75/12-IP-pdf-4-2048.jpg)
![Changing Width of the Bars in a Bar Chart
Default width of a bar is 0.8 units. But this width can be changed as per our need:
To specify common width for all bars:
The syntax is:
<matplotlib.pyplot>.bar(x-seq , y-seq , width=<float value>)
To specify different width for different bars of a bar chart:
The syntax is:
<matplotlib.pyplot>.bar(x-seq , y-seq , width=<width value sequences>)
We can also specify different colors for different bars of a bar chart
The syntax is:
<matplotlib.pyplot>.bar(x-seq , y-seq , color=<color names/code sequences>)
Example of the bar graph with different width and different colours:
import matplotlib.pyplot as pp
import numpy as np
cities = ['Raipur','Bilaspur','Durg','Raigarh','Bastar']
Population = [450000,325000,280540, 256432, 180056]
pp.bar(cities,Population, width=[0.5,0.8,0.9,0.6,0.3],color=['r','k','g','b','y'])
pp.legend(loc='upper left')
pp.savefig("E:XIIKGraphcity2.png")
pp.show()](https://image.slidesharecdn.com/12-ip-231122132503-0d8af421/75/12-IP-pdf-5-2048.jpg)
![Creating multiple Bars
1. Deciding X points and thickness.
2. Deciding colors
3. Width argument value is dependent upon thickness of X point.
4. Use bar() function.
Example:
Creating a horizontal bar graph:
To create a Horizontal Bar Graph you need to use barh()
import matplotlib.pyplot as pp
import numpy as np
val=[[5,25,45,20],[8,20,40,25],[3,10,50,21]]
x=np.arange(4)
pp.bar(x+0.00,val[0],color='b',width=0.25)
pp.bar(x+0.25,val[1],color='r',width=0.25)
pp.bar(x+0.50,val[2],color='g',width=0.25)
pp.show()
import matplotlib.pyplot as pp
import numpy as np
cities =
['Raipur','Bilaspur','Durg','Raigarh','Bastar']
Population =
[45000000,32500000,28054000,
25643200, 18005670]
pp.barh(cities,Population)
pp.xlabel("Cities")
pp.ylabel("Population")
pp.show()](https://image.slidesharecdn.com/12-ip-231122132503-0d8af421/75/12-IP-pdf-6-2048.jpg)


![Coded Agents – with UiPath SDK + LangGraph [Virtual Hands-on Workshop]](https://cdn.slidesharecdn.com/ss_thumbnails/codedagentsdeck-251215155422-5497c599-thumbnail.jpg?width=640&height=640&fit=bounds)


![Vibe Coding vs. Spec-Driven Development [Free Meetup]](https://cdn.slidesharecdn.com/ss_thumbnails/vibecodingvsspecdrivendevelopment-251209105622-43f455e7-thumbnail.jpg?width=640&height=640&fit=bounds)


