The Influence of Contact Farmers on The Adoption of Improved Cassava Varieties in EPE, Lagos State

The study examines the influence of contact farmers on the adoption of improved cassava varieties in Epe, Lagos state. Data for the study were generated from a field survey of cassava farmers selected by random sampling technique among contact and non-contact farmers in Epe, Lagos state. Descriptive statistics,Fourt and Woodlock Model, Mansfeild Model and Bass Diffusion Model were employed for the analyses. The descriptive statistics was used to analyse social economics of the selected farmers, while Fourt and Woodlock Model, Mansfeild Model and Bass Diffusion Model were required in analysing the diffusion process and prediction of adopters of improved cassava varieties.The results show that 2.4% are below 30 years of age 36.3% fall within the age bracket of 30 – 40years, 40.0% falls within 41-50years and 21.3% were above 50 year. In all, about 78% of the farmers are below the age of 50 years, which is regarded as young or youthful age, dynamic enough to adopt improved crop varieties. The coefficient of imitation q is 0.795. This is a positive value, and implies that the diffusion process is high. The coefficient of innovation influence p is estimated as 0.005. This also is positive, meaning that the use of external influences on potential adopters has very little effect on the adoption decision. The decision to adopt was mainly through the word of mouth recommendation. It was shown that, the diffusion process could be predicted by applying the Bass model, Fourt and Woodlock model and the Mansfield model.

Recommended
Recommended
More Related Content
What's hot
What's hot (20)
Similar to The Influence of Contact Farmers on The Adoption of Improved Cassava Varieties in EPE, Lagos State
Similar to The Influence of Contact Farmers on The Adoption of Improved Cassava Varieties in EPE, Lagos State (20)
More from International journal of scientific and technical research in engineering (IJSTRE)
More from International journal of scientific and technical research in engineering (IJSTRE) (20)
Recently uploaded
Recently uploaded (20)
The Influence of Contact Farmers on The Adoption of Improved Cassava Varieties in EPE, Lagos State
- 1. International journal of scientific and technical research in engineering (IJSTRE) www.ijstre.com Volume 1 Issue 7 ǁ October 2016. Manuscript id. 371428262 www.ijstre.com Page 1 The Influence of Contact Farmers on The Adoption of Improved Cassava Varieties in EPE, Lagos State Ogunbameru Adelabu Department of Agricultural Extension and Management Lagos State Polytechnic Ikorodu, Lagos. ABSTRACT: The study examines the influence of contact farmers on the adoption of improved cassava varieties in Epe, Lagos state. Data for the study were generated from a field survey of cassava farmers selected by random sampling technique among contact and non-contact farmers in Epe, Lagos state. Descriptive statistics,Fourt and Woodlock Model, Mansfeild Model and Bass Diffusion Model were employed for the analyses. The descriptive statistics was used to analyse social economics of the selected farmers, while Fourt and Woodlock Model, Mansfeild Model and Bass Diffusion Model were required in analysing the diffusion process and prediction of adopters of improved cassava varieties.The results show that 2.4% are below 30 years of age 36.3% fall within the age bracket of 30 – 40years, 40.0% falls within 41-50years and 21.3% were above 50 year. In all, about 78% of the farmers are below the age of 50 years, which is regarded as young or youthful age, dynamic enough to adopt improved crop varieties. The coefficient of imitation q is 0.795. This is a positive value, and implies that the diffusion process is high. The coefficient of innovation influence p is estimated as 0.005. This also is positive, meaning that the use of external influences on potential adopters has very little effect on the adoption decision. The decision to adopt was mainly through the word of mouth recommendation. It was shown that, the diffusion process could be predicted by applying the Bass model, Fourt and Woodlock model and the Mansfield model. Keywords: Cassava varieties, Bass model, Mansfield Model, Fourt and Woodlock model, Adoption, Innovations, Contact farmers I. INTRODUCTION For most of the world’s poorest countries, agriculture provides the leading source of employment and contributes large proportions of the national income. In many of these countries however, agricultural productivity is extremely low. In Nigeria, for instance, agriculture provides more than 70% of the population with habitation and employment, and contributes about 40% of the gross domestic product and 88% of non-oil foreign exchange earnings. Food demand growth rates of usually between 3% - 4% are recorded as against the annual production rate of 1% (Lotze‐Campen,et.al. 2008). This regressive balance has long necessitated relevant authorities to formulate programmes to boost food production through the adoption of appropriate technologies. ICAR (2006), reported that regular falls in crop yields are recorded as a result of poor adoption of appropriate technologies for food crop production. One important way to increase agricultural productivity therefore is through the introduction and adoption of improved agricultural technologies and management systems. Researchers say the key to mitigating changes in environmental conditions and pest and diseases among many others depends on the deployment of suitable varieties that will not suffer from sudden changes in the environment. These factors call for the need to cultivate a range of cassava varieties that may be a buffer to cassava production in an integrative manner since no single variety can achieve all the end-users’ requirements. Byerlee and Polanco (1986), demonstrated that farmers adopts improved varieties, fertilisers and herbicides in a step-wise manner, rather than a package, in the Mexican; and that it is difficult to compare productivity gains between adopters and non-adopters of technologies, because the adoption decision is correlated with other factors affecting productivity. In the light of this, Munshi (2004) compared wheat and rice growing villages in India to demonstrate that adoption based on observing neighbours is less likely in areas with heterogeneous populations where a farmer may not be able to control for differences in neighbours character. Using a data set that has measures of individuals social networks, Bandiera and Rasul (2002) demonstrated that individual networks are important sources of information sharing that affects the adoption decision. Adoption / diffusion study examines and evaluates the spread process of innovations such as new techniques, information, knowledge, education and religion. A lot of studies on adoption / diffusion of innovation have been published in the agricultural field. Studies according to D’souza et al. (1993) have generally focused either on technology adoption process at the farm level or on identifying the significant characteristics associated with adopters of individual technology. Regardless of whichever is the focus, adoption is generally a decision at the
- 2. The Influence of Contact Farmers on The Adoption of Improved Cassava Varieties in EPE, Lagos.. Manuscript id. 371428262 www.ijstre.com Page 2 individual farmer’s level, subject to various constraints bothering on resource (human and material) endowment and time variation which makes adoption a dynamic process. In some cases,however, it is considered to be more beneficial to focus on the latter with the principal aim of targeting specific variables for policy formulation or specific group of farmers to promote the adoption of an innovation. Technology adoption literatures have however grouped factors affecting technology adoption under human capital, structural, institutional, and environmental categories (Feder and Slade, 1984; D’souza et al., 1993; Isham, 2002). Human capital factors include educational background of the farmer, age or experience in farming. While education is expected to have positive association with adoption decision, a priori expectation on the influence of age is negative as younger farmers are expected to be more receptive to new innovations. Institutional factors include processes that facilitate build up of social capital, contact with extension information, group participation, credit and alternative sources of income which are all expected to have positive influence on adoption decision. The work of Isham (2002) showcase the positive impact of social capital by predicting that farmers that have neighbours that adopt technology or those with higher level of social capital accumulates more information and thus adopt technology more rapidly. Rogers (1962) defines that the diffusion of innovation is the process by which that innovation is communicated through certain channel over time among the members of a social system. Additionally, he stated that a phenomenon of innovation adoption / diffusion occurs over time through knowledge, persuasion, decision, implementation and confirmation The generation of appropriate and relevant technologies as well as the dissemination and eventual acceptance of such technologies by farmers have been of great concern to international organizations and national governments. This concern has been reflected in substantial budgetary allocations by these bodies to research and development. Similarly, several intervention programs have been formulated and implemented. The Information and Communication Support for Agricultural Growth in Nigeria Project (ICS-Nigeria) is one of such interventions. The goal of ICS-Nigeria is “improved income and well-being of farmers in Nigeria, through improved information flow leading to increased farmers’ use of agricultural technologies” (IITA and NAERLS 2001). ICS-Nigeria therefore aims at strengthening the capacity to assist farmers by packaging and disseminating information in the appropriate formats thereby enhancing information flow. By this, ICS-Nigeria hopes to increase farmers’ use of agricultural technologies, which in turn will increase their productive capacity (IITA 2002). The present and future demands on cassava for food and industrial needs make it necessary for research to always provide the farmers with suitably improved cassava varieties to meet their challenges. In adopting new varieties by farmers however, many factors are considered; the availability and absorptive capacity of local markets to which farmers intend to sell their produce at fair prices; reduced or no increase in demand for family labor for both production and processing, transportation, little or no need for new inputs or difficult operations within prevailing cropping systems. Other micro environmental variables that combine to influence the adoption of new varieties could also include; road outlet for produce, quantity of planting cassava stem that is available for planting at any given time. II. ObjectivesoftheStudy The general objective is to determine the rate of adoption of improved cassava varieties in Epe area of Lagos State, Nigeria.On specific terms however, the objectives includes describing the socio-economic characteristics of both contact and non-contact farmers; identifying the number of innovations made on cassava and introduced to the farmers; determining the diffusion process of improved cassava varietiesand to predict the time that adopters of improved cassava varieties reaches peak. III. METHODOLOGY The area of study for this project is Epelocal government of Lagos state. With a land area of 3,577 square metres, the state is the smallest in the federation as it constitutes only 0.4% of the countries land mass. The state is bounded in the north and east by Ogun State, in the west by Republic of Benin and in the south by the Atlantic Ocean. Agriculture is the key occupation in Epe. Epe is a town and Local Government Area (LGA) in Lagos State, located on the north side of the Lekki Lagoon.Going by the 2006 census, the population of Epe was 181,409.The respondents for the study (contact, non-contact farmers and extension agents) were chosen from five purposively selected communities / towns within the local government. These towns are Epe, Itokin, Eredo, Agbowa and Ikosi.Two methods were used to generate primary data. First, a farm visit was conducted to view and sample field information through oral interviews on the subject matter. Secondly, a questionnaire was designed and administered on randomly selected respondents.Online materials, journals, government papers and research reports were useful sources of secondary data as well.The data so generated was analyzed using
- 3. The Influence of Contact Farmers on The Adoption of Improved Cassava Varieties in EPE, Lagos.. Manuscript id. 371428262 www.ijstre.com Page 3 descriptive statistics for the social economic status of the respondents, while Fourt and Woodlock, Mansfield, Bass Diffusion Models were used to analyze the diffusion process and prediction of adopters of improved cassava varieties in the study area. Mansfield Model n(t) = (q (N(t-1)/m) (m-N(t-1))..............................(i) Where q is the coefficient of internal (imitation) influence, n (t) is the number of adopters at time t, m is the potencial number of ultimate adopters, N (t-1) is the cumulative number of adopters at time (t-1). Assumption of this model is that the whole population may potentially adopt, and there are no innovators. Fourt and Woodlock model n(t) = p (m-N(t-1))..............................................(ii) Where n (t) is the number of adopters at time t, m is the potential number of ultimate adopters, N (t-1) is the cumulative number of adopters at time (t-1), and p is the coefficient of external (innovation) influence. In this model, the process of new production is affected by the assumptions that all adopters are innovators. The number of adopters at time t, n (t), decrease as time pass. Bass diffusion model The Bass diffusion model explain the process of how new products get adopted as an interaction between users and potential users. It was developed originally for predicting sales in the marketing and management fields, but has gradually become widely applied in other fields like agriculture and medicine (Kubok, 2009). For instance, Akinola (1986) analysed the adoption / diffusion of Cocoa Spraying Chemicals in Nigeria applying the Bass model. The basic assumptions of the Bass diffusion model is that the timing of a consumers initial purchase is related to the number of previous buyers, and that a behaviour simulated by the model is offered in terms innovative and imitative behaviour. The equation of the model is as follows; N(t) = N(t-1) +p(m-N(t-1)) + q (N(t-1)/m) (m-N(t-1)) ……………………(iii) Where N(t) is the cumulative numer of adopters at time t, m is the potential number of ultimate adopters, and p is the coefficient of external (innovation) influence, q is the coefficient of internal (imitation) influence. Bass specified the probability of adoption as a linear function of m, the total potential market, p, the coefficient of innovation (external influence) and q, the coefficient of imitation. In this result, the values for parameters p and q were estimated since m the cumulative and non-cumulative numbers of adopters were known from the survey. Prediction of Adopters Equation (iii) can be reorganized to give nt = pm + (q-p) Nt-1 + ( -q/m) N²t-1. ………......... (iv) Likewise, equation (iii) can be differentiated to find the time that a technology adoption reaches their peak. This is given by T(peak) = 1/ (p+q) Ln (q/p) .................................. (v) From the data collected, the cumulative number of adopters and number of adopter at any one time in the adoption process was known and this is used to determine the parameters p, q and m IV. RESULTS AND DISCUSSION Socio-Economic Characteristics of Respondents: The result in table 1, shows that 3% of the respondent are below 30 years of age. 36% fall within 30 – 40 years age bracket, 40.0% are within 41-50 years while 21% are quite above 50 years. In all about 78% of the farmers are below 50 years of age. This is supposedly a youthful and dynamic age bracket, so should be enthusiastic at trying something new. Olomola (1988) noted that old farmers were often conservative and would not want to take any risk even through adopting better technology and methods of doing things.
- 4. The Influence of Contact Farmers on The Adoption of Improved Cassava Varieties in EPE, Lagos.. Manuscript id. 371428262 www.ijstre.com Page 4 Table 1. Percentage distribution of respondents according to Socio-economic characteristics Variables Categories Frequency Percentage Age (years) Below 30 2 3.0 30 – 40 29 36.0 41 – 50 32 40.0 above 50 17 21.0 Sex Male 63 78.8 Female 17 21.3 Education Background Never been to school 4 5.0 Adult education 14 17.5 Primary School 18 22.5 Secondary School 21 26.3 Tertiary Education & above 23 28.8 Farm size (hectare) Below 1 hectare 16 20.0 1 - 3 hectares 33 41.3 4 - 6 hectares 25 31.2 Above 6 hectares 6 7.5 Source: Field Survey, 2015. The result further shows that about 79% of the respondents are male; this indicates that men are more into cassava production than women in the study area. Acquisition of formal education is a precondition for human development and it is even more important in agriculture because of the need for continuous adoption of innovation. Obibuaku, (1983) showed that formal education is an important tool for understanding scientific agriculture by farmers, and that new ideas and innovation in agriculture can only be effective when farmers are able to appreciate the need and understand its application in their day-to-day farming programmes. Table 1 shows that 5% of the farmers had no formal education, 17.5% had adult education. Cumulatively, those that had primary, secondary and tertiary education were about 77% of the total respondents. This group of farmers can be described as been relatively enlightened, for this reason, it becomes comparatively easy for them to understand and adopt new ideas and better methods. The result also shows that majority of the farmers (61.3%) cultivated area of land below 1 hectare and 1 - 3 hectares;this may be interpreted that cassava farmers in the study area are of small holdings. While 31.3% cultivated area of land between 4-6 hectares of land. However 7.5% of represents farmers who cultivated above 6 hectares of land. V. Diffusion Channel of Technical Information. In the adoption process, communication channels play an important role. The new ideas, in this case improved cassava varieties must be communicated to potential adopters in order for them to assess its attributes and decide whether to try it out and eventually adopt it. Often time, mediated communication and interpersonal communication play complementary, but different roles in the course of adoption Figure 1 below shows the frequency distribution of information source on agriculture technology. It is found that friends (57.5%) are a preferred source of agricultural information in the studied area. Extension agent and parent are the next ranked channels, each having 30% and 8.75% respectively, while least patronized source of information is relations, 3.75%.
- 5. The Influence of Contact Farmers on The Adoption of Improved Cassava Varieties in EPE, Lagos.. Manuscript id. 371428262 www.ijstre.com Page 5 Figure 1. Frequency distribution of information source on improved innovations Source: Field Survey 2015 Innovation on improved cassava introduced to farmers. The following innovations were introduced to the farmers; i) Improved Varieties ii) Planting Techniques iii) Spacing iv) Fertilizer Application v) Pesticide Application Out of the five new ideas introduced to the farmers, only three as listed below were mostly adopted; a) Improved Cassava Variety: 97/4673, 98/002, 98/0581 and 98/510. b) Spacing /Optimum Plant Population c) Herbicides. The study revealed that many of the farmers do not know the names of the improved cassava varieties, they care more about the period to mature and the extent of production compared to old varieties. Adoption curve Figure 2 shows the categories and percentage of adopters of improved cassava varieties in each category. The 5.0% of adopters fall within the categories of innovators (2.5%) among five categories of adopters which Rogers (Rogers, 1962) hypothesizes, 11.8% are early adopters compare to (13.5%) by Rogers, while 15% of adopters belong to the category of laggards as compared to Rogers 16%.The above result revealed that an adoption curve of improved cassava varieties in the area of study follows the hypotheses of the Rogers’s theory. Figure 2. Categories of adopters of Improved Cassava Varieties Bass model’s parameters In this result, the values for parameters p, q, and m were estimated since the cumulative and non-cumulative numbers of adopters were known from the survey. The optimum value of each parameter estimated by subjecting the available data to analysis is as follows; p = 0.005, q = 0.793, and m = 700.
- 6. The Influence of Contact Farmers on The Adoption of Improved Cassava Varieties in EPE, Lagos.. Manuscript id. 371428262 www.ijstre.com Page 6 The coefficient of imitation influence, q, is positive, and higher than the standard average value. (Vijay et al, 1995, q =0.38). This means that the diffusion process of improved cassava varieties is high, and that many farmers are fast to adopt and use improved cassava varieties due to the word-of-mouth recommendation from co-farmers. The high positive value also denotes that more farmers will adopt the new varieties / innovations at a fast rate whenever they hear about it prior adopters. The coefficient of innovation influence (p = 0.005) is positive but smaller than the average value (Vijay et al, 1995, p = 0.03). This implies that the use of broadcast media, advertising messages and other external influence on the potential adopter has very little effect on his choice to adopt the innovation. Thus, it can be deduced that even with improvement in media broadcast of the use of improved cassava planting materials, only a small fraction will adopt the innovation as compared to through word-of-mouth recommendation. Comparing Actual Adopter Number with Model Simulations The cumulative number of adopters was simulated by using the Bass Model, the Mansfield Model, and Fourt and Woodlock Model (figure 4). Figure 4 below shows that the estimation from the three models had a steady increase alongside the actual adopters till around 2010 where all the models and the actual adopters show an equal estimation of the prevalent number of adopters. The Mansfield and Fourt and Woodlock models indicated a close ally in their estimation up till 2010, but the estimated values from 2010 and above were evaluated greater than actual values. The Bass model gave a higher value of adopters almost throughout the period been considered. This clearly indicates the validity of the model. Figure 3.Comparison of actual cumulative adopters with model simulation Prediction of Adopters of improved cassava varieties. The cumulative number of adopters in 2011 estimated by Bass Model was 346, this value is widely different from the actual number of cumulative adopters abstracted through the survey (=140). On the basis of the willingness of farmers to adopt improved cassava varieties more through interpersonal relationship from co- farmers who had used the innovation, Figure 5 below shows prediction of adopter of improved cassava varieties estimated by the Bass Model during the period of 2005 to 2019. The estimated total adoption ceiling was 346 out of the estimated cassava farmer’s household (700) in the study Area. This is rather a high rate of adoption due to high coefficient of imitation influence (q= 0.793) from the analysis, which explains the reason why farmers will tend to adopt the use of improved cassava varieties when introduced by co-farmers already using the innovation. The time that adopters for improved cassava varieties reach peak was predicted by equation (5) in chapter three. The actual peak time was 2010, while the predicted peak time that number of adopters will reach the maximum will be 2015 (figure 4). This simulation shows that equation (5) is convenient for predicting the peak time. 0 50 100 150 200 250 300 350 400 450 500 2005-2006 2007-2008 2009-2010 2011-2012 Frequency Year Actual CummulativeAdopters Bass Model Estimation Mansfield Estimation Fourt and Woodlock Estimation
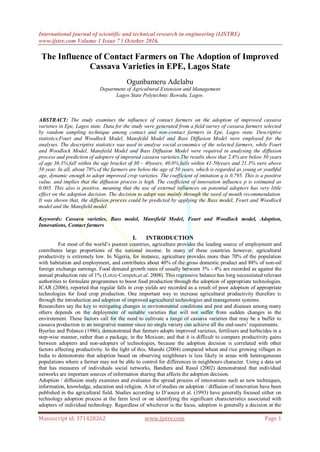
- 7. The Influence of Contact Farmers on The Adoption of Improved Cassava Varieties in EPE, Lagos.. Manuscript id. 371428262 www.ijstre.com Page 7 Figure 4.Prediction of adopters of improved Cassava varieties using the Bass Model 2005 - 2019 Limitations and Challenges Associated with the Adoption of Improved Cassava Varieties Many things could have been responsible for the adoption of improved cassavavarieties among the respondents. The factors and apparent constraints include status differences between extension agents and the contact farmers, lack of interagency cooperation both in program planning and implementation. Other constraints are inadequate transportation, ineffective network between contact farmers and extension agents, time constraints and most farmers generally want free input from the government, to the extent that some are not ready to learn anything. VI. CONCLUSIONANDRECOMENDATIONS The study reveals that innovations on improved cassava were introduced and adopted by the farmers, though not all were adopted. The level of adoption in this study area was satisfactory due particularly to the efforts of the extension agents, farmer’s friends and relations as well as contact farmers. The contact farmers in their own opinion believe that transportation and time militates against the adoption of innovation. Equally important is that the farmers are interested in free input from government as incentive for high level of adoption. Improving agricultural productivity is an important objective in making Nigeria self-reliant in food production. Some of the efforts of government at achieving this as shown in the study is making an impact on the peasant / small holder farmers who are the major producers of food in Nigeria. These efforts should therefore be intensified particularly through the extension agent / contact farmers who in turn should help the majority farmers to help themselves. In this way, the agricultural productivity will improved considerably. This study had successfully shown the various factors influencing the adoption of improved cassava varieties and the impact of contact farmers in the studied area. Farmers need to take full advantage of new technologies such as those studied to improve their standard of living. Based on the outcome of the study the following recommendations are therefore made: i. Emphasis should be shifted more towards interpersonal relationships than using broadcasting media in the course of disseminating new ideas to farmers. ii. The farmers could further be encouraged to adopt new ideas through some incentive packages such as providing other inputs at appropriate time and at subsidized rate and also providing a training centre in which the innovations can be taught. iii. Government should provide transportation facilities for the extension agent as well as the contact farmers. 0 20 40 60 80 100 120 140 160 180 2005-2006 2007-2008 2009-2010 2011-2012 2012-2013 2014-2015 2016-2017 2018-2019 Frequency Year Actual Non-Cummulative Adopters PredictedNon-Cummulative Adoptets
- 8. The Influence of Contact Farmers on The Adoption of Improved Cassava Varieties in EPE, Lagos.. Manuscript id. 371428262 www.ijstre.com Page 8 REFFERENCES [1.] Akinola, A. Amos 1986. An Application of Basss model in the Analysis of Diffusion in Cocoa – Spraying Chemicals among Nigerian Cocoa farmers. Journal of Agricultural Economics Vol. 37, Issue 3 pgs 395 -404 [2.] Bandiera Oriana, Rusal Imran 2002 Social Network and Technology Adoption in Northern Mozambique. Centre for Economic Policy Research (CEPR) Discussion Paper No 3341 [3.] Byerlee D., De Polanco E. H 1986. Farmers stepwise adoption of Technological packages Evidence from Mexican Altiplane American Journal of agricultural economics 68 (3), 519 – 527. [4.] D’souza G, Cyphers D, Phipps T (1993). Factors Affecting the Adoption of Sustainable Agricultural Practices. Agric. Resour. Econ. Rev. pp. 159-165 [5.] Feder G, Slade R (1984). The Acquisition of Information and Adoption of New Technology, Am. J. Agric. Econ. 66: pp 312-320. [6.] Indian Council of Agricultural Research (ICAR), 2006 Agricultural research and small farms In Agricultural Research Management. Ed Loebenstein G. and Thottappilly G. Indian Journal of Agricultural Economics, 56 (1), 1 - 23 [7.] International Institute of Tropical Agriculture (IITA) 2002. ICS-Nigeri Publications. [8.] International Institute of Tropical Agriculture (IITA)andNationalAgricultural Extensionand Liaison Services (NAERLS) 2001Information and Communication Support for Agricultural Growth in Nigeria (ICS-Nigeria), Project Document presented to United State Agency for International Development (USAID) Nigeria. Pp 19. [9.] Isham J (2002). The Effect of Social Capital on Fertilizer Adoption: Evidence from Rural Tanzania, J. Afr. Econ. 11(1): pp 39-60. [10.] Leonand Kiber Kubok,(2009). An application of Bass’s Model in the analysis of diffusion process of spring onion harvester; case study in the cultivated area, Ibaraki, Japan, journal of Ministry of Agricultural, Kenya. Volume, 43.3, 2009 pp 36-47. [11.] Lotze‐Campen, H., Müller, C., Bondeau, A., Rost, S., Popp, A., & Lucht, W. (2008). Global food demand, productivity growth, and the scarcity of land and water resources: a spatially explicit mathematical programming approach.Agricultural Economics, 39(3), 325-338. [12.] Munshi Kaivan 2004 Social Learning in a Heterogenous Population: technology diffusion in Indian Green Revolution. Journal of Development Economics. [13.] Obibuaku L.A (1983) Agricultural Extension as a strategy for Agriculture Tranformation. University of Nigeria Press Nsukka. [14.] Olomola A A (1988) Agricultural Extension and Production Efficiency. NISER Monograph series 4. Pp 63 [15.] Rogers M. Everett 1962 Diffusion of Innovations. 4th Edition The Free Press, New York. [16.] Vijay M., M., Eitan and Bass, Frank,1995. Diffusion of new products: Empirical generalizations and managerial uses, Marketing Science 14(3), G79-G88.