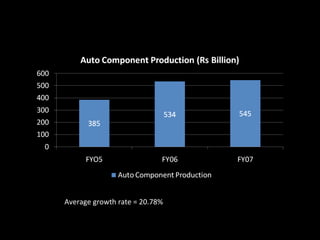
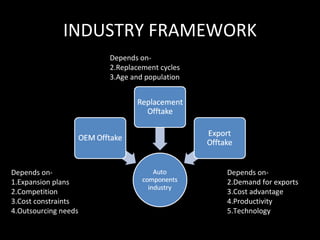
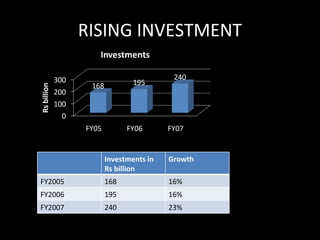
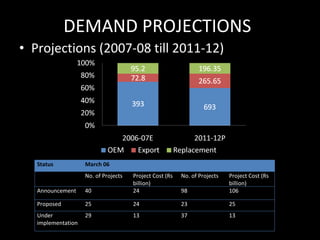
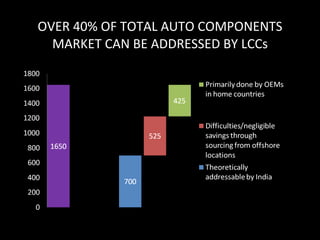
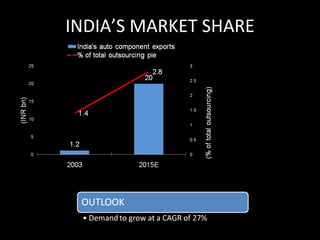
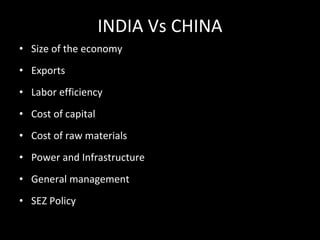
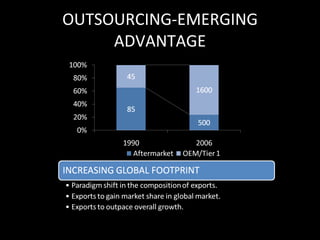
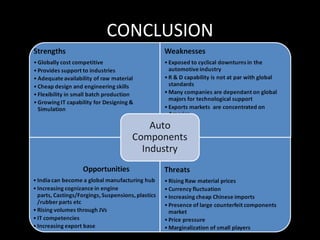
THE INDIAN AUTO COMPONENTS INDUSTRY “ Is it geared enough for emerging as a global manufacturing hub ” ICICI Bank Ltd. Faculty guide: Prof. Rajiv Shah Industry guide: Mrs. Arati Ramakrishnan Submitted by: VIJAY BUDHDEO PGDM 2007-09 TAPMI
PROJECT SCOPE
 
OUTLINE
Transaction and commercial banking Trade: LC,BG,Documents etc. Treasury: Forex, Derivatives etc. Working Capital: Line of credits, cash credit etc. Investment Banking Advisory M&A funding Corporate Banking Capex: Project evaluation
OUTLINE
Average growth rate = 20.78%
INDUSTRY FRAMEWORK Depends on- 1.Expansion plans 2.Competition 3.Cost constraints 4.Outsourcing needs Depends on- Replacement cycles Age and population Depends on- Demand for exports Cost advantage Productivity Technology
PRODUCTION DISTRIBUTION END USER SEGMENTS COMPONENT SEGMENTS
RISING INVESTMENT Investments in Rs billion Growth FY2005 168 16% FY2006 195 16% FY2007 240 23%
OUTLINE
SEGMENTWISE VEHICLE POPULATION
PASSENGER VEHICLE PRODUTION (‘000 Nos)
2/3 WHEELER MARKET Commercial Vehicles Market
 
DEMAND PROJECTIONS Projections (2007-08 till 2011-12) Status March 06 No. of Projects Project Cost (Rs billion) No. of Projects Project Cost (Rs billion) Announcement 40 24 98 106 Proposed 25 24 23 25 Under implementation 29 13 37 13
OUTLINE
GLOBAL AUTO COMPONENTS MARKET 2015
OVER 40% OF TOTAL AUTO COMPONENTS MARKET CAN BE ADDRESSED BY LCCs
INDIA’S MARKET SHARE
TARGET MARKET SEGMENT Propensity to offshore HIGH LOW Market Sophistication HIGH LOW
INDIA Vs CHINA Size of the economy Exports Labor efficiency Cost of capital Cost of raw materials Power and Infrastructure General management SEZ Policy
OUTSOURCING-EMERGING ADVANTAGE
OUTLINE
IMPACT ON THE AUTO COMPONENTS INDUSTRY Increased regulations to boost replacement market demand Excise duty on auto components reduced VAT eliminated cascading impact of prices Export benefits to intermediate suppliers
 
 
TYPICAL SUPPLY CHAIN Tier 2/3 Suppliers Tier I Supplier Subcontractors from various industries OEM Manufacturer
 
RAW MATERIAL COSTS Largest contributor to the total cost structure
RAW MATERIAL PRICES
EXPANSION IN STEEL PRODUCTION
ALUMINIUM PRICES
CURRENCY APPRECIATION Gradual appreciation will lead to better absorption. Input costs serve as a hedging tool. Shift in the composition of exports. Change in type of liabilities.
 
 
BHARAT FORGE-DE RISKING MODEL
ENDURANCE TECHNOLOGIES LTD. Products  – Suspensions, brake systems, transmissions, die alloys, alloy wheels Aluminium casting – No.1 in India Turnover  – 2600 Cr Recent acquisitions  – Fondalmec, Amman Druck Guss, Pioli Spa
PRODUCTION STRATEGY Procuring components from Tier II suppliers Strong Vendor Base – Global Sourcing dept Vendor upgradation – Collaboration Suppliers given 1 yr contracts Price rise: Domestic   Absorbing Exports    Not absorbing Diversification – Mfg. of Antenna towers Cell phone casting
RISK MITIGATING STRATEGIES Borrowings in foreign currency Converting liabilities into $ Interest rate swaps Imports    Forward contracts If imports are in $    Buyer’s credit Opening of Letter of Credit Helps suppliers service orders
 
RECOMMENDATIONS FOR THE AUTO COMPONENT INDUSTRY
AVAILABLE STRATEGIC POSTURES
RECOMMENDED INITIATIVES
 
CONCLUSION

The Indian Auto Components Industry Latest

Editor's Notes

  • #8 This slide gives us a picture of the size of the auto components industry The average growth rate for the auto components industry has been 20%.
  • #9 The auto component industry offtake is segregated by three segments 1. 2. 3. OEMs continue to make up the largest share of the auto component demand
  • #10 Further OEMs can be classified according to vehicle segments. Within this segment, Passenger vehicles and commercial vehicles constitute the majority. Also, the total auto component production for 2006-07 break up is 70 – OEM 17 – Aftermarket 13 – Exports Division by component sub segments shows that engine and drive transmission parts constitute around 50 per cent of the total production.
  • #11 Rising production is being supported by rising investments. The need for higher investments remain as cap. Utilization for many companies is high. According to the automotive mission plan, the total auto components industry is expected to be worth $375 bilion. India aims to capture $20-25 billion of this opportunity. This wud require massive invstmnts. Indian AC mfgers enjy gud qlty certification. 90 per cent of co’s listed with ACMA have ISO 9000 certi. These enhancements in quality standards have led to reduced defect rates. 13 Indian co’s have received the Deming application award out of which 9 were auto component firms.
  • #13 Demand for auto comps mainly depends on automobile production n population. Recently, due to rise in exports, the dependance on the domestic sector has reduced. With the economic grth of the country and influx of foreign car makers, the total vehicle population has steadily increased.
  • #14 This segment comprises of cars and MUVs. 2001-06, the CAGR of the passenger veh segment was 18%. Currently due to rising inflation, rising steel and fuel prices market is expected to remain flat. However the grth is expected to continue post 2010. With more global OEMs setting up bases and production of 1 lac and $2500 cars, there are plans of significant capacity addition.
  • #15 The two and three wheeler segment has grown at a CAGR of 16% and 27% between FY02 and FY07. The CV segment has registered impressive grth over the past three yrs. Change in govt regulations and positive macro economic fundamentals have helped. Demand is expected to grw in long term at 9% on the bac of industrial grth and increasng infra. Also the US CV market which is down, is expected to improve.
  • #16 Slide point India has a comparative advantage especially in 2,3 wheeler and small car market. Slide point Europe and US constitute more than 60% of total exports from India.
  • #17 The composition of the auto component industry pie is expected to undergo a change over the next five years. Exports are expected to take the lead in the growth of the industry and are expected to grow robustly. According to a research carried out by CRISIL, the auto component industry is expected to grow at a CAGR of 16 per cent till 2011-12. The share of exports is expected to rise from 13 per cent to 23 per cent over the five year period. the increase in OEM offtake is expected to grow at a slower rate. With increasing rupee appreciation and rising borrowing costs and fuel costs, the growth of the auto component industry is expected to remain flat in 2007-08. In 2011, share of OEM is expected to be 60%. However, outlook remains positive, with more and more global OEMs setting up base in the country. This would result in a boost in the demand for auto components from them on account of maintenance of certain levels of indigenization. Also OEMs would also be exporting from these manufacturing bases. This would add to the rise in demand of auto components. The target of the Ministry of Heavy Industries is to export reach a level of $20-25 billion of exports by 2015.over the last four years exports have grown at an average of 30 per cent every year. However, with the rupee appreciation, the exports are expected to grow at 15-18 per cent. The reason for estimating the growth rates at 15-18 per cent against adverse economic condition and tightening of norms in USA and Europe is increasing levels of component outsourcing by global OEMs. As mentioned previously, the production size of the auto component industry is expected to touch Rs 1155 billion (Rs1650 billion in value terms) by 2011-12. After observing select players in the market, it was seen that the asset turnover ratios have shown an upward trend in the past few years. Particularly fixed asset turnover ratios have been on the rise. This implies that the firms have been able to utilize capacities more efficiently and have been able generate high sales from the fixed assets. Assuming a fixed asset turnover ratio of 2- a fixed asset base of at least Rs 825 (1650/2) billion would be required by 2011-12. According to CRISIL research, the current base is Rs 350 billion. This implies that additional investments of Rs 500 billion would be required over the nest five years. CAPEX announcements
  • #19 In 2003, the global automotive industry was estimated at USD 1.2 trillion. Major importers of auto components are US, Europe and Japan. The global market is expected to grow to USD 1.65 trillion by 2015, at a CAGR of 2.7%, with LCCs like India, China, Brazil, and Thailand enjoying an increasing proportion of outsourcing. This is because OEMs continue to face pressures on prices due to a competitive market. Moreover, these LCCs are a source of cheaper components providing 15-35% cost savings, depending on the extent of value addition. - Explain the graphs
  • #20 -Explain blue, red, green This would imply an export CAGR of 19.3% from LCCs like India, Thailand, and China. In 2003, only 7% of the USD 1.2 trillion auto component market (USD 84 bn) was being outsourced to LCCs, of which, Indian exports accounted for 1.2 bn, or 1.4%. The reasons for the sluggish growth in exports have been long development cycles to rope in new customers, lack of scale and capacities, inadequate working capital to deal with large export orders, and risks of currency fluctuations, which act as a deterrent for smaller players
  • #21 The source of India’s competitive strength is its vast pool of qualified engineers and cheap labor. This facilitates the use of labor intensive processes and indigenizing capital equipment allowing manufacturers to rework their processes to lower costs. Also, the large base of engineers enables cheaper designing, development, and tooling of auto components. Amongst the total outsourced components to LCCs, India’s cost advantage lies mostly in steel, cast iron and rubber parts, and components involving engineering and technical inputs and skilled labor; these include castings, forgings, and assembly parts. Based on these parameters, ACMA-McKinsey estimates auto component outsourcing to India to increase from the current USD 2.9 bn to | USD 20bn by 2015, implying a CAGR of 27%. India is likely to grow its market share in the overall outsourcing pie from 1.4% in 2003 to 2.8% by 2015.
  • #22 India has an advantage over other countries in skill-intensive parts such as machined gears and machined exhaust manifolds as they require high-process engineering or tooling. India is also competitive in simple labor-intensive parts such as labor harness and seat covers and steel/iron/rubber intensive parts such as battery trays and cast tow hooks. India’s competitiveness is emerging in parts of evolving technical aggregates such as machined camshafts and finished aluminium cylinder block for cars. Offshoring within this category is low since the rapid pace of innovation, high interaction and proprietary technology predicates onshore production. -We can also segment the addressable market by market type. The division is on the basis of market sophistication, propensity to offshore and size of platform. Based on these parameters, North America and Western Europe are very attractive markets. This is because the propensity to offshore in this segment is high and the volume per platform is small. This augurs well for Indian suppliers as their size is small. Global aftermarket and the PLV market of North America and Western Europe is also attractive. They also have a high propensity to offshore. The constraint in targeting these markets is that this segment requires high volume platforms. The Chinese market is comparatively less sophisticated, but the propensity to offshore is also low as they already have low labor costs. The Japanese market is already very sophisticated, and as of now has fewer propensities to offshore.
  • #23 The Chinese economy is approximately 2.5 times the size of India. In terms of purchasing power parity, China is much ahead of India. The sectoral composition of the GDP of the two countries is also different. While India is a service sector dominated economy, Chinese economy has a substantial proportion of manufacturing sector (35 %). The major difference between the two countries is the ability to attract FDI inflows. According to a study by China in 2010 FDI in China would be in excess of 80 bn US $, whereas India would be able to attract approximately 15 bn US $. Despite these differences, real GDP growth rate projections are similar for the two countries in the next decade and higher relative to Brazil and Russia The Chinese auto component industry exports 30-35 per cent of its production. Chinese export market is about 6 times that of Indian auto component exports ndia exports a sizeable percentage of its vehicle production (small car segment). However due to the geographic differences between the two countries and differing domestic demand, China exports virtually none of its cars. Chinese cars are larger in size and hence have more components common with the world market. This is where China enjoys product advantage compared to India. China’s process advantage comes from cost advantages in lower duties, good infrastructure and lower logistics cost, and more productive labor and stable wage rates. The overall labor productivity of China is higher than India. Overall, for automakers and auto component manufacturers, the labor costs are similar. The real interest rates in China have shown a declining trend after 2000, whereas the interest rates rose in India from 6.4 to 7.8 percent post 2000. China has a higher cost of raw material due to high volumes of steel import. This is on the back of huge infrastructure growth and rising domestic demand. indian auto comps industry faced presurre of indigenization. Also indian players had to adhere to quality standards to retain customers. Power cost is lower in China by 30-40%. According to an ICRA report, the transit time to the US is 2-3 weeks for China while 6-12 weeks for India However, in terms of performance and use of resources, Indian firms have done better. Indian firms are able to make profit despite pressure from OEMs in relation to costs. Indian firms are better at utilizing capital. India has a better IT industry having widespread applications in the economy. A strong banking sector, emphasis on accountability to shareholders, and transparent reporting practices has helped the industry to achieve high turnover ratios and high return on capital employed. 5 SEZs in Jharkhand, Maharashtra, West Bengal and Haryana devoted to automobile and auto component manufacturing envisaging an investment of around Rs 35.94 billion. Special auto component parts. While in China SEZs focus on attracting attract foreign investments and modern technology, in India the emphasis has been on exports. . Although India has a large domestic market, it has failed to lure SEZ investors.
  • #24 Over the years, there has been a paradigm shift in the composition of exports by Indian auto component manufacturers. There has been a shift from supplying primarily to the aftermarkets, to catering to Tier 1 vendors and global OEMs directly. Earlier, capex in the auto component industry largely tracked the domestic auto sector. Hence, Indian manufacturers did not have the capacity and expertise to handle large foreign orders. Moreover, from the buyer side there existed risks like delay in shipment, currency risks, high working capital requirements and risk of overseas plant closure. Thus only the larger players were able to meet these requirements. As a result, export growth has been more prominent for larger players who have the capability with exports. Large players like Amtek Auto and Bharat Forge have made international acquisitions and are establishing themselves in strategic markets. Leveraging these markets would grant access to large global customers.
  • #26 In order to discourage the use of old vehicles, the government is trying to introduce a legislation specifying the maximum number of years a CV will be allowed to ply. After tightening of regulations on scrap, the auto component industry is expected to face increased replacement demand. - In January 2004, the government announced continued to provide export benefits to intermediate suppliers of auto components against the duty-free replenishment scheme. This benefited auto component manufacturers like Hyundai Motors India Ltd, Bajaj Auto Ltd., and Tata Motors who supply components to OEMs. The benefits included: Duty drawbacks Refund of terminal excise duties. Advance license for duty- free imports of inputs.
  • #28 Basically, first tier suppliers produce different parts and accessories for the assemblers, while sourcing smaller parts, modules and components from relevant second tier suppliers, which in turn are supported by a number of third tier suppliers as well as sub-contractors from various industries. Thus, in effect, an assembler is supported, directly or indirectly, by hundreds of second and third tier suppliers at the same time. - Each OEM manufacturer has its own sourcing system. Sourcing from first tier suppliers is largely in a module form. But sourcing for smaller parts and components for the assembly of modules is the job of first or second tier suppliers. It is the onus of the Indian companies to target a section of the supply chain. Thus they will have to identify whether their products would go directly to the OEM manufacturer or to a 1 st /2 nd tier supplier. The OEMs are adopting lean management systems and are resorting to JIT production. This has increased the pressure on Tier I and Tier II suppliers to reduce their delivery schedules. This makes geographical proximity to the OEMs very important. trying to enter the Chinese market may need to find several agents for different regions. Agents and distributors are geographically contracted for the automobile and auto parts market for each region. It is much easier for foreign manufacturers to enter the local market through technical cooperation with technology licensing and technology exports Vendor selection is a very important requirement if the company concerned is a new supplier to the OEM. Vendor selection would involve company audit, quality control, R&D, conformity with environmental standards etc.
  • #31 Raw material costs constitute approximately 60% of the total cost of production. They are the largest component of the total cost structure. The other costs are labor costs, power and fuel costs, and selling and distribution expenses. For endurance: 50% aluminium Procuring 6000 tonne per month Local procurement: DOL 1 yr contract: giving share of business Reviewing contract prices every 3 months Partnership: endurance-bajaj auto Employs 4000 ppl across 19 plants
  • #32 Different varieties of steel are used in the automobile industry. These include both flat and long products. Steel sheets and coils are used extensively for manufacturing components. The prices of steel products have been on the rise since 2006. In FY07, steel prices rose by around 18 per cent driven by buoyant domestic and international demand and rising costs. Significant capacity additions have been made in this sector to meet the rising demand. Also, the government is also looking to keep a check on steel prices as they can create inflationary pressure. Add: Fuel price hike Mfgers are changing the composition of RM More plastic( same strength, weight difference)
  • #33 prices are also influenced by supply side factors. The capacity of production of steel is improving in the subcontinent. India and China have ramped up their steel production capacities. IISI estimates the steel production from BRIC countries to increase by 11 per cent in 2008 and by 10.3 per cent in 2009.
  • #34 Aluminium is gaining importance in terms of increase in composition in alloy components. Its light weight properties help vehicle makers to reduce the weight of cars and make them meet emission norms. Aluminium is primarily used in manufacturing suspensions, brake systems, transmissions, dyes and alloy wheels. Aluminium prices rose by around 30 per cent during 2006-07.
  • #35 The auto component industry is partly based on exports. Recently, many auto component firms are raising concerns over the impact of rupee appreciation on their margins and earnings. The rupee had appreciated by more than 10 percent against the dollar since the beginning of 2007. Also, the US housing slump and fears of recession can have a negative impact on many Indian firms. The industry will be better placed if the rupee appreciates by 3-4 per cent. This would not hurt the margins of the players. Also, with the appreciating rupee, many Indian exporters are renewing their supply contracts in Euro currency. Euro has remained firm against the rupee. Also, most of the acquisitions of Indian companies have been in Europe in Euro currency. Apart from currency hedging, levers in the form of productivity improvement scale of economies, designing and engineering efficiency can be used to protect the margins against the rising rupee.
  • #38 BFL has adopted a strategy of de risking its revenue model to ensure its margins and growth levels. BFL has forayed into the non-automotive sector and plans to increase the production share of non-automotive business from its current level of 17% to 25% in the next 2 years. Keeping in line with its de risking strategy, BFL has made efforts to move up the value chain. As part of its non-automotive capacity expansion program, BFL has started a new plant at Baramati. It expects commencement of production from these plants in 2009. This will mark BFL’s entry into the non-automotive sector in a big way and significantly boost its top line growth. - endurance: has also diversified its castings business. It manufactures antenna towers for Nokia, Siemens.
  • #43 India-based suppliers can choose from among five potential strategic postures based on their starting positions, aspirations and appetite for risk. These strategic postures would reflect the target market and the type of components that can be manufactured. The possible strategic postures are: local player, India-based global player, LCC-based global player, aftermarket player and technology sourcer. A local player primarily focuses on the domestic market, and opportunistically other developing markets An India-based global player has its manufacturing base in India and he targets components where India enjoys an advantage over other LCC’s. An LCC-based global player would focus on components where India competes equally with other LCC’s and would create a manufacturing footprint beyond India to include other LCCs. aftermarket/ replacement market player would target the global aftermarket business. Lastly, a technology sourcer would seek technology from outside India to primarily service the domestic Indian and other emerging markets.
  • #45 India-based global players Build engineering competencies through process engineering (funding structured pipeline of well-scoped projects) Creating an offshore front end (offshore sales department staffed with local industry insiders. Sound key account management systems with consultative sales approach. Significant risk appetite and a global mindset. Globally competitive compensation should match globally competitive talent. LCC-based global players Support customer with ongoing, engineering-led cost reductions: could be India based. Apart from creating effective offshore front ends (through sealing upfront contracts to serve large international OEMs/Tier I’s), they will need to create a global manufacturing footprint with manufacturing presence in multiple LCC’s, especially China. Flexibility to manage multi-location, multi cultural workforce. To rapidly build market presence, the strategy should be to acquire small firms in emerging markets. A pre-requisite to the acquisition agenda will be the synergies generated post the merger and the abilities to build and maintain a global talent pool. MENTION ENDURANCE:
  • #46 Local players Their competitiveness depends on good networking with suppliers and strong operational excellence. They need to continuously upgrade their processes and machinery and re-engineer their skills. Respond to the export enquiries from international purchase offices of large buyers. Strengthen vendor relationship and expand value add. ( assembly skills, co-development of products ) Develop in house R&D department and extend those skills to other markets. For products where India’s competitiveness is low, Indian companies should deepen relationship with OEMs by supplying parts from other categories. Consider sourcing uncompetitive parts from other countries. They should have the operational efficiency to produce evolving technology cost effectively at low scale. The aftermarket players will have to develop the ability to manufacture high variety low volume parts cost effectively, manage complex supply chains and develop strong wholesale and retail relationships.