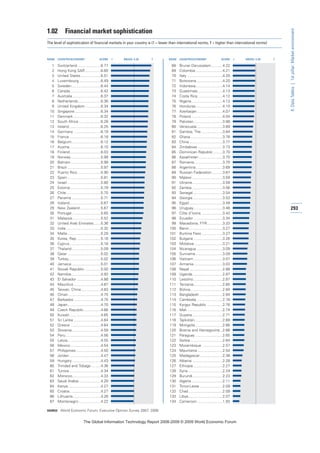
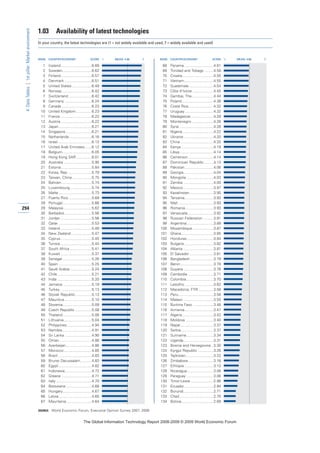
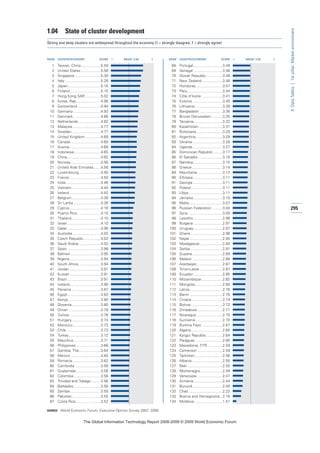
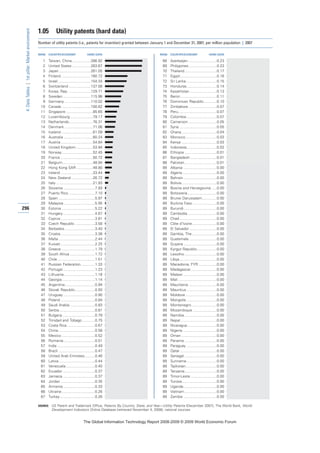
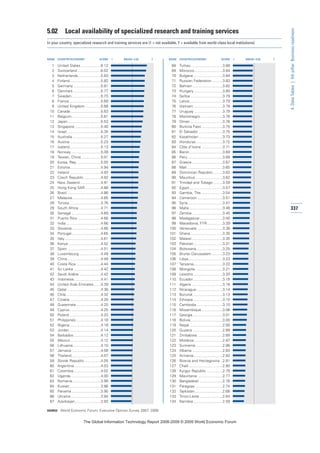
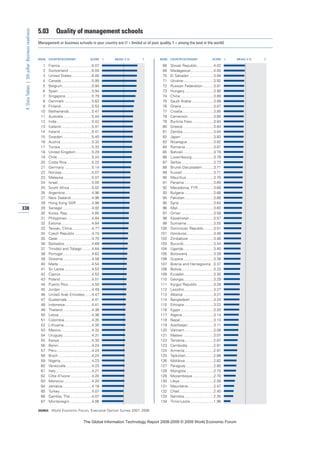
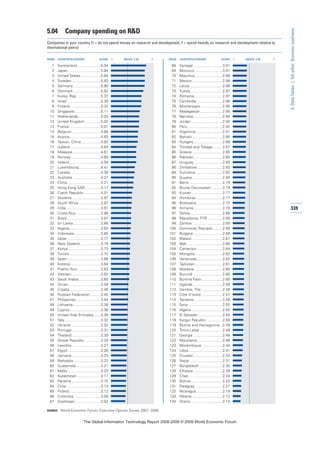
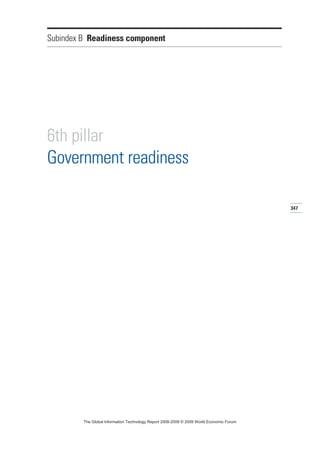
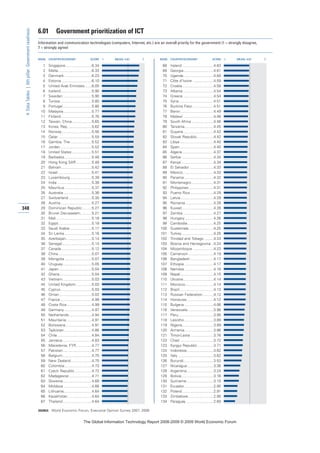
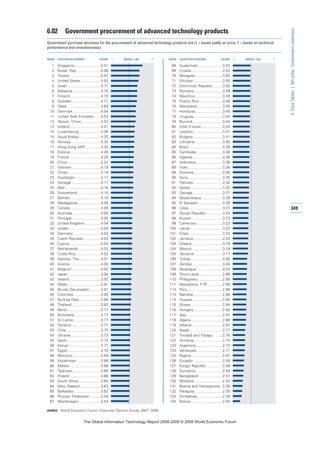
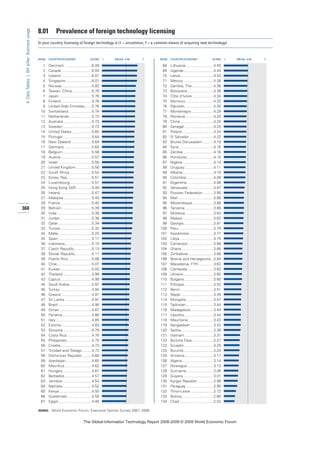
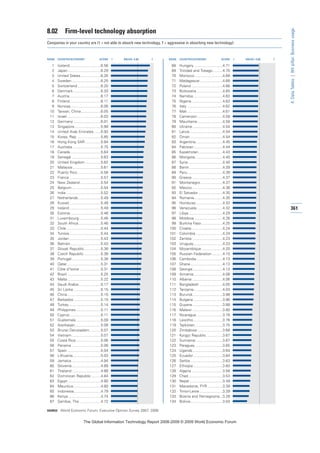
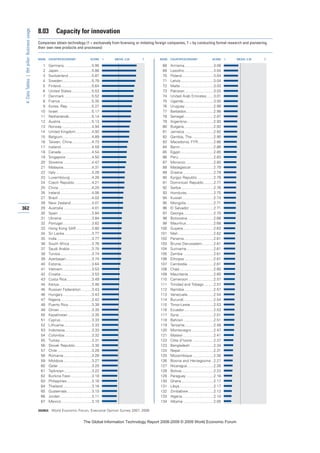
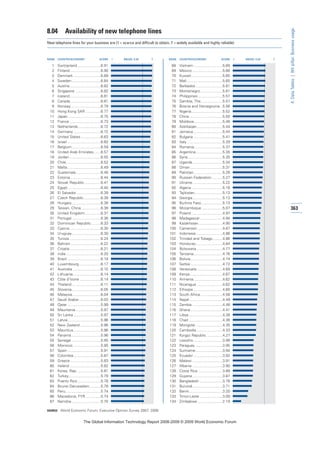
Download to read offline


![CHAPTER 1.4
How to Maximize the
Economic Impact of Mobile
Communications:
The Four Waves
LEONARD WAVERMAN, Haskayne School of Business, London
Business School, and LECG
KALYAN DASGUPTA, LECG
Ever since man hunted the mastodon, the ability to
communicate over ever-expanding distances has been a
key element of human success and advancement. But
the modes of communication available and the power of
the telecommunication technologies that people utilize
have increased dramatically in the last 150 years with the
advent of telegraph, telephone service, and now wireless
(mobile) networked telecommunication services offering
applications such as email and Internet access, and the
ability to ignore geographical limitations in the organi-
zation of economic and social interaction. Further,
progress in telecommunications has been neither linear
nor even.The pace of development and innovation has
increased in the last 25 years, resulting in an increasingly
boundary-less world. Many of these developments have
become an integral part of our daily lives—wireless
telephony, Internet usage, and email—and yet just 15
years ago, these were “early stage” technologies, at least
from a consumer perspective.
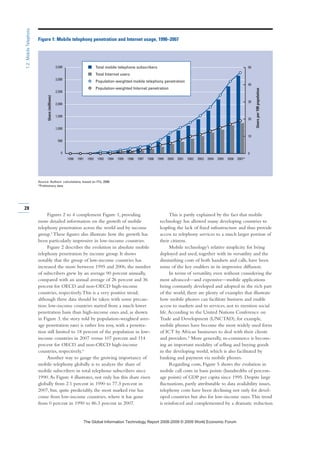
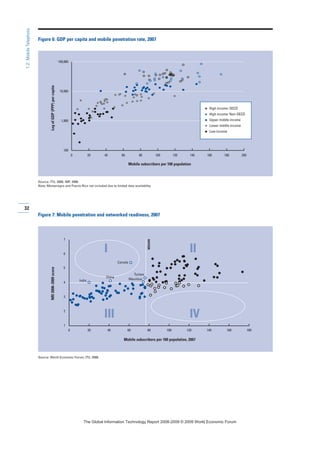
The first submarine telephone cable was laid in
1956, just 52 years ago.TAT–1, the joint venture of the
UK government and ATT—a project that was worth
£120 million—was one of the three engineering marvels
of the 1950s (the other two were Sputnik and the
TransCanada Gas Pipeline).TAT–1 had a capacity of 83
simultaneous voice signals. Prior to TAT-1, international
calls from NewYork to London were wireless! (The
calls were made via radio waves bounced off the
stratosphere.) In 1970, according to the International
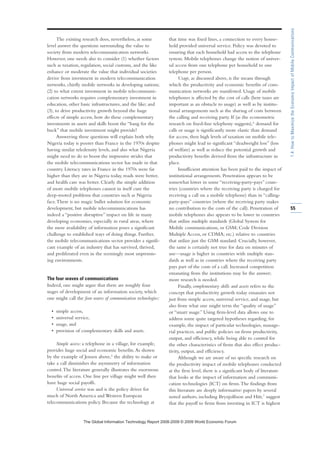
Telecommunication Union (ITU), there were just 8
telephone lines per 100 inhabitants in France, a number
that rose to 30 by 1980, and, with the advent of mobile
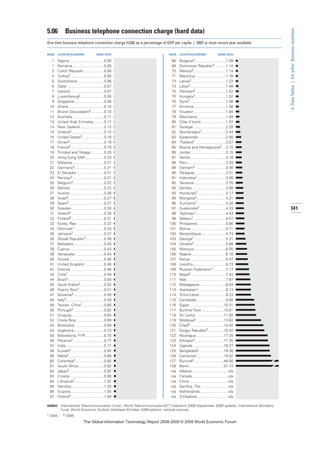
telephones, 141 lines (fixed and mobile) per 100 inhabi-
tants by 2006 (see Table 1).Today we take relatively
affordable and reliable long-distance services and near-
universal mobile and fixed telephony for granted in the
developed world. Yet these examples demonstrate just
how recent the modern telecommunications environ-
ment is, even in an affluent country such as France.
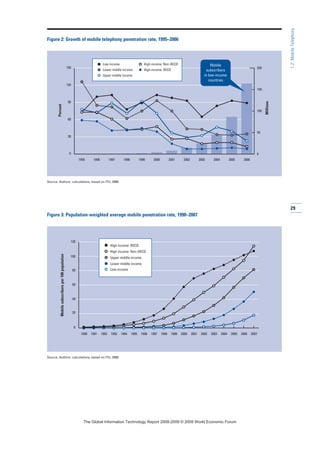
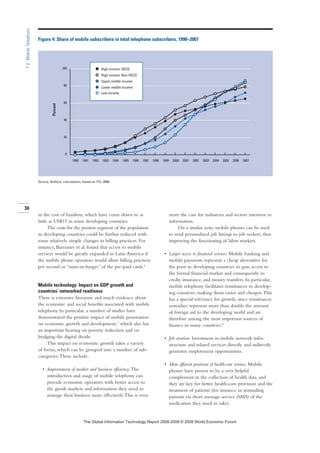
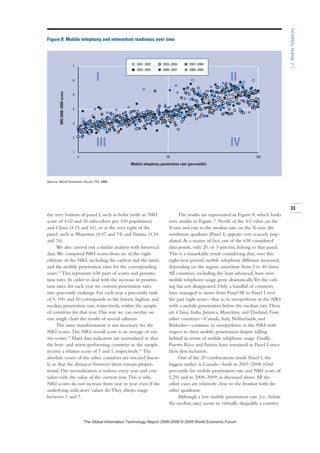
In the developing world, the modern telecommuni-
cations environment has largely been created by mobile
telephony. Malaysia went from having 1 fixed telephone
line per 100 inhabitants to 9 fixed lines per 100 inhabi-
tants in 1990, to 92 lines per 100 in 2006, with a mobile
penetration rate of 75 per 100. Even more tellingly,
Nigeria achieved a teledensity of 25 lines per 100
inhabitants in 2006; 24 of these are mobile telephones.
As a result of mobile telephony, teledensity in Nigeria
today is at levels similar to that of France in the late
1970s, a remarkable achievement.As Mo Ibrahim, the
founder of Celtel, has written,“Fixed lines can never
connect Africa: less than 1% [of the population] in
Sub Sahara Africa [were connected] 100 years after
development of the phone.”1
Three questions immediately come to mind: first,
what has been the impact of the significant increase in
teledensity on economic output and welfare; second, if
53
1.4:HowtoMaximizetheEconomicImpactofMobileCommunications
7KH *OREDO ,QIRUPDWLRQ 7HFKQRORJ 5HSRUW ‹ :RUOG (FRQRPLF )RUXP](https://image.slidesharecdn.com/theglobalinformationtechnologyreport2008-9-130704121750-phpapp02/85/The-global-information-technology-report-2008-9-71-320.jpg)


This document is the introduction to the Global Information Technology Report 2008-2009. It discusses the following key points: - The report examines the state of networked readiness around the world and presents the latest Networked Readiness Index rankings. - It focuses on the theme of mobility, highlighting the remarkable role of mobile telephony in economic growth and how mobility has become a critical enabler of connectivity. - The report features chapters from industry experts and academics that analyze topics such as maximizing the economic impact of mobile communications, ensuring ubiquitous internet access, and fostering global collaboration and innovation in information and communication technologies.


