This document is the introduction to the Global Information Technology Report 2010-2011. It was edited by Soumitra Dutta of INSEAD and Irene Mia of the World Economic Forum. The report examines the networked readiness of economies worldwide and explores ICT-enabled transformations. It contains country profiles, case studies on best practices, and chapters on topics such as the emerging internet economy, building communities around digital highways, and the promise of technology. The report aims to assess networked readiness for the 10th year and analyze Transformations 2.0 brought about by information and communication technologies.


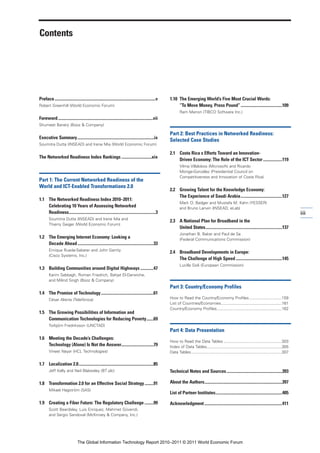


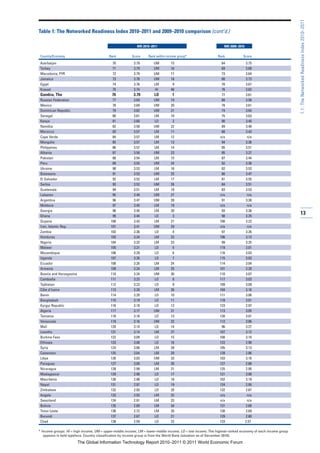
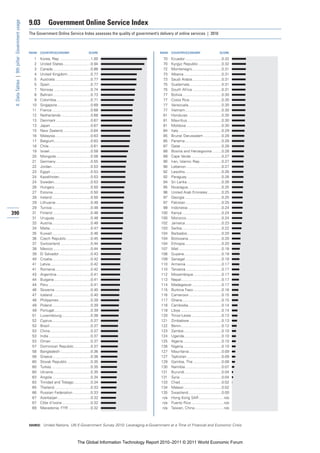
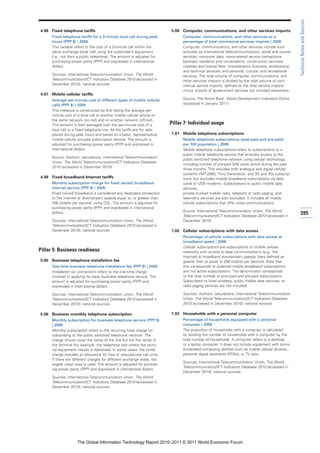
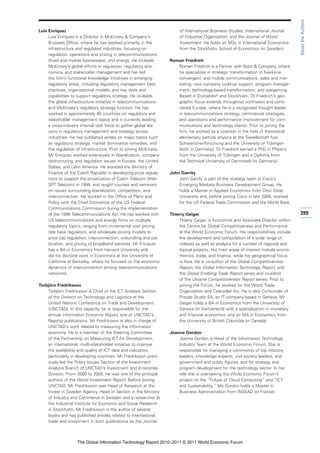
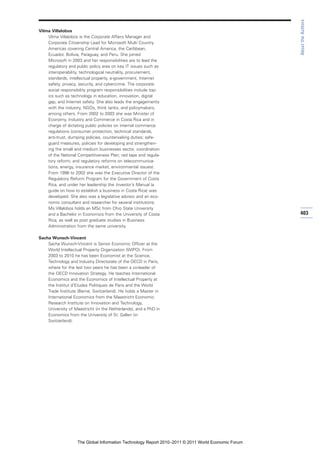
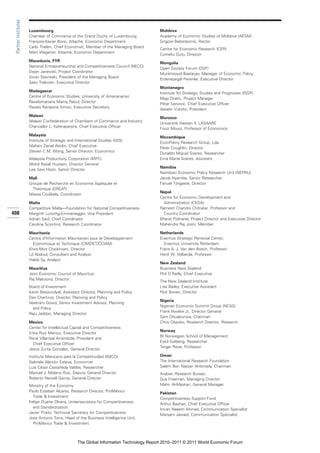
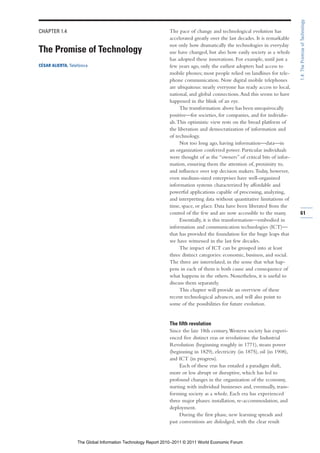
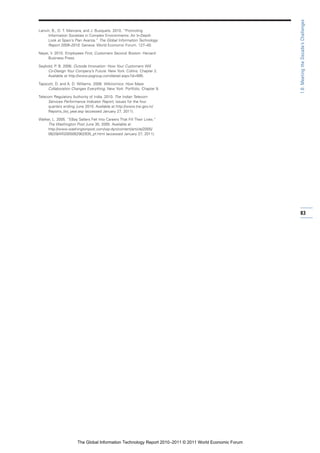
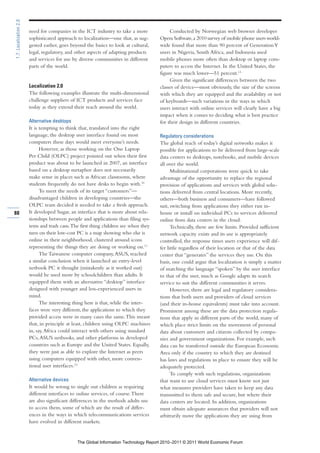
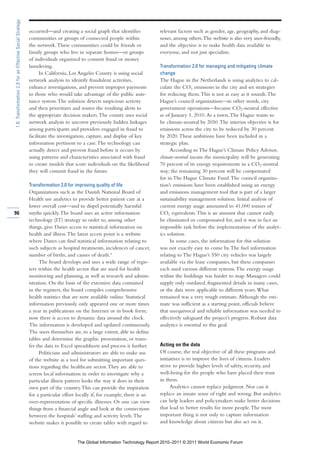
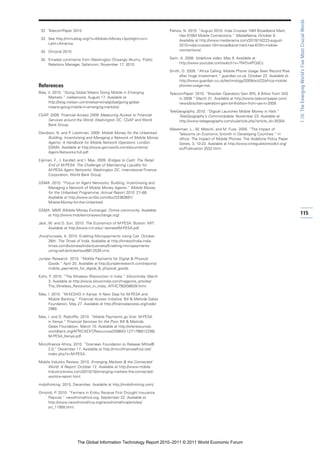
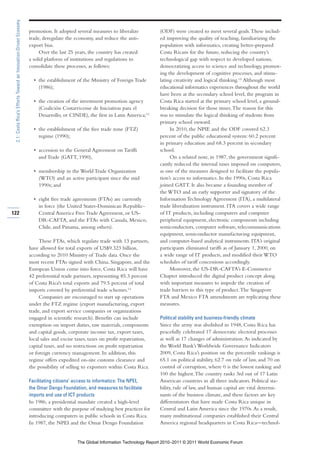
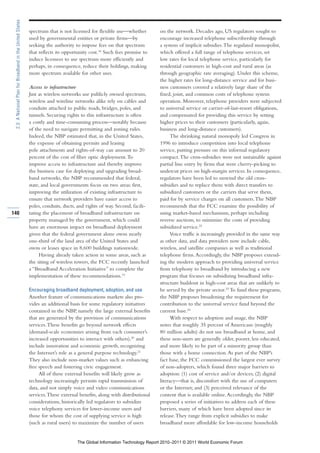
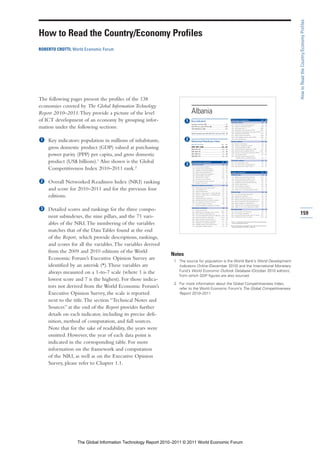
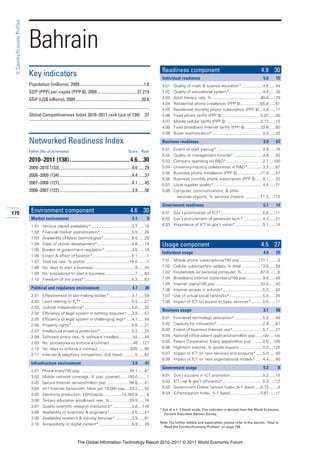
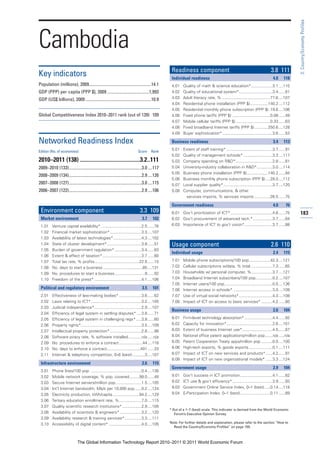
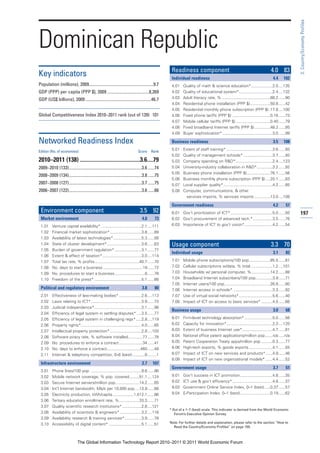
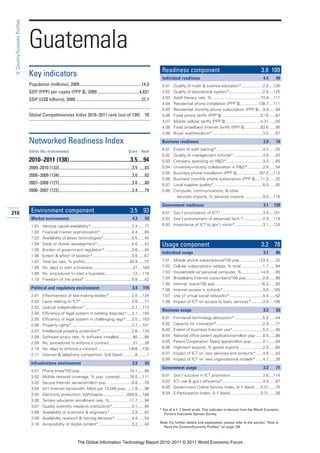
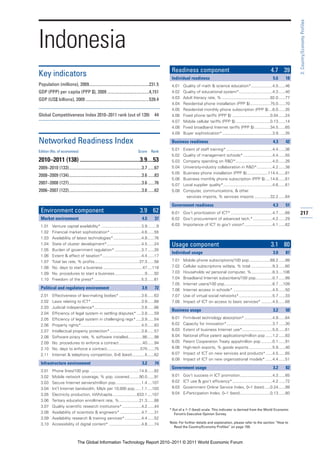
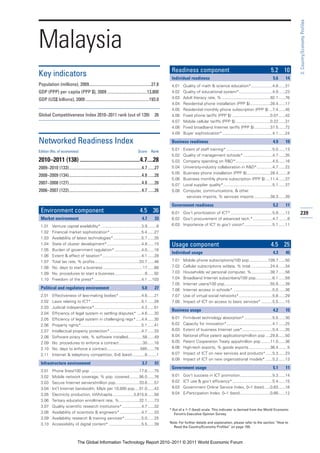
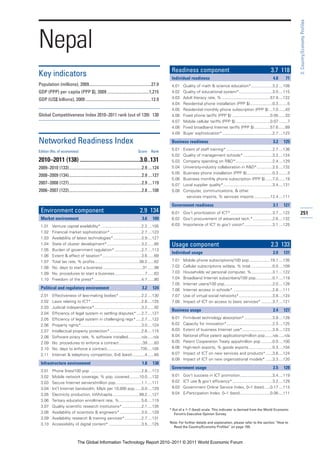
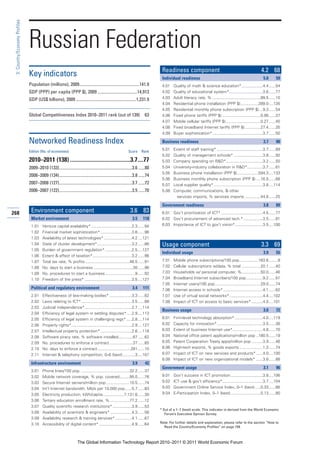
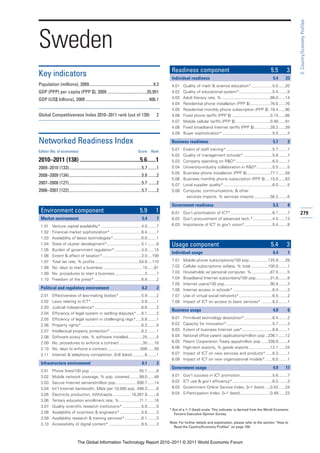
![1.1: The Networked Readiness Index 2010–2011
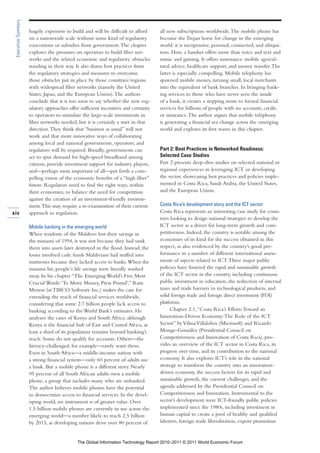
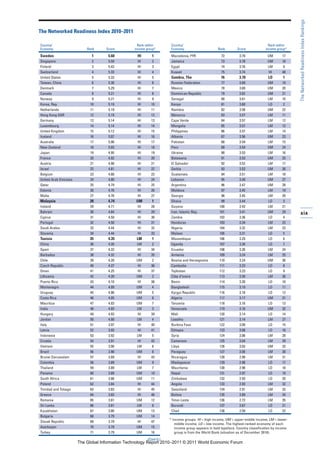
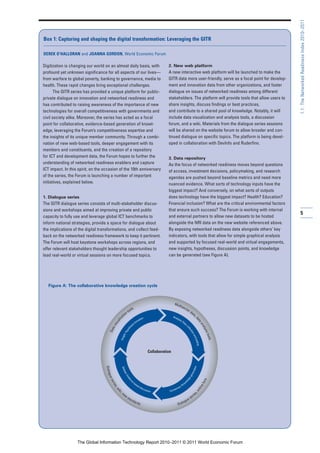
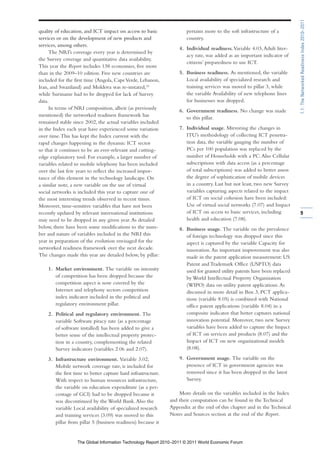
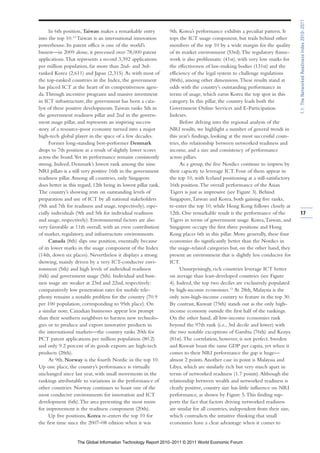
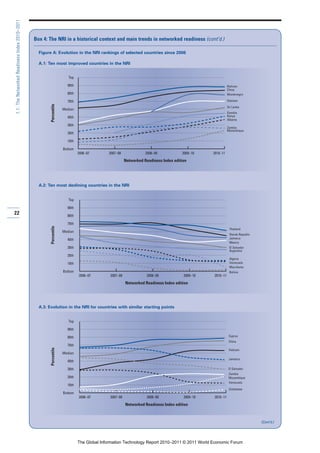
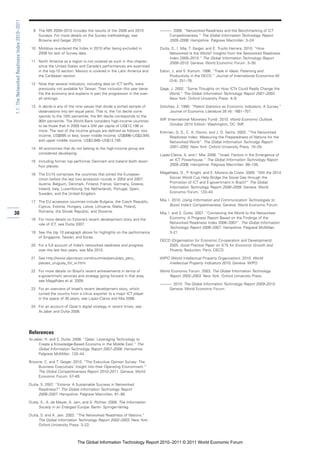
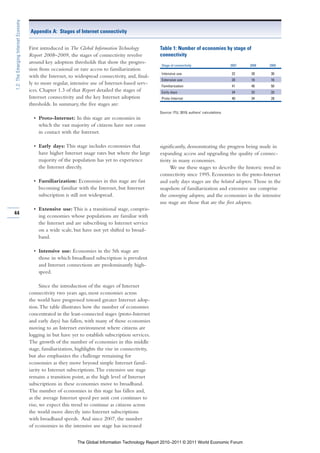
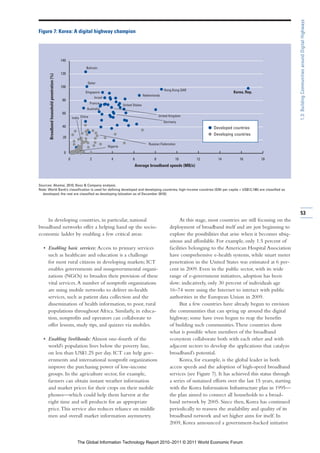
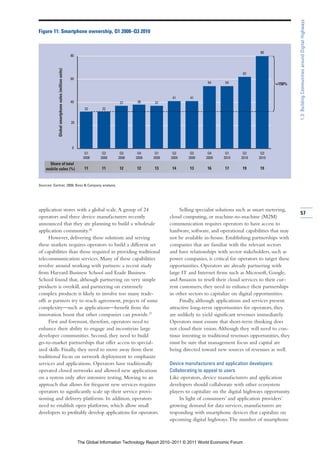
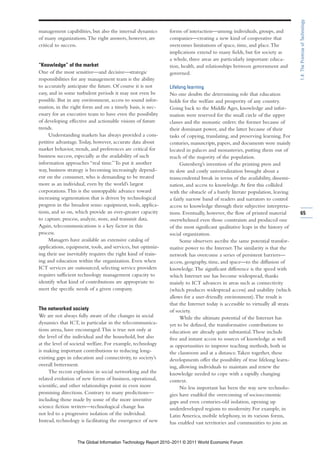
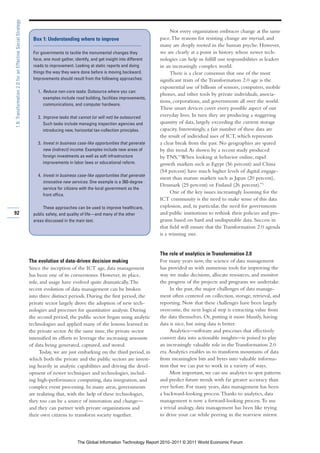
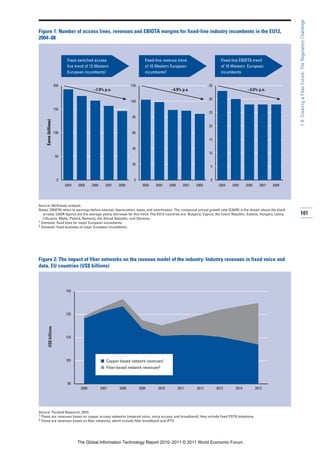
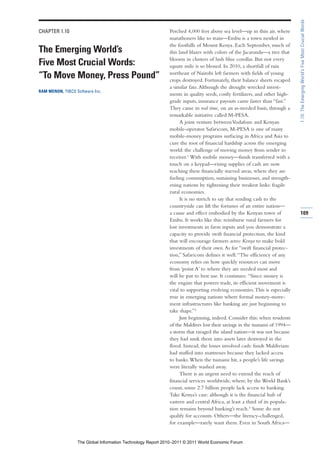
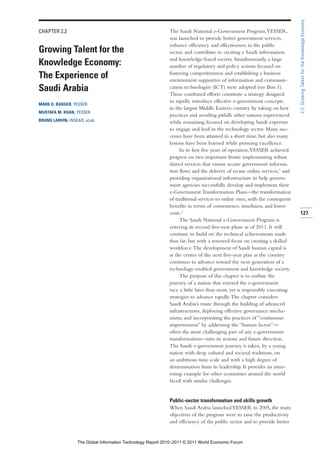
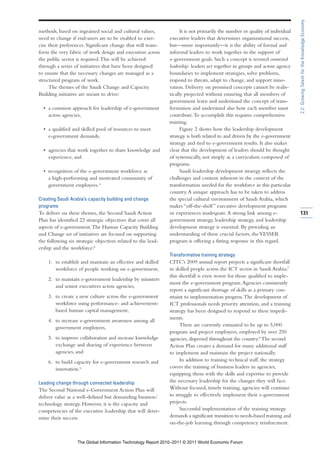
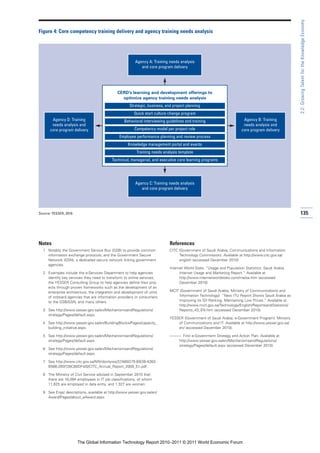
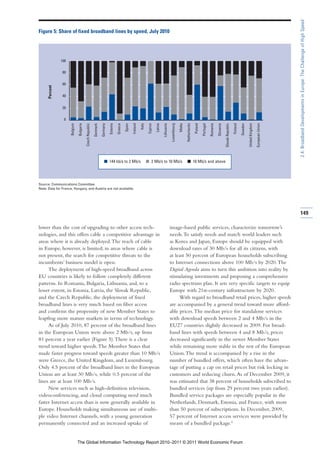
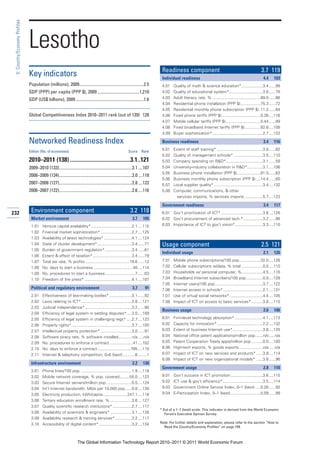
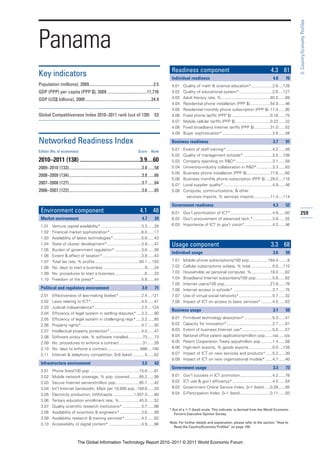
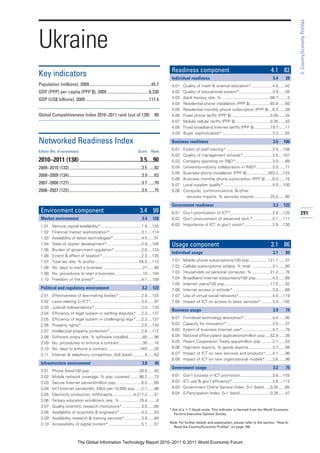
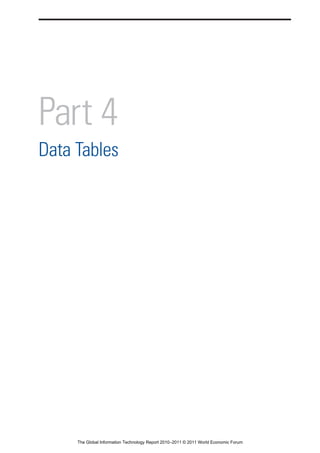
Figure 3: Average NRI score for selected country groups
Nordics 5.6 5.3 5.0 5.3
Asian Tigers 5.2 5.4 5.4 5.3
I Environment
I Readiness
I Usage
EU (excl. Nordics) 4.6 4.6 4.2 4.5
Others 3.7 4.2 3.2 3.7
Component score
Note: The contribution of each component to the overall NRI is depicted by the length of each respective solid bar. The number at the end of each bar is
the overall NRI score. Nordics comprise Denmark, Finland, Iceland, Norway, and Sweden; Asian Tigers refers to Hong Kong, Korea, Singapore, and Taiwan.
EU (excl. Nordics) corresponds to the EU27 less Denmark, Finland, and Sweden. Others refers to all other economies covered by the study.
18
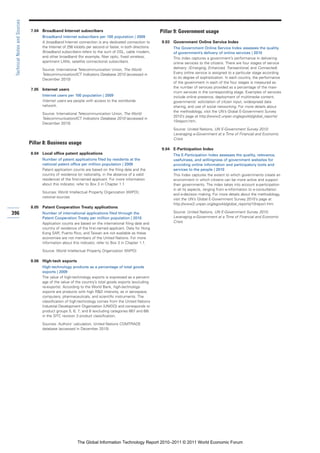
Figure 4: NRI 2010–2011 decile rank distribution by income group
15 I High income
I Upper-middle income
I Lower-middle income
12
I Low income
9
Frequency
6
3
0
Top 9th 8th 7th 6th 5th 4th 3rd 2nd Bottom
[1–13] [14–27] [28–41] [42–55] [56–69] [70–82] [83–96] [97–110] [111–124] [125–138]
Decile rank [range]
Note: See text for details.
The Global Information Technology Report 2010–2011 © 2011 World Economic Forum](https://image.slidesharecdn.com/wef-gitr-2010-2011-110427122231-phpapp01/85/Wef-gitr-2010-2011-40-320.jpg)

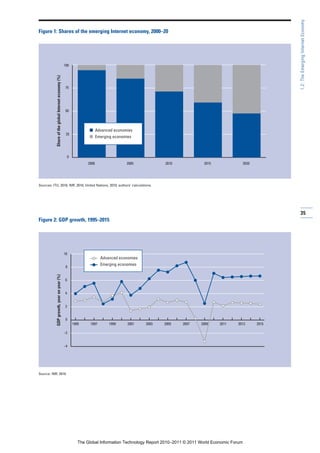
![1.2: The Emerging Internet Economy
Conclusion Notes
Much of the world has yet to tap to a significant extent 1 The adjustment factor we use is based on the Gini coefficient
for income distribution. However, we dampen the effect of
the Internet’s huge potential for generating economic the income distribution adjustment as Internet use becomes
and social benefits. As more people get connected, it more universal, because income distribution matters less (in the
context of our Internet economy measure) as more of a country’s
will trigger massive implications for productivity and
population becomes connected. Internet economy = (GDPpc
will open all kinds of new opportunities for individuals. PPP × total Internet users) × {1 + [Gini coefficient × (1 – Internet
We have illustrated this through the dynamics of the penetration ratio)]} .
global Internet economy—the factors behind which 2 Nomura International, among others, has identified the US$6,000
per capita income level that results in “burst of GDP & credit;
are faster growth in emerging countries, rapid expansion higher spending and lower savings” across many economies over
of their consumer class, and developments in wireless the past 50 years (Nomura International 2009, p. 17). Kharas 2010
has used the term consumer class, applied to per capita income
technology.
levels above US$10 per day.
All those factors suggest that we are at an inflection
3 Goldman Sachs Global Investment Research 2010.
point. Internet adoption and intensity of use through
4 Food accounts for well over half of total expenditures for national
broadband connections will accelerate, and the global
incomes below US$1,500 per capita, but drops to one quarter
composition of the Internet community and markets will for those above US$3,000 and drops further at higher income
change markedly over the next decade. This inflection levels. See Goldman Sachs Global Investment Research 2010.
point presents an opportunity for countries—and cities— 5 Chapter 1.3 of The Global Information Technology Report
2008–2009 details the stages of Internet connectivity and the key
to take decisive steps to gain the competitive advantage Internet adoption thresholds.
that can be derived from widespread use of broadband
6 Qiang et al. 2009 showed that among ICT, including Internet
networks. access, broadband connectivity leads to the largest gains in GDP.
For countries that appear today to be converging 7 Coaxial cable Internet access also facilitated the transition to
adopters, the challenge is to accelerate the speed of high-speed broadband in first adopters, but the cost of installation
makes individual transition to cable Internet more costly unless
adoption and reduce the lag between widespread
users already subscribe to cable television service.
Internet penetration and broadband penetration. For
8 Comprehensive data on wireless access (at the country level)
countries that are belated adopters, the urgent challenge are not yet available, but the latest figures from the International
is to shift gears and leapfrog to faster adoption of Telecommunication Union (ITU) indicate that at the end of 2010,
there were 940 million 3G mobile subscriptions with the possibil-
Internet and broadband. ity of data transmission at broadband speeds, compared with 555
43
The answer in both cases points toward the imple- million wired broadband subscriptions.
mentation of a comprehensive strategy combining
investments in broadband infrastructure and skills with
improvements in the policy and regulatory frameworks References
that affect the adoption of network technology. Key Cisco & Global Business Network. 2010. The Evolving Internet: Driving
Forces, Uncertainties and Four Scenarios to 2025. Available at
considerations to that effect should include the treat- http://www.monitor.com/Portals/0/MonitorContent/imported/
ment of broadband networks, from the perspective of MonitorUnitedStates/Articles/PDFs/Monitor_GBN_Evolving_
public policy, as basic infrastructure; the recognition Internet_Cisco_2010_August.pdf.
that competition is one of the best drivers of technology Goldman Sachs Global Investment Research. 2010. Demographic
Dynamics: A Case Study for Equity Investors. August 4. Available
adoption; and imaginative policies that facilitate access at http://www2.goldmansachs.com/ideas/
to spectrum and to existing infrastructure that can be demographic-change/demographic-dynamics-doc.pdf.
shared by networks—thus reducing the costs of deploy- IMF (International Monetary Fund). 2010. World Economic Outlook.
ment and encouraging private investment. October 2010. Available at http://www.imf.org/external/pubs/ft/
weo/2010/02/weodata/index.aspx.
When we look back from 2020 or 2025, we will see
ITU (International Telecommunication Union). 2010. ICT Indicators
major differences between the emerging countries that
Database December 2010. Available at http://www.itu.int/publ/
took advantage of the opportunity of broadband networks D-IND-WTID.OL-2010/en.
to escalate their competitiveness and prosperity and those Kharas, H. 2010. The Emerging Middle Class in Developing Countries.
that failed to do so. Those differences will not be related Paris: OECD Development Center.
primarily to starting positions or relative wealth—they Nomura International. 2009. “China: A Secular Shift.” Asian Bank
will be due instead to decisive implementation of strategic Reflections 3 (August): 17.
plans and to inspired public-private partnerships that Qiang, C. Z.-W. and C. Rosotto, with K. Kimura. 2009. “Economic
Impacts of Broadband.” Information and Communications for
promote the widespread adoption of network technology. Development 2009: Extending Reach and Increasing Impact.
Washington DC: World Bank. 45.
United Nations. 2010. International Human Development Indicators.
Available at http://hdr.undp.org/en/statistics/.
World Economic Forum. 2009. The Global Information Technology
Report 2008–2009. Geneva: World Economic Forum.
The Global Information Technology Report 2010–2011 © 2011 World Economic Forum](https://image.slidesharecdn.com/wef-gitr-2010-2011-110427122231-phpapp01/85/Wef-gitr-2010-2011-65-320.jpg)


![1.10: The Emerging World’s Five Most Crucial Words
Melinda Gates Foundation, which supports mobile- Mobile Money in Ghana works with nine bank part-
money programs through its initiative called Financial ners, each of which leverages its knowledge of existing
Services for the Poor. It says, “[Mobile money] retail clients to help identify suitable agent candidates.”14
[agent] outlets are bridges between the entrenched cash- How does Safaricom help M-PESA agents strike
based exchange system and the new electronic payments the crucial balance of cash and e-float? To safeguard
cloud. This network of bridges needs to be sufficiently liquidity, the mobile carrier has appointed a number of
dense geographically to offer the necessary convenience super-agent banks with branch networks throughout
to all customers, and sufficiently resilient [liquid] to Kenya, so that agents can get consistent access to e-float.
meet whatever cash or e-float needs customers may These include the Commercial Bank of Africa (Kenya’s
have at any time.”12 largest privately owned bank) and Kenya Commercial
The International Finance Corporation agrees. This Bank (one of the three largest commercial banks in
investment advisory, a member of the World Bank Kenya). And to ensure transparency—to safeguard against
Group, explores mobile-money liquidity in its report, money laundering and other risks—all transactions are
Bridges to Cash: The Retail End of M-PESA. It asserts: recorded, customers are required to produce original
“Proper liquidity management of the retail [agent] forms of personal ID, and transactions are executed only
network goes to the heart of the usefulness and trust- with the agreement of both parties. Says Safaricom of
worthiness of the [mobile-money] proposition. For its dedication to transparency: “Working with regulators
the retailers, keeping customers supplied with e-float like the Central Bank of Kenya and the Communications
and cash is central to their business.”13 Commission of Kenya, we ensure that M-PESA operates
What headway is being made to meet this critical at the highest levels; that we are in synch with global best
challenge of balancing liquidity? In Tanzania, where practices in Anti-Money-Laundering and Know-Your-
Vodacom Tanzania, a joint venture between Vodafone Customer banking regulations. Our first priority is to
and Telkom South Africa, launched mobile money operate at the highest level of integrity and efficiency.”15
in 2008, the system taps aggregators (which they call Efficiency will be key as Safaricom strives to meet
master-agents) to recruit agents and manage their floats, soaring demand—demand that has exceeded even the
transporting cash for the agent if necessary. The master- company’s own expectations. And for good reason: in
112 agent receives a flat fee for each new agent and a per- a nation of 38 million people, only 4 million of whom
centage of each agent’s commissions, giving him or her have a bank account, over 13 million Kenyans now
an incentive to sign up high-quality agents who will belong to M-PESA, and their collective cash transfers
actively transact. To overcome the time lag in settling equal 11 percent of the nation’s GDP.16 Even more
account-to-account transfers at Tanzanian banks—lag impressive is this: M-PESA’s reach down Kenya’s socio-
that undermines the prompt replenishment of electronic economic ladder is extensive and growing; in short, the
value—Vodacom Tanzania has accelerated the process by program is getting better at reaching those who need it
establishing a line of credit for master-agents. Under this most. Evidence comes from a recent study: “While the
system, master-agents can draw on a pool of interest-free representation of all segments of the income distribution
electronic value to refill the e-float of an agent once in profile of users has grown, the proportional growth has
they are satisfied that the agent has transferred value been highest among those at the bottom. For example,
back to the master-agent’s account. Master-agents repay the bottom quartile of the income distribution account-
the loan once they have converted the agent’s cash into ed for just 10 percent of users in 2008, but 14 percent
electronic value. in 2009. [At the same time] the share of users from the
In nearly every mobile-money market, operators richest 25 percent of households accounted for 34 per-
stipulate minimum values of cash and e-float that agents cent of users in 2009, down from 37 percent in 2008.”
must maintain. Mobile Money Exchange, GSMA’s Also significant is the fact that M-PESA is reaching
online community for those interested in mobile women. “While only 38 percent of users were female
money, asks the requisite question: How can operators in 2008,” report Jack and Suri, “that number grew to
assess whether a potential agent has the means to main- 44 percent by 2009.”17 But what of the ultimate litmus
tain the required amount of e-float? Discovery often test: is there evidence that M-PESA is actually boosting
begins with the mobile carrier: do the agent’s airtime the financial health of Kenyan households? The answer
sales reflect a retail operation that is healthy and liquid? is “Yes,” says their study. “It appears that households with
In turn, carriers offering mobile-money services in part- access to M-PESA are better able to protect themselves
nership with banks can leverage their banking partner’s against the downside risks associated with job loss, harvest
skills in evaluating merchants who are seeking to become or business failure and poor health.”18
mobile-money agents. “And in cases where the retailer Other markets and mobile carriers have taken notice.
[agent] is a current client of the bank,” says GSMA in MTN, Africa’s largest mobile operator, has launched a
its 2010 Annual Report, “operators can make use of mobile-money service in Uganda in conjunction with
the data gathered over the course of the relationship Standard Bank. It is fine-tuning the service before
between the bank and the retailer. For instance, MTN rolling it out across the continent. And in South Africa,
The Global Information Technology Report 2010–2011 © 2011 World Economic Forum](https://image.slidesharecdn.com/wef-gitr-2010-2011-110427122231-phpapp01/85/Wef-gitr-2010-2011-134-320.jpg)
![1.10: The Emerging World’s Five Most Crucial Words
after having launched the initiative in Tanzania and with Qatar’s Doha Bank, it gave thousands of Filipinos
Afghanistan, Vodacom has teamed up with a local finan- living in Qatar the capacity to send money to remote
cial institution to target the 26 million people with no areas of their country of origin.23 Over 200,000 Filipinos
access to banking. now live and work in Qatar. By the close of 2009, their
remittances home exceeded US$185 million.24
In Haiti, a collaborative effort by Scotiabank and
To India and beyond Digicel—the Caribbean’s largest mobile telecommuni-
Perhaps no one has captured the ethos of mobile cations operator—has spawned Tcho Tcho Mobile, a
money better than Arun Sarin, former CEO of Britain’s mobile-money program launched in November 2010
Vodafone Group Plc. “When [people] have access to to an initial market of 20,000 users. After a three-month
money to do basic things,” he said of Vodafone’s work pilot, the service will be expanded nationwide.25
to enfranchise the unbanked, “they become economic In Cambodia, WING Cambodia is taking flight as
engines in their own right.”19 Perhaps no market among the newest mobile-money services in the world.
demonstrates this ideal more dramatically than Sarin’s Of the nation’s 15 million people, only half a million have
native India, where in less than five years the market bank accounts while three million own mobile phones.
for value-added mobile services has skyrocketed from Turning this device into a fiscal pipeline to Cambodia’s
Rs 2,850 crore to Rs 11,860 crore, approximately rural economy is what WING looks to achieve through
US$2.6 billion.20 It is no wonder, then, that India should mobile money. “Urban to rural corridors are essential
find itself in the mix where the mobile phone has to us,” said WING Cambodia Managing Director Brad
become a medium for financial transactions. Jones. “We started out targeting Cambodia’s 350,000 gar-
Actually, it might be more apt to say that India ment industry workers in 300 or so factories, focusing
leads the mix where the mobile phone has become a on a simple payroll product.” 26 Customers are mainly
medium for financial transactions. Consider this: in blue-collar urban workers who send money to rural
India alone, there were 670 million mobile customers family members.
by August 2010; a number that is growing rapidly by And back in Kenya, Safaricom is making more
10 million a month.21 Much of the growth in Indian news, expanding M-PESA to work as a savings account
mobile money will come from the Interbank Mobile as well. Over 20 percent of M-PESA users now employ 113
Payment Service, which was launched in November the service simply to store money and earn interest.27
2010 by the National Payment Corporation of India The savings service—named M-KESHO and established
along with seven banks that comprise some of the in partnership with Kenya’s Equity Bank—has effectively
nation’s largest: the State Bank of India, the ICICI Bank, opened 750,000 new bank accounts in Kenya since
the Union Bank of India, the Bank of India, the Yes launching in May, 2010, with deposits totaling nearly
Bank, the Axis Bank, and the HDFC Bank. US$11 million.28
Beyond India, mobile money programs are also
expanding rapidly. In June 2010, Vodafone announced
the launch in Fiji of M-PAiSA Mobile Money Transfer The next waves of this sea change
service. Initially, M-PAiSA will serve mainly as a vehicle Micro-savings, micro-payments, micro-credit, and
for loan disbursements and repayments from microfi- micro-insurance: these are the next transformational
nance institutions, with customers being able to receive waves of mobile money. They are washing ashore
loans and make payments through their mobile phones. nowhere more forcefully than in India and Brazil. In
“But in time,” says Vodafone spokesman Shalendra India—a cash economy where credit cards are confined
Prasad, “people will be able to pay for utilities such to a fraction of the population, debit cards are used to
as electricity, water or television using the M-PAiSA withdraw cash from ATMs, and Internet payments have
service.” Fiji’s Prime Minister, Commodore Voreqe yet to gain traction—mobile-based micro-payments
Bainimarama, offers an endorsement of this own: “With have transformative value. Micro-payments are mobile-
the use of mobile-phone technology, M-PAiSA will to-mobile transactions: payments for anything from a
enable unbanked, non-saving and geographically isolated trip to the cinema to the remuneration of school fees.
Fijians to participate in the mainstream financial sector All one needs is the mobile number and the Mobile
of the country.” 22 Money Identifier (MMID) of the payee, and sums as
More than a trend, mobile money is a juggernaut. small as US$1.00 can be transferred in an instant from
In November 2010, both Vodafone and the Norwegian the payer’s account to that of the payee. “In the not too
telecommunication company Telenor announced plans to distant future, one could envisage that a taxi would
expand their mobile-money menus in emerging markets have its mobile number and MMID painted on the
to include new services such as savings accounts, micro- vehicle and a customer could pay the fare through a
credit lending, insurance, and international remittances. mobile phone, avoiding any cash”; this from Dr. Ashok
Vodafone has been enabling international mobile- Jhunjhunwala, a Professor in the Department of
money remittances since 2009, when, in conjunction Electrical Engineering at the Indian Institute of
The Global Information Technology Report 2010–2011 © 2011 World Economic Forum](https://image.slidesharecdn.com/wef-gitr-2010-2011-110427122231-phpapp01/85/Wef-gitr-2010-2011-135-320.jpg)


![2.1: Costa Rica’s Efforts Toward an Innovation-Driven Economy
ogy suppliers as well as demanders of technology—and involved with the same multinational ICT companies
this occurred outside the FTZ incentives regime. This is and increased visibility for local partners.19
the case for Microsoft and Coca Cola, among others.
Externalities from ICT multinational firms: Knowledge Target ICT public programs and policies
spillovers and ICT knowledge transfer in Costa Rica In contrast to some other countries, Costa Rica does
The economic literature has paid increasing attention to not have public policies guaranteeing access to financial
the role of FDI in fostering the productivity of domestic instruments other than loans (notably seed capital, venture
firms in developing countries. A widely accepted argu- capital, and equity markets) for ICT firms, a demand-
ment in this regard is that foreign firms from developed driven educational system, or government-funded
countries typically enjoy technological superiority and technology parks. There are, however, a few initiatives
strong management capabilities, and their technologies funded by the Inter-American Development Bank or
and management practices can be transferred to or imi- the World Bank, such as those that provide incentive for
tated by domestic firms in emerging markets. There is ICT startups and incubator programs for ICT compa-
some empirical evidence that multinationals might have nies. Examples are ParqueTec, Yo Emprededor, CIETEC,
generated knowledge transfer and spillovers to the Costa and Link Inversiones (venture capital).
Rican economy, notably labor turnover spillovers.16 The regulation to facilitate innovation and access to
Monge-González found that 32 percent of ex-workers credit to small and medium technology-based businesses
of FTZ multinationals were hired by local companies.17 (Law 8262) has not produced significant results yet.
This is 15,139 out of 46,864 workers during the
2001–07 period who moved from FTZ multinational
firms to domestic firms. Half of those workers (49 Key challenges going forward
percent) were absorbed by large local companies and After a careful analysis of Costa Rica’s strengths and
the other half (51 percent) by small- and medium- weaknesses when it comes to moving from an efficiency-
sized enterprises. Another study found that a significant driven to an innovation-driven economy,20 the new
number of workers have moved from multinational firms Costa Rican authorities adopted a structured strategy
123
located in the country either to work in a domestic to ensure the coordination of efforts needed to success-
ICT firm or to start an ICT business of their own.18 fully tackle the pending challenges in this field. Thus,
According to the authors, 47 percent of the domestic in May 2010, Executive Decree 36.024 created the
ICT firms examined have at least one owner who pre- Presidential Council on Competitiveness and Innovation
viously worked for a multinational firm in Costa Rica. (PCCI), with an agenda for 2010–14 focused on the
In the case of employees currently working at local following five areas:
ICT companies, 26 percent of managers, 9 percent of
engineers, and 5 percent of developers surveyed had 1. human capital and innovation,
previously worked for multinationals in Costa Rica. 2. foreign trade and FDI,
More than half of domestic ICT firms have multi-
nationals as clients in Costa Rica, and 27.6 percent 3. capital markets and financial reforms,
of local suppliers of multinationals have at least one 4. infrastructure (telecommunications, electricity,
owner who worked for a multinational before. transportation, ports, and airports), and
Four types of commercial relationships between
5. regulatory reform and red tape reduction.
multinationals and local ICT firms can be observed
in Costa Rica. These involve the local firms acting as
ICT wholesalers or distributors; retailers to final users; The PCCI provides guidance, advice, and coordi-
value-added resellers (VARs), which provide third-party nation of public policies in the above areas. It also
products and services to final users as parts of packages designs plans, goals, and objectives; and ensures the
that also include the VAR’s own products and services; monitoring of the progress made. Its functions include,
or representatives—usually not selling directly but pro- in the areas for which it is responsible, proposing strate-
viding local points of contact for firms and individuals. gic objectives, sectoral targets, and indicators of achieve-
Wholesalers and VARs tend to be associated with the ment; developing specific action plans; collaborating in
widest range of benefits. the implementation of specific action plans defined by
the government; designing policies and guidelines that
Domestic companies report important benefits from
regulate the activities of the institutions involved, upon
these commercial relationships with MNC [multina- approval of the executive branch or the President of
tional corporation] ICT companies, such as training in the Republic. The PCCI is also in charge of proposing
sales and marketing techniques and information mechanisms for controlling and following up on action
about current or possible clients, special events for plans and assisting in their implementation; coordinating
network formation between domestic ICT companies the respective technical secretariats and establishing
The Global Information Technology Report 2010–2011 © 2011 World Economic Forum](https://image.slidesharecdn.com/wef-gitr-2010-2011-110427122231-phpapp01/85/Wef-gitr-2010-2011-145-320.jpg)


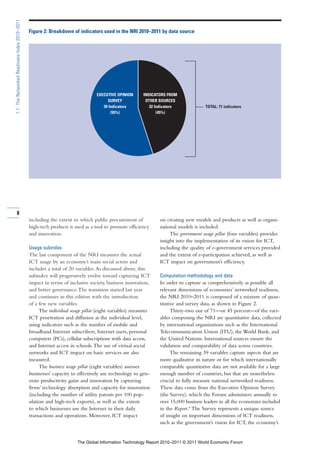
![How to Read the Data Tables
How to Read the Data Tables
ROBERTO CROTTI, World Economic Forum
The following pages present the data by variable and Two types of data are used in the NRI:
for all 138 economies included in The Global Information
Technology Report 2010–2011.
The Data Tables are organized in nine sections, Executive Opinion Survey indicators
which correspond to the nine pillars of the Networked In the tables, country scores for indicators derived
Readiness Index (NRI). from the World Economic Forum’s Executive Opinion
Survey (Survey) are represented by blue-colored bar
Environment graphs, and their titles are followed by an asterisk.
1. Market environment Survey questions ask for responses on a scale of 1
2. Political and regulatory environment to 7, where an answer of 1 corresponds to the lowest
3. Infrastructure environment possible score and an answer of 7 corresponds to the
highest possible score. For each Survey question, indi-
Readiness vidual responses from the 2009 and 2010 editions of
4. Individual readiness the Survey are combined and aggregated at the country
5. Business readiness level in order to produce country scores. For more
6. Government readiness information on the Executive Opinion Survey, please
refer to Chapter 1.1. 303
Usage For each Survey variable, the corresponding ques-
7. Individual usage tion and the two extreme answers are shown. Scores are
8. Business usage reported with a precision of two decimal points, although
9. Government usage the exact figures are used to determine rankings.
For example, in the case of variable 5.02 on the
quality of management schools, although Argentina,
ranked 16th, and Australia, ranked 17th, are listed with
the same rounded score of 5.29, their rankings are
1.01 Venture capital availability
In your country, how easy is it for entrepreneurs with innovative but risky projects to find venture capital? [1 = very difficult; 7 = very easy] |
2009–2010 weighted average
based on the exact figures (5.2899952 and 5.2864537,
RANK
1
COUNTRY/ECONOMY
Hong Kong SAR ..................4.44
SCORE 1 MEAN: 2.67 7 RANK
70
COUNTRY/ECONOMY SCORE
Madagascar .........................2.50
1 MEAN: 2.67 7 respectively).
2 Norway ................................4.31 71 Bulgaria................................2.50
3 Singapore ............................4.21 72 Macedonia, FYR ..................2.49
4
5
Finland .................................4.19
Luxembourg ........................4.19
73
74
Gambia, The ........................2.48
Uruguay ...............................2.48
A dotted line on the graph indicates the mean
6 Qatar....................................4.08 75 Philippines ...........................2.46
7
8
9
Sweden ...............................4.00
Malaysia ..............................3.91
Indonesia .............................3.86
76
77
78
Cambodia ............................2.46
Guatemala ...........................2.45
Bolivia ..................................2.44
score across the sample of 138 economies.
10 Israel ....................................3.86 79 Romania ..............................2.42
11 Taiwan, China ......................3.86 80 Algeria .................................2.39
12 Australia...............................3.83 81 Kazakhstan ..........................2.39
13 United States.......................3.81 82 Costa Rica ...........................2.38
14 Saudi Arabia.........................3.81 83 Iceland .................................2.38
15 Oman...................................3.75 84 Nicaragua.............................2.37
16 United Arab Emirates ..........3.72 85 Barbados .............................2.35
17 Netherlands .........................3.71 86 Greece.................................2.33
18 Bahrain ................................3.69 87 Paraguay ..............................2.30
19 Canada.................................3.65 88 Ireland..................................2.30
20 Switzerland ..........................3.46 89 Swaziland ............................2.28
21 Tunisia..................................3.45 90 El Salvador...........................2.27
22 Kuwait .................................3.40 91 Chad ....................................2.27
23 Cyprus .................................3.38 92 Honduras .............................2.27
24 Montenegro.........................3.36 93 Senegal................................2.26
25 Belgium ...............................3.34 94 Russian Federation..............2.26
26 New Zealand .......................3.33 95 Mexico.................................2.25
27 China ...................................3.33 96 Bangladesh..........................2.25
28 Panama................................3.31 97 Korea, Rep...........................2.24
29 Denmark..............................3.30 98 Turkey ..................................2.23
30 Estonia.................................3.26 99 Guyana ................................2.19
31 India.....................................3.25 100 Latvia ...................................2.19
32 France..................................3.23 101 Serbia ..................................2.18
33 Sri Lanka..............................3.23 102 Lithuania ..............................2.17
34 Chile ....................................3.16 103 Italy ......................................2.16
35 Kenya...................................3.09 104 Hungary ...............................2.15
36 Malta ...................................3.09 105 Nepal ...................................2.15
37 Puerto Rico..........................3.05 106 Albania.................................2.15
38 United Kingdom...................3.02 107 Croatia .................................2.14
39 South Africa.........................3.01 108 Georgia ................................2.14
40 Morocco ..............................3.00 109 Mozambique........................2.13
41 Egypt ...................................2.98 110 Ghana ..................................2.12
42 Peru .....................................2.95 111 Dominican Republic.............2.12
43 Austria .................................2.93 112 Syria.....................................2.11
44 Thailand ...............................2.90 113 Ethiopia................................2.11
45 Slovenia ...............................2.89 114 Cape Verde ..........................2.08
46 Brunei Darussalam ..............2.89 115 Lesotho ...............................2.07
47 Botswana ............................2.86 116 Ecuador ...............................2.00
48 Azerbaijan ............................2.86 117 Zambia.................................1.99
49 Japan ...................................2.83 118 Venezuela ............................1.96
50 Mauritius .............................2.81 119 Nigeria .................................1.96
51 Pakistan ...............................2.81 120 Ukraine ................................1.95
52 Germany..............................2.78 121 Uganda ................................1.94
53 Portugal ...............................2.74 122 Mauritania............................1.92
54 Jordan..................................2.72 123 Argentina .............................1.90
55 Libya ....................................2.72 124 Jamaica ...............................1.90
56 Poland..................................2.68 125 Bosnia and Herzegovina......1.88
57 Vietnam ...............................2.67 126 Moldova...............................1.86
58 Spain....................................2.64 127 Cameroon............................1.82
59 Timor-Leste..........................2.64 128 Angola .................................1.80
60 Brazil ....................................2.61 129 Kyrgyz Republic ...................1.79
61 Slovak Republic ...................2.61 130 Armenia ...............................1.79
62 Benin ...................................2.60 131 Malawi .................................1.77
63 Czech Republic....................2.59 132 Iran, Islamic Rep.,................1.77
64 Tanzania ...............................2.57 133 Zimbabwe............................1.74
65 Namibia ...............................2.56 134 Mali......................................1.71
66 Colombia .............................2.54 135 Mongolia..............................1.66
67 Lebanon...............................2.54 136 Côte d’Ivoire ........................1.57
68 Trinidad and Tobago.............2.51 137 Burkina Faso........................1.52
69 Tajikistan ..............................2.51 138 Burundi ................................1.49
SOURCE: World Economic Forum, Executive Opinion Survey 2009, 2010
The Global Information Technology Report 2010–2011 © 2011 World Economic Forum](https://image.slidesharecdn.com/wef-gitr-2010-2011-110427122231-phpapp01/85/Wef-gitr-2010-2011-325-320.jpg)

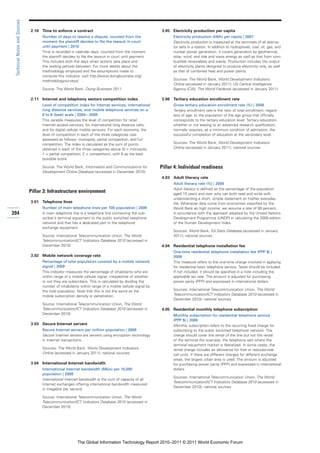
![1.01 Venture capital availability
4: Data Tables | 1st pillar: Market environment
In your country, how easy is it for entrepreneurs with innovative but risky projects to find venture capital? v1 = very difficult; 7 = very easy] |
2009–2010 weighted average
RANK COUNTRY/ECONOMY SCORE 1 MEAN: 2.67 7 RANK COUNTRY/ECONOMY SCORE 1 MEAN: 2.67 7
1 Hong Kong SAR ..................4.44 70 Madagascar .........................2.50
2 Norway ................................4.31 71 Bulgaria................................2.50
3 Singapore ............................4.21 72 Macedonia, FYR ..................2.49
4 Finland .................................4.19 73 Gambia, The ........................2.48
5 Luxembourg ........................4.19 74 Uruguay ...............................2.48
6 Qatar....................................4.08 75 Philippines ...........................2.46
7 Sweden ...............................4.00 76 Cambodia ............................2.46
8 Malaysia ..............................3.91 77 Guatemala ...........................2.45
9 Indonesia .............................3.86 78 Bolivia ..................................2.44
10 Israel ....................................3.86 79 Romania ..............................2.42
11 Taiwan, China ......................3.86 80 Algeria .................................2.39
12 Australia...............................3.83 81 Kazakhstan ..........................2.39
13 United States.......................3.81 82 Costa Rica ...........................2.38
14 Saudi Arabia.........................3.81 83 Iceland .................................2.38
15 Oman...................................3.75 84 Nicaragua.............................2.37
16 United Arab Emirates ..........3.72 85 Barbados .............................2.35
17 Netherlands .........................3.71 86 Greece.................................2.33
18 Bahrain ................................3.69 87 Paraguay..............................2.30
19 Canada.................................3.65 88 Ireland..................................2.30
20 Switzerland ..........................3.46 89 Swaziland ............................2.28
21 Tunisia..................................3.45 90 El Salvador...........................2.27
22 Kuwait .................................3.40 91 Chad ....................................2.27
23 Cyprus .................................3.38 92 Honduras .............................2.27
24 Montenegro.........................3.36 93 Senegal................................2.26
25 Belgium ...............................3.34 94 Russian Federation..............2.26
26 New Zealand .......................3.33 95 Mexico.................................2.25
27 China ...................................3.33 96 Bangladesh..........................2.25
28 Panama................................3.31 97 Korea, Rep...........................2.24
29 Denmark..............................3.30 98 Turkey ..................................2.23
30 Estonia.................................3.26 99 Guyana ................................2.19
308 31 India.....................................3.25 100 Latvia ...................................2.19
32 France..................................3.23 101 Serbia ..................................2.18
33 Sri Lanka..............................3.23 102 Lithuania ..............................2.17
34 Chile ....................................3.16 103 Italy......................................2.16
35 Kenya...................................3.09 104 Hungary ...............................2.15
36 Malta ...................................3.09 105 Nepal ...................................2.15
37 Puerto Rico..........................3.05 106 Albania.................................2.15
38 United Kingdom...................3.02 107 Croatia .................................2.14
39 South Africa.........................3.01 108 Georgia ................................2.14
40 Morocco ..............................3.00 109 Mozambique........................2.13
41 Egypt ...................................2.98 110 Ghana ..................................2.12
42 Peru .....................................2.95 111 Dominican Republic.............2.12
43 Austria .................................2.93 112 Syria.....................................2.11
44 Thailand ...............................2.90 113 Ethiopia................................2.11
45 Slovenia ...............................2.89 114 Cape Verde ..........................2.08
46 Brunei Darussalam ..............2.89 115 Lesotho ...............................2.07
47 Botswana ............................2.86 116 Ecuador ...............................2.00
48 Azerbaijan ............................2.86 117 Zambia.................................1.99
49 Japan ...................................2.83 118 Venezuela ............................1.96
50 Mauritius .............................2.81 119 Nigeria .................................1.96
51 Pakistan ...............................2.81 120 Ukraine ................................1.95
52 Germany..............................2.78 121 Uganda ................................1.94
53 Portugal ...............................2.74 122 Mauritania............................1.92
54 Jordan..................................2.72 123 Argentina .............................1.90
55 Libya ....................................2.72 124 Jamaica ...............................1.90
56 Poland..................................2.68 125 Bosnia and Herzegovina......1.88
57 Vietnam ...............................2.67 126 Moldova...............................1.86
58 Spain....................................2.64 127 Cameroon............................1.82
59 Timor-Leste..........................2.64 128 Angola .................................1.80
60 Brazil ....................................2.61 129 Kyrgyz Republic ...................1.79
61 Slovak Republic ...................2.61 130 Armenia ...............................1.79
62 Benin ...................................2.60 131 Malawi .................................1.77
63 Czech Republic....................2.59 132 Iran, Islamic Rep.,................1.77
64 Tanzania ...............................2.57 133 Zimbabwe............................1.74
65 Namibia ...............................2.56 134 Mali......................................1.71
66 Colombia .............................2.54 135 Mongolia..............................1.66
67 Lebanon...............................2.54 136 Côte d’Ivoire ........................1.57
68 Trinidad and Tobago.............2.51 137 Burkina Faso........................1.52
69 Tajikistan ..............................2.51 138 Burundi ................................1.49
SOURCE: World Economic Forum, Executive Opinion Survey 2009, 2010
The Global Information Technology Report 2010–2011 © 2011 World Economic Forum](https://image.slidesharecdn.com/wef-gitr-2010-2011-110427122231-phpapp01/85/Wef-gitr-2010-2011-330-320.jpg)
![1.02 Financial market sophistication
4: Data Tables | 1st pillar: Market environment
How would you assess the level of sophistication of financial markets in your country? [1 = poor by international standards; 7 = excellent by
international standards] | 2009–2010 weighted average
RANK COUNTRY/ECONOMY SCORE 1 MEAN: 4.29 7 RANK COUNTRY/ECONOMY SCORE 1 MEAN: 4.29 7
1 Luxembourg ........................6.63 70 Korea, Rep...........................4.24
2 Switzerland ..........................6.56 71 Kenya...................................4.20
3 United Kingdom...................6.55 72 Ghana ..................................4.17
4 Canada.................................6.53 73 China ...................................4.16
5 Hong Kong SAR ..................6.44 74 Croatia .................................4.12
6 South Africa.........................6.42 75 Honduras .............................4.11
7 Sweden ...............................6.36 76 Botswana ............................4.11
8 France..................................6.21 77 Lithuania ..............................4.10
9 Norway ................................6.15 78 Gambia, The ........................4.07
10 Singapore ............................6.13 79 Nigeria .................................4.02
11 Australia...............................6.13 80 Azerbaijan ............................3.97
12 Finland .................................6.10 81 Ecuador ...............................3.93
13 Netherlands .........................6.10 82 Latvia ...................................3.92
14 Brazil ....................................6.04 83 Romania ..............................3.91
15 United States.......................5.99 84 Uruguay ...............................3.90
16 Germany..............................5.99 85 Pakistan ...............................3.87
17 Panama................................5.96 86 Egypt ...................................3.86
18 Belgium ...............................5.87 87 Zambia.................................3.83
19 Chile ....................................5.86 88 Cape Verde ..........................3.82
20 Israel....................................5.80 89 Dominican Republic.............3.82
21 Denmark..............................5.72 90 Zimbabwe............................3.80
22 Portugal ...............................5.69 91 Macedonia, FYR ..................3.79
23 Puerto Rico..........................5.66 92 Vietnam ...............................3.76
24 Spain....................................5.65 93 Malawi .................................3.68
25 Austria .................................5.63 94 Mozambique........................3.65
26 Bahrain ................................5.46 95 Swaziland ............................3.64
27 Malaysia ..............................5.42 96 Russian Federation..............3.62
28 Qatar....................................5.27 97 Côte d’Ivoire ........................3.59
29 Saudi Arabia.........................5.26 98 Kazakhstan ..........................3.57
30 New Zealand .......................5.26 99 Senegal................................3.56
31 Namibia ...............................5.22 100 Nicaragua.............................3.51 309
32 Malta ...................................5.21 101 Paraguay..............................3.51
33 Taiwan, China ......................5.21 102 Venezuela ............................3.50
34 Estonia.................................5.20 103 Argentina .............................3.42
35 India.....................................5.20 104 Iceland .................................3.42
36 United Arab Emirates ..........5.17 105 Georgia ................................3.34
37 Japan ...................................5.10 106 Benin ...................................3.33
38 Thailand ...............................5.07 107 Cambodia ............................3.28
39 Ireland..................................5.04 108 Serbia ..................................3.28
40 Turkey ..................................5.00 109 Bangladesh..........................3.23
41 Cyprus .................................4.86 110 Guyana ................................3.21
42 Jamaica ...............................4.84 111 Bulgaria................................3.18
43 Mauritius .............................4.83 112 Armenia ...............................3.13
44 El Salvador...........................4.81 113 Tanzania ...............................3.10
45 Peru .....................................4.79 114 Ukraine ................................3.09
46 Slovak Republic ...................4.77 115 Albania.................................3.05
47 Oman...................................4.76 116 Bolivia ..................................3.04
48 Barbados .............................4.76 117 Tajikistan ..............................3.03
49 Trinidad and Tobago.............4.75 118 Uganda ................................3.01
50 Lebanon...............................4.72 119 Iran, Islamic Rep..................2.95
51 Czech Republic....................4.67 120 Moldova...............................2.91
52 Jordan..................................4.66 121 Mali......................................2.84
53 Hungary ...............................4.65 122 Bosnia and Herzegovina......2.84
54 Mexico.................................4.62 123 Nepal ...................................2.71
55 Indonesia .............................4.62 124 Kyrgyz Republic ...................2.71
56 Tunisia..................................4.57 125 Lesotho ...............................2.67
57 Philippines ...........................4.53 126 Burkina Faso........................2.54
58 Kuwait .................................4.52 127 Mongolia..............................2.51
59 Sri Lanka..............................4.51 128 Angola .................................2.50
60 Morocco ..............................4.50 129 Madagascar .........................2.46
61 Montenegro.........................4.48 130 Syria.....................................2.45
62 Colombia .............................4.46 131 Ethiopia................................2.42
63 Poland..................................4.43 132 Algeria .................................2.35
64 Italy ......................................4.39 133 Mauritania............................2.27
65 Guatemala ...........................4.35 134 Cameroon............................2.24
66 Slovenia ...............................4.35 135 Timor-Leste..........................2.23
67 Greece.................................4.34 136 Libya ....................................2.15
68 Brunei Darussalam ..............4.31 137 Chad ....................................2.12
69 Costa Rica ...........................4.30 138 Burundi ................................1.87
SOURCE: World Economic Forum, Executive Opinion Survey 2009, 2010
The Global Information Technology Report 2010–2011 © 2011 World Economic Forum](https://image.slidesharecdn.com/wef-gitr-2010-2011-110427122231-phpapp01/85/Wef-gitr-2010-2011-331-320.jpg)
![1.03 Availability of latest technologies
4: Data Tables | 1st pillar: Market environment
To what extent are the latest technologies available in your country? [1 = not available; 7 = widely available] | 2009–2010 weighted average
RANK COUNTRY/ECONOMY SCORE 1 MEAN: 5.06 7 RANK COUNTRY/ECONOMY SCORE 1 MEAN: 5.06 7
1 Sweden ...............................6.84 70 Costa Rica ...........................4.99
2 Iceland .................................6.77 71 Cape Verde ..........................4.98
3 Norway ................................6.69 72 Italy......................................4.95
4 Finland .................................6.65 73 Mexico.................................4.94
5 Switzerland ..........................6.63 74 Lebanon...............................4.89
6 Israel ....................................6.45 75 Gambia, The ........................4.89
7 United States.......................6.44 76 Indonesia .............................4.82
8 Austria .................................6.42 77 Botswana ............................4.79
9 Netherlands .........................6.41 78 Côte d’Ivoire ........................4.79
10 Hong Kong SAR ..................6.40 79 Macedonia, FYR ..................4.78
11 United Arab Emirates ..........6.40 80 Azerbaijan ............................4.75
12 Belgium ...............................6.37 81 Kenya...................................4.73
13 Denmark..............................6.36 82 Argentina .............................4.71
14 Canada.................................6.36 83 Honduras .............................4.70
15 United Kingdom...................6.36 84 Montenegro.........................4.69
16 France..................................6.36 85 Poland..................................4.65
17 Germany..............................6.30 86 Colombia .............................4.65
18 Japan ...................................6.28 87 Pakistan ...............................4.63
19 Portugal ...............................6.26 88 Zambia.................................4.62
20 Singapore ............................6.26 89 Albania.................................4.60
21 Luxembourg ........................6.20 90 Egypt ...................................4.59
22 Australia...............................6.13 91 Ukraine ................................4.46
23 Korea, Rep...........................6.11 92 Uganda ................................4.43
24 Puerto Rico..........................6.09 93 China ...................................4.40
25 Qatar....................................6.07 94 Ghana ..................................4.36
26 Chile ....................................6.05 95 Libya ....................................4.36
27 New Zealand .......................6.01 96 Kazakhstan ..........................4.36
28 Barbados .............................6.01 97 Georgia ................................4.35
29 Bahrain ................................6.01 98 Romania ..............................4.32
30 Malta ...................................5.98 99 Bulgaria................................4.32
310 31 Estonia.................................5.81 100 Venezuela ............................4.32
32 Spain....................................5.78 101 Vietnam ...............................4.30
33 Taiwan, China ......................5.75 102 Cambodia ............................4.30
34 Ireland..................................5.75 103 Mozambique........................4.30
35 Malaysia ..............................5.68 104 Madagascar .........................4.30
36 Cyprus .................................5.67 105 Ecuador ...............................4.29
37 Lithuania ..............................5.64 106 Guyana ................................4.28
38 Slovenia ...............................5.60 107 Malawi .................................4.25
39 Saudi Arabia.........................5.59 108 Algeria .................................4.24
40 Slovak Republic ...................5.58 109 Benin ...................................4.23
41 India.....................................5.58 110 Bangladesh..........................4.22
42 Tunisia..................................5.57 111 Moldova...............................4.22
43 Panama................................5.56 112 Burkina Faso........................4.22
44 Namibia ...............................5.54 113 Cameroon............................4.21
45 Guatemala ...........................5.52 114 Nigeria .................................4.21
46 Czech Republic....................5.52 115 Bosnia and Herzegovina......4.20
47 Hungary ...............................5.50 116 Serbia ..................................4.20
48 Turkey ..................................5.50 117 Mauritania............................4.19
49 Jordan..................................5.48 118 Mongolia..............................4.19
50 Brazil ....................................5.48 119 Tajikistan ..............................4.18
51 South Africa.........................5.48 120 Paraguay..............................4.18
52 Jamaica ...............................5.48 121 Russian Federation..............4.17
53 Senegal................................5.46 122 Iran, Islamic Rep..................4.13
54 Mauritius .............................5.44 123 Mali......................................4.12
55 Croatia .................................5.39 124 Lesotho ...............................4.06
56 Dominican Republic.............5.32 125 Syria.....................................4.01
57 Oman...................................5.26 126 Armenia ...............................3.94
58 Brunei Darussalam ..............5.18 127 Nepal ...................................3.94
59 Greece.................................5.18 128 Ethiopia................................3.92
60 Trinidad and Tobago.............5.16 129 Nicaragua.............................3.87
61 Sri Lanka..............................5.15 130 Bolivia ..................................3.77
62 Philippines ...........................5.14 131 Tanzania ...............................3.77
63 Kuwait .................................5.11 132 Zimbabwe............................3.65
64 Thailand ...............................5.11 133 Swaziland ............................3.56
65 Latvia ...................................5.06 134 Kyrgyz Republic ...................3.54
66 Peru .....................................5.06 135 Timor-Leste..........................3.54
67 El Salvador...........................5.06 136 Burundi ................................3.45
68 Morocco ..............................5.04 137 Angola .................................3.42
69 Uruguay ...............................5.02 138 Chad ....................................3.34
SOURCE: World Economic Forum, Executive Opinion Survey 2009, 2010
The Global Information Technology Report 2010–2011 © 2011 World Economic Forum](https://image.slidesharecdn.com/wef-gitr-2010-2011-110427122231-phpapp01/85/Wef-gitr-2010-2011-332-320.jpg)
![1.04 State of cluster development
4: Data Tables | 1st pillar: Market environment
In your country’s economy, how prevalent are well-developed and deep clusters? [1 = nonexistent; 7 = widespread in many fields] | 2009–2010
weighted average
RANK COUNTRY/ECONOMY SCORE 1 MEAN: 3.56 7 RANK COUNTRY/ECONOMY SCORE 1 MEAN: 3.56 7
1 Italy ......................................5.55 70 Jordan..................................3.44
2 Japan ...................................5.45 71 Lesotho ...............................3.43
3 Taiwan, China ......................5.40 72 Brunei Darussalam ..............3.43
4 Switzerland ..........................5.21 73 Gambia, The ........................3.42
5 Singapore ............................5.19 74 Tunisia..................................3.38
6 United States.......................5.15 75 Peru .....................................3.35
7 Hong Kong SAR ..................5.15 76 Honduras .............................3.32
8 Sweden ...............................5.12 77 Lebanon...............................3.31
9 Finland .................................5.06 78 Jamaica ...............................3.30
10 United Kingdom...................5.04 79 El Salvador...........................3.28
11 Canada.................................5.04 80 Namibia ...............................3.25
12 Germany..............................4.96 81 Bosnia and Herzegovina......3.24
13 Vietnam ...............................4.88 82 Uruguay ...............................3.23
14 Bahrain ................................4.83 83 Trinidad and Tobago.............3.23
15 Malaysia ..............................4.80 84 Kazakhstan ..........................3.22
16 Luxembourg ........................4.79 85 Nepal ...................................3.21
17 China ...................................4.74 86 Russian Federation..............3.20
18 Norway ................................4.71 87 Azerbaijan ............................3.15
19 Netherlands .........................4.71 88 Nicaragua.............................3.14
20 Denmark..............................4.63 89 Ghana ..................................3.13
21 Qatar....................................4.61 90 Iran, Islamic Rep..................3.12
22 Austria .................................4.57 91 Estonia.................................3.12
23 Brazil ....................................4.48 92 Swaziland ............................3.07
24 Indonesia .............................4.47 93 Timor-Leste..........................3.04
25 Korea, Rep...........................4.37 94 Guyana ................................3.03
26 Belgium ...............................4.33 95 Barbados .............................3.03
27 Saudi Arabia.........................4.27 96 Mali......................................2.97
28 United Arab Emirates ..........4.25 97 Georgia ................................2.96
29 India.....................................4.25 98 Greece.................................2.95
30 France..................................4.24 99 Mozambique........................2.94
31 Oman...................................4.14 100 Hungary ...............................2.94 311
32 Ireland..................................4.13 101 Syria.....................................2.93
33 Sri Lanka..............................4.12 102 Latvia ...................................2.92
34 Thailand ...............................4.10 103 Croatia .................................2.90
35 Australia...............................4.08 104 Lithuania ..............................2.89
36 Spain....................................4.08 105 Ukraine ................................2.89
37 Mauritius .............................4.07 106 Macedonia, FYR ..................2.87
38 Chile ....................................4.06 107 Poland..................................2.86
39 South Africa.........................4.04 108 Botswana ............................2.86
40 Colombia .............................4.03 109 Ecuador ...............................2.85
41 Czech Republic....................4.03 110 Bolivia ..................................2.85
42 Guatemala ...........................4.02 111 Bulgaria................................2.81
43 Kenya...................................4.02 112 Romania ..............................2.80
44 Cyprus .................................4.00 113 Ethiopia................................2.80
45 Puerto Rico..........................3.95 114 Montenegro.........................2.77
46 Pakistan ...............................3.95 115 Paraguay..............................2.77
47 Panama................................3.90 116 Senegal................................2.77
48 Nigeria .................................3.80 117 Uganda ................................2.75
49 Slovenia ...............................3.80 118 Chad ....................................2.71
50 Mexico.................................3.79 119 Zimbabwe............................2.66
51 Cambodia ............................3.79 120 Kyrgyz Republic ...................2.64
52 Costa Rica ...........................3.77 121 Serbia ..................................2.59
53 Bangladesh..........................3.73 122 Albania.................................2.59
54 Portugal ...............................3.73 123 Armenia ...............................2.58
55 Philippines ...........................3.69 124 Madagascar .........................2.55
56 New Zealand .......................3.68 125 Algeria .................................2.47
57 Malawi .................................3.68 126 Mongolia..............................2.46
58 Malta ...................................3.66 127 Tajikistan ..............................2.46
59 Kuwait .................................3.65 128 Mauritania............................2.45
60 Iceland .................................3.65 129 Benin ...................................2.42
61 Turkey ..................................3.60 130 Cameroon............................2.39
62 Argentina .............................3.59 131 Venezuela ............................2.38
63 Dominican Republic.............3.59 132 Côte d’Ivoire ........................2.35
64 Slovak Republic ...................3.59 133 Cape Verde ..........................2.34
65 Egypt ...................................3.55 134 Moldova...............................2.33
66 Israel....................................3.52 135 Libya ....................................2.30
67 Tanzania ...............................3.51 136 Angola .................................2.23
68 Morocco ..............................3.45 137 Burundi ................................2.16
69 Zambia.................................3.44 138 Burkina Faso........................1.94
SOURCE: World Economic Forum, Executive Opinion Survey 2009, 2010
The Global Information Technology Report 2010–2011 © 2011 World Economic Forum](https://image.slidesharecdn.com/wef-gitr-2010-2011-110427122231-phpapp01/85/Wef-gitr-2010-2011-333-320.jpg)
![1.05 Burden of government regulation
4: Data Tables | 1st pillar: Market environment
How burdensome is it for businesses in your country to comply with governmental administrative requirements (e.g., permits, regulations,
reporting)? [1 = extremely burdensome; 7 = not burdensome at all] | 2009–2010 weighted average
RANK COUNTRY/ECONOMY SCORE 1 MEAN: 3.29 7 RANK COUNTRY/ECONOMY SCORE 1 MEAN: 3.29 7
1 Singapore ............................5.53 70 Swaziland ............................3.25
2 Hong Kong SAR ..................5.15 71 Pakistan ...............................3.24
3 Georgia ................................4.65 72 Kazakhstan ..........................3.22
4 Gambia, The ........................4.55 73 Bolivia ..................................3.20
5 Qatar....................................4.52 74 Burundi ................................3.17
6 Estonia.................................4.35 75 Bulgaria................................3.17
7 Oman...................................4.34 76 Netherlands .........................3.13
8 Mauritania............................4.33 77 Dominican Republic.............3.12
9 Finland .................................4.32 78 Egypt ...................................3.12
10 United Arab Emirates ..........4.31 79 Zimbabwe............................3.10
11 Iceland .................................4.30 80 Turkey ..................................3.08
12 Barbados .............................4.28 81 Lebanon...............................3.08
13 Switzerland ..........................4.21 82 Uruguay ...............................3.07
14 Tunisia..................................4.17 83 Kyrgyz Republic ...................3.07
15 Sweden ...............................4.04 84 Israel....................................3.07
16 Malaysia ..............................4.04 85 Nigeria .................................3.06
17 Saudi Arabia.........................4.04 86 Ireland..................................3.06
18 Bahrain ................................4.01 87 Latvia ...................................3.06
19 Albania.................................4.00 88 United Kingdom...................3.06
20 China ...................................4.00 89 Macedonia, FYR ..................3.05
21 Luxembourg ........................3.98 90 Armenia ...............................3.05
22 Cyprus .................................3.97 91 Germany..............................3.03
23 Uganda ................................3.92 92 Madagascar .........................3.01
24 New Zealand .......................3.85 93 South Africa.........................3.00
25 Denmark..............................3.83 94 India.....................................2.99
26 Ethiopia................................3.82 95 Malta ...................................2.96
27 Zambia.................................3.79 96 Ecuador ...............................2.93
28 Mauritius .............................3.77 97 Romania ..............................2.92
29 Taiwan, China ......................3.72 98 Iran, Islamic Rep..................2.91
30 Montenegro.........................3.70 99 Chad ....................................2.90
312 31 Azerbaijan ............................3.69 100 Cameroon............................2.89
32 Brunei Darussalam ..............3.69 101 Bangladesh..........................2.89
33 Benin ...................................3.66 102 Côte d’Ivoire ........................2.85
34 Honduras .............................3.66 103 Moldova...............................2.85
35 Indonesia .............................3.65 104 Slovak Republic ...................2.84
36 Malawi .................................3.65 105 Kenya...................................2.83
37 Namibia ...............................3.64 106 Bosnia and Herzegovina......2.83
38 Austria .................................3.63 107 Korea, Rep...........................2.81
39 Panama................................3.62 108 Libya ....................................2.80
40 Canada.................................3.62 109 Spain....................................2.76
41 Thailand ...............................3.60 110 Poland..................................2.71
42 Tajikistan ..............................3.59 111 Jamaica ...............................2.70
43 Botswana ............................3.59 112 Mongolia..............................2.70
44 Chile ....................................3.59 113 Nepal ...................................2.69
45 Guatemala ...........................3.58 114 Lithuania ..............................2.68
46 Ghana ..................................3.54 115 Mexico.................................2.68
47 Guyana ................................3.53 116 Kuwait .................................2.68
48 United States.......................3.48 117 Czech Republic....................2.67
49 Jordan..................................3.48 118 Peru .....................................2.66
50 Trinidad and Tobago.............3.47 119 Vietnam ...............................2.62
51 Slovenia ...............................3.47 120 Belgium ...............................2.62
52 Timor-Leste..........................3.46 121 France..................................2.61
53 Mali......................................3.44 122 Argentina .............................2.61
54 El Salvador...........................3.43 123 Colombia .............................2.61
55 Senegal................................3.42 124 Ukraine ................................2.59
56 Mozambique........................3.41 125 Philippines ...........................2.54
57 Paraguay..............................3.41 126 Portugal ...............................2.52
58 Norway ................................3.41 127 Russian Federation..............2.47
59 Australia...............................3.40 128 Greece.................................2.37
60 Morocco ..............................3.39 129 Syria.....................................2.33
61 Lesotho ...............................3.39 130 Serbia ..................................2.33
62 Nicaragua.............................3.36 131 Algeria .................................2.27
63 Cambodia ............................3.36 132 Italy......................................2.22
64 Burkina Faso........................3.34 133 Hungary ...............................2.20
65 Tanzania ...............................3.34 134 Venezuela ............................2.13
66 Cape Verde ..........................3.34 135 Croatia .................................2.12
67 Sri Lanka..............................3.33 136 Angola .................................2.00
68 Costa Rica ...........................3.30 137 Puerto Rico..........................2.00
69 Japan ...................................3.28 138 Brazil ....................................1.92
SOURCE: World Economic Forum, Executive Opinion Survey 2009, 2010
The Global Information Technology Report 2010–2011 © 2011 World Economic Forum](https://image.slidesharecdn.com/wef-gitr-2010-2011-110427122231-phpapp01/85/Wef-gitr-2010-2011-334-320.jpg)
![1.06 Extent and effect of taxation
4: Data Tables | 1st pillar: Market environment
What impact does the level of taxes in your country have on incentives to work or invest? [1 = significantly limits incentives to work or invest;
7 = has no impact on incentives to work or invest] | 2009–2010 weighted average
RANK COUNTRY/ECONOMY SCORE 1 MEAN: 3.60 7 RANK COUNTRY/ECONOMY SCORE 1 MEAN: 3.60 7
1 Bahrain ................................6.14 70 United States.......................3.53
2 Hong Kong SAR ..................6.05 71 Iran, Islamic Rep..................3.52
3 Singapore ............................5.60 72 Swaziland ............................3.52
4 Oman...................................5.56 73 Kazakhstan ..........................3.52
5 United Arab Emirates ..........5.53 74 Egypt ...................................3.50
6 Kuwait .................................5.49 75 Azerbaijan ............................3.49
7 Luxembourg ........................5.38 76 Philippines ...........................3.48
8 Mauritius .............................5.38 77 Tajikistan ..............................3.47
9 Saudi Arabia.........................5.33 78 Zambia.................................3.46
10 Switzerland ..........................5.03 79 Lesotho ...............................3.43
11 Qatar....................................4.81 80 Korea, Rep...........................3.42
12 Cyprus .................................4.75 81 Nicaragua.............................3.40
13 Botswana ............................4.62 82 Bulgaria................................3.37
14 Tunisia..................................4.50 83 Armenia ...............................3.37
15 Brunei Darussalam ..............4.49 84 Uganda ................................3.32
16 Timor-Leste..........................4.46 85 Burkina Faso........................3.31
17 Indonesia .............................4.36 86 Mauritania............................3.27
18 Estonia.................................4.34 87 Mozambique........................3.27
19 Chile ....................................4.31 88 Slovenia ...............................3.27
20 Barbados .............................4.29 89 Germany..............................3.26
21 Montenegro.........................4.29 90 Benin ...................................3.23
22 Lebanon...............................4.28 91 Jordan..................................3.22
23 Paraguay..............................4.26 92 Zimbabwe............................3.22
24 Georgia ................................4.21 93 Cape Verde ..........................3.21
25 Taiwan, China ......................4.17 94 United Kingdom...................3.21
26 Trinidad and Tobago.............4.15 95 Malawi .................................3.19
27 Slovak Republic ...................4.13 96 Russian Federation..............3.17
28 Malaysia ..............................4.10 97 Venezuela ............................3.17
29 China ...................................4.06 98 Greece.................................3.17
30 Angola .................................4.06 99 Morocco ..............................3.15
31 South Africa.........................4.05 100 Senegal................................3.14 313
32 Malta ...................................3.99 101 Japan ...................................3.13
33 Namibia ...............................3.98 102 Côte d’Ivoire ........................3.13
34 Libya ....................................3.97 103 Uruguay ...............................3.11
35 El Salvador...........................3.97 104 Madagascar .........................3.11
36 India.....................................3.97 105 Kyrgyz Republic ...................3.11
37 Iceland .................................3.93 106 Poland..................................3.10
38 Ireland..................................3.92 107 France..................................3.07
39 Albania.................................3.85 108 Puerto Rico..........................3.07
40 Ghana ..................................3.85 109 Sweden ...............................3.04
41 Costa Rica ...........................3.85 110 Bolivia ..................................3.01
42 Macedonia, FYR ..................3.84 111 Spain....................................3.00
43 Panama................................3.83 112 Mexico.................................2.99
44 New Zealand .......................3.83 113 Finland .................................2.98
45 Israel....................................3.78 114 Dominican Republic.............2.96
46 Pakistan ...............................3.76 115 Mali......................................2.95
47 Peru .....................................3.76 116 Latvia ...................................2.90
48 Canada.................................3.76 117 Turkey ..................................2.90
49 Czech Republic....................3.75 118 Cameroon............................2.87
50 Nigeria .................................3.74 119 Serbia ..................................2.84
51 Honduras .............................3.73 120 Jamaica ...............................2.84
52 Sri Lanka..............................3.73 121 Kenya...................................2.82
53 Thailand ...............................3.71 122 Portugal ...............................2.82
54 Bangladesh..........................3.71 123 Ecuador ...............................2.79
55 Moldova...............................3.71 124 Guyana ................................2.78
56 Algeria .................................3.70 125 Lithuania ..............................2.74
57 Vietnam ...............................3.70 126 Burundi ................................2.74
58 Netherlands .........................3.69 127 Colombia .............................2.64
59 Gambia, The ........................3.67 128 Chad ....................................2.60
60 Cambodia ............................3.66 129 Denmark..............................2.60
61 Ethiopia................................3.65 130 Romania ..............................2.53
62 Austria .................................3.64 131 Bosnia and Herzegovina......2.44
63 Norway ................................3.63 132 Italy......................................2.39
64 Tanzania ...............................3.59 133 Croatia .................................2.38
65 Australia...............................3.59 134 Belgium ...............................2.32
66 Syria.....................................3.59 135 Ukraine ................................2.30
67 Guatemala ...........................3.58 136 Argentina .............................2.20
68 Mongolia..............................3.58 137 Hungary ...............................2.08
69 Nepal ...................................3.57 138 Brazil ....................................2.03
SOURCE: World Economic Forum, Executive Opinion Survey 2009, 2010
The Global Information Technology Report 2010–2011 © 2011 World Economic Forum](https://image.slidesharecdn.com/wef-gitr-2010-2011-110427122231-phpapp01/85/Wef-gitr-2010-2011-335-320.jpg)
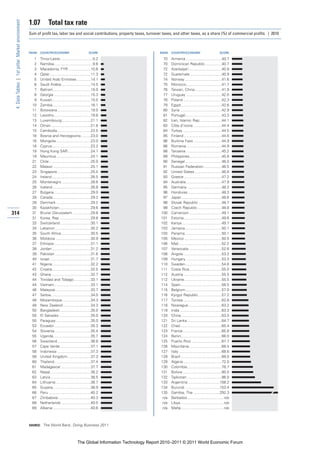
![1.10 Freedom of the press
4: Data Tables | 1st pillar: Market environment
How free is the press in your country? [1 = totally restricted; 7 = completely free] | 2009–2010 weighted average
RANK COUNTRY/ECONOMY SCORE 1 MEAN: 4.99 7 RANK COUNTRY/ECONOMY SCORE 1 MEAN: 4.99 7
1 Denmark..............................6.91 70 Mongolia..............................5.03
2 Sweden ...............................6.82 71 Latvia ...................................5.03
3 Norway ................................6.80 72 Egypt ...................................5.01
4 Netherlands .........................6.74 73 Benin ...................................4.94
5 New Zealand .......................6.66 74 Zambia.................................4.90
6 Finland .................................6.65 75 Senegal................................4.89
7 Switzerland ..........................6.61 76 Mozambique........................4.89
8 Germany..............................6.59 77 Slovenia ...............................4.77
9 Canada.................................6.56 78 Montenegro.........................4.75
10 Belgium ...............................6.54 79 Uganda ................................4.74
11 Costa Rica ...........................6.51 80 Nepal ...................................4.72
12 Israel....................................6.47 81 United Arab Emirates ..........4.71
13 Chile ....................................6.46 82 Cameroon............................4.66
14 Ireland..................................6.42 83 Guyana ................................4.63
15 Puerto Rico..........................6.33 84 Korea, Rep...........................4.62
16 Australia...............................6.31 85 Timor-Leste..........................4.57
17 Taiwan, China ......................6.31 86 Burkina Faso........................4.57
18 United Kingdom...................6.28 87 Saudi Arabia.........................4.49
19 Luxembourg ........................6.21 88 Bosnia and Herzegovina......4.39
20 South Africa.........................6.19 89 Burundi ................................4.39
21 Austria .................................6.16 90 Kenya...................................4.36
22 Peru .....................................6.15 91 Côte d’Ivoire ........................4.33
23 Greece.................................6.11 92 Croatia .................................4.32
24 Japan ...................................6.10 93 Swaziland ............................4.32
25 India.....................................6.10 94 Morocco ..............................4.30
26 Uruguay ...............................6.01 95 Nigeria .................................4.27
27 Estonia.................................5.98 96 Tanzania ...............................4.26
28 Bangladesh..........................5.95 97 Serbia ..................................4.26
29 Malta ...................................5.94 98 Bulgaria................................4.20
30 Cyprus .................................5.94 99 China ...................................4.17
31 Brazil ....................................5.94 100 Albania.................................4.17 317
32 Hong Kong SAR ..................5.93 101 Mauritania............................4.14
33 France..................................5.93 102 Macedonia, FYR ..................4.14
34 Jamaica ...............................5.92 103 Malaysia ..............................4.14
35 Paraguay..............................5.92 104 Vietnam ...............................4.13
36 Ghana ..................................5.91 105 Jordan..................................4.13
37 Kuwait .................................5.90 106 Cambodia ............................4.11
38 United States.......................5.89 107 Lesotho ...............................4.11
39 El Salvador...........................5.85 108 Tunisia..................................4.11
40 Barbados .............................5.85 109 Ukraine ................................4.10
41 Spain....................................5.84 110 Algeria .................................4.09
42 Guatemala ...........................5.82 111 Tajikistan ..............................4.08
43 Philippines ...........................5.79 112 Nicaragua.............................4.03
44 Panama................................5.77 113 Brunei Darussalam ..............3.92
45 Iceland .................................5.76 114 Italy......................................3.89
46 Namibia ...............................5.76 115 Oman...................................3.89
47 Mauritius .............................5.72 116 Gambia, The ........................3.89
48 Portugal ...............................5.68 117 Moldova...............................3.87
49 Poland..................................5.68 118 Angola .................................3.86
50 Honduras .............................5.61 119 Kazakhstan ..........................3.85
51 Trinidad and Tobago.............5.59 120 Georgia ................................3.83
52 Lebanon...............................5.58 121 Chad ....................................3.71
53 Mali......................................5.50 122 Singapore ............................3.70
54 Mexico.................................5.47 123 Sri Lanka..............................3.69
55 Romania ..............................5.45 124 Argentina .............................3.66
56 Lithuania ..............................5.44 125 Azerbaijan ............................3.57
57 Qatar....................................5.42 126 Armenia ...............................3.56
58 Pakistan ...............................5.38 127 Russian Federation..............3.47
59 Thailand ...............................5.37 128 Ecuador ...............................3.45
60 Hungary ...............................5.35 129 Ethiopia................................3.38
61 Indonesia .............................5.33 130 Kyrgyz Republic ...................3.30
62 Bahrain ................................5.30 131 Bolivia ..................................3.21
63 Czech Republic....................5.26 132 Madagascar .........................3.17
64 Colombia .............................5.22 133 Venezuela ............................2.98
65 Cape Verde ..........................5.15 134 Syria.....................................2.96
66 Dominican Republic.............5.15 135 Turkey ..................................2.91
67 Slovak Republic ...................5.13 136 Iran, Islamic Rep..................2.90
68 Botswana ............................5.12 137 Libya ....................................2.53
69 Malawi .................................5.07 138 Zimbabwe............................2.43
SOURCE: World Economic Forum, Executive Opinion Survey 2009, 2010
The Global Information Technology Report 2010–2011 © 2011 World Economic Forum](https://image.slidesharecdn.com/wef-gitr-2010-2011-110427122231-phpapp01/85/Wef-gitr-2010-2011-339-320.jpg)

![2.01 Effectiveness of law-making bodies
4: Data Tables | 2nd pillar: Political and regulatory environment
How effective is your national parliament/congress as a law-making institution? [1 = very ineffective; 7 = very effective, among the best in the
world] | 2009–2010 weighted average
RANK COUNTRY/ECONOMY SCORE 1 MEAN: 3.59 7 RANK COUNTRY/ECONOMY SCORE 1 MEAN: 3.59 7
1 Singapore ............................6.49 70 Portugal ...............................3.50
2 Sweden ...............................5.88 71 Greece.................................3.48
3 New Zealand .......................5.84 72 Uruguay ...............................3.46
4 Australia...............................5.66 73 Libya ....................................3.46
5 Luxembourg ........................5.54 74 Angola .................................3.45
6 Finland .................................5.48 75 Uganda ................................3.39
7 Barbados .............................5.41 76 Thailand ...............................3.36
8 Denmark..............................5.39 77 Mali......................................3.36
9 Oman...................................5.37 78 Belgium ...............................3.33
10 Norway ................................5.24 79 Zimbabwe............................3.31
11 Canada.................................5.11 80 Nigeria .................................3.29
12 United Kingdom...................5.06 81 Kuwait .................................3.29
13 France..................................5.05 82 Russian Federation..............3.29
14 Switzerland ..........................4.96 83 Poland..................................3.26
15 Germany..............................4.95 84 Georgia ................................3.24
16 Tunisia..................................4.94 85 Taiwan, China ......................3.21
17 Mauritius .............................4.91 86 Swaziland ............................3.18
18 Qatar....................................4.84 87 Burkina Faso........................3.16
19 Malta ...................................4.76 88 Honduras .............................3.15
20 Gambia, The ........................4.74 89 Croatia .................................3.14
21 Malaysia ..............................4.63 90 Syria.....................................3.14
22 United Arab Emirates ..........4.62 91 Moldova...............................3.11
23 Netherlands .........................4.60 92 Lesotho ...............................3.09
24 Namibia ...............................4.59 93 Czech Republic....................3.07
25 Botswana ............................4.57 94 Slovak Republic ...................3.03
26 Saudi Arabia.........................4.53 95 Bangladesh..........................3.03
27 Cyprus .................................4.53 96 Cameroon............................3.02
28 Austria .................................4.43 97 Italy......................................2.99
29 South Africa.........................4.42 98 Armenia ...............................2.97
30 China ...................................4.41 99 Senegal................................2.94
320 31 Japan ...................................4.40 100 Lithuania ..............................2.93
32 Ghana ..................................4.38 101 Jordan..................................2.92
33 Cape Verde ..........................4.37 102 Pakistan ...............................2.86
34 Brunei Darussalam ..............4.32 103 Hungary ...............................2.86
35 Israel ....................................4.32 104 Romania ..............................2.85
36 India.....................................4.30 105 Kenya...................................2.83
37 Estonia.................................4.21 106 Serbia ..................................2.81
38 Iceland .................................4.19 107 Côte d’Ivoire ........................2.79
39 Hong Kong SAR ..................4.17 108 Colombia .............................2.79
40 Vietnam ...............................4.15 109 Bulgaria................................2.78
41 Albania.................................4.05 110 Chad ....................................2.78
42 Ireland..................................4.02 111 Algeria .................................2.75
43 Tajikistan ..............................4.00 112 El Salvador...........................2.63
44 Sri Lanka..............................3.99 113 Dominican Republic.............2.59
45 United States.......................3.98 114 Costa Rica ...........................2.59
46 Chile ....................................3.96 115 Latvia ...................................2.58
47 Turkey ..................................3.95 116 Puerto Rico..........................2.56
48 Zambia.................................3.89 117 Madagascar .........................2.53
49 Montenegro.........................3.85 118 Mongolia..............................2.52
50 Iran, Islamic Rep..................3.81 119 Philippines ...........................2.52
51 Azerbaijan ............................3.77 120 Mexico.................................2.48
52 Egypt ...................................3.77 121 Panama................................2.44
53 Tanzania ...............................3.76 122 Brazil ....................................2.44
54 Ethiopia................................3.74 123 Kyrgyz Republic ...................2.44
55 Timor-Leste..........................3.74 124 Lebanon...............................2.40
56 Malawi .................................3.72 125 Mauritania............................2.34
57 Kazakhstan ..........................3.71 126 Burundi ................................2.29
58 Morocco ..............................3.68 127 Nicaragua.............................2.24
59 Bahrain ................................3.68 128 Bolivia ..................................2.22
60 Trinidad and Tobago.............3.67 129 Argentina .............................2.21
61 Mozambique........................3.66 130 Nepal ...................................2.20
62 Cambodia ............................3.62 131 Korea, Rep...........................2.18
63 Indonesia .............................3.60 132 Bosnia and Herzegovina......2.17
64 Macedonia, FYR ..................3.58 133 Ukraine ................................2.03
65 Jamaica ...............................3.55 134 Guatemala ...........................2.02
66 Slovenia ...............................3.54 135 Paraguay..............................2.02
67 Benin ...................................3.52 136 Ecuador ...............................1.93
68 Guyana ................................3.52 137 Peru .....................................1.86
69 Spain....................................3.51 138 Venezuela ............................1.57
SOURCE: World Economic Forum, Executive Opinion Survey 2009, 2010
The Global Information Technology Report 2010–2011 © 2011 World Economic Forum](https://image.slidesharecdn.com/wef-gitr-2010-2011-110427122231-phpapp01/85/Wef-gitr-2010-2011-342-320.jpg)
![2.02 Laws relating to ICT
4: Data Tables | 2nd pillar: Political and regulatory environment
How would you assess your country’s laws relating to the use of information and communication technologies (e.g., electronic commerce, digital
signatures, consumer protection)? [1 = nonexistent; 7 = well developed] | 2009–2010 weighted average
RANK COUNTRY/ECONOMY SCORE 1 MEAN: 3.98 7 RANK COUNTRY/ECONOMY SCORE 1 MEAN: 3.98 7
1 Sweden ...............................5.91 70 Jamaica ...............................3.90
2 Singapore ............................5.91 71 Kenya...................................3.90
3 Estonia.................................5.77 72 Albania.................................3.89
4 Denmark..............................5.69 73 Dominican Republic.............3.89
5 Norway ................................5.59 74 Jordan..................................3.88
6 Hong Kong SAR ..................5.54 75 Cape Verde ..........................3.87
7 Finland .................................5.53 76 Thailand ...............................3.85
8 New Zealand .......................5.53 77 Guatemala ...........................3.82
9 Austria .................................5.53 78 Peru .....................................3.79
10 Canada.................................5.49 79 Poland..................................3.77
11 Australia...............................5.48 80 Latvia ...................................3.75
12 Iceland .................................5.46 81 Burkina Faso........................3.64
13 Switzerland ..........................5.43 82 Botswana ............................3.63
14 Portugal ...............................5.40 83 Greece.................................3.62
15 United States.......................5.39 84 Morocco ..............................3.61
16 United Kingdom...................5.37 85 Philippines ...........................3.55
17 Netherlands .........................5.35 86 Zambia.................................3.53
18 Germany..............................5.34 87 Romania ..............................3.52
19 Luxembourg ........................5.32 88 Russian Federation..............3.48
20 Taiwan, China ......................5.32 89 Serbia ..................................3.48
21 United Arab Emirates ..........5.23 90 El Salvador...........................3.47
22 France..................................5.23 91 Georgia ................................3.47
23 Malta ...................................5.16 92 Namibia ...............................3.47
24 Slovenia ...............................5.14 93 Tanzania ...............................3.46
25 Korea, Rep...........................5.10 94 Mozambique........................3.46
26 Malaysia ..............................5.08 95 Nigeria .................................3.42
27 Bahrain ................................4.98 96 Malawi .................................3.41
28 Tunisia..................................4.97 97 Ukraine ................................3.41
29 Chile ....................................4.96 98 Moldova...............................3.40
30 Oman...................................4.93 99 Honduras .............................3.39
31 Belgium ...............................4.86 100 Mali......................................3.35 321
32 South Africa.........................4.83 101 Kuwait .................................3.32
33 Japan ...................................4.75 102 Ecuador ...............................3.27
34 Qatar....................................4.73 103 Pakistan ...............................3.24
35 Ireland..................................4.72 104 Tajikistan ..............................3.22
36 Saudi Arabia.........................4.66 105 Cambodia ............................3.20
37 Puerto Rico..........................4.62 106 Ethiopia................................3.20
38 Czech Republic....................4.61 107 Iran, Islamic Rep..................3.19
39 India.....................................4.55 108 Trinidad and Tobago.............3.17
40 Spain....................................4.54 109 Uganda ................................3.13
41 Panama................................4.54 110 Argentina .............................3.08
42 Brazil ....................................4.54 111 Benin ...................................3.08
43 Israel....................................4.53 112 Mauritania............................3.06
44 Lithuania ..............................4.51 113 Ghana ..................................3.03
45 Cyprus .................................4.47 114 Armenia ...............................3.02
46 China ...................................4.38 115 Guyana ................................3.02
47 Barbados .............................4.34 116 Venezuela ............................2.93
48 Sri Lanka..............................4.32 117 Mongolia..............................2.93
49 Turkey ..................................4.27 118 Angola .................................2.92
50 Bulgaria................................4.25 119 Nicaragua.............................2.89
51 Colombia .............................4.25 120 Chad ....................................2.81
52 Montenegro.........................4.25 121 Lesotho ...............................2.78
53 Mauritius .............................4.24 122 Zimbabwe............................2.77
54 Macedonia, FYR ..................4.19 123 Algeria .................................2.74
55 Azerbaijan ............................4.09 124 Côte d’Ivoire ........................2.68
56 Gambia, The ........................4.07 125 Nepal ...................................2.63
57 Hungary ...............................4.07 126 Bosnia and Herzegovina......2.63
58 Costa Rica ...........................4.06 127 Bangladesh..........................2.63
59 Uruguay ...............................4.01 128 Cameroon............................2.62
60 Kazakhstan ..........................4.01 129 Kyrgyz Republic ...................2.59
61 Egypt ...................................4.01 130 Paraguay..............................2.59
62 Italy ......................................4.01 131 Swaziland ............................2.57
63 Brunei Darussalam ..............3.98 132 Madagascar .........................2.55
64 Vietnam ...............................3.97 133 Lebanon...............................2.52
65 Senegal................................3.97 134 Timor-Leste..........................2.46
66 Croatia .................................3.93 135 Bolivia ..................................2.39
67 Slovak Republic ...................3.93 136 Syria.....................................2.35
68 Indonesia .............................3.91 137 Burundi ................................2.30
69 Mexico.................................3.90 138 Libya ....................................2.21
SOURCE: World Economic Forum, Executive Opinion Survey 2009, 2010
The Global Information Technology Report 2010–2011 © 2011 World Economic Forum](https://image.slidesharecdn.com/wef-gitr-2010-2011-110427122231-phpapp01/85/Wef-gitr-2010-2011-343-320.jpg)
![2.03 Judicial independence
4: Data Tables | 2nd pillar: Political and regulatory environment
To what extent is the judiciary in your country independent from influences of members of government, citizens, or firms? [1 = heavily influenced;
7 = entirely independent] | 2009–2010 weighted average
RANK COUNTRY/ECONOMY SCORE 1 MEAN: 3.97 7 RANK COUNTRY/ECONOMY SCORE 1 MEAN: 3.97 7
1 New Zealand .......................6.76 70 Latvia ...................................3.66
2 Sweden ...............................6.56 71 Swaziland ............................3.62
3 Denmark..............................6.40 72 Lithuania ..............................3.59
4 Switzerland ..........................6.39 73 Pakistan ...............................3.55
5 Germany..............................6.37 74 Greece.................................3.54
6 Finland .................................6.33 75 Brazil ....................................3.52
7 Qatar....................................6.32 76 Tanzania ...............................3.51
8 United Kingdom...................6.29 77 Colombia .............................3.48
9 Australia...............................6.28 78 Morocco ..............................3.48
10 Ireland..................................6.25 79 Nigeria .................................3.48
11 Canada.................................6.24 80 Italy......................................3.48
12 Netherlands .........................6.23 81 Romania ..............................3.47
13 Norway ................................6.22 82 Turkey ..................................3.40
14 Israel ....................................6.21 83 Uganda ................................3.40
15 Hong Kong SAR ..................6.15 84 Bangladesh..........................3.39
16 Iceland .................................5.91 85 Guyana ................................3.38
17 Luxembourg ........................5.87 86 Azerbaijan ............................3.32
18 Austria .................................5.77 87 Albania.................................3.26
19 Barbados .............................5.74 88 Ethiopia................................3.26
20 Japan ...................................5.70 89 Benin ...................................3.25
21 Singapore ............................5.64 90 Lesotho ...............................3.24
22 Cyprus .................................5.49 91 Mexico.................................3.22
23 Namibia ...............................5.46 92 Nepal ...................................3.21
24 Estonia.................................5.46 93 Tajikistan ..............................3.19
25 Chile ....................................5.36 94 Libya ....................................3.12
26 Costa Rica ...........................5.28 95 Honduras .............................3.12
27 Uruguay ...............................5.26 96 Croatia .................................3.12
28 Belgium ...............................5.20 97 Senegal................................3.09
29 Saudi Arabia.........................5.20 98 Dominican Republic.............3.07
30 Botswana ............................5.20 99 El Salvador...........................2.99
322 31 Oman...................................5.10 100 Bulgaria................................2.96
32 Malta ...................................5.04 101 Angola .................................2.95
33 Bahrain ................................5.04 102 Macedonia, FYR ..................2.94
34 United States.......................4.97 103 Georgia ................................2.93
35 Kuwait .................................4.93 104 Mozambique........................2.93
36 United Arab Emirates ..........4.89 105 Slovak Republic ...................2.90
37 Mauritius .............................4.83 106 Syria.....................................2.88
38 France..................................4.79 107 Cambodia ............................2.87
39 Tunisia..................................4.79 108 Kazakhstan ..........................2.86
40 India.....................................4.77 109 Mali......................................2.85
41 Puerto Rico..........................4.73 110 Philippines ...........................2.84
42 Brunei Darussalam ..............4.71 111 Algeria .................................2.80
43 South Africa.........................4.70 112 Lebanon...............................2.73
44 Trinidad and Tobago.............4.67 113 Guatemala ...........................2.72
45 Sri Lanka..............................4.65 114 Russian Federation..............2.72
46 Malawi .................................4.65 115 Chad ....................................2.68
47 Jordan..................................4.61 116 Cameroon............................2.65
48 Taiwan, China ......................4.60 117 Armenia ...............................2.62
49 Gambia, The ........................4.56 118 Peru .....................................2.61
50 Jamaica ...............................4.45 119 Mongolia..............................2.59
51 Malaysia ..............................4.34 120 Kenya...................................2.58
52 Poland..................................4.33 121 Bosnia and Herzegovina......2.57
53 Thailand ...............................4.32 122 Argentina .............................2.56
54 Portugal ...............................4.29 123 Serbia ..................................2.53
55 Slovenia ...............................4.25 124 Panama................................2.51
56 Montenegro.........................4.10 125 Madagascar .........................2.50
57 Cape Verde ..........................4.06 126 Burkina Faso........................2.46
58 Hungary ...............................4.04 127 Mauritania............................2.38
59 Korea, Rep...........................3.99 128 Bolivia ..................................2.31
60 Czech Republic....................3.97 129 Moldova...............................2.27
61 China ...................................3.97 130 Zimbabwe............................2.26
62 Egypt ...................................3.91 131 Nicaragua.............................2.09
63 Vietnam ...............................3.87 132 Kyrgyz Republic ...................2.06
64 Iran, Islamic Rep..................3.84 133 Ukraine ................................2.00
65 Spain....................................3.82 134 Ecuador ...............................1.99
66 Indonesia .............................3.80 135 Burundi ................................1.93
67 Ghana ..................................3.79 136 Côte d’Ivoire ........................1.93
68 Zambia.................................3.79 137 Paraguay..............................1.70
69 Timor-Leste..........................3.74 138 Venezuela ............................1.69
SOURCE: World Economic Forum, Executive Opinion Survey 2009, 2010
The Global Information Technology Report 2010–2011 © 2011 World Economic Forum](https://image.slidesharecdn.com/wef-gitr-2010-2011-110427122231-phpapp01/85/Wef-gitr-2010-2011-344-320.jpg)
![2.04 Efficiency of legal framework in settling disputes
4: Data Tables | 2nd pillar: Political and regulatory environment
How efficient is the legal framework in your country for private businesses to settle disputes? [1 = extremely inefficient; 7 = highly efficient] |
2009–2010 weighted average
RANK COUNTRY/ECONOMY SCORE 1 MEAN: 3.81 7 RANK COUNTRY/ECONOMY SCORE 1 MEAN: 3.81 7
1 Singapore ............................6.30 70 Senegal................................3.59
2 Sweden ...............................6.12 71 Cambodia ............................3.58
3 Hong Kong SAR ..................6.11 72 Turkey ..................................3.56
4 Norway ................................5.75 73 Spain....................................3.56
5 New Zealand .......................5.72 74 Korea, Rep...........................3.47
6 Qatar....................................5.56 75 Mozambique........................3.46
7 Finland .................................5.46 76 Lithuania ..............................3.46
8 United Kingdom...................5.46 77 Dominican Republic.............3.45
9 Netherlands .........................5.45 78 Iran, Islamic Rep..................3.43
10 Switzerland ..........................5.42 79 Mali......................................3.43
11 Luxembourg ........................5.42 80 Slovenia ...............................3.40
12 Australia...............................5.38 81 Cape Verde ..........................3.40
13 Denmark..............................5.36 82 Brazil ....................................3.38
14 Canada.................................5.26 83 Mauritania............................3.38
15 Germany..............................5.26 84 Jamaica ...............................3.37
16 Oman...................................5.24 85 Kazakhstan ..........................3.36
17 Tunisia..................................5.18 86 Colombia .............................3.36
18 Austria .................................5.14 87 Zimbabwe............................3.36
19 South Africa.........................5.12 88 Georgia ................................3.35
20 Iceland .................................5.08 89 Cameroon............................3.35
21 Barbados .............................4.97 90 Panama................................3.34
22 United Arab Emirates ..........4.94 91 Hungary ...............................3.29
23 France..................................4.91 92 Algeria .................................3.29
24 Namibia ...............................4.89 93 Azerbaijan ............................3.28
25 Gambia, The ........................4.86 94 Honduras .............................3.24
26 Chile ....................................4.80 95 Timor-Leste..........................3.19
27 Japan ...................................4.74 96 Czech Republic....................3.16
28 Cyprus .................................4.72 97 Greece.................................3.16
29 Mauritius .............................4.70 98 Macedonia, FYR ..................3.15
30 Malaysia ..............................4.65 99 Kenya...................................3.12
31 Puerto Rico..........................4.64 100 El Salvador...........................3.12 323
32 Botswana ............................4.62 101 Mexico.................................3.11
33 United States.......................4.58 102 Pakistan ...............................3.10
34 Ireland..................................4.54 103 Armenia ...............................3.08
35 Brunei Darussalam ..............4.42 104 Guatemala ...........................3.08
36 Saudi Arabia.........................4.39 105 Poland..................................3.06
37 Kuwait .................................4.36 106 Lebanon...............................3.02
38 Jordan..................................4.36 107 Peru .....................................3.01
39 Egypt ...................................4.34 108 Guyana ................................3.00
40 Estonia.................................4.27 109 Lesotho ...............................2.99
41 Sri Lanka..............................4.26 110 Moldova...............................2.97
42 Malta ...................................4.22 111 Côte d’Ivoire ........................2.96
43 China ...................................4.21 112 Bangladesh..........................2.92
44 Israel....................................4.19 113 Russian Federation..............2.92
45 Thailand ...............................4.13 114 Romania ..............................2.91
46 India.....................................4.07 115 Burundi ................................2.90
47 Montenegro.........................4.05 116 Latvia ...................................2.89
48 Swaziland ............................4.04 117 Syria.....................................2.89
49 Ghana ..................................4.04 118 Chad ....................................2.87
50 Taiwan, China ......................4.03 119 Angola .................................2.87
51 Belgium ...............................4.03 120 Madagascar .........................2.85
52 Costa Rica ...........................3.97 121 Philippines ...........................2.84
53 Zambia.................................3.93 122 Portugal ...............................2.80
54 Uruguay ...............................3.93 123 Mongolia..............................2.79
55 Malawi .................................3.92 124 Bulgaria................................2.73
56 Morocco ..............................3.90 125 Croatia .................................2.72
57 Bahrain ................................3.86 126 Kyrgyz Republic ...................2.72
58 Albania.................................3.82 127 Nepal ...................................2.68
59 Indonesia .............................3.81 128 Italy......................................2.65
60 Vietnam ...............................3.80 129 Argentina .............................2.61
61 Trinidad and Tobago.............3.77 130 Nicaragua.............................2.57
62 Uganda ................................3.75 131 Serbia ..................................2.57
63 Tajikistan ..............................3.75 132 Slovak Republic ...................2.56
64 Tanzania ...............................3.72 133 Paraguay..............................2.54
65 Benin ...................................3.72 134 Ecuador ...............................2.48
66 Ethiopia................................3.71 135 Bolivia ..................................2.45
67 Nigeria .................................3.70 136 Bosnia and Herzegovina......2.35
68 Burkina Faso........................3.67 137 Ukraine ................................2.26
69 Libya ....................................3.65 138 Venezuela ............................1.99
SOURCE: World Economic Forum, Executive Opinion Survey 2009, 2010
The Global Information Technology Report 2010–2011 © 2011 World Economic Forum](https://image.slidesharecdn.com/wef-gitr-2010-2011-110427122231-phpapp01/85/Wef-gitr-2010-2011-345-320.jpg)
![2.05 Efficiency of legal framework in challenging regulations
4: Data Tables | 2nd pillar: Political and regulatory environment
How efficient is the legal framework in your country for private businesses to challenge the legality of government actions and/or regulations?
[1 = extremely inefficient; 7 = highly efficient] | 2009–2010 weighted average
RANK COUNTRY/ECONOMY SCORE 1 MEAN: 3.67 7 RANK COUNTRY/ECONOMY SCORE 1 MEAN: 3.67 7
1 Sweden ...............................5.81 70 Brazil ....................................3.49
2 Hong Kong SAR ..................5.77 71 Tanzania ...............................3.47
3 Luxembourg ........................5.58 72 Colombia .............................3.45
4 Finland .................................5.55 73 Turkey ..................................3.44
5 Switzerland ..........................5.40 74 Benin ...................................3.40
6 Singapore ............................5.34 75 Honduras .............................3.39
7 New Zealand .......................5.33 76 Mexico.................................3.38
8 Germany..............................5.28 77 Mozambique........................3.36
9 Norway ................................5.27 78 Slovenia ...............................3.35
10 Austria .................................5.24 79 Nigeria .................................3.34
11 Denmark..............................5.22 80 Jamaica ...............................3.31
12 Netherlands .........................5.14 81 Senegal................................3.30
13 Australia...............................5.00 82 Mauritania............................3.28
14 Iceland .................................4.99 83 Czech Republic....................3.28
15 Namibia ...............................4.91 84 Kazakhstan ..........................3.25
16 United Kingdom...................4.91 85 Panama................................3.25
17 France..................................4.91 86 Korea, Rep...........................3.23
18 Canada.................................4.90 87 Cape Verde ..........................3.22
19 Tunisia..................................4.84 88 Timor-Leste..........................3.18
20 South Africa.........................4.72 89 Angola .................................3.18
21 Cyprus .................................4.71 90 Lithuania ..............................3.17
22 Barbados .............................4.70 91 Burkina Faso........................3.15
23 Oman...................................4.69 92 Peru .....................................3.13
24 Chile ....................................4.60 93 Greece.................................3.12
25 United Arab Emirates ..........4.51 94 Poland..................................3.11
26 Botswana ............................4.51 95 Pakistan ...............................3.11
27 Ireland..................................4.51 96 Cameroon............................3.10
28 Mauritius .............................4.42 97 Georgia ................................3.07
29 Saudi Arabia.........................4.40 98 Moldova...............................3.06
30 Malaysia ..............................4.38 99 Algeria .................................3.05
324 31 Puerto Rico..........................4.34 100 El Salvador...........................3.04
32 Qatar....................................4.31 101 Bangladesh..........................3.03
33 Japan ...................................4.31 102 Armenia ...............................3.00
34 Uruguay ...............................4.27 103 Guatemala ...........................2.99
35 United States.......................4.27 104 Chad ....................................2.99
36 Gambia, The ........................4.25 105 Madagascar .........................2.98
37 India.....................................4.22 106 Guyana ................................2.98
38 Costa Rica ...........................4.22 107 Kenya...................................2.98
39 Montenegro.........................4.20 108 Portugal ...............................2.96
40 Estonia.................................4.19 109 Macedonia, FYR ..................2.95
41 Kuwait .................................4.16 110 Romania ..............................2.93
42 Israel ....................................4.14 111 Iran, Islamic Rep..................2.86
43 Belgium ...............................4.09 112 Mongolia..............................2.85
44 Bahrain ................................4.08 113 Hungary ...............................2.85
45 Taiwan, China ......................4.06 114 Russian Federation..............2.83
46 Sri Lanka..............................4.05 115 Philippines ...........................2.83
47 Thailand ...............................4.02 116 Côte d’Ivoire ........................2.82
48 Malta ...................................3.99 117 Latvia ...................................2.80
49 Jordan..................................3.98 118 Bulgaria................................2.79
50 China ...................................3.97 119 Dominican Republic.............2.78
51 Malawi .................................3.95 120 Syria.....................................2.74
52 Morocco ..............................3.91 121 Italy......................................2.73
53 Trinidad and Tobago.............3.90 122 Nepal ...................................2.72
54 Indonesia .............................3.86 123 Lesotho ...............................2.69
55 Albania.................................3.81 124 Serbia ..................................2.69
56 Ghana ..................................3.78 125 Croatia .................................2.63
57 Vietnam ...............................3.78 126 Kyrgyz Republic ...................2.62
58 Brunei Darussalam ..............3.77 127 Burundi ................................2.62
59 Swaziland ............................3.77 128 Paraguay..............................2.54
60 Cambodia ............................3.75 129 Zimbabwe............................2.43
61 Azerbaijan ............................3.75 130 Slovak Republic ...................2.36
62 Uganda ................................3.74 131 Ecuador ...............................2.36
63 Tajikistan ..............................3.73 132 Lebanon...............................2.36
64 Spain....................................3.72 133 Nicaragua.............................2.34
65 Zambia.................................3.62 134 Bolivia ..................................2.33
66 Mali......................................3.60 135 Bosnia and Herzegovina......2.32
67 Libya ....................................3.54 136 Argentina .............................2.27
68 Egypt ...................................3.54 137 Ukraine ................................2.26
69 Ethiopia................................3.49 138 Venezuela ............................1.47
SOURCE: World Economic Forum, Executive Opinion Survey 2009, 2010
The Global Information Technology Report 2010–2011 © 2011 World Economic Forum](https://image.slidesharecdn.com/wef-gitr-2010-2011-110427122231-phpapp01/85/Wef-gitr-2010-2011-346-320.jpg)
![2.06 Property rights
4: Data Tables | 2nd pillar: Political and regulatory environment
How would you rate the protection of property rights, including financial assets, in your country? [1 = very weak; 7 = very strong] | 2009–2010
weighted average
RANK COUNTRY/ECONOMY SCORE 1 MEAN: 4.38 7 RANK COUNTRY/ECONOMY SCORE 1 MEAN: 4.38 7
1 Switzerland ..........................6.41 70 Latvia ...................................4.27
2 Finland .................................6.41 71 Brazil ....................................4.27
3 Singapore ............................6.34 72 Jamaica ...............................4.27
4 Hong Kong SAR ..................6.29 73 Slovak Republic ...................4.25
5 Sweden ...............................6.28 74 Trinidad and Tobago.............4.22
6 Luxembourg ........................6.24 75 Ghana ..................................4.21
7 Austria .................................6.15 76 Malawi .................................4.18
8 Germany..............................6.12 77 Burkina Faso........................4.18
9 Norway ................................6.07 78 Romania ..............................4.17
10 Canada.................................6.06 79 Zambia.................................4.14
11 Denmark..............................6.03 80 Vietnam ...............................4.08
12 Puerto Rico..........................5.90 81 El Salvador...........................4.07
13 Ireland..................................5.89 82 Turkey ..................................4.05
14 Australia...............................5.87 83 Indonesia .............................4.04
15 Netherlands .........................5.84 84 Senegal................................4.04
16 France..................................5.83 85 Dominican Republic.............3.98
17 United Kingdom...................5.75 86 Croatia .................................3.96
18 New Zealand .......................5.73 87 Mexico.................................3.93
19 Taiwan, China ......................5.65 88 Thailand ...............................3.91
20 Namibia ...............................5.64 89 Azerbaijan ............................3.85
21 Bahrain ................................5.62 90 Colombia .............................3.84
22 Barbados .............................5.62 91 Peru .....................................3.83
23 Japan ...................................5.58 92 Honduras .............................3.82
24 Oman...................................5.51 93 Uganda ................................3.81
25 Qatar....................................5.49 94 Guyana ................................3.73
26 Belgium ...............................5.45 95 Cameroon............................3.69
27 Cyprus .................................5.43 96 Tajikistan ..............................3.67
28 Saudi Arabia.........................5.42 97 Armenia ...............................3.67
29 South Africa.........................5.40 98 Philippines ...........................3.67
30 Jordan..................................5.40 99 Cape Verde ..........................3.66
31 Tunisia..................................5.38 100 Lesotho ...............................3.66 325
32 Iceland .................................5.38 101 Guatemala ...........................3.66
33 Estonia.................................5.33 102 Kenya...................................3.65
34 Malta ...................................5.31 103 Tanzania ...............................3.65
35 Botswana ............................5.30 104 Macedonia, FYR ..................3.65
36 Mauritius .............................5.29 105 Algeria .................................3.57
37 Chile ....................................5.21 106 Pakistan ...............................3.57
38 China ...................................5.11 107 Mauritania............................3.54
39 Gambia, The ........................5.10 108 Mali......................................3.53
40 United States.......................5.10 109 Cambodia ............................3.51
41 Malaysia ..............................5.09 110 Libya ....................................3.49
42 Portugal ...............................5.04 111 Kazakhstan ..........................3.47
43 United Arab Emirates ..........5.03 112 Bangladesh..........................3.44
44 Spain....................................4.92 113 Côte d’Ivoire ........................3.39
45 Kuwait .................................4.92 114 Mongolia..............................3.36
46 Swaziland ............................4.87 115 Albania.................................3.35
47 Montenegro.........................4.75 116 Mozambique........................3.33
48 Israel....................................4.75 117 Nigeria .................................3.33
49 Uruguay ...............................4.74 118 Moldova...............................3.31
50 Panama................................4.74 119 Georgia ................................3.24
51 Brunei Darussalam ..............4.72 120 Bulgaria................................3.23
52 Greece.................................4.72 121 Serbia ..................................3.21
53 Korea, Rep...........................4.71 122 Ecuador ...............................3.18
54 Benin ...................................4.67 123 Nicaragua.............................3.08
55 Egypt ...................................4.63 124 Nepal ...................................3.05
56 Lebanon...............................4.63 125 Madagascar .........................3.01
57 Slovenia ...............................4.63 126 Burundi ................................2.96
58 Poland..................................4.59 127 Russian Federation..............2.94
59 Ethiopia................................4.54 128 Paraguay..............................2.93
60 India.....................................4.54 129 Angola .................................2.87
61 Syria.....................................4.43 130 Timor-Leste..........................2.84
62 Morocco ..............................4.42 131 Kyrgyz Republic ...................2.78
63 Sri Lanka..............................4.42 132 Bosnia and Herzegovina......2.69
64 Czech Republic....................4.39 133 Argentina .............................2.65
65 Hungary ...............................4.36 134 Ukraine ................................2.60
66 Costa Rica ...........................4.35 135 Chad ....................................2.40
67 Lithuania ..............................4.34 136 Bolivia ..................................2.19
68 Italy ......................................4.30 137 Zimbabwe............................2.17
69 Iran, Islamic Rep..................4.29 138 Venezuela ............................1.75
SOURCE: World Economic Forum, Executive Opinion Survey 2009, 2010
The Global Information Technology Report 2010–2011 © 2011 World Economic Forum](https://image.slidesharecdn.com/wef-gitr-2010-2011-110427122231-phpapp01/85/Wef-gitr-2010-2011-347-320.jpg)
![2.07 Intellectual property protection
4: Data Tables | 2nd pillar: Political and regulatory environment
How would you rate intellectual property protection, including anti-counterfeiting measures, in your country? [1 = very weak; 7 = very strong] |
2009–2010 weighted average
RANK COUNTRY/ECONOMY SCORE 1 MEAN: 3.71 7 RANK COUNTRY/ECONOMY SCORE 1 MEAN: 3.71 7
1 Sweden ...............................6.23 70 Ethiopia................................3.43
2 Finland .................................6.16 71 Morocco ..............................3.39
3 Singapore ............................6.12 72 Trinidad and Tobago.............3.34
4 Switzerland ..........................6.01 73 Tanzania ...............................3.33
5 Luxembourg ........................6.00 74 Syria.....................................3.30
6 France..................................5.86 75 Ghana ..................................3.30
7 New Zealand .......................5.82 76 Burkina Faso........................3.27
8 Puerto Rico..........................5.81 77 Swaziland ............................3.24
9 Germany..............................5.75 78 Jamaica ...............................3.24
10 Netherlands .........................5.68 79 Honduras .............................3.17
11 Austria .................................5.68 80 Romania ..............................3.17
12 Denmark..............................5.67 81 Senegal................................3.16
13 Canada.................................5.63 82 Tajikistan ..............................3.15
14 Australia...............................5.63 83 Thailand ...............................3.11
15 Ireland..................................5.60 84 Mexico.................................3.10
16 Norway ................................5.59 85 Pakistan ...............................3.10
17 United Kingdom...................5.50 86 Macedonia, FYR ..................3.09
18 Hong Kong SAR ..................5.35 87 Zimbabwe............................3.06
19 United Arab Emirates ..........5.30 88 Brazil ....................................3.06
20 Oman...................................5.28 89 Guyana ................................3.06
21 Japan ...................................5.22 90 Benin ...................................3.05
22 Bahrain ................................5.17 91 Lesotho ...............................3.01
23 Belgium ...............................5.12 92 Colombia .............................2.95
24 United States.......................5.11 93 Kenya...................................2.91
25 Iceland .................................5.09 94 Nigeria .................................2.88
26 Taiwan, China ......................4.95 95 El Salvador...........................2.87
27 South Africa.........................4.92 96 Georgia ................................2.87
28 Qatar....................................4.83 97 Kazakhstan ..........................2.85
29 Barbados .............................4.83 98 Cambodia ............................2.84
30 Saudi Arabia.........................4.80 99 Uganda ................................2.83
326 31 Namibia ...............................4.76 100 Albania.................................2.81
32 Cyprus .................................4.72 101 Libya ....................................2.81
33 Malaysia ..............................4.67 102 Philippines ...........................2.78
34 Estonia.................................4.64 103 Dominican Republic.............2.77
35 Gambia, The ........................4.64 104 Algeria .................................2.75
36 Malta ...................................4.63 105 Cameroon............................2.73
37 Tunisia..................................4.45 106 Armenia ...............................2.72
38 Jordan..................................4.41 107 Mali......................................2.71
39 Slovenia ...............................4.41 108 Vietnam ...............................2.70
40 Portugal ...............................4.38 109 Lebanon...............................2.69
41 Spain....................................4.26 110 Serbia ..................................2.65
42 Israel ....................................4.20 111 Bulgaria................................2.64
43 Korea, Rep...........................4.13 112 Ukraine ................................2.64
44 Botswana ............................4.11 113 Iran, Islamic Rep..................2.62
45 Sri Lanka..............................4.10 114 Nicaragua.............................2.61
46 Kuwait .................................4.10 115 Nepal ...................................2.61
47 Panama................................4.03 116 Turkey ..................................2.59
48 China ...................................3.99 117 Moldova...............................2.59
49 Greece.................................3.96 118 Russian Federation..............2.58
50 Hungary ...............................3.96 119 Angola .................................2.58
51 Czech Republic....................3.94 120 Guatemala ...........................2.57
52 Uruguay ...............................3.88 121 Bangladesh..........................2.56
53 Mauritius .............................3.87 122 Peru .....................................2.56
54 Brunei Darussalam ..............3.87 123 Mozambique........................2.55
55 Malawi .................................3.80 124 Mauritania............................2.51
56 Slovak Republic ...................3.80 125 Argentina .............................2.49
57 Indonesia .............................3.78 126 Cape Verde ..........................2.47
58 Chile ....................................3.73 127 Ecuador ...............................2.46
59 Poland..................................3.72 128 Kyrgyz Republic ...................2.35
60 Italy ......................................3.66 129 Mongolia..............................2.34
61 Montenegro.........................3.63 130 Chad ....................................2.32
62 Azerbaijan ............................3.60 131 Timor-Leste..........................2.28
63 Latvia ...................................3.59 132 Bosnia and Herzegovina......2.25
64 Zambia.................................3.59 133 Madagascar .........................2.21
65 India.....................................3.58 134 Paraguay..............................2.19
66 Egypt ...................................3.58 135 Côte d’Ivoire ........................2.16
67 Costa Rica ...........................3.56 136 Venezuela ............................1.92
68 Lithuania ..............................3.54 137 Burundi ................................1.89
69 Croatia .................................3.53 138 Bolivia ..................................1.85
SOURCE: World Economic Forum, Executive Opinion Survey 2009, 2010
The Global Information Technology Report 2010–2011 © 2011 World Economic Forum](https://image.slidesharecdn.com/wef-gitr-2010-2011-110427122231-phpapp01/85/Wef-gitr-2010-2011-348-320.jpg)
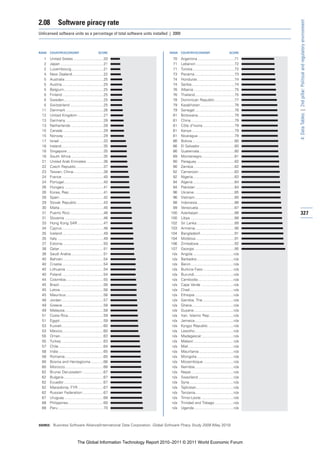
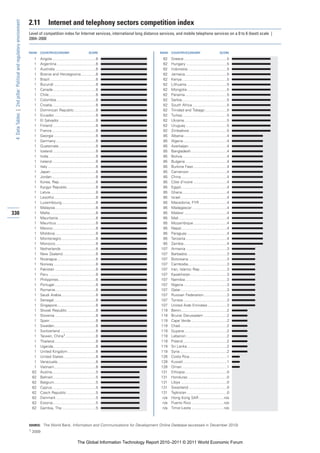
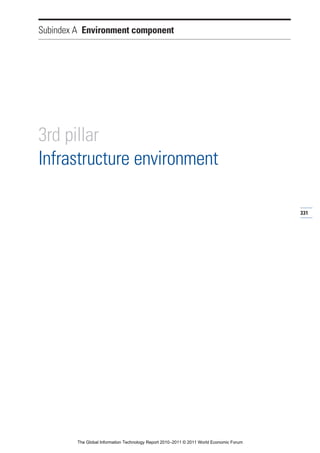
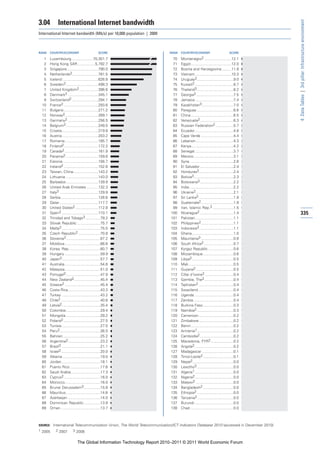
![3.07 Quality of scientific research institutions
4: Data Tables | 3rd pillar: Infrastructure environment
How would you assess the quality of scientific research institutions in your country? [1 = very poor; 7 = the best in their field internationally] |
2009–2010 weighted average
RANK COUNTRY/ECONOMY SCORE 1 MEAN: 3.76 7 RANK COUNTRY/ECONOMY SCORE 1 MEAN: 3.76 7
1 Israel ....................................6.24 70 Malta ...................................3.54
2 Switzerland ..........................6.20 71 Macedonia, FYR ..................3.52
3 United Kingdom...................6.05 72 Mali......................................3.51
4 United States.......................5.95 73 Bulgaria................................3.51
5 Sweden ...............................5.92 74 Zambia.................................3.47
6 Germany..............................5.87 75 Kuwait .................................3.47
7 Belgium ...............................5.74 76 Malawi .................................3.45
8 Canada.................................5.71 77 Azerbaijan ............................3.43
9 Netherlands .........................5.63 78 Gambia, The ........................3.42
10 Australia...............................5.57 79 Pakistan ...............................3.41
11 Singapore ............................5.54 80 Namibia ...............................3.41
12 Denmark..............................5.52 81 Colombia .............................3.34
13 Finland .................................5.37 82 Botswana ............................3.34
14 New Zealand .......................5.33 83 Romania ..............................3.32
15 Japan ...................................5.32 84 Mozambique........................3.31
16 Ireland..................................5.29 85 Benin ...................................3.31
17 Taiwan, China ......................5.24 86 Mauritius .............................3.30
18 Hungary ...............................5.22 87 Tanzania ...............................3.30
19 France..................................5.18 88 Greece.................................3.30
20 Austria .................................5.12 89 Turkey ..................................3.26
21 Czech Republic....................5.09 90 Slovak Republic ...................3.25
22 Qatar....................................5.08 91 Brunei Darussalam ..............3.21
23 Norway ................................5.00 92 Côte d’Ivoire ........................3.16
24 Iceland .................................4.95 93 Morocco ..............................3.14
25 Korea, Rep...........................4.82 94 Guatemala ...........................3.13
26 Estonia.................................4.75 95 Algeria .................................3.09
27 Slovenia ...............................4.71 96 Cameroon............................3.09
28 Portugal ...............................4.70 97 Jordan..................................3.08
29 South Africa.........................4.70 98 Uganda ................................3.04
30 India.....................................4.70 99 Tajikistan ..............................3.03
338 31 Costa Rica ...........................4.69 100 Venezuela ............................3.02
32 Malaysia ..............................4.67 101 Ethiopia................................3.01
33 Puerto Rico..........................4.60 102 Armenia ...............................3.00
34 Luxembourg ........................4.56 103 Bosnia and Herzegovina......2.97
35 Hong Kong SAR ..................4.46 104 Moldova...............................2.97
36 Montenegro.........................4.39 105 Cambodia ............................2.93
37 Saudi Arabia.........................4.35 106 Zimbabwe............................2.92
38 Tunisia..................................4.34 107 Philippines ...........................2.90
39 China ...................................4.32 108 Peru .....................................2.89
40 Lithuania ..............................4.23 109 Egypt ...................................2.88
41 Cyprus .................................4.21 110 Mongolia..............................2.86
42 Brazil ....................................4.19 111 Kazakhstan ..........................2.85
43 Spain....................................4.16 112 Nigeria .................................2.82
44 Indonesia .............................4.16 113 Honduras .............................2.81
45 United Arab Emirates ..........4.14 114 Madagascar .........................2.81
46 Argentina .............................4.11 115 Bangladesh..........................2.80
47 Poland..................................4.09 116 Bahrain ................................2.78
48 Senegal................................4.08 117 Lesotho ...............................2.71
49 Sri Lanka..............................4.07 118 Georgia ................................2.69
50 Barbados .............................4.05 119 Guyana ................................2.62
51 Croatia .................................4.01 120 Cape Verde ..........................2.61
52 Iran, Islamic Rep..................3.95 121 Dominican Republic.............2.60
53 Russian Federation..............3.94 122 Bolivia ..................................2.58
54 Kenya...................................3.93 123 Chad ....................................2.57
55 Chile ....................................3.93 124 Libya ....................................2.55
56 Serbia ..................................3.89 125 Nicaragua.............................2.54
57 Oman...................................3.88 126 Syria.....................................2.47
58 Burkina Faso........................3.84 127 Albania.................................2.47
59 Thailand ...............................3.83 128 Burundi ................................2.46
60 Mexico.................................3.80 129 Lebanon...............................2.42
61 Latvia ...................................3.79 130 Swaziland ............................2.40
62 Uruguay ...............................3.77 131 Ecuador ...............................2.39
63 Vietnam ...............................3.77 132 El Salvador...........................2.34
64 Ghana ..................................3.76 133 Kyrgyz Republic ...................2.18
65 Italy ......................................3.75 134 Timor-Leste..........................2.11
66 Panama................................3.74 135 Nepal ...................................2.10
67 Jamaica ...............................3.72 136 Mauritania............................2.03
68 Ukraine ................................3.61 137 Paraguay..............................1.82
69 Trinidad and Tobago.............3.55 138 Angola .................................1.46
SOURCE: World Economic Forum, Executive Opinion Survey 2009, 2010
The Global Information Technology Report 2010–2011 © 2011 World Economic Forum](https://image.slidesharecdn.com/wef-gitr-2010-2011-110427122231-phpapp01/85/Wef-gitr-2010-2011-360-320.jpg)
![3.08 Availability of scientists and engineers
4: Data Tables | 3rd pillar: Infrastructure environment
To what extent are scientists and engineers available in your country? [1 = not at all; 7 = widely available] | 2009–2010 weighted average
RANK COUNTRY/ECONOMY SCORE 1 MEAN: 4.10 7 RANK COUNTRY/ECONOMY SCORE 1 MEAN: 4.10 7
1 Finland .................................6.02 70 Kenya...................................4.04
2 Japan ...................................5.80 71 Slovak Republic ...................4.03
3 Sweden ...............................5.79 72 Mongolia..............................4.01
4 United States.......................5.67 73 Slovenia ...............................4.00
5 Iceland .................................5.66 74 Malta ...................................4.00
6 Canada.................................5.56 75 Bangladesh..........................3.99
7 Tunisia..................................5.55 76 Argentina .............................3.97
8 Taiwan, China ......................5.47 77 Bulgaria................................3.97
9 Qatar....................................5.33 78 Azerbaijan ............................3.95
10 Singapore ............................5.31 79 Nigeria .................................3.94
11 Switzerland ..........................5.27 80 Pakistan ...............................3.92
12 France..................................5.26 81 Luxembourg ........................3.91
13 Belgium ...............................5.23 82 Guatemala ...........................3.91
14 Puerto Rico..........................5.18 83 Malawi .................................3.87
15 India.....................................5.15 84 Uruguay ...............................3.85
16 Ireland..................................5.13 85 Croatia .................................3.85
17 Israel....................................5.12 86 Colombia .............................3.82
18 Norway ................................5.11 87 Oman...................................3.80
19 Denmark..............................5.06 88 Zambia.................................3.79
20 United Arab Emirates ..........5.02 89 Mexico.................................3.78
21 Greece.................................5.01 90 Ghana ..................................3.70
22 Netherlands .........................4.97 91 Kazakhstan ..........................3.68
23 Korea, Rep...........................4.94 92 Serbia ..................................3.68
24 Chile ....................................4.93 93 Armenia ...............................3.66
25 Egypt ...................................4.88 94 Burkina Faso........................3.65
26 Jordan..................................4.86 95 Macedonia, FYR ..................3.65
27 Germany..............................4.82 96 Philippines ...........................3.63
28 Costa Rica ...........................4.79 97 Chad ....................................3.62
29 United Kingdom...................4.78 98 Latvia ...................................3.60
30 Austria .................................4.75 99 Panama................................3.59
31 Indonesia .............................4.70 100 Mali......................................3.59 339
32 Cyprus .................................4.67 101 Peru .....................................3.58
33 Malaysia ..............................4.67 102 Uganda ................................3.57
34 Saudi Arabia.........................4.63 103 Mauritania............................3.55
35 China ...................................4.62 104 Libya ....................................3.52
36 Lebanon...............................4.60 105 Botswana ............................3.50
37 Iran, Islamic Rep..................4.59 106 Burundi ................................3.49
38 Portugal ...............................4.56 107 Cape Verde ..........................3.47
39 Cameroon............................4.53 108 Venezuela ............................3.41
40 Thailand ...............................4.51 109 Brunei Darussalam ..............3.40
41 Bahrain ................................4.50 110 Tajikistan ..............................3.39
42 Côte d’Ivoire ........................4.50 111 Mauritius .............................3.39
43 Algeria .................................4.49 112 Tanzania ...............................3.37
44 Turkey ..................................4.48 113 Honduras .............................3.35
45 Australia...............................4.47 114 Bosnia and Herzegovina......3.35
46 Morocco ..............................4.45 115 South Africa.........................3.27
47 Spain....................................4.44 116 Dominican Republic.............3.25
48 Hungary ...............................4.43 117 Moldova...............................3.25
49 Sri Lanka..............................4.41 118 Mozambique........................3.24
50 Czech Republic....................4.40 119 Bolivia ..................................3.22
51 Lithuania ..............................4.39 120 Cambodia ............................3.19
52 Madagascar .........................4.36 121 Georgia ................................3.19
53 Ukraine ................................4.33 122 Jamaica ...............................3.13
54 Italy ......................................4.31 123 Albania.................................3.13
55 Romania ..............................4.31 124 El Salvador...........................3.10
56 Russian Federation..............4.27 125 Nicaragua.............................3.10
57 Kuwait .................................4.25 126 Lesotho ...............................3.10
58 Estonia.................................4.24 127 Gambia, The ........................3.05
59 Benin ...................................4.24 128 Ethiopia................................3.05
60 Poland..................................4.21 129 Nepal ...................................3.01
61 Senegal................................4.21 130 Zimbabwe............................2.93
62 Syria.....................................4.19 131 Ecuador ...............................2.92
63 Montenegro.........................4.16 132 Guyana ................................2.91
64 Hong Kong SAR ..................4.13 133 Angola .................................2.90
65 Trinidad and Tobago.............4.13 134 Namibia ...............................2.88
66 Vietnam ...............................4.10 135 Kyrgyz Republic ...................2.77
67 New Zealand .......................4.10 136 Paraguay..............................2.62
68 Brazil ....................................4.05 137 Timor-Leste..........................2.45
69 Barbados .............................4.04 138 Swaziland ............................2.41
SOURCE: World Economic Forum, Executive Opinion Survey 2009, 2010
The Global Information Technology Report 2010–2011 © 2011 World Economic Forum](https://image.slidesharecdn.com/wef-gitr-2010-2011-110427122231-phpapp01/85/Wef-gitr-2010-2011-361-320.jpg)
![3.09 Local availability of specialized research and training services
4: Data Tables | 3rd pillar: Infrastructure environment
In your country, to what extent are high-quality, specialized training services available? [1 = not available; 7 = widely available] | 2009–2010
weighted average
RANK COUNTRY/ECONOMY SCORE 1 MEAN: 4.12 7 RANK COUNTRY/ECONOMY SCORE 1 MEAN: 4.12 7
1 Switzerland ..........................6.47 70 Barbados .............................4.08
2 Germany..............................6.21 71 Qatar....................................4.07
3 Sweden ...............................6.11 72 Gambia, The ........................4.01
4 Netherlands .........................6.02 73 Peru .....................................4.01
5 France..................................5.89 74 Iran, Islamic Rep..................3.99
6 Austria .................................5.89 75 Kuwait .................................3.98
7 Finland .................................5.81 76 Kazakhstan ..........................3.97
8 Denmark..............................5.80 77 Philippines ...........................3.95
9 Belgium ...............................5.79 78 Dominican Republic.............3.93
10 United States.......................5.76 79 Montenegro.........................3.93
11 Canada.................................5.69 80 Bulgaria................................3.92
12 United Kingdom...................5.67 81 Bahrain ................................3.92
13 Japan ...................................5.55 82 Benin ...................................3.91
14 Norway ................................5.49 83 El Salvador...........................3.91
15 Hong Kong SAR ..................5.42 84 Ukraine ................................3.89
16 Iceland .................................5.37 85 Oman...................................3.79
17 Czech Republic....................5.36 86 Zambia.................................3.78
18 Puerto Rico..........................5.33 87 Mauritius .............................3.76
19 Singapore ............................5.27 88 Greece.................................3.74
20 Australia...............................5.26 89 Honduras .............................3.73
21 Taiwan, China ......................5.17 90 Nigeria .................................3.72
22 Poland..................................5.09 91 Burkina Faso........................3.70
23 United Arab Emirates ..........5.08 92 Malawi .................................3.67
24 Ireland..................................5.05 93 Moldova...............................3.61
25 Malaysia ..............................5.02 94 Albania.................................3.55
26 Spain....................................5.01 95 Romania ..............................3.54
27 Tunisia..................................4.97 96 Cameroon............................3.52
28 Luxembourg ........................4.91 97 Pakistan ...............................3.52
29 New Zealand .......................4.90 98 Ghana ..................................3.51
30 Israel ....................................4.88 99 Jamaica ...............................3.50
340 31 Chile ....................................4.86 100 Serbia ..................................3.45
32 Costa Rica ...........................4.86 101 Uganda ................................3.45
33 Estonia.................................4.77 102 Macedonia, FYR ..................3.45
34 Saudi Arabia.........................4.70 103 Ecuador ...............................3.44
35 Slovenia ...............................4.68 104 Vietnam ...............................3.42
36 Brazil ....................................4.67 105 Algeria .................................3.38
37 Italy ......................................4.67 106 Guyana ................................3.38
38 Lithuania ..............................4.61 107 Tanzania ...............................3.37
39 Korea, Rep...........................4.60 108 Botswana ............................3.36
40 Portugal ...............................4.57 109 Zimbabwe............................3.34
41 Slovak Republic ...................4.56 110 Madagascar .........................3.33
42 Argentina .............................4.53 111 Cambodia ............................3.33
43 Cyprus .................................4.47 112 Bolivia ..................................3.32
44 Malta ...................................4.46 113 Mali......................................3.31
45 Senegal................................4.45 114 Syria.....................................3.27
46 Sri Lanka..............................4.45 115 Brunei Darussalam ..............3.22
47 Hungary ...............................4.43 116 Namibia ...............................3.20
48 Jordan..................................4.42 117 Lesotho ...............................3.20
49 South Africa.........................4.41 118 Nicaragua.............................3.14
50 China ...................................4.41 119 Kyrgyz Republic ...................3.12
51 India.....................................4.39 120 Tajikistan ..............................3.09
52 Indonesia .............................4.39 121 Ethiopia................................3.07
53 Lebanon...............................4.37 122 Venezuela ............................3.04
54 Guatemala ...........................4.36 123 Armenia ...............................3.03
55 Mexico.................................4.30 124 Georgia ................................3.01
56 Kenya...................................4.29 125 Mozambique........................3.00
57 Uruguay ...............................4.27 126 Bangladesh..........................3.00
58 Turkey ..................................4.24 127 Bosnia and Herzegovina......2.96
59 Trinidad and Tobago.............4.24 128 Cape Verde ..........................2.95
60 Morocco ..............................4.23 129 Paraguay..............................2.92
61 Croatia .................................4.21 130 Chad ....................................2.88
62 Panama................................4.18 131 Nepal ...................................2.74
63 Côte d’Ivoire ........................4.16 132 Angola .................................2.69
64 Egypt ...................................4.15 133 Libya ....................................2.66
65 Colombia .............................4.12 134 Mauritania............................2.59
66 Azerbaijan ............................4.10 135 Timor-Leste..........................2.57
67 Russian Federation..............4.09 136 Swaziland ............................2.31
68 Latvia ...................................4.08 137 Burundi ................................2.15
69 Thailand ...............................4.08 138 Mongolia..............................1.92
SOURCE: World Economic Forum, Executive Opinion Survey 2009, 2010
The Global Information Technology Report 2010–2011 © 2011 World Economic Forum](https://image.slidesharecdn.com/wef-gitr-2010-2011-110427122231-phpapp01/85/Wef-gitr-2010-2011-362-320.jpg)
![3.10 Accessibility of digital content
4: Data Tables | 3rd pillar: Infrastructure environment
In your country, how accessible is digital content (e.g., text and audiovisual content, software products) via multiple platforms (e.g., fixed-line
Internet, wireless Internet, mobile network, satellite, etc.)? [1 = not accessible at all; 7 = widely accessible] | 2009–2010 weighted average
RANK COUNTRY/ECONOMY SCORE 1 MEAN: 4.84 7 RANK COUNTRY/ECONOMY SCORE 1 MEAN: 4.84 7
1 Iceland .................................6.62 70 Azerbaijan ............................4.84
2 Switzerland ..........................6.58 71 Lebanon...............................4.83
3 Sweden ...............................6.53 72 Poland..................................4.82
4 Austria .................................6.41 73 Kazakhstan ..........................4.79
5 Estonia.................................6.39 74 Indonesia .............................4.77
6 Norway ................................6.38 75 Senegal................................4.76
7 Hong Kong SAR ..................6.34 76 Gambia, The ........................4.74
8 Japan ...................................6.32 77 Mauritius .............................4.74
9 Netherlands .........................6.30 78 Pakistan ...............................4.73
10 United Kingdom...................6.29 79 Kuwait .................................4.70
11 Israel....................................6.27 80 Costa Rica ...........................4.70
12 Singapore ............................6.25 81 Philippines ...........................4.69
13 Denmark..............................6.24 82 Peru .....................................4.68
14 Korea, Rep...........................6.21 83 Greece.................................4.67
15 Canada.................................6.21 84 Egypt ...................................4.62
16 Finland .................................6.21 85 Honduras .............................4.62
17 Germany..............................6.17 86 Colombia .............................4.61
18 United States.......................6.14 87 Sri Lanka..............................4.61
19 Belgium ...............................6.13 88 Italy......................................4.60
20 Taiwan, China ......................6.06 89 Georgia ................................4.60
21 Qatar....................................6.04 90 South Africa.........................4.57
22 Lithuania ..............................6.02 91 Argentina .............................4.55
23 Portugal ...............................6.02 92 Kyrgyz Republic ...................4.53
24 Czech Republic....................5.96 93 India.....................................4.51
25 Hungary ...............................5.94 94 Mexico.................................4.51
26 United Arab Emirates ..........5.91 95 Morocco ..............................4.47
27 Luxembourg ........................5.87 96 Namibia ...............................4.46
28 Bahrain ................................5.86 97 Libya ....................................4.41
29 Malta ...................................5.84 98 Cape Verde ..........................4.39
30 Barbados .............................5.77 99 Serbia ..................................4.38
31 New Zealand .......................5.74 100 Venezuela ............................4.29 341
32 Slovenia ...............................5.69 101 Albania.................................4.29
33 Australia...............................5.67 102 Tajikistan ..............................4.18
34 China ...................................5.65 103 Guyana ................................4.10
35 Puerto Rico..........................5.58 104 Armenia ...............................4.09
36 Slovak Republic ...................5.55 105 Cambodia ............................4.04
37 France..................................5.52 106 Botswana ............................4.03
38 Spain....................................5.49 107 Kenya...................................4.03
39 Malaysia ..............................5.48 108 Nigeria .................................3.99
40 Latvia ...................................5.41 109 Malawi .................................3.96
41 Uruguay ...............................5.38 110 Ecuador ...............................3.93
42 Cyprus .................................5.25 111 Iran, Islamic Rep..................3.80
43 Montenegro.........................5.22 112 Bangladesh..........................3.80
44 Guatemala ...........................5.22 113 Bolivia ..................................3.76
45 Jordan..................................5.21 114 Benin ...................................3.75
46 Chile ....................................5.21 115 Paraguay..............................3.75
47 Vietnam ...............................5.19 116 Zambia.................................3.75
48 Croatia .................................5.18 117 Nicaragua.............................3.73
49 Turkey ..................................5.15 118 Côte d’Ivoire ........................3.72
50 Ireland..................................5.14 119 Mozambique........................3.70
51 Dominican Republic.............5.14 120 Tanzania ...............................3.67
52 Saudi Arabia.........................5.14 121 Ghana ..................................3.63
53 Brunei Darussalam ..............5.14 122 Algeria .................................3.62
54 Trinidad and Tobago.............5.13 123 Mauritania............................3.60
55 Bulgaria................................5.12 124 Uganda ................................3.51
56 Oman...................................5.09 125 Nepal ...................................3.46
57 Ukraine ................................5.09 126 Madagascar .........................3.43
58 Romania ..............................5.06 127 Burkina Faso........................3.43
59 Bosnia and Herzegovina......5.04 128 Swaziland ............................3.41
60 Thailand ...............................4.98 129 Angola .................................3.36
61 Tunisia..................................4.91 130 Syria.....................................3.33
62 Jamaica ...............................4.91 131 Zimbabwe............................3.28
63 Brazil ....................................4.91 132 Cameroon............................3.26
64 Russian Federation..............4.91 133 Mali......................................3.23
65 Mongolia..............................4.90 134 Lesotho ...............................3.20
66 Panama................................4.89 135 Ethiopia................................3.00
67 Macedonia, FYR ..................4.89 136 Timor-Leste..........................2.77
68 Moldova...............................4.85 137 Chad ....................................2.58
69 El Salvador...........................4.85 138 Burundi ................................2.45
SOURCE: World Economic Forum, Executive Opinion Survey 2009, 2010
The Global Information Technology Report 2010–2011 © 2011 World Economic Forum](https://image.slidesharecdn.com/wef-gitr-2010-2011-110427122231-phpapp01/85/Wef-gitr-2010-2011-363-320.jpg)


![4.01 Quality of math and science education
4: Data Tables | 4th pillar: Individual readiness
How would you assess the quality of math and science education in your country’s schools? [1 = poor; 7 = excellent—among the best in the
world] | 2009–2010 weighted average
RANK COUNTRY/ECONOMY SCORE 1 MEAN: 3.98 7 RANK COUNTRY/ECONOMY SCORE 1 MEAN: 3.98 7
1 Singapore ............................6.46 70 Guyana ................................3.92
2 Belgium ...............................6.18 71 Senegal................................3.90
3 Finland .................................6.16 72 Mongolia..............................3.85
4 Qatar....................................5.89 73 Armenia ...............................3.85
5 Switzerland ..........................5.78 74 Moldova...............................3.84
6 Taiwan, China ......................5.71 75 Zimbabwe............................3.83
7 Lebanon...............................5.61 76 Zambia.................................3.78
8 Tunisia..................................5.57 77 Kazakhstan ..........................3.77
9 New Zealand .......................5.45 78 Botswana ............................3.74
10 Canada.................................5.44 79 Malawi .................................3.70
11 France..................................5.36 80 Cameroon............................3.68
12 Hong Kong SAR ..................5.35 81 Italy......................................3.64
13 Barbados .............................5.29 82 Côte d’Ivoire ........................3.64
14 Iceland .................................5.29 83 Algeria .................................3.63
15 Netherlands .........................5.22 84 Madagascar .........................3.61
16 Cyprus .................................5.20 85 Gambia, The ........................3.60
17 Slovenia ...............................5.16 86 Burkina Faso........................3.59
18 Korea, Rep...........................5.12 87 Kyrgyz Republic ...................3.57
19 Denmark..............................5.05 88 Kuwait .................................3.54
20 Sweden ...............................5.04 89 Pakistan ...............................3.54
21 Estonia.................................4.95 90 Swaziland ............................3.53
22 Croatia .................................4.94 91 Uruguay ...............................3.52
23 Malta ...................................4.91 92 Colombia .............................3.51
24 Australia...............................4.91 93 Ethiopia................................3.50
25 Czech Republic....................4.90 94 Israel....................................3.50
26 United Arab Emirates ..........4.89 95 Puerto Rico..........................3.45
27 Brunei Darussalam ..............4.87 96 Cape Verde ..........................3.43
28 Japan ...................................4.86 97 Ghana ..................................3.43
29 Lithuania ..............................4.85 98 Turkey ..................................3.42
30 Hungary ...............................4.82 99 Lesotho ...............................3.41
344 31 Malaysia ..............................4.79 100 Azerbaijan ............................3.33
32 Trinidad and Tobago.............4.76 101 Uganda ................................3.27
33 China ...................................4.74 102 Chad ....................................3.27
34 Ireland..................................4.73 103 Georgia ................................3.25
35 Montenegro.........................4.73 104 Bangladesh..........................3.23
36 Bosnia and Herzegovina......4.70 105 Argentina .............................3.18
37 Austria .................................4.69 106 Mauritania............................3.17
38 India.....................................4.67 107 Portugal ...............................3.15
39 Germany..............................4.66 108 Nepal ...................................3.15
40 Poland..................................4.61 109 Burundi ................................3.14
41 Iran, Islamic Rep..................4.61 110 Cambodia ............................3.12
42 Ukraine ................................4.59 111 Philippines ...........................3.11
43 Romania ..............................4.58 112 Libya ....................................3.11
44 Bahrain ................................4.52 113 Spain....................................3.07
45 Luxembourg ........................4.49 114 Jamaica ...............................2.92
46 Indonesia .............................4.49 115 Venezuela ............................2.89
47 Sri Lanka..............................4.49 116 Ecuador ...............................2.89
48 Serbia ..................................4.48 117 Mozambique........................2.87
49 Saudi Arabia.........................4.47 118 Nigeria .................................2.86
50 Costa Rica ...........................4.45 119 Namibia ...............................2.83
51 Vietnam ...............................4.45 120 Bolivia ..................................2.79
52 United States.......................4.43 121 Tajikistan ..............................2.78
53 Jordan..................................4.42 122 Chile ....................................2.76
54 Russian Federation..............4.42 123 El Salvador...........................2.75
55 United Kingdom...................4.41 124 Egypt ...................................2.70
56 Greece.................................4.27 125 Brazil ....................................2.67
57 Thailand ...............................4.27 126 Tanzania ...............................2.65
58 Oman...................................4.24 127 Mexico.................................2.57
59 Latvia ...................................4.22 128 Panama................................2.57
60 Benin ...................................4.22 129 Honduras .............................2.56
61 Macedonia, FYR ..................4.19 130 Guatemala ...........................2.55
62 Albania.................................4.17 131 Nicaragua.............................2.49
63 Kenya...................................4.15 132 Peru .....................................2.45
64 Norway ................................4.11 133 Mali......................................2.44
65 Slovak Republic ...................4.11 134 Paraguay..............................2.08
66 Morocco ..............................4.01 135 Dominican Republic.............2.04
67 Mauritius .............................3.99 136 South Africa.........................2.00
68 Bulgaria................................3.99 137 Timor-Leste..........................1.96
69 Syria.....................................3.95 138 Angola .................................1.55
SOURCE: World Economic Forum, Executive Opinion Survey 2009, 2010
The Global Information Technology Report 2010–2011 © 2011 World Economic Forum](https://image.slidesharecdn.com/wef-gitr-2010-2011-110427122231-phpapp01/85/Wef-gitr-2010-2011-366-320.jpg)
![4.02 Quality of the educational system
4: Data Tables | 4th pillar: Individual readiness
How well does the educational system in your country meet the needs of a competitive economy? [1 = not well at all; 7 = very well] | 2009–2010
weighted average
RANK COUNTRY/ECONOMY SCORE 1 MEAN: 3.79 7 RANK COUNTRY/ECONOMY SCORE 1 MEAN: 3.79 7
1 Singapore ............................6.11 70 Ghana ..................................3.67
2 Switzerland ..........................6.02 71 Uganda ................................3.62
3 Iceland .................................5.86 72 Senegal................................3.62
4 Qatar....................................5.67 73 Israel....................................3.60
5 Canada.................................5.65 74 Hungary ...............................3.59
6 Finland .................................5.63 75 Portugal ...............................3.58
7 Belgium ...............................5.50 76 Lesotho ...............................3.56
8 Sweden ...............................5.41 77 Russian Federation..............3.56
9 New Zealand .......................5.36 78 Cameroon............................3.49
10 Denmark..............................5.32 79 Colombia .............................3.47
11 Ireland..................................5.31 80 Mozambique........................3.46
12 Australia...............................5.21 81 Cambodia ............................3.44
13 Cyprus .................................5.13 82 Italy......................................3.43
14 Netherlands .........................5.11 83 Romania ..............................3.37
15 Barbados .............................5.04 84 Bulgaria................................3.37
16 Lebanon...............................5.04 85 Serbia ..................................3.33
17 Taiwan, China ......................5.02 86 Pakistan ...............................3.33
18 Germany..............................4.98 87 Kuwait .................................3.32
19 Norway ................................4.95 88 Croatia .................................3.31
20 Tunisia..................................4.95 89 Argentina .............................3.28
21 Malta ...................................4.94 90 Kyrgyz Republic ...................3.28
22 Costa Rica ...........................4.93 91 Madagascar .........................3.27
23 Malaysia ..............................4.89 92 Kazakhstan ..........................3.27
24 Austria .................................4.86 93 Bangladesh..........................3.26
25 Hong Kong SAR ..................4.81 94 Turkey ..................................3.24
26 United States.......................4.80 95 Moldova...............................3.22
27 United Arab Emirates ..........4.74 96 Chad ....................................3.21
28 United Kingdom...................4.72 97 Jamaica ...............................3.20
29 France..................................4.68 98 Tanzania ...............................3.19
30 Trinidad and Tobago.............4.58 99 Chile ....................................3.19
31 Brunei Darussalam ..............4.54 100 Swaziland ............................3.19 345
32 Kenya...................................4.52 101 Bosnia and Herzegovina......3.15
33 Gambia, The ........................4.50 102 Brazil ....................................3.12
34 Czech Republic....................4.47 103 Azerbaijan ............................3.11
35 Japan ...................................4.46 104 Morocco ..............................3.11
36 Luxembourg ........................4.44 105 Côte d’Ivoire ........................3.09
37 Montenegro.........................4.44 106 Spain....................................3.09
38 Bahrain ................................4.44 107 Iran, Islamic Rep..................3.08
39 India.....................................4.34 108 Syria.....................................3.08
40 Indonesia .............................4.33 109 Bolivia ..................................3.07
41 Saudi Arabia.........................4.30 110 Slovak Republic ...................3.06
42 Estonia.................................4.29 111 Namibia ...............................3.03
43 Oman...................................4.24 112 Tajikistan ..............................3.02
44 Sri Lanka..............................4.20 113 Timor-Leste..........................2.99
45 Benin ...................................4.18 114 Armenia ...............................2.99
46 Zimbabwe............................4.18 115 Nepal ...................................2.98
47 Slovenia ...............................4.17 116 Algeria .................................2.94
48 Botswana ............................4.09 117 Greece.................................2.93
49 Malawi .................................4.03 118 Georgia ................................2.92
50 Mauritius .............................3.98 119 Mexico.................................2.88
51 Puerto Rico..........................3.96 120 El Salvador...........................2.87
52 Zambia.................................3.96 121 Ecuador ...............................2.85
53 China ...................................3.95 122 Honduras .............................2.78
54 Albania.................................3.91 123 Peru .....................................2.69
55 Jordan..................................3.90 124 Mali......................................2.65
56 Ukraine ................................3.88 125 Guatemala ...........................2.59
57 Korea, Rep...........................3.86 126 Venezuela ............................2.58
58 Macedonia, FYR ..................3.85 127 Panama................................2.55
59 Ethiopia................................3.84 128 Burkina Faso........................2.51
60 Vietnam ...............................3.83 129 South Africa.........................2.48
61 Poland..................................3.83 130 Egypt ...................................2.47
62 Nigeria .................................3.81 131 Nicaragua.............................2.47
63 Latvia ...................................3.78 132 Dominican Republic.............2.44
64 Cape Verde ..........................3.77 133 Burundi ................................2.31
65 Thailand ...............................3.75 134 Mauritania............................2.27
66 Uruguay ...............................3.71 135 Mongolia..............................2.20
67 Guyana ................................3.71 136 Paraguay..............................2.09
68 Philippines ...........................3.69 137 Libya ....................................2.00
69 Lithuania ..............................3.68 138 Angola .................................1.98
SOURCE: World Economic Forum, Executive Opinion Survey 2009, 2010
The Global Information Technology Report 2010–2011 © 2011 World Economic Forum](https://image.slidesharecdn.com/wef-gitr-2010-2011-110427122231-phpapp01/85/Wef-gitr-2010-2011-367-320.jpg)
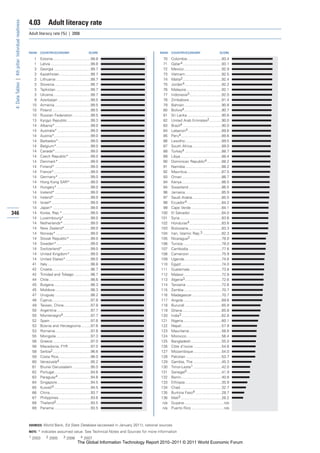
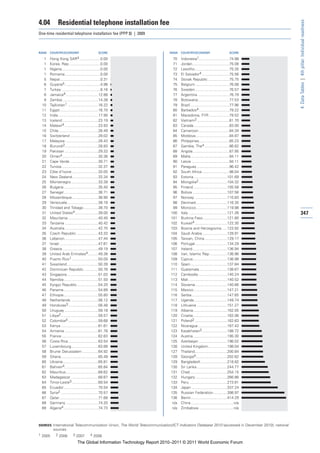

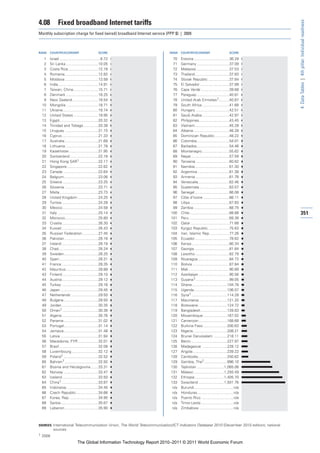
![4.09 Buyer sophistication
4: Data Tables | 4th pillar: Individual readiness
In your country, how do buyers make purchasing decisions? [1 = based solely on the lowest price; 7 = based on a sophisticated analysis of
performance attributes] | 2009–2010 weighted average
RANK COUNTRY/ECONOMY SCORE 1 MEAN: 3.46 7 RANK COUNTRY/ECONOMY SCORE 1 MEAN: 3.46 7
1 Japan ...................................5.22 70 Botswana ............................3.43
2 Switzerland ..........................5.21 71 Colombia .............................3.41
3 Sweden ...............................5.01 72 Kuwait .................................3.40
4 Luxembourg ........................4.93 73 El Salvador...........................3.39
5 Taiwan, China ......................4.69 74 Israel....................................3.39
6 Canada.................................4.67 75 Armenia ...............................3.38
7 China ...................................4.64 76 Uruguay ...............................3.35
8 United Kingdom...................4.59 77 Honduras .............................3.33
9 Netherlands .........................4.58 78 Estonia.................................3.32
10 Singapore ............................4.56 79 Mexico.................................3.30
11 Korea, Rep...........................4.56 80 Nigeria .................................3.26
12 Norway ................................4.54 81 Kyrgyz Republic ...................3.25
13 United States.......................4.51 82 Venezuela ............................3.22
14 Hong Kong SAR ..................4.43 83 Ukraine ................................3.22
15 Belgium ...............................4.41 84 Bulgaria................................3.21
16 Australia...............................4.39 85 Jordan..................................3.20
17 Finland .................................4.37 86 Latvia ...................................3.19
18 Germany..............................4.36 87 Georgia ................................3.17
19 Cyprus .................................4.34 88 Kenya...................................3.16
20 Saudi Arabia.........................4.32 89 Gambia, The ........................3.13
21 Denmark..............................4.30 90 Benin ...................................3.10
22 United Arab Emirates ..........4.25 91 Ghana ..................................3.09
23 Ireland..................................4.22 92 Ecuador ...............................3.09
24 Malaysia ..............................4.15 93 Slovak Republic ...................3.08
25 Austria .................................4.14 94 Moldova...............................3.08
26 France..................................4.14 95 Morocco ..............................3.07
27 Chile ....................................4.12 96 Nicaragua.............................3.06
28 Lebanon...............................4.11 97 Brunei Darussalam ..............3.06
29 South Africa.........................4.09 98 Albania.................................3.06
30 Puerto Rico..........................4.04 99 Dominican Republic.............3.04
352 31 New Zealand .......................4.03 100 Cape Verde ..........................3.04
32 Sri Lanka..............................4.02 101 Hungary ...............................3.02
33 Bahrain ................................4.02 102 Ethiopia................................3.02
34 Italy ......................................3.99 103 Zimbabwe............................3.01
35 Indonesia .............................3.94 104 Tajikistan ..............................3.00
36 Czech Republic....................3.91 105 Lithuania ..............................3.00
37 Barbados .............................3.89 106 Bangladesh..........................2.97
38 Iceland .................................3.85 107 Zambia.................................2.94
39 Qatar....................................3.85 108 Algeria .................................2.91
40 Tunisia..................................3.83 109 Paraguay..............................2.90
41 Azerbaijan ............................3.83 110 Macedonia, FYR ..................2.89
42 Oman...................................3.82 111 Mozambique........................2.89
43 India.....................................3.82 112 Tanzania ...............................2.88
44 Costa Rica ...........................3.80 113 Croatia .................................2.86
45 Vietnam ...............................3.79 114 Turkey ..................................2.85
46 Thailand ...............................3.78 115 Swaziland ............................2.83
47 Spain....................................3.78 116 Mongolia..............................2.81
48 Panama................................3.77 117 Bosnia and Herzegovina......2.76
49 Kazakhstan ..........................3.69 118 Timor-Leste..........................2.75
50 Russian Federation..............3.68 119 Angola .................................2.74
51 Poland..................................3.64 120 Guyana ................................2.72
52 Brazil ....................................3.63 121 Libya ....................................2.71
53 Cambodia ............................3.60 122 Lesotho ...............................2.70
54 Trinidad and Tobago.............3.58 123 Nepal ...................................2.66
55 Romania ..............................3.57 124 Malawi .................................2.64
56 Portugal ...............................3.57 125 Egypt ...................................2.56
57 Montenegro.........................3.57 126 Syria.....................................2.55
58 Greece.................................3.56 127 Bolivia ..................................2.53
59 Malta ...................................3.55 128 Uganda ................................2.40
60 Philippines ...........................3.55 129 Mauritania............................2.40
61 Namibia ...............................3.52 130 Serbia ..................................2.39
62 Pakistan ...............................3.52 131 Senegal................................2.32
63 Slovenia ...............................3.51 132 Cameroon............................2.32
64 Iran, Islamic Rep..................3.50 133 Madagascar .........................2.29
65 Peru .....................................3.50 134 Mali......................................2.20
66 Argentina .............................3.50 135 Côte d’Ivoire ........................2.07
67 Guatemala ...........................3.48 136 Chad ....................................2.01
68 Mauritius .............................3.47 137 Burundi ................................1.86
69 Jamaica ...............................3.44 138 Burkina Faso........................1.84
SOURCE: World Economic Forum, Executive Opinion Survey 2009, 2010
The Global Information Technology Report 2010–2011 © 2011 World Economic Forum](https://image.slidesharecdn.com/wef-gitr-2010-2011-110427122231-phpapp01/85/Wef-gitr-2010-2011-374-320.jpg)
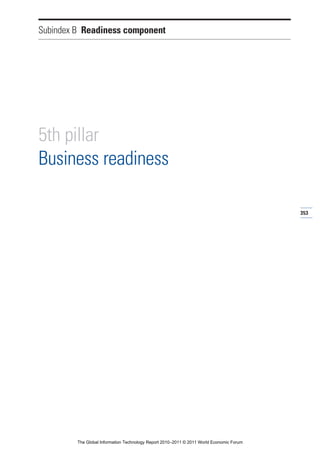
![5.01 Extent of staff training
4: Data Tables | 5th pillar: Business readiness
To what extent do companies in your country invest in training and employee development? [1 = hardly at all; 7 = to a great extent] | 2009–2010
weighted average
RANK COUNTRY/ECONOMY SCORE 1 MEAN: 4.00 7 RANK COUNTRY/ECONOMY SCORE 1 MEAN: 4.00 7
1 Sweden ...............................5.70 70 Zimbabwe............................3.92
2 Switzerland ..........................5.51 71 Romania ..............................3.90
3 Norway ................................5.47 72 Portugal ...............................3.90
4 Singapore ............................5.45 73 Nigeria .................................3.90
5 Luxembourg ........................5.43 74 Slovak Republic ...................3.89
6 Japan ...................................5.42 75 Latvia ...................................3.89
7 Denmark..............................5.40 76 Ghana ..................................3.85
8 Germany..............................5.24 77 Peru .....................................3.83
9 Finland .................................5.23 78 Argentina .............................3.81
10 United States.......................5.09 79 Honduras .............................3.81
11 Netherlands .........................5.09 80 Zambia.................................3.79
12 Canada.................................4.98 81 Mongolia..............................3.79
13 Malaysia ..............................4.97 82 Lesotho ...............................3.79
14 Austria .................................4.93 83 Mexico.................................3.75
15 Belgium ...............................4.92 84 Turkey ..................................3.74
16 Bahrain ................................4.88 85 Uruguay ...............................3.73
17 Puerto Rico..........................4.86 86 Morocco ..............................3.71
18 Tunisia..................................4.83 87 Hungary ...............................3.70
19 Qatar....................................4.82 88 Spain....................................3.69
20 Australia...............................4.77 89 Russian Federation..............3.68
21 New Zealand .......................4.77 90 Venezuela ............................3.67
22 Costa Rica ...........................4.77 91 Cambodia ............................3.67
23 Ireland..................................4.75 92 Cameroon............................3.66
24 Iceland .................................4.74 93 Dominican Republic.............3.63
25 Israel ....................................4.72 94 Nicaragua.............................3.60
26 South Africa.........................4.72 95 Kuwait .................................3.60
27 Hong Kong SAR ..................4.71 96 Swaziland ............................3.60
28 United Kingdom...................4.70 97 Kazakhstan ..........................3.59
29 United Arab Emirates ..........4.66 98 Colombia .............................3.57
30 France..................................4.65 99 Uganda ................................3.56
354 31 Taiwan, China ......................4.65 100 Jordan..................................3.55
32 Gambia, The ........................4.43 101 Lebanon...............................3.53
33 Chile ....................................4.41 102 Algeria .................................3.50
34 Saudi Arabia.........................4.41 103 Benin ...................................3.48
35 Cyprus .................................4.40 104 Greece.................................3.47
36 Indonesia .............................4.39 105 Tanzania ...............................3.45
37 Sri Lanka..............................4.39 106 Ecuador ...............................3.44
38 Angola .................................4.37 107 Georgia ................................3.41
39 Czech Republic....................4.37 108 Ukraine ................................3.40
40 Mauritius .............................4.36 109 Libya ....................................3.37
41 Korea, Rep...........................4.36 110 Mozambique........................3.35
42 Barbados .............................4.35 111 Egypt ...................................3.35
43 Côte d’Ivoire ........................4.34 112 Senegal................................3.34
44 Oman...................................4.29 113 Madagascar .........................3.33
45 Philippines ...........................4.28 114 Pakistan ...............................3.32
46 Malta ...................................4.26 115 Armenia ...............................3.32
47 Estonia.................................4.25 116 Moldova...............................3.31
48 Jamaica ...............................4.25 117 Tajikistan ..............................3.31
49 Panama................................4.24 118 Macedonia, FYR ..................3.30
50 Trinidad and Tobago.............4.22 119 Cape Verde ..........................3.27
51 Poland..................................4.22 120 Bolivia ..................................3.26
52 Brazil ....................................4.19 121 Ethiopia................................3.24
53 Botswana ............................4.18 122 Paraguay..............................3.23
54 Albania.................................4.16 123 Kyrgyz Republic ...................3.21
55 Guatemala ...........................4.15 124 Chad ....................................3.17
56 China ...................................4.12 125 Timor-Leste..........................3.16
57 Vietnam ...............................4.11 126 Italy......................................3.16
58 India.....................................4.10 127 Croatia .................................3.14
59 Brunei Darussalam ..............4.08 128 Bangladesh..........................3.12
60 Guyana ................................4.08 129 Serbia ..................................3.04
61 Thailand ...............................4.07 130 Mali......................................2.98
62 El Salvador...........................4.06 131 Iran, Islamic Rep..................2.92
63 Lithuania ..............................4.06 132 Burundi ................................2.89
64 Slovenia ...............................4.05 133 Burkina Faso........................2.87
65 Namibia ...............................4.03 134 Bulgaria................................2.81
66 Malawi .................................4.02 135 Bosnia and Herzegovina......2.69
67 Azerbaijan ............................4.02 136 Nepal ...................................2.68
68 Montenegro.........................4.01 137 Mauritania............................2.59
69 Kenya...................................3.94 138 Syria.....................................2.52
SOURCE: World Economic Forum, Executive Opinion Survey 2009, 2010
The Global Information Technology Report 2010–2011 © 2011 World Economic Forum](https://image.slidesharecdn.com/wef-gitr-2010-2011-110427122231-phpapp01/85/Wef-gitr-2010-2011-376-320.jpg)
![5.02 Quality of management schools
4: Data Tables | 5th pillar: Business readiness
How would you assess the quality of management or business schools in your country? [1 = poor; 7 = excellent—among the best in the world] |
2009–2010 weighted average
RANK COUNTRY/ECONOMY SCORE 1 MEAN: 4.18 7 RANK COUNTRY/ECONOMY SCORE 1 MEAN: 4.18 7
1 Qatar....................................6.14 70 Jamaica ...............................4.15
2 Switzerland ..........................6.07 71 Hungary ...............................4.12
3 Canada.................................5.97 72 Zimbabwe............................4.12
4 Belgium ...............................5.96 73 Brazil ....................................4.07
5 France..................................5.74 74 Cameroon............................4.04
6 Singapore ............................5.65 75 Macedonia, FYR ..................4.02
7 Sweden ...............................5.63 76 Guyana ................................4.01
8 Spain....................................5.62 77 Madagascar .........................4.00
9 Iceland .................................5.57 78 Zambia.................................3.99
10 United Kingdom...................5.54 79 El Salvador...........................3.99
11 United States.......................5.52 80 Pakistan ...............................3.96
12 Netherlands .........................5.49 81 Oman...................................3.95
13 Costa Rica ...........................5.45 82 Bosnia and Herzegovina......3.94
14 Denmark..............................5.41 83 Jordan..................................3.94
15 Chile ....................................5.34 84 Uganda ................................3.86
16 Argentina .............................5.29 85 Albania.................................3.85
17 Australia...............................5.29 86 Bangladesh..........................3.83
18 Finland .................................5.28 87 Iran, Islamic Rep..................3.82
19 Norway ................................5.23 88 Croatia .................................3.80
20 Lebanon...............................5.12 89 Burkina Faso........................3.78
21 South Africa.........................5.12 90 Mauritius .............................3.78
22 Tunisia..................................5.11 91 Algeria .................................3.76
23 India.....................................5.08 92 Russian Federation..............3.75
24 Hong Kong SAR ..................5.07 93 Dominican Republic.............3.73
25 New Zealand .......................5.04 94 Bulgaria................................3.71
26 Ireland..................................5.02 95 Kuwait .................................3.71
27 Taiwan, China ......................5.00 96 Malawi .................................3.70
28 United Arab Emirates ..........4.97 97 Greece.................................3.70
29 Barbados .............................4.96 98 Romania ..............................3.68
30 Cyprus .................................4.93 99 Nigeria .................................3.67
31 Germany..............................4.93 100 Côte d’Ivoire ........................3.65 355
32 Portugal ...............................4.91 101 Serbia ..................................3.65
33 Austria .................................4.91 102 Ecuador ...............................3.61
34 Trinidad and Tobago.............4.86 103 Kazakhstan ..........................3.60
35 Malaysia ..............................4.75 104 Turkey ..................................3.58
36 Malta ...................................4.69 105 Ethiopia................................3.56
37 Sri Lanka..............................4.68 106 Vietnam ...............................3.50
38 Italy ......................................4.68 107 Ukraine ................................3.49
39 Uruguay ...............................4.66 108 Panama................................3.49
40 Senegal................................4.64 109 Honduras .............................3.48
41 Estonia.................................4.63 110 Lesotho ...............................3.47
42 Peru .....................................4.61 111 Nicaragua.............................3.46
43 Guatemala ...........................4.59 112 Botswana ............................3.45
44 Slovenia ...............................4.57 113 Slovak Republic ...................3.45
45 Bahrain ................................4.56 114 Syria.....................................3.40
46 Israel....................................4.55 115 Georgia ................................3.40
47 Korea, Rep...........................4.53 116 Mozambique........................3.33
48 Montenegro.........................4.53 117 Cambodia ............................3.32
49 Morocco ..............................4.52 118 Bolivia ..................................3.32
50 Benin ...................................4.49 119 Chad ....................................3.31
51 Kenya...................................4.49 120 Cape Verde ..........................3.31
52 Mexico.................................4.48 121 Egypt ...................................3.26
53 Gambia, The ........................4.48 122 Moldova...............................3.25
54 Puerto Rico..........................4.43 123 Azerbaijan ............................3.20
55 Indonesia .............................4.43 124 Nepal ...................................3.16
56 Czech Republic....................4.43 125 Mali......................................3.13
57 Venezuela ............................4.39 126 Namibia ...............................3.06
58 Thailand ...............................4.35 127 Tanzania ...............................3.00
59 Colombia .............................4.34 128 Kyrgyz Republic ...................3.00
60 Saudi Arabia.........................4.33 129 Armenia ...............................2.93
61 Philippines ...........................4.29 130 Burundi ................................2.93
62 Poland..................................4.23 131 Paraguay..............................2.85
63 China ...................................4.20 132 Tajikistan ..............................2.81
64 Ghana ..................................4.19 133 Swaziland ............................2.74
65 Japan ...................................4.17 134 Mongolia..............................2.68
66 Luxembourg ........................4.17 135 Mauritania............................2.44
67 Latvia ...................................4.17 136 Libya ....................................2.24
68 Lithuania ..............................4.16 137 Timor-Leste..........................2.17
69 Brunei Darussalam ..............4.15 138 Angola .................................1.76
SOURCE: World Economic Forum, Executive Opinion Survey 2009, 2010
The Global Information Technology Report 2010–2011 © 2011 World Economic Forum](https://image.slidesharecdn.com/wef-gitr-2010-2011-110427122231-phpapp01/85/Wef-gitr-2010-2011-377-320.jpg)
![5.03 Company spending on R&D
4: Data Tables | 5th pillar: Business readiness
To what extent do companies in your country spend on research and development (R&D)? [1 = do not spend on R&D; 7 = spend heavily on R&D] |
2009–2010 weighted average
RANK COUNTRY/ECONOMY SCORE 1 MEAN: 3.24 7 RANK COUNTRY/ECONOMY SCORE 1 MEAN: 3.24 7
1 Sweden ...............................5.98 70 Botswana ............................2.98
2 Switzerland ..........................5.93 71 Tanzania ...............................2.97
3 Japan ...................................5.87 72 Argentina .............................2.97
4 Germany..............................5.72 73 Guyana ................................2.97
5 Finland .................................5.45 74 Egypt ...................................2.96
6 United States.......................5.43 75 Hungary ...............................2.96
7 Denmark..............................5.20 76 Malawi .................................2.96
8 Singapore ............................4.99 77 Mali......................................2.92
9 Taiwan, China ......................4.96 78 Colombia .............................2.92
10 Luxembourg ........................4.79 79 Brunei Darussalam ..............2.87
11 Israel ....................................4.75 80 Mozambique........................2.85
12 Korea, Rep...........................4.75 81 Cambodia ............................2.85
13 France..................................4.66 82 Jamaica ...............................2.83
14 United Kingdom...................4.64 83 Kazakhstan ..........................2.82
15 Netherlands .........................4.59 84 Philippines ...........................2.81
16 Malaysia ..............................4.49 85 Gambia, The ........................2.78
17 Norway ................................4.40 86 Zambia.................................2.76
18 Austria .................................4.32 87 Azerbaijan ............................2.75
19 Belgium ...............................4.29 88 Angola .................................2.74
20 Canada.................................4.23 89 Mexico.................................2.74
21 Ireland..................................4.19 90 Albania.................................2.74
22 China ...................................4.14 91 Namibia ...............................2.74
23 Australia...............................4.12 92 Côte d’Ivoire ........................2.73
24 Saudi Arabia.........................4.09 93 Latvia ...................................2.72
25 Czech Republic....................4.00 94 Uganda ................................2.72
26 Indonesia .............................3.98 95 Bulgaria................................2.70
27 Iceland .................................3.94 96 Morocco ..............................2.69
28 United Arab Emirates ..........3.86 97 Honduras .............................2.68
29 Brazil ....................................3.83 98 Barbados .............................2.68
30 Sri Lanka..............................3.82 99 Bolivia ..................................2.66
356 31 Costa Rica ...........................3.76 100 Bahrain ................................2.66
32 Slovenia ...............................3.73 101 Kuwait .................................2.66
33 Vietnam ...............................3.64 102 Romania ..............................2.65
34 Kenya...................................3.63 103 Bosnia and Herzegovina......2.65
35 Tunisia..................................3.63 104 Mauritania............................2.63
36 Hong Kong SAR ..................3.62 105 Algeria .................................2.63
37 India.....................................3.59 106 Iran, Islamic Rep..................2.62
38 New Zealand .......................3.59 107 Serbia ..................................2.62
39 Italy ......................................3.52 108 Burkina Faso........................2.62
40 South Africa.........................3.51 109 Mongolia..............................2.61
41 Qatar....................................3.46 110 Macedonia, FYR ..................2.59
42 Benin ...................................3.41 111 Nicaragua.............................2.59
43 Cyprus .................................3.41 112 Peru .....................................2.59
44 Montenegro.........................3.40 113 Trinidad and Tobago.............2.58
45 Portugal ...............................3.39 114 Madagascar .........................2.56
46 Estonia.................................3.34 115 Jordan..................................2.55
47 Spain....................................3.25 116 Zimbabwe............................2.53
48 Thailand ...............................3.23 117 Tajikistan ..............................2.50
49 Senegal................................3.22 118 Lebanon...............................2.50
50 Russian Federation..............3.22 119 Ecuador ...............................2.49
51 Oman...................................3.21 120 Venezuela ............................2.49
52 Chile ....................................3.18 121 El Salvador...........................2.47
53 Nigeria .................................3.18 122 Ethiopia................................2.46
54 Puerto Rico..........................3.17 123 Dominican Republic.............2.43
55 Malta ...................................3.13 124 Paraguay..............................2.39
56 Uruguay ...............................3.11 125 Greece.................................2.39
57 Lithuania ..............................3.11 126 Armenia ...............................2.38
58 Panama................................3.11 127 Timor-Leste..........................2.37
59 Lesotho ...............................3.06 128 Bangladesh..........................2.36
60 Croatia .................................3.05 129 Nepal ...................................2.36
61 Poland..................................3.05 130 Swaziland ............................2.36
62 Turkey ..................................3.04 131 Georgia ................................2.35
63 Cameroon............................3.04 132 Ghana ..................................2.34
64 Mauritius .............................3.03 133 Burundi ................................2.25
65 Guatemala ...........................3.03 134 Moldova...............................2.15
66 Chad ....................................3.03 135 Cape Verde ..........................2.06
67 Pakistan ...............................3.00 136 Syria.....................................2.05
68 Slovak Republic ...................3.00 137 Kyrgyz Republic ...................2.00
69 Ukraine ................................3.00 138 Libya ....................................1.96
SOURCE: World Economic Forum, Executive Opinion Survey 2009, 2010
The Global Information Technology Report 2010–2011 © 2011 World Economic Forum](https://image.slidesharecdn.com/wef-gitr-2010-2011-110427122231-phpapp01/85/Wef-gitr-2010-2011-378-320.jpg)
![5.04 University-industry collaboration in R&D
4: Data Tables | 5th pillar: Business readiness
To what extent do business and universities collaborate on research and development (R&D) in your country? [1 = do not collaborate at all;
7 = collaborate extensively] | 2009–2010 weighted average
RANK COUNTRY/ECONOMY SCORE 1 MEAN: 3.71 7 RANK COUNTRY/ECONOMY SCORE 1 MEAN: 3.71 7
1 United States.......................5.79 70 Serbia ..................................3.47
2 Switzerland ..........................5.71 71 Ukraine ................................3.47
3 Finland .................................5.64 72 Latvia ...................................3.46
4 United Kingdom...................5.59 73 Macedonia, FYR ..................3.46
5 Sweden ...............................5.54 74 Croatia .................................3.44
6 Singapore ............................5.44 75 Venezuela ............................3.43
7 Canada.................................5.40 76 Tanzania ...............................3.43
8 Denmark..............................5.34 77 Uganda ................................3.40
9 Germany..............................5.24 78 Malawi .................................3.39
10 Belgium ...............................5.23 79 Namibia ...............................3.39
11 Netherlands .........................5.19 80 Pakistan ...............................3.37
12 Taiwan, China ......................5.18 81 Turkey ..................................3.37
13 Australia...............................5.13 82 Burkina Faso........................3.33
14 Israel....................................5.08 83 Panama................................3.31
15 Luxembourg ........................5.06 84 Philippines ...........................3.27
16 Iceland .................................4.97 85 Mongolia..............................3.26
17 Ireland..................................4.97 86 Slovak Republic ...................3.26
18 Austria .................................4.92 87 Bahrain ................................3.26
19 Japan ...................................4.86 88 Cape Verde ..........................3.25
20 Norway ................................4.85 89 Mali......................................3.24
21 New Zealand .......................4.78 90 Honduras .............................3.21
22 Malaysia ..............................4.70 91 Azerbaijan ............................3.20
23 Korea, Rep...........................4.68 92 Dominican Republic.............3.20
24 South Africa.........................4.60 93 Mauritius .............................3.19
25 China ...................................4.59 94 Peru .....................................3.18
26 Hong Kong SAR ..................4.57 95 Kuwait .................................3.18
27 Qatar....................................4.52 96 Iran, Islamic Rep..................3.18
28 Costa Rica ...........................4.51 97 Ghana ..................................3.15
29 Czech Republic....................4.50 98 Jordan..................................3.13
30 Portugal ...............................4.48 99 Madagascar .........................3.11
31 Puerto Rico..........................4.43 100 Ethiopia................................3.11 357
32 Hungary ...............................4.35 101 Nigeria .................................3.09
33 Saudi Arabia.........................4.31 102 Romania ..............................3.09
34 Brazil ....................................4.29 103 Morocco ..............................3.09
35 Lithuania ..............................4.25 104 Zimbabwe............................3.09
36 Estonia.................................4.19 105 Benin ...................................3.09
37 Slovenia ...............................4.17 106 Lesotho ...............................3.08
38 Indonesia .............................4.16 107 Tajikistan ..............................3.08
39 Chile ....................................4.16 108 Lebanon...............................3.05
40 Barbados .............................4.11 109 Bulgaria................................3.04
41 Tunisia..................................4.08 110 Kazakhstan ..........................3.03
42 Thailand ...............................4.07 111 Greece.................................3.03
43 United Arab Emirates ..........4.05 112 Cameroon............................3.00
44 France..................................4.04 113 El Salvador...........................2.99
45 Cyprus .................................4.03 114 Cambodia ............................2.98
46 Spain....................................3.98 115 Chad ....................................2.97
47 Colombia .............................3.97 116 Bosnia and Herzegovina......2.95
48 Mozambique........................3.97 117 Nicaragua.............................2.93
49 Sri Lanka..............................3.91 118 Algeria .................................2.88
50 Oman...................................3.87 119 Egypt ...................................2.85
51 Senegal................................3.86 120 Guyana ................................2.84
52 Montenegro.........................3.83 121 Ecuador ...............................2.84
53 Argentina .............................3.82 122 Swaziland ............................2.78
54 Guatemala ...........................3.79 123 Armenia ...............................2.77
55 Kenya...................................3.79 124 Moldova...............................2.77
56 Malta ...................................3.77 125 Bolivia ..................................2.76
57 Uruguay ...............................3.75 126 Burundi ................................2.75
58 India.....................................3.74 127 Bangladesh..........................2.73
59 Mexico.................................3.72 128 Paraguay..............................2.66
60 Brunei Darussalam ..............3.70 129 Côte d’Ivoire ........................2.62
61 Russian Federation..............3.67 130 Libya ....................................2.58
62 Vietnam ...............................3.66 131 Timor-Leste..........................2.54
63 Gambia, The ........................3.64 132 Nepal ...................................2.53
64 Poland..................................3.63 133 Georgia ................................2.53
65 Jamaica ...............................3.59 134 Mauritania............................2.42
66 Zambia.................................3.55 135 Angola .................................2.39
67 Trinidad and Tobago.............3.50 136 Syria.....................................2.30
68 Botswana ............................3.49 137 Albania.................................2.22
69 Italy ......................................3.48 138 Kyrgyz Republic ...................2.18
SOURCE: World Economic Forum, Executive Opinion Survey 2009, 2010
The Global Information Technology Report 2010–2011 © 2011 World Economic Forum](https://image.slidesharecdn.com/wef-gitr-2010-2011-110427122231-phpapp01/85/Wef-gitr-2010-2011-379-320.jpg)
![5.07 Local supplier quality
4: Data Tables | 5th pillar: Business readiness
How would you assess the quality of local suppliers in your country? [1 = very poor; 7 = very good] | 2009–2010 weighted average
RANK COUNTRY/ECONOMY SCORE 1 MEAN: 4.53 7 RANK COUNTRY/ECONOMY SCORE 1 MEAN: 4.53 7
1 Austria .................................6.26 70 Philippines ...........................4.40
2 Switzerland ..........................6.20 71 Bahrain ................................4.40
3 Germany..............................6.19 72 Namibia ...............................4.39
4 Japan ...................................6.16 73 Uruguay ...............................4.39
5 Sweden ...............................5.95 74 Argentina .............................4.38
6 Belgium ...............................5.85 75 Brunei Darussalam ..............4.38
7 Canada.................................5.79 76 Croatia .................................4.37
8 Netherlands .........................5.76 77 Guyana ................................4.36
9 Qatar....................................5.74 78 Morocco ..............................4.31
10 France..................................5.71 79 Côte d’Ivoire ........................4.31
11 Taiwan, China ......................5.66 80 Montenegro.........................4.29
12 Norway ................................5.62 81 Benin ...................................4.29
13 Denmark..............................5.57 82 Bulgaria................................4.27
14 United States.......................5.56 83 Macedonia, FYR ..................4.27
15 New Zealand .......................5.55 84 Jamaica ...............................4.27
16 Australia...............................5.55 85 Dominican Republic.............4.25
17 Czech Republic....................5.45 86 Jordan..................................4.23
18 Puerto Rico..........................5.43 87 Bangladesh..........................4.21
19 Finland .................................5.42 88 Honduras .............................4.21
20 Hong Kong SAR ..................5.42 89 Egypt ...................................4.19
21 Israel ....................................5.42 90 Uganda ................................4.15
22 South Africa.........................5.29 91 Vietnam ...............................4.11
23 Ireland..................................5.26 92 Swaziland ............................4.10
24 Saudi Arabia.........................5.25 93 Malawi .................................4.10
25 Iceland .................................5.25 94 Paraguay..............................4.08
26 Spain....................................5.22 95 Pakistan ...............................4.08
27 Chile ....................................5.20 96 Romania ..............................4.04
28 Costa Rica ...........................5.19 97 Kazakhstan ..........................4.03
29 Brazil ....................................5.18 98 Zambia.................................4.02
30 United Kingdom...................5.17 99 Cameroon............................3.98
360 31 Luxembourg ........................5.17 100 Ukraine ................................3.98
32 Slovenia ...............................5.17 101 Nigeria .................................3.96
33 Korea, Rep...........................5.15 102 Azerbaijan ............................3.95
34 Cyprus .................................5.12 103 Nicaragua.............................3.94
35 Italy ......................................5.11 104 Ecuador ...............................3.94
36 Estonia.................................5.09 105 Algeria .................................3.93
37 Malaysia ..............................5.08 106 Ghana ..................................3.93
38 United Arab Emirates ..........5.06 107 Serbia ..................................3.92
39 Singapore ............................5.05 108 Botswana ............................3.91
40 Guatemala ...........................5.05 109 Albania.................................3.89
41 Poland..................................5.03 110 Burkina Faso........................3.88
42 Colombia .............................4.99 111 Madagascar .........................3.87
43 Thailand ...............................4.97 112 Bosnia and Herzegovina......3.87
44 Lithuania ..............................4.95 113 Moldova...............................3.87
45 Tunisia..................................4.94 114 Russian Federation..............3.83
46 Panama................................4.89 115 Tanzania ...............................3.81
47 Slovak Republic ...................4.89 116 Armenia ...............................3.80
48 Sri Lanka..............................4.88 117 Bolivia ..................................3.75
49 El Salvador...........................4.86 118 Zimbabwe............................3.75
50 Oman...................................4.78 119 Mali......................................3.70
51 Portugal ...............................4.77 120 Cambodia ............................3.70
52 Lebanon...............................4.75 121 Kyrgyz Republic ...................3.70
53 Latvia ...................................4.72 122 Ethiopia................................3.67
54 China ...................................4.68 123 Syria.....................................3.66
55 Mexico.................................4.68 124 Iran, Islamic Rep..................3.65
56 Barbados .............................4.68 125 Tajikistan ..............................3.63
57 Malta ...................................4.68 126 Mozambique........................3.61
58 Gambia, The ........................4.68 127 Burundi ................................3.61
59 Turkey ..................................4.64 128 Venezuela ............................3.56
60 India.....................................4.62 129 Cape Verde ..........................3.46
61 Indonesia .............................4.61 130 Georgia ................................3.44
62 Hungary ...............................4.58 131 Nepal ...................................3.44
63 Trinidad and Tobago.............4.58 132 Lesotho ...............................3.42
64 Peru .....................................4.56 133 Mongolia..............................3.40
65 Kuwait .................................4.54 134 Chad ....................................3.31
66 Mauritius .............................4.53 135 Libya ....................................3.29
67 Senegal................................4.51 136 Mauritania............................3.15
68 Greece.................................4.47 137 Timor-Leste..........................2.99
69 Kenya...................................4.45 138 Angola .................................2.70
SOURCE: World Economic Forum, Executive Opinion Survey 2009, 2010
The Global Information Technology Report 2010–2011 © 2011 World Economic Forum](https://image.slidesharecdn.com/wef-gitr-2010-2011-110427122231-phpapp01/85/Wef-gitr-2010-2011-382-320.jpg)

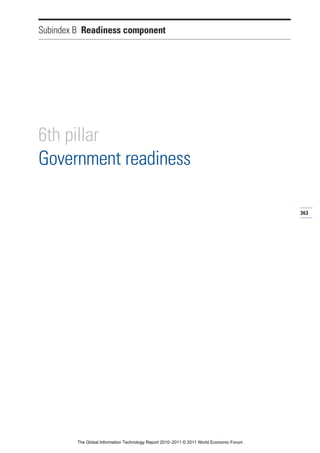
![6.01 Government prioritization of ICT
4: Data Tables | 6th pillar: Government readiness
How much priority does the government in your country place on information and communication technologies? [1 = weak priority; 7 = high
priority] | 2009–2010 weighted average
RANK COUNTRY/ECONOMY SCORE 1 MEAN: 4.66 7 RANK COUNTRY/ECONOMY SCORE 1 MEAN: 4.66 7
1 Singapore ............................6.38 70 Ghana ..................................4.63
2 Qatar....................................6.35 71 Brazil ....................................4.62
3 Malta ...................................6.17 72 Czech Republic....................4.60
4 Tunisia..................................6.09 73 Moldova...............................4.59
5 Finland .................................6.09 74 Kenya...................................4.57
6 United Arab Emirates ..........6.08 75 Cambodia ............................4.56
7 Sweden ...............................6.07 76 Lithuania ..............................4.54
8 Portugal ...............................6.04 77 Russian Federation..............4.51
9 Taiwan, China ......................6.03 78 Trinidad and Tobago.............4.50
10 Luxembourg ........................5.90 79 Thailand ...............................4.50
11 Bahrain ................................5.78 80 Ethiopia................................4.49
12 Malaysia ..............................5.76 81 Albania.................................4.48
13 New Zealand .......................5.71 82 Armenia ...............................4.46
14 Estonia.................................5.65 83 Pakistan ...............................4.46
15 China ...................................5.58 84 Morocco ..............................4.45
16 Switzerland ..........................5.57 85 Côte d’Ivoire ........................4.43
17 Korea, Rep...........................5.56 86 Zambia.................................4.37
18 Vietnam ...............................5.54 87 Puerto Rico..........................4.35
19 Saudi Arabia.........................5.54 88 Georgia ................................4.34
20 United States.......................5.54 89 Tajikistan ..............................4.34
21 Gambia, The ........................5.53 90 Colombia .............................4.33
22 Oman...................................5.51 91 Guyana ................................4.33
23 Denmark..............................5.49 92 Algeria .................................4.31
24 Germany..............................5.47 93 Hungary ...............................4.29
25 Mauritius .............................5.45 94 Croatia .................................4.29
26 Hong Kong SAR ..................5.39 95 Serbia ..................................4.25
27 Norway ................................5.37 96 Libya ....................................4.25
28 Cape Verde ..........................5.36 97 Malawi .................................4.25
29 Iceland .................................5.36 98 South Africa.........................4.22
30 Barbados .............................5.35 99 Cameroon............................4.21
364 31 Canada.................................5.35 100 Spain....................................4.19
32 United Kingdom...................5.34 101 Tanzania ...............................4.17
33 Senegal................................5.33 102 Iran, Islamic Rep..................4.15
34 Brunei Darussalam ..............5.31 103 Greece.................................4.10
35 India.....................................5.31 104 Nigeria .................................4.07
36 Azerbaijan ............................5.29 105 Philippines ...........................4.06
37 Australia...............................5.28 106 Peru .....................................4.05
38 Macedonia, FYR ..................5.24 107 Latvia ...................................4.04
39 Jordan..................................5.20 108 Madagascar .........................4.03
40 Austria .................................5.20 109 Angola .................................4.02
41 Japan ...................................5.18 110 Syria.....................................4.01
42 France..................................5.17 111 Kuwait .................................4.01
43 Sri Lanka..............................5.17 112 Bulgaria................................3.99
44 Mozambique........................5.16 113 Mauritania............................3.98
45 Uruguay ...............................5.11 114 Mexico.................................3.97
46 Netherlands .........................5.09 115 Italy......................................3.96
47 Israel ....................................5.08 116 Zimbabwe............................3.85
48 Burkina Faso........................5.07 117 Honduras .............................3.83
49 Egypt ...................................5.00 118 Poland..................................3.79
50 Dominican Republic.............4.98 119 El Salvador...........................3.78
51 Chile ....................................4.96 120 Ukraine ................................3.78
52 Namibia ...............................4.88 121 Romania ..............................3.73
53 Turkey ..................................4.86 122 Nepal ...................................3.71
54 Slovenia ...............................4.83 123 Timor-Leste..........................3.70
55 Mali......................................4.83 124 Burundi ................................3.67
56 Bangladesh..........................4.80 125 Ecuador ...............................3.66
57 Kazakhstan ..........................4.80 126 Lesotho ...............................3.65
58 Mongolia..............................4.78 127 Slovak Republic ...................3.63
59 Jamaica ...............................4.78 128 Venezuela ............................3.51
60 Panama................................4.77 129 Swaziland ............................3.44
61 Belgium ...............................4.77 130 Chad ....................................3.44
62 Benin ...................................4.77 131 Guatemala ...........................3.35
63 Costa Rica ...........................4.76 132 Kyrgyz Republic ...................3.34
64 Ireland..................................4.73 133 Bolivia ..................................3.15
65 Uganda ................................4.72 134 Nicaragua.............................3.13
66 Cyprus .................................4.68 135 Argentina .............................3.01
67 Montenegro.........................4.68 136 Bosnia and Herzegovina......2.99
68 Indonesia .............................4.66 137 Lebanon...............................2.88
69 Botswana ............................4.63 138 Paraguay..............................2.81
SOURCE: World Economic Forum, Executive Opinion Survey 2009, 2010
The Global Information Technology Report 2010–2011 © 2011 World Economic Forum](https://image.slidesharecdn.com/wef-gitr-2010-2011-110427122231-phpapp01/85/Wef-gitr-2010-2011-386-320.jpg)
![6.02 Government procurement of advanced technology products
4: Data Tables | 6th pillar: Government readiness
Do government procurement decisions foster technology innovation in your country? [1 = no, not at all; 7 = yes, extremely effectively] | 2009–2010
weighted average
RANK COUNTRY/ECONOMY SCORE 1 MEAN: 3.65 7 RANK COUNTRY/ECONOMY SCORE 1 MEAN: 3.65 7
1 Qatar....................................5.55 70 Morocco ..............................3.60
2 Singapore ............................5.40 71 Zambia.................................3.58
3 United Arab Emirates ..........4.98 72 New Zealand .......................3.58
4 Luxembourg ........................4.94 73 Tanzania ...............................3.58
5 United States.......................4.72 74 Ireland..................................3.56
6 Finland .................................4.71 75 India.....................................3.53
7 Taiwan, China ......................4.67 76 Dominican Republic.............3.50
8 Malaysia ..............................4.66 77 Puerto Rico..........................3.49
9 Denmark..............................4.64 78 Madagascar .........................3.48
10 Saudi Arabia.........................4.56 79 Timor-Leste..........................3.48
11 Oman...................................4.55 80 Kenya...................................3.46
12 China ...................................4.54 81 Russian Federation..............3.45
13 Sweden ...............................4.53 82 Kazakhstan ..........................3.42
14 Tunisia..................................4.50 83 Pakistan ...............................3.42
15 Switzerland ..........................4.41 84 Namibia ...............................3.41
16 Portugal ...............................4.39 85 Egypt ...................................3.41
17 Vietnam ...............................4.39 86 Bulgaria................................3.40
18 Malta ...................................4.39 87 Spain....................................3.37
19 Israel....................................4.36 88 Honduras .............................3.36
20 Benin ...................................4.35 89 Kuwait .................................3.36
21 Bahrain ................................4.33 90 Uganda ................................3.35
22 Gambia, The ........................4.32 91 Jamaica ...............................3.32
23 Netherlands .........................4.32 92 Peru .....................................3.32
24 Iceland .................................4.32 93 Mongolia..............................3.31
25 Canada.................................4.27 94 Guyana ................................3.29
26 Hong Kong SAR ..................4.25 95 Mexico.................................3.28
27 Montenegro.........................4.24 96 Trinidad and Tobago.............3.25
28 Cyprus .................................4.22 97 Serbia ..................................3.25
29 Indonesia .............................4.21 98 Lesotho ...............................3.25
30 Czech Republic....................4.21 99 Côte d’Ivoire ........................3.23
31 Germany..............................4.21 100 Ghana ..................................3.22 365
32 Brunei Darussalam ..............4.20 101 Georgia ................................3.22
33 Norway ................................4.19 102 South Africa.........................3.21
34 Angola .................................4.19 103 Lithuania ..............................3.21
35 Azerbaijan ............................4.12 104 Romania ..............................3.21
36 Australia...............................4.11 105 Hungary ...............................3.19
37 Austria .................................4.10 106 Nigeria .................................3.16
38 Korea, Rep...........................4.10 107 Greece.................................3.16
39 Sri Lanka..............................4.10 108 Cameroon............................3.14
40 Japan ...................................4.10 109 Macedonia, FYR ..................3.14
41 Mozambique........................4.09 110 Latvia ...................................3.14
42 Estonia.................................4.07 111 Ukraine ................................3.13
43 Chile ....................................4.06 112 El Salvador...........................3.05
44 Senegal................................4.05 113 Chad ....................................3.03
45 Cape Verde ..........................4.04 114 Bangladesh..........................3.02
46 Belgium ...............................4.00 115 Bosnia and Herzegovina......2.98
47 France..................................3.96 116 Italy......................................2.97
48 Barbados .............................3.93 117 Ecuador ...............................2.95
49 Brazil ....................................3.93 118 Syria.....................................2.95
50 Colombia .............................3.90 119 Guatemala ...........................2.95
51 Botswana ............................3.88 120 Croatia .................................2.93
52 United Kingdom...................3.85 121 Bolivia ..................................2.92
53 Ethiopia................................3.85 122 Algeria .................................2.91
54 Costa Rica ...........................3.84 123 Zimbabwe............................2.79
55 Panama................................3.80 124 Nicaragua.............................2.78
56 Jordan..................................3.78 125 Libya ....................................2.77
57 Mali......................................3.76 126 Slovak Republic ...................2.71
58 Thailand ...............................3.74 127 Burundi ................................2.69
59 Iran, Islamic Rep..................3.72 128 Philippines ...........................2.68
60 Poland..................................3.72 129 Argentina .............................2.68
61 Turkey ..................................3.72 130 Swaziland ............................2.67
62 Albania.................................3.71 131 Paraguay..............................2.65
63 Slovenia ...............................3.68 132 Nepal ...................................2.62
64 Cambodia ............................3.68 133 Armenia ...............................2.61
65 Tajikistan ..............................3.66 134 Moldova...............................2.58
66 Mauritius .............................3.66 135 Mauritania............................2.55
67 Malawi .................................3.66 136 Venezuela ............................2.39
68 Uruguay ...............................3.65 137 Kyrgyz Republic ...................2.38
69 Burkina Faso........................3.64 138 Lebanon...............................2.36
SOURCE: World Economic Forum, Executive Opinion Survey 2009, 2010
The Global Information Technology Report 2010–2011 © 2011 World Economic Forum](https://image.slidesharecdn.com/wef-gitr-2010-2011-110427122231-phpapp01/85/Wef-gitr-2010-2011-387-320.jpg)
![6.03 Importance of ICT to government vision of the future
4: Data Tables | 6th pillar: Government readiness
To what extent does the government have a clear implementation plan for utilizing information and communication technologies to improve your
country’s overall competitiveness? [1 = no plan; 7 = clear plan] | 2009–2010 weighted average
RANK COUNTRY/ECONOMY SCORE 1 MEAN: 4.01 7 RANK COUNTRY/ECONOMY SCORE 1 MEAN: 4.01 7
1 Singapore ............................6.16 70 Egypt ...................................3.94
2 Qatar....................................5.73 71 Malawi .................................3.92
3 United Arab Emirates ..........5.66 72 Bangladesh..........................3.90
4 Malta ...................................5.55 73 Lithuania ..............................3.86
5 Portugal ...............................5.39 74 Czech Republic....................3.83
6 Taiwan, China ......................5.39 75 Trinidad and Tobago.............3.81
7 Tunisia..................................5.38 76 Jamaica ...............................3.79
8 Sweden ...............................5.36 77 Turkey ..................................3.79
9 Saudi Arabia.........................5.17 78 Mauritania............................3.79
10 Oman...................................5.17 79 Namibia ...............................3.77
11 Malaysia ..............................5.13 80 Mongolia..............................3.76
12 Luxembourg ........................5.12 81 Nigeria .................................3.76
13 Hong Kong SAR ..................5.12 82 Mali......................................3.74
14 Bahrain ................................5.09 83 Tanzania ...............................3.74
15 China ...................................5.06 84 Tajikistan ..............................3.74
16 Denmark..............................5.01 85 Mexico.................................3.74
17 Australia...............................4.98 86 Ghana ..................................3.73
18 New Zealand .......................4.96 87 South Africa.........................3.72
19 Estonia.................................4.96 88 Cambodia ............................3.71
20 Korea, Rep...........................4.95 89 Benin ...................................3.70
21 Finland .................................4.91 90 Pakistan ...............................3.69
22 United States.......................4.79 91 Guyana ................................3.67
23 Gambia, The ........................4.78 92 Armenia ...............................3.67
24 Norway ................................4.78 93 Libya ....................................3.65
25 Iceland .................................4.78 94 Iran, Islamic Rep..................3.62
26 Vietnam ...............................4.72 95 Bulgaria................................3.60
27 Cape Verde ..........................4.71 96 Hungary ...............................3.58
28 Canada.................................4.71 97 Puerto Rico..........................3.57
29 Chile ....................................4.64 98 Spain....................................3.55
30 France..................................4.62 99 Georgia ................................3.52
366 31 Brunei Darussalam ..............4.62 100 Russian Federation..............3.50
32 India.....................................4.61 101 Croatia .................................3.46
33 Austria .................................4.58 102 Peru .....................................3.45
34 Germany..............................4.58 103 Honduras .............................3.41
35 Montenegro.........................4.54 104 Italy......................................3.41
36 Jordan..................................4.52 105 El Salvador...........................3.39
37 Sri Lanka..............................4.52 106 Philippines ...........................3.36
38 United Kingdom...................4.51 107 Angola .................................3.36
39 Switzerland ..........................4.51 108 Kuwait .................................3.35
40 Japan ...................................4.48 109 Greece.................................3.35
41 Senegal................................4.47 110 Lesotho ...............................3.34
42 Azerbaijan ............................4.44 111 Serbia ..................................3.30
43 Netherlands .........................4.42 112 Côte d’Ivoire ........................3.29
44 Burkina Faso........................4.40 113 Latvia ...................................3.28
45 Uruguay ...............................4.37 114 Madagascar .........................3.27
46 Panama................................4.35 115 Romania ..............................3.26
47 Mauritius .............................4.34 116 Poland..................................3.24
48 Costa Rica ...........................4.32 117 Syria.....................................3.21
49 Uganda ................................4.29 118 Ecuador ...............................3.19
50 Kenya...................................4.28 119 Moldova...............................3.19
51 Cyprus .................................4.27 120 Slovak Republic ...................3.16
52 Botswana ............................4.26 121 Timor-Leste..........................3.15
53 Barbados .............................4.25 122 Chad ....................................3.11
54 Dominican Republic.............4.25 123 Algeria .................................3.09
55 Colombia .............................4.23 124 Guatemala ...........................3.09
56 Macedonia, FYR ..................4.23 125 Nepal ...................................3.07
57 Mozambique........................4.21 126 Cameroon............................3.07
58 Brazil ....................................4.18 127 Zimbabwe............................3.03
59 Kazakhstan ..........................4.14 128 Swaziland ............................2.95
60 Morocco ..............................4.11 129 Burundi ................................2.94
61 Israel ....................................4.11 130 Ukraine ................................2.90
62 Indonesia .............................4.09 131 Venezuela ............................2.81
63 Ireland..................................4.09 132 Bolivia ..................................2.71
64 Zambia.................................4.06 133 Paraguay..............................2.68
65 Slovenia ...............................4.03 134 Nicaragua.............................2.59
66 Ethiopia................................4.02 135 Argentina .............................2.56
67 Albania.................................4.01 136 Kyrgyz Republic ...................2.47
68 Thailand ...............................3.98 137 Bosnia and Herzegovina......2.37
69 Belgium ...............................3.94 138 Lebanon...............................2.21
SOURCE: World Economic Forum, Executive Opinion Survey 2009, 2010
The Global Information Technology Report 2010–2011 © 2011 World Economic Forum](https://image.slidesharecdn.com/wef-gitr-2010-2011-110427122231-phpapp01/85/Wef-gitr-2010-2011-388-320.jpg)
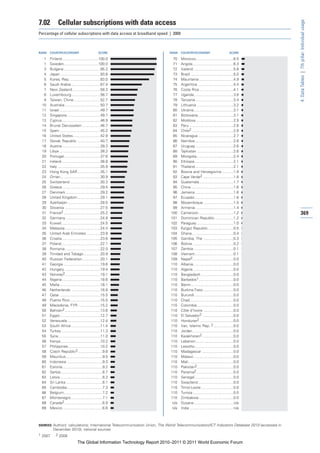
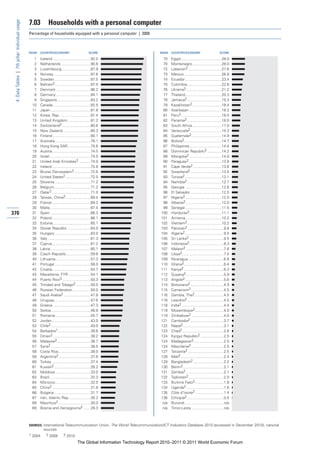
![7.06 Internet access in schools
4: Data Tables | 7th pillar: Individual usage
How would you rate the level of access to the Internet in schools in your country? [1 = very limited; 7 = extensive] | 2009–2010 weighted average
RANK COUNTRY/ECONOMY SCORE 1 MEAN: 4.06 7 RANK COUNTRY/ECONOMY SCORE 1 MEAN: 4.06 7
1 Iceland .................................6.76 70 India.....................................3.83
2 Estonia.................................6.42 71 Bosnia and Herzegovina......3.82
3 Sweden ...............................6.41 72 Brazil ....................................3.75
4 Qatar....................................6.32 73 Mauritius .............................3.74
5 Singapore ............................6.21 74 Georgia ................................3.73
6 Netherlands .........................6.18 75 Panama................................3.72
7 Switzerland ..........................6.15 76 Philippines ...........................3.71
8 Taiwan, China ......................6.11 77 Azerbaijan ............................3.71
9 Hong Kong SAR ..................6.10 78 Gambia, The ........................3.66
10 Denmark..............................6.09 79 Lebanon...............................3.65
11 Finland .................................6.07 80 Jamaica ...............................3.65
12 Korea, Rep...........................6.04 81 Greece.................................3.65
13 Canada.................................5.95 82 Sri Lanka..............................3.64
14 United States.......................5.89 83 Morocco ..............................3.63
15 Norway ................................5.88 84 Pakistan ...............................3.61
16 Austria .................................5.82 85 Italy......................................3.60
17 Malta ...................................5.81 86 Mongolia..............................3.58
18 United Kingdom...................5.81 87 Serbia ..................................3.54
19 Luxembourg ........................5.76 88 Colombia .............................3.51
20 Belgium ...............................5.76 89 Mexico.................................3.46
21 New Zealand .......................5.75 90 Cape Verde ..........................3.40
22 China ...................................5.72 91 Kenya...................................3.38
23 Slovenia ...............................5.71 92 Dominican Republic.............3.35
24 Czech Republic....................5.66 93 Botswana ............................3.31
25 Portugal ...............................5.61 94 Tajikistan ..............................3.31
26 Uruguay ...............................5.55 95 Egypt ...................................3.27
27 Lithuania ..............................5.52 96 Kyrgyz Republic ...................3.23
28 Australia...............................5.46 97 Honduras .............................3.21
29 United Arab Emirates ..........5.42 98 Nigeria .................................3.20
30 Latvia ...................................5.42 99 South Africa.........................3.15
31 Hungary ...............................5.40 100 Benin ...................................3.12 373
32 Bahrain ................................5.34 101 Venezuela ............................3.08
33 Israel....................................5.19 102 Namibia ...............................3.07
34 Barbados .............................5.04 103 Ghana ..................................3.06
35 Slovak Republic ...................5.03 104 El Salvador...........................3.04
36 Malaysia ..............................4.96 105 Guatemala ...........................3.04
37 Cyprus .................................4.95 106 Armenia ...............................3.04
38 Brunei Darussalam ..............4.92 107 Guyana ................................3.04
39 Germany..............................4.87 108 Ecuador ...............................3.02
40 Japan ...................................4.87 109 Cambodia ............................3.02
41 France..................................4.83 110 Argentina .............................2.98
42 Chile ....................................4.70 111 Nepal ...................................2.85
43 Thailand ...............................4.65 112 Zambia.................................2.84
44 Croatia .................................4.65 113 Iran, Islamic Rep..................2.83
45 Bulgaria................................4.57 114 Uganda ................................2.82
46 Oman...................................4.55 115 Swaziland ............................2.79
47 Tunisia..................................4.55 116 Mali......................................2.78
48 Poland..................................4.54 117 Madagascar .........................2.73
49 Vietnam ...............................4.53 118 Nicaragua.............................2.68
50 Indonesia .............................4.51 119 Mozambique........................2.64
51 Jordan..................................4.43 120 Bolivia ..................................2.64
52 Saudi Arabia.........................4.43 121 Cameroon............................2.60
53 Spain....................................4.42 122 Tanzania ...............................2.59
54 Macedonia, FYR ..................4.41 123 Côte d’Ivoire ........................2.57
55 Romania ..............................4.35 124 Algeria .................................2.55
56 Montenegro.........................4.32 125 Malawi .................................2.49
57 Turkey ..................................4.30 126 Ethiopia................................2.44
58 Ireland..................................4.23 127 Zimbabwe............................2.34
59 Puerto Rico..........................4.21 128 Libya ....................................2.28
60 Senegal................................4.20 129 Mauritania............................2.18
61 Moldova...............................4.12 130 Syria.....................................2.15
62 Russian Federation..............4.12 131 Lesotho ...............................2.11
63 Kazakhstan ..........................4.09 132 Bangladesh..........................2.06
64 Costa Rica ...........................4.07 133 Timor-Leste..........................2.05
65 Trinidad and Tobago.............4.00 134 Paraguay..............................1.97
66 Peru .....................................3.94 135 Burkina Faso........................1.94
67 Kuwait .................................3.92 136 Angola .................................1.80
68 Ukraine ................................3.84 137 Chad ....................................1.62
69 Albania.................................3.83 138 Burundi ................................1.57
SOURCE: World Economic Forum, Executive Opinion Survey 2009, 2010
The Global Information Technology Report 2010–2011 © 2011 World Economic Forum](https://image.slidesharecdn.com/wef-gitr-2010-2011-110427122231-phpapp01/85/Wef-gitr-2010-2011-395-320.jpg)
![7.07 Use of virtual social networks
4: Data Tables | 7th pillar: Individual usage
How widely used are virtual social networks (Facebook, Twitter, LinkedIn, etc.) for professional and personal communication in your country?
[1 = not at all; 7 = widely] | 2009–2010 weighted average
RANK COUNTRY/ECONOMY SCORE 1 MEAN: 4.99 7 RANK COUNTRY/ECONOMY SCORE 1 MEAN: 4.99 7
1 Iceland .................................6.80 70 Jamaica ...............................5.15
2 Sweden ...............................6.48 71 Romania ..............................5.15
3 United Kingdom...................6.42 72 Colombia .............................5.15
4 Norway ................................6.34 73 Saudi Arabia.........................5.14
5 Denmark..............................6.25 74 Gambia, The ........................5.13
6 Canada.................................6.24 75 Oman...................................5.11
7 Finland .................................6.16 76 Bosnia and Herzegovina......5.04
8 Switzerland ..........................6.15 77 Cyprus .................................5.02
9 Australia...............................6.14 78 Thailand ...............................5.00
10 Austria .................................6.13 79 Turkey ..................................4.97
11 Qatar....................................6.12 80 China ...................................4.97
12 United States.......................6.11 81 Peru .....................................4.96
13 Hong Kong SAR ..................6.11 82 Greece.................................4.95
14 Luxembourg ........................6.07 83 Croatia .................................4.94
15 Netherlands .........................6.06 84 Namibia ...............................4.83
16 Singapore ............................6.03 85 Kenya...................................4.83
17 Tunisia..................................6.02 86 Mexico.................................4.81
18 New Zealand .......................6.02 87 El Salvador...........................4.79
19 Puerto Rico..........................5.96 88 South Africa.........................4.78
20 Lebanon...............................5.92 89 India.....................................4.78
21 Taiwan, China ......................5.90 90 Pakistan ...............................4.76
22 United Arab Emirates ..........5.89 91 Senegal................................4.73
23 Germany..............................5.88 92 Côte d’Ivoire ........................4.67
24 Uruguay ...............................5.87 93 Botswana ............................4.64
25 Bahrain ................................5.85 94 Hungary ...............................4.63
26 Chile ....................................5.83 95 Bolivia ..................................4.59
27 Belgium ...............................5.81 96 Vietnam ...............................4.58
28 Malta ...................................5.76 97 Nicaragua.............................4.54
29 Malaysia ..............................5.76 98 Timor-Leste..........................4.49
30 Morocco ..............................5.74 99 Guyana ................................4.47
374 31 Estonia.................................5.73 100 Ecuador ...............................4.47
32 Panama................................5.72 101 Serbia ..................................4.45
33 Indonesia .............................5.72 102 Russian Federation..............4.44
34 Albania.................................5.72 103 Cape Verde ..........................4.44
35 Trinidad and Tobago.............5.69 104 Kazakhstan ..........................4.43
36 Portugal ...............................5.68 105 Lesotho ...............................4.42
37 France..................................5.67 106 Moldova...............................4.40
38 Israel ....................................5.66 107 Madagascar .........................4.37
39 Korea, Rep...........................5.64 108 Cambodia ............................4.33
40 Dominican Republic.............5.64 109 Sri Lanka..............................4.28
41 Montenegro.........................5.59 110 Ghana ..................................4.25
42 Slovak Republic ...................5.59 111 Mongolia..............................4.22
43 Macedonia, FYR ..................5.56 112 Paraguay..............................4.21
44 Azerbaijan ............................5.54 113 Armenia ...............................4.20
45 Lithuania ..............................5.51 114 Libya ....................................4.20
46 Philippines ...........................5.50 115 Poland..................................4.17
47 Barbados .............................5.48 116 Zambia.................................4.15
48 Ireland..................................5.47 117 Malawi .................................4.15
49 Costa Rica ...........................5.47 118 Swaziland ............................3.99
50 Brunei Darussalam ..............5.45 119 Ukraine ................................3.98
51 Italy ......................................5.44 120 Kyrgyz Republic ...................3.92
52 Guatemala ...........................5.43 121 Bangladesh..........................3.89
53 Czech Republic....................5.40 122 Angola .................................3.86
54 Bulgaria................................5.37 123 Benin ...................................3.85
55 Venezuela ............................5.37 124 Nepal ...................................3.84
56 Kuwait .................................5.35 125 Zimbabwe............................3.81
57 Jordan..................................5.35 126 Tanzania ...............................3.62
58 Honduras .............................5.33 127 Uganda ................................3.51
59 Algeria .................................5.32 128 Cameroon............................3.48
60 Georgia ................................5.30 129 Mozambique........................3.35
61 Mauritius .............................5.30 130 Tajikistan ..............................3.19
62 Spain....................................5.28 131 Iran, Islamic Rep..................3.16
63 Brazil ....................................5.28 132 Ethiopia................................3.11
64 Slovenia ...............................5.24 133 Mali......................................2.97
65 Egypt ...................................5.24 134 Burkina Faso........................2.94
66 Latvia ...................................5.24 135 Mauritania............................2.91
67 Japan ...................................5.20 136 Syria.....................................2.83
68 Nigeria .................................5.19 137 Chad ....................................2.48
69 Argentina .............................5.17 138 Burundi ................................2.18
SOURCE: World Economic Forum, Executive Opinion Survey 2009, 2010
The Global Information Technology Report 2010–2011 © 2011 World Economic Forum](https://image.slidesharecdn.com/wef-gitr-2010-2011-110427122231-phpapp01/85/Wef-gitr-2010-2011-396-320.jpg)
![7.08 Impact of ICT on access to basic services
4: Data Tables | 7th pillar: Individual usage
To what extent are information and communications technologies improving access for all citizens to basic services (health, education, financial
services, etc.) in your country? [1 = do not improve access at all, 7 = improve access significantly] | 2009–2010 weighted average
RANK COUNTRY/ECONOMY SCORE 1 MEAN: 4.48 7 RANK COUNTRY/ECONOMY SCORE 1 MEAN: 4.48 7
1 Sweden ...............................6.15 70 Botswana ............................4.41
2 Singapore ............................6.11 71 Puerto Rico..........................4.41
3 Qatar....................................6.11 72 Namibia ...............................4.34
4 Taiwan, China ......................6.06 73 Czech Republic....................4.34
5 United Arab Emirates ..........6.03 74 Colombia .............................4.31
6 Luxembourg ........................5.76 75 Albania.................................4.29
7 Iceland .................................5.76 76 Uganda ................................4.26
8 Korea, Rep...........................5.73 77 Romania ..............................4.25
9 Malta ...................................5.67 78 Italy......................................4.25
10 Portugal ...............................5.64 79 Peru .....................................4.24
11 Bahrain ................................5.63 80 Cambodia ............................4.23
12 Hong Kong SAR ..................5.60 81 Trinidad and Tobago.............4.23
13 Tunisia..................................5.60 82 Angola .................................4.22
14 Denmark..............................5.53 83 Pakistan ...............................4.22
15 Malaysia ..............................5.50 84 Ghana ..................................4.22
16 Norway ................................5.49 85 Malawi .................................4.21
17 Oman...................................5.48 86 Croatia .................................4.21
18 Estonia.................................5.48 87 Zambia.................................4.17
19 Switzerland ..........................5.44 88 Bulgaria................................4.16
20 Saudi Arabia.........................5.38 89 Latvia ...................................4.16
21 China ...................................5.36 90 Greece.................................4.14
22 United States.......................5.30 91 Tajikistan ..............................4.11
23 Canada.................................5.29 92 Georgia ................................4.11
24 Germany..............................5.28 93 Guyana ................................4.09
25 Finland .................................5.28 94 Morocco ..............................4.06
26 France..................................5.24 95 South Africa.........................4.01
27 Austria .................................5.24 96 Philippines ...........................4.01
28 Netherlands .........................5.21 97 Mali......................................4.00
29 Barbados .............................5.18 98 Poland..................................4.00
30 Gambia, The ........................5.17 99 Hungary ...............................3.99
31 Uruguay ...............................5.12 100 Moldova...............................3.98 375
32 Israel....................................5.04 101 Russian Federation..............3.96
33 Chile ....................................5.04 102 Madagascar .........................3.96
34 Australia...............................5.03 103 Ethiopia................................3.95
35 Brunei Darussalam ..............5.02 104 Mexico.................................3.95
36 Belgium ...............................5.00 105 Ukraine ................................3.94
37 New Zealand .......................5.00 106 Honduras .............................3.91
38 Jordan..................................4.96 107 El Salvador...........................3.91
39 United Kingdom...................4.95 108 Guatemala ...........................3.90
40 Cape Verde ..........................4.94 109 Libya ....................................3.89
41 Egypt ...................................4.89 110 Kuwait .................................3.88
42 India.....................................4.88 111 Benin ...................................3.88
43 Lithuania ..............................4.88 112 Iran, Islamic Rep..................3.88
44 Slovenia ...............................4.87 113 Bangladesh..........................3.85
45 Japan ...................................4.87 114 Côte d’Ivoire ........................3.83
46 Vietnam ...............................4.79 115 Lesotho ...............................3.83
47 Jamaica ...............................4.78 116 Tanzania ...............................3.82
48 Sri Lanka..............................4.76 117 Armenia ...............................3.79
49 Brazil ....................................4.73 118 Slovak Republic ...................3.78
50 Macedonia, FYR ..................4.71 119 Serbia ..................................3.72
51 Thailand ...............................4.71 120 Ecuador ...............................3.69
52 Cyprus .................................4.71 121 Nepal ...................................3.66
53 Mauritius .............................4.70 122 Mauritania............................3.63
54 Kenya...................................4.68 123 Cameroon............................3.55
55 Turkey ..................................4.67 124 Algeria .................................3.55
56 Mozambique........................4.65 125 Bosnia and Herzegovina......3.46
57 Senegal................................4.63 126 Syria.....................................3.46
58 Ireland..................................4.61 127 Chad ....................................3.33
59 Nigeria .................................4.60 128 Lebanon...............................3.25
60 Spain....................................4.58 129 Swaziland ............................3.24
61 Mongolia..............................4.56 130 Nicaragua.............................3.23
62 Kazakhstan ..........................4.54 131 Bolivia ..................................3.20
63 Panama................................4.52 132 Zimbabwe............................3.17
64 Azerbaijan ............................4.51 133 Venezuela ............................3.15
65 Burkina Faso........................4.50 134 Kyrgyz Republic ...................3.12
66 Dominican Republic.............4.49 135 Argentina .............................3.08
67 Costa Rica ...........................4.48 136 Paraguay..............................3.02
68 Indonesia .............................4.46 137 Burundi ................................2.82
69 Montenegro.........................4.44 138 Timor-Leste..........................2.70
SOURCE: World Economic Forum, Executive Opinion Survey 2009, 2010
The Global Information Technology Report 2010–2011 © 2011 World Economic Forum](https://image.slidesharecdn.com/wef-gitr-2010-2011-110427122231-phpapp01/85/Wef-gitr-2010-2011-397-320.jpg)

![8.01 Firm-level technology absorption
4: Data Tables | 8th pillar: Business usage
To what extent do businesses in your country absorb new technology? [1 = not at all; 7 = aggressively absorb] | 2009–2010 weighted average
RANK COUNTRY/ECONOMY SCORE 1 MEAN: 4.85 7 RANK COUNTRY/ECONOMY SCORE 1 MEAN: 4.85 7
1 Iceland .................................6.49 70 Brunei Darussalam ..............4.82
2 Sweden ...............................6.43 71 Slovenia ...............................4.81
3 Japan ...................................6.25 72 Peru .....................................4.79
4 Switzerland ..........................6.25 73 Morocco ..............................4.77
5 United Arab Emirates ..........6.23 74 Jamaica ...............................4.68
6 Norway ................................6.20 75 Syria.....................................4.68
7 Israel ....................................6.13 76 Nigeria .................................4.67
8 Qatar....................................6.11 77 Honduras .............................4.63
9 Korea, Rep...........................6.07 78 Uruguay ...............................4.62
10 Taiwan, China ......................6.07 79 Trinidad and Tobago.............4.62
11 United States.......................6.02 80 Botswana ............................4.60
12 Finland .................................6.01 81 El Salvador...........................4.59
13 Denmark..............................6.00 82 Poland..................................4.59
14 Germany..............................6.00 83 Mongolia..............................4.56
15 Singapore ............................5.96 84 Colombia .............................4.54
16 Austria .................................5.95 85 Zambia.................................4.53
17 New Zealand .......................5.91 86 Mexico.................................4.51
18 Hong Kong SAR ..................5.90 87 Pakistan ...............................4.50
19 Australia...............................5.90 88 Latvia ...................................4.47
20 Luxembourg ........................5.73 89 Montenegro.........................4.46
21 United Kingdom...................5.67 90 Greece.................................4.44
22 Canada.................................5.63 91 Albania.................................4.43
23 France..................................5.62 92 Cambodia ............................4.43
24 Puerto Rico..........................5.62 93 Argentina .............................4.42
25 Netherlands .........................5.61 94 Cameroon............................4.40
26 Saudi Arabia.........................5.59 95 Ukraine ................................4.40
27 Portugal ...............................5.56 96 Mozambique........................4.40
28 Belgium ...............................5.51 97 Croatia .................................4.37
29 Jordan..................................5.51 98 Libya ....................................4.36
30 Malaysia ..............................5.49 99 Mali......................................4.35
378 31 Malta ...................................5.48 100 Burkina Faso........................4.31
32 Ireland..................................5.45 101 Italy......................................4.30
33 Tunisia..................................5.42 102 Malawi .................................4.29
34 Barbados .............................5.41 103 Uganda ................................4.29
35 South Africa.........................5.41 104 Kazakhstan ..........................4.29
36 Czech Republic....................5.37 105 Ecuador ...............................4.25
37 Chile ....................................5.35 106 Madagascar .........................4.23
38 Kuwait .................................5.33 107 Romania ..............................4.23
39 India.....................................5.32 108 Bangladesh..........................4.22
40 Senegal................................5.31 109 Venezuela ............................4.22
41 Panama................................5.31 110 Guyana ................................4.21
42 Estonia.................................5.31 111 Ghana ..................................4.14
43 Cyprus .................................5.30 112 Macedonia, FYR ..................4.12
44 Guatemala ...........................5.24 113 Lesotho ...............................4.10
45 Namibia ...............................5.20 114 Benin ...................................4.07
46 Brazil ....................................5.18 115 Iran, Islamic Rep..................4.06
47 Sri Lanka..............................5.16 116 Paraguay..............................4.05
48 Bahrain ................................5.16 117 Nicaragua.............................4.04
49 Spain....................................5.15 118 Bosnia and Herzegovina......4.04
50 Costa Rica ...........................5.14 119 Russian Federation..............4.04
51 Turkey ..................................5.12 120 Armenia ...............................4.03
52 Oman...................................5.10 121 Tajikistan ..............................3.99
53 Mauritius .............................5.05 122 Tanzania ...............................3.98
54 Slovak Republic ...................5.01 123 Ethiopia................................3.98
55 Lithuania ..............................5.01 124 Georgia ................................3.97
56 Dominican Republic.............5.00 125 Zimbabwe............................3.96
57 Egypt ...................................4.99 126 Bulgaria................................3.95
58 Philippines ...........................4.98 127 Algeria .................................3.94
59 Vietnam ...............................4.96 128 Nepal ...................................3.92
60 China ...................................4.95 129 Angola .................................3.73
61 Azerbaijan ............................4.93 130 Mauritania............................3.73
62 Cape Verde ..........................4.91 131 Swaziland ............................3.71
63 Côte d’Ivoire ........................4.89 132 Moldova...............................3.70
64 Indonesia .............................4.88 133 Serbia ..................................3.69
65 Thailand ...............................4.88 134 Bolivia ..................................3.68
66 Kenya...................................4.85 135 Burundi ................................3.59
67 Lebanon...............................4.84 136 Kyrgyz Republic ...................3.55
68 Gambia, The ........................4.83 137 Chad ....................................3.48
69 Hungary ...............................4.82 138 Timor-Leste..........................3.25
SOURCE: World Economic Forum, Executive Opinion Survey 2009, 2010
The Global Information Technology Report 2010–2011 © 2011 World Economic Forum](https://image.slidesharecdn.com/wef-gitr-2010-2011-110427122231-phpapp01/85/Wef-gitr-2010-2011-400-320.jpg)
![8.02 Capacity for innovation
4: Data Tables | 8th pillar: Business usage
In your country, how do companies obtain technology? [1 = exclusively from licensing or imitating foreign companies; 7 = by conducting formal
research and pioneering their own new products and processes] | 2009–2010 weighted average
RANK COUNTRY/ECONOMY SCORE 1 MEAN: 3.18 7 RANK COUNTRY/ECONOMY SCORE 1 MEAN: 3.18 7
1 Germany..............................5.88 70 Colombia .............................2.90
2 Japan ...................................5.82 71 Guatemala ...........................2.89
3 Sweden ...............................5.73 72 Romania ..............................2.88
4 Switzerland ..........................5.70 73 Nigeria .................................2.87
5 Finland .................................5.57 74 Mongolia..............................2.84
6 United States.......................5.28 75 Kazakhstan ..........................2.82
7 Israel....................................5.26 76 Mauritius .............................2.81
8 France..................................5.09 77 Senegal................................2.78
9 Denmark..............................4.94 78 Tanzania ...............................2.78
10 Netherlands .........................4.88 79 Bulgaria................................2.78
11 Austria .................................4.74 80 Philippines ...........................2.76
12 Belgium ...............................4.72 81 Panama................................2.75
13 Norway ................................4.70 82 Serbia ..................................2.75
14 Taiwan, China ......................4.69 83 Brunei Darussalam ..............2.74
15 United Kingdom...................4.65 84 Malawi .................................2.73
16 Luxembourg ........................4.57 85 Bolivia ..................................2.70
17 Singapore ............................4.30 86 Mexico.................................2.70
18 Korea, Rep...........................4.26 87 Macedonia, FYR ..................2.70
19 Canada.................................4.25 88 Tajikistan ..............................2.69
20 Iceland .................................4.18 89 Guyana ................................2.68
21 China ...................................4.17 90 Honduras .............................2.68
22 Slovenia ...............................4.17 91 Moldova...............................2.67
23 Australia...............................4.12 92 Nicaragua.............................2.67
24 Czech Republic....................4.11 93 Barbados .............................2.67
25 Malaysia ..............................4.09 94 Morocco ..............................2.66
26 Saudi Arabia.........................4.01 95 Peru .....................................2.65
27 Italy ......................................3.97 96 Jordan..................................2.61
28 New Zealand .......................3.86 97 Kuwait .................................2.60
29 Brazil ....................................3.78 98 Madagascar .........................2.59
30 Indonesia .............................3.75 99 Lebanon...............................2.59
31 Ireland..................................3.74 100 Albania.................................2.58 379
32 Vietnam ...............................3.63 101 Cambodia ............................2.56
33 India.....................................3.61 102 Cameroon............................2.56
34 Estonia.................................3.61 103 Botswana ............................2.55
35 United Arab Emirates ..........3.55 104 Zambia.................................2.54
36 Tunisia..................................3.54 105 Greece.................................2.54
37 Ukraine ................................3.50 106 Ethiopia................................2.52
38 Russian Federation..............3.49 107 Jamaica ...............................2.52
39 Portugal ...............................3.48 108 Mozambique........................2.50
40 Azerbaijan ............................3.48 109 Egypt ...................................2.49
41 Sri Lanka..............................3.45 110 Ghana ..................................2.48
42 Spain....................................3.45 111 Mali......................................2.47
43 Cyprus .................................3.44 112 Georgia ................................2.45
44 Costa Rica ...........................3.44 113 Namibia ...............................2.44
45 Qatar....................................3.40 114 Ecuador ...............................2.42
46 Hungary ...............................3.37 115 Bangladesh..........................2.41
47 South Africa.........................3.36 116 Bosnia and Herzegovina......2.41
48 Lithuania ..............................3.34 117 El Salvador...........................2.40
49 Hong Kong SAR ..................3.30 118 Chad ....................................2.39
50 Poland..................................3.26 119 Paraguay..............................2.32
51 Montenegro.........................3.25 120 Dominican Republic.............2.31
52 Kenya...................................3.19 121 Zimbabwe............................2.30
53 Puerto Rico..........................3.17 122 Mauritania............................2.28
54 Malta ...................................3.11 123 Timor-Leste..........................2.27
55 Turkey ..................................3.11 124 Algeria .................................2.26
56 Thailand ...............................3.10 125 Nepal ...................................2.25
57 Latvia ...................................3.10 126 Venezuela ............................2.25
58 Pakistan ...............................3.08 127 Burkina Faso........................2.25
59 Chile ....................................3.08 128 Uganda ................................2.21
60 Benin ...................................3.06 129 Swaziland ............................2.21
61 Oman...................................3.02 130 Kyrgyz Republic ...................2.21
62 Argentina .............................3.01 131 Côte d’Ivoire ........................2.20
63 Gambia, The ........................2.99 132 Lesotho ...............................2.17
64 Uruguay ...............................2.97 133 Syria.....................................2.08
65 Armenia ...............................2.97 134 Cape Verde ..........................2.05
66 Croatia .................................2.96 135 Libya ....................................2.02
67 Bahrain ................................2.95 136 Burundi ................................2.00
68 Iran, Islamic Rep..................2.93 137 Trinidad and Tobago.............1.99
69 Slovak Republic ...................2.93 138 Angola .................................1.72
SOURCE: World Economic Forum, Executive Opinion Survey 2009, 2010
The Global Information Technology Report 2010–2011 © 2011 World Economic Forum](https://image.slidesharecdn.com/wef-gitr-2010-2011-110427122231-phpapp01/85/Wef-gitr-2010-2011-401-320.jpg)
![8.03 Extent of business Internet use
4: Data Tables | 8th pillar: Business usage
To what extent do companies within your country use the Internet for their business activities? (e.g., buying and selling goods, interacting with
customers and suppliers) [1 = not at all; 7 = extensively] | 2009–2010 weighted average
RANK COUNTRY/ECONOMY SCORE 1 MEAN: 4.88 7 RANK COUNTRY/ECONOMY SCORE 1 MEAN: 4.88 7
1 Sweden ...............................6.58 70 Russian Federation..............4.81
2 Estonia.................................6.31 71 Italy......................................4.79
3 Korea, Rep...........................6.30 72 Kenya...................................4.77
4 Iceland .................................6.29 73 Trinidad and Tobago.............4.75
5 Lithuania ..............................6.25 74 Namibia ...............................4.74
6 United Kingdom...................6.19 75 Ukraine ................................4.72
7 United States.......................6.18 76 Egypt ...................................4.72
8 Canada.................................6.16 77 Mexico.................................4.72
9 Israel ....................................6.12 78 Jamaica ...............................4.69
10 Taiwan, China ......................6.05 79 Jordan..................................4.67
11 Japan ...................................6.05 80 Guyana ................................4.67
12 Norway ................................6.04 81 Dominican Republic.............4.66
13 Hong Kong SAR ..................6.03 82 El Salvador...........................4.63
14 New Zealand .......................6.00 83 Argentina .............................4.63
15 Switzerland ..........................5.99 84 Morocco ..............................4.57
16 Netherlands .........................5.98 85 Cape Verde ..........................4.55
17 Denmark..............................5.97 86 Gambia, The ........................4.55
18 Singapore ............................5.96 87 Cambodia ............................4.55
19 Finland .................................5.89 88 Nigeria .................................4.54
20 Australia...............................5.89 89 Georgia ................................4.53
21 France..................................5.88 90 Mozambique........................4.53
22 Germany..............................5.81 91 Zambia.................................4.53
23 Czech Republic....................5.79 92 Philippines ...........................4.52
24 Austria .................................5.79 93 Kuwait .................................4.50
25 Brazil ....................................5.74 94 Albania.................................4.49
26 Malta ...................................5.73 95 Peru .....................................4.49
27 Bahrain ................................5.65 96 Montenegro.........................4.47
28 Belgium ...............................5.65 97 Mongolia..............................4.46
29 Portugal ...............................5.63 98 Moldova...............................4.40
30 Puerto Rico..........................5.60 99 Greece.................................4.40
380 31 Luxembourg ........................5.59 100 Cameroon............................4.39
32 Ireland..................................5.59 101 Malawi .................................4.39
33 United Arab Emirates ..........5.51 102 Pakistan ...............................4.35
34 Chile ....................................5.47 103 Ghana ..................................4.26
35 Malaysia ..............................5.45 104 Macedonia, FYR ..................4.23
36 Slovenia ...............................5.44 105 Ecuador ...............................4.21
37 Latvia ...................................5.40 106 Bangladesh..........................4.21
38 Slovak Republic ...................5.39 107 Benin ...................................4.21
39 Bulgaria................................5.35 108 Uganda ................................4.20
40 Guatemala ...........................5.33 109 Azerbaijan ............................4.20
41 Qatar....................................5.32 110 Venezuela ............................4.17
42 Oman...................................5.29 111 Botswana ............................4.12
43 Vietnam ...............................5.29 112 Armenia ...............................4.11
44 Barbados .............................5.25 113 Tajikistan ..............................4.10
45 Senegal................................5.25 114 Madagascar .........................4.09
46 Sri Lanka..............................5.20 115 Bolivia ..................................4.06
47 Croatia .................................5.19 116 Bosnia and Herzegovina......4.05
48 Costa Rica ...........................5.18 117 Zimbabwe............................4.05
49 Saudi Arabia.........................5.16 118 Libya ....................................4.04
50 Poland..................................5.15 119 Burkina Faso........................4.02
51 Cyprus .................................5.15 120 Kyrgyz Republic ...................4.01
52 South Africa.........................5.14 121 Tanzania ...............................3.99
53 China ...................................5.14 122 Swaziland ............................3.95
54 India.....................................5.08 123 Nepal ...................................3.94
55 Turkey ..................................5.07 124 Paraguay..............................3.92
56 Thailand ...............................5.07 125 Côte d’Ivoire ........................3.92
57 Panama................................5.02 126 Angola .................................3.91
58 Colombia .............................5.01 127 Iran, Islamic Rep..................3.84
59 Brunei Darussalam ..............5.00 128 Mauritania............................3.80
60 Kazakhstan ..........................4.97 129 Nicaragua.............................3.77
61 Indonesia .............................4.97 130 Burundi ................................3.73
62 Honduras .............................4.95 131 Mali......................................3.70
63 Romania ..............................4.94 132 Timor-Leste..........................3.66
64 Tunisia..................................4.92 133 Ethiopia................................3.61
65 Lebanon...............................4.91 134 Serbia ..................................3.61
66 Hungary ...............................4.91 135 Lesotho ...............................3.59
67 Spain....................................4.89 136 Syria.....................................3.46
68 Mauritius .............................4.89 137 Algeria .................................3.25
69 Uruguay ...............................4.88 138 Chad ....................................3.11
SOURCE: World Economic Forum, Executive Opinion Survey 2009, 2010
The Global Information Technology Report 2010–2011 © 2011 World Economic Forum](https://image.slidesharecdn.com/wef-gitr-2010-2011-110427122231-phpapp01/85/Wef-gitr-2010-2011-402-320.jpg)
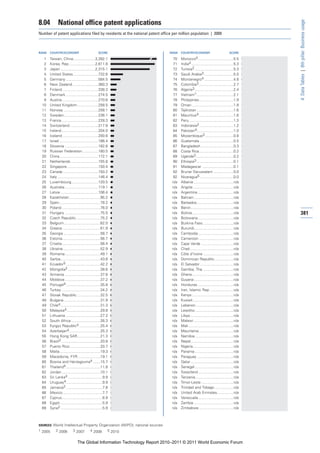
![8.07 Impact of ICT on new services and products
4: Data Tables | 8th pillar: Business usage
To what extent are information and communication technologies creating new business models, services, and products in your country?
[1 = not at all; 7 = significantly] | 2009–2010 weighted average
RANK COUNTRY/ECONOMY SCORE 1 MEAN: 4.50 7 RANK COUNTRY/ECONOMY SCORE 1 MEAN: 4.50 7
1 Sweden ...............................6.33 70 Cape Verde ..........................4.47
2 Taiwan, China ......................5.98 71 Gambia, The ........................4.46
3 Korea, Rep...........................5.88 72 Mexico.................................4.45
4 Singapore ............................5.83 73 Egypt ...................................4.45
5 France..................................5.83 74 Jordan..................................4.43
6 United Kingdom...................5.82 75 Uganda ................................4.42
7 Norway ................................5.76 76 Mongolia..............................4.40
8 Iceland .................................5.74 77 Azerbaijan ............................4.38
9 Canada.................................5.69 78 Hungary ...............................4.33
10 United States.......................5.67 79 Macedonia, FYR ..................4.33
11 Switzerland ..........................5.65 80 Philippines ...........................4.32
12 Germany..............................5.65 81 Bulgaria................................4.30
13 Estonia.................................5.56 82 Cameroon............................4.28
14 United Arab Emirates ..........5.51 83 Pakistan ...............................4.27
15 Tunisia..................................5.49 84 Brunei Darussalam ..............4.27
16 Netherlands .........................5.45 85 Malawi .................................4.27
17 Portugal ...............................5.43 86 Argentina .............................4.26
18 Finland .................................5.43 87 Zambia.................................4.24
19 Hong Kong SAR ..................5.41 88 Italy......................................4.23
20 Qatar....................................5.41 89 Trinidad and Tobago.............4.22
21 Austria .................................5.39 90 El Salvador...........................4.21
22 Israel ....................................5.36 91 Cambodia ............................4.21
23 Malaysia ..............................5.35 92 Poland..................................4.19
24 Brazil ....................................5.29 93 Benin ...................................4.18
25 Malta ...................................5.27 94 Romania ..............................4.16
26 Japan ...................................5.26 95 Slovak Republic ...................4.15
27 Chile ....................................5.25 96 Ukraine ................................4.11
28 Australia...............................5.21 97 Greece.................................4.10
29 Lithuania ..............................5.19 98 Latvia ...................................4.10
30 Panama................................5.18 99 Mozambique........................4.04
384 31 Costa Rica ...........................5.17 100 Russian Federation..............4.03
32 New Zealand .......................5.11 101 Croatia .................................3.97
33 Saudi Arabia.........................5.10 102 Bangladesh..........................3.96
34 Luxembourg ........................5.09 103 Guyana ................................3.94
35 China ...................................5.08 104 Georgia ................................3.94
36 India.....................................5.08 105 Ecuador ...............................3.94
37 Denmark..............................5.05 106 Kazakhstan ..........................3.92
38 Oman...................................5.03 107 Iran, Islamic Rep..................3.90
39 Uruguay ...............................5.02 108 Venezuela ............................3.87
40 Bahrain ................................5.00 109 Namibia ...............................3.84
41 Ireland..................................4.96 110 Botswana ............................3.84
42 Belgium ...............................4.96 111 Mali......................................3.84
43 Guatemala ...........................4.94 112 Madagascar .........................3.82
44 Spain....................................4.91 113 Morocco ..............................3.81
45 Vietnam ...............................4.91 114 Lesotho ...............................3.80
46 Dominican Republic.............4.88 115 Lebanon...............................3.79
47 Nigeria .................................4.86 116 Bolivia ..................................3.79
48 Barbados .............................4.85 117 Kuwait .................................3.75
49 Colombia .............................4.80 118 Tajikistan ..............................3.75
50 Thailand ...............................4.80 119 Paraguay..............................3.73
51 Turkey ..................................4.78 120 Tanzania ...............................3.72
52 Peru .....................................4.77 121 Armenia ...............................3.68
53 Senegal................................4.76 122 Bosnia and Herzegovina......3.63
54 Puerto Rico..........................4.74 123 Zimbabwe............................3.59
55 Kenya...................................4.73 124 Nepal ...................................3.58
56 Mauritius .............................4.71 125 Moldova...............................3.56
57 Sri Lanka..............................4.71 126 Nicaragua.............................3.50
58 Burkina Faso........................4.68 127 Ethiopia................................3.36
59 Czech Republic....................4.67 128 Angola .................................3.36
60 Cyprus .................................4.66 129 Burundi ................................3.29
61 Jamaica ...............................4.62 130 Serbia ..................................3.15
62 Slovenia ...............................4.61 131 Chad ....................................3.14
63 South Africa.........................4.55 132 Kyrgyz Republic ...................3.11
64 Montenegro.........................4.55 133 Libya ....................................3.05
65 Indonesia .............................4.55 134 Timor-Leste..........................2.94
66 Ghana ..................................4.54 135 Algeria .................................2.88
67 Albania.................................4.52 136 Syria.....................................2.80
68 Honduras .............................4.51 137 Swaziland ............................2.80
69 Côte d’Ivoire ........................4.47 138 Mauritania............................2.69
SOURCE: World Economic Forum, Executive Opinion Survey 2009, 2010
The Global Information Technology Report 2010–2011 © 2011 World Economic Forum](https://image.slidesharecdn.com/wef-gitr-2010-2011-110427122231-phpapp01/85/Wef-gitr-2010-2011-406-320.jpg)
![8.08 Impact of ICT on new organizational models
4: Data Tables | 8th pillar: Business usage
To what extent are information and communication technologies creating new organizational models (virtual teams, remote working,
tele-commuting, etc.) within businesses in your country? [1 = not at all; 7 = significantly] | 2009–2010 weighted average
RANK COUNTRY/ECONOMY SCORE 1 MEAN: 4.15 7 RANK COUNTRY/ECONOMY SCORE 1 MEAN: 4.15 7
1 Sweden ...............................6.03 70 Mexico.................................4.05
2 United States.......................5.64 71 Azerbaijan ............................4.04
3 United Kingdom...................5.53 72 Egypt ...................................4.04
4 Norway ................................5.53 73 Trinidad and Tobago.............4.03
5 Singapore ............................5.52 74 Cyprus .................................4.03
6 Taiwan, China ......................5.50 75 El Salvador...........................4.02
7 Canada.................................5.48 76 Nigeria .................................4.01
8 Qatar....................................5.43 77 Philippines ...........................3.99
9 Finland .................................5.39 78 Barbados .............................3.98
10 Israel....................................5.35 79 Vietnam ...............................3.94
11 Netherlands .........................5.30 80 Malawi .................................3.93
12 Iceland .................................5.30 81 Mozambique........................3.91
13 Malaysia ..............................5.25 82 Namibia ...............................3.91
14 France..................................5.21 83 Poland..................................3.89
15 Hong Kong SAR ..................5.19 84 Latvia ...................................3.83
16 Germany..............................5.17 85 Kazakhstan ..........................3.83
17 Estonia.................................5.16 86 Ghana ..................................3.80
18 Switzerland ..........................5.16 87 Croatia .................................3.79
19 Saudi Arabia.........................5.16 88 Russian Federation..............3.79
20 Korea, Rep...........................5.12 89 Kuwait .................................3.79
21 Tunisia..................................5.11 90 Italy......................................3.79
22 United Arab Emirates ..........5.08 91 Macedonia, FYR ..................3.78
23 Australia...............................5.07 92 Slovak Republic ...................3.72
24 Denmark..............................5.03 93 Ecuador ...............................3.70
25 Malta ...................................5.01 94 Hungary ...............................3.69
26 Lithuania ..............................4.92 95 Mongolia..............................3.66
27 Brazil ....................................4.89 96 Lesotho ...............................3.65
28 Portugal ...............................4.88 97 Morocco ..............................3.64
29 Belgium ...............................4.85 98 Ukraine ................................3.64
30 Uruguay ...............................4.84 99 Bolivia ..................................3.64
31 New Zealand .......................4.82 100 Côte d’Ivoire ........................3.64 385
32 Oman...................................4.81 101 Iran, Islamic Rep..................3.62
33 Chile ....................................4.80 102 Nicaragua.............................3.62
34 India.....................................4.73 103 Zambia.................................3.62
35 Ireland..................................4.73 104 Uganda ................................3.61
36 Colombia .............................4.72 105 Paraguay..............................3.60
37 China ...................................4.70 106 Romania ..............................3.59
38 Austria .................................4.70 107 Armenia ...............................3.58
39 Guatemala ...........................4.69 108 Georgia ................................3.58
40 Panama................................4.69 109 Burkina Faso........................3.58
41 Luxembourg ........................4.66 110 Mali......................................3.57
42 Costa Rica ...........................4.65 111 Bosnia and Herzegovina......3.56
43 Senegal................................4.63 112 Tanzania ...............................3.52
44 Japan ...................................4.56 113 Guyana ................................3.52
45 Spain....................................4.53 114 Moldova...............................3.51
46 Thailand ...............................4.51 115 Botswana ............................3.51
47 Puerto Rico..........................4.47 116 Bangladesh..........................3.50
48 Montenegro.........................4.46 117 Benin ...................................3.37
49 Sri Lanka..............................4.46 118 Venezuela ............................3.37
50 Bahrain ................................4.44 119 Tajikistan ..............................3.33
51 Indonesia .............................4.41 120 Nepal ...................................3.33
52 Dominican Republic.............4.41 121 Libya ....................................3.29
53 Albania.................................4.40 122 Greece.................................3.28
54 Peru .....................................4.40 123 Madagascar .........................3.27
55 Honduras .............................4.39 124 Cambodia ............................3.27
56 Mauritius .............................4.33 125 Lebanon...............................3.26
57 South Africa.........................4.28 126 Cameroon............................3.08
58 Turkey ..................................4.18 127 Zimbabwe............................3.03
59 Kenya...................................4.18 128 Serbia ..................................3.01
60 Jordan..................................4.18 129 Chad ....................................2.96
61 Cape Verde ..........................4.17 130 Ethiopia................................2.92
62 Brunei Darussalam ..............4.15 131 Mauritania............................2.83
63 Pakistan ...............................4.15 132 Kyrgyz Republic ...................2.79
64 Bulgaria................................4.14 133 Angola .................................2.72
65 Czech Republic....................4.14 134 Syria.....................................2.71
66 Gambia, The ........................4.10 135 Timor-Leste..........................2.68
67 Slovenia ...............................4.07 136 Swaziland ............................2.60
68 Jamaica ...............................4.06 137 Algeria .................................2.56
69 Argentina .............................4.06 138 Burundi ................................2.38
SOURCE: World Economic Forum, Executive Opinion Survey 2009, 2010
The Global Information Technology Report 2010–2011 © 2011 World Economic Forum](https://image.slidesharecdn.com/wef-gitr-2010-2011-110427122231-phpapp01/85/Wef-gitr-2010-2011-407-320.jpg)

![9.01 Government success in ICT promotion
4: Data Tables | 9th pillar: Government usage
How successful is the government in promoting the use of information and communication technologies in your country? [1 = not successful at all;
7 = extremely successful] | 2008–2009 weighted average
RANK COUNTRY/ECONOMY SCORE 1 MEAN: 4.34 7 RANK COUNTRY/ECONOMY SCORE 1 MEAN: 4.34 7
1 Singapore ............................6.22 70 Uganda ................................4.24
2 United Arab Emirates ..........6.06 71 Trinidad and Tobago.............4.22
3 Malta ...................................5.90 72 Macedonia, FYR ..................4.21
4 Qatar....................................5.85 73 Tajikistan ..............................4.20
5 Taiwan, China ......................5.79 74 Morocco ..............................4.20
6 Tunisia..................................5.67 75 Colombia .............................4.20
7 Sweden ...............................5.55 76 Nigeria .................................4.18
8 Portugal ...............................5.53 77 Croatia .................................4.17
9 Denmark..............................5.50 78 Panama................................4.16
10 Luxembourg ........................5.48 79 Benin ...................................4.13
11 Estonia.................................5.39 80 Zambia.................................4.10
12 Iceland .................................5.36 81 Romania ..............................4.08
13 Gambia, The ........................5.33 82 Cambodia ............................4.07
14 Malaysia ..............................5.30 83 Greece.................................4.05
15 Bahrain ................................5.30 84 Malawi .................................4.05
16 China ...................................5.27 85 Ghana ..................................4.04
17 Korea, Rep...........................5.25 86 Côte d’Ivoire ........................4.03
18 Norway ................................5.23 87 Turkey ..................................4.03
19 Oman...................................5.20 88 Ethiopia................................3.97
20 United States.......................5.19 89 Tanzania ...............................3.95
21 Jordan..................................5.19 90 Czech Republic....................3.95
22 India.....................................5.17 91 Puerto Rico..........................3.95
23 Finland .................................5.16 92 South Africa.........................3.94
24 Hong Kong SAR ..................5.16 93 Georgia ................................3.91
25 Saudi Arabia.........................5.08 94 Albania.................................3.91
26 Barbados .............................5.06 95 Cameroon............................3.88
27 Egypt ...................................5.02 96 Guyana ................................3.87
28 Brunei Darussalam ..............5.00 97 El Salvador...........................3.87
29 Canada.................................4.99 98 Syria.....................................3.85
30 Azerbaijan ............................4.97 99 Namibia ...............................3.84
388 31 Sri Lanka..............................4.89 100 Mexico.................................3.83
32 Australia...............................4.89 101 Honduras .............................3.83
33 Switzerland ..........................4.88 102 Spain....................................3.82
34 Senegal................................4.81 103 Ukraine ................................3.81
35 Dominican Republic.............4.81 104 Latvia ...................................3.80
36 Cyprus .................................4.80 105 Philippines ...........................3.79
37 Uruguay ...............................4.79 106 Russian Federation..............3.76
38 France..................................4.76 107 Armenia ...............................3.74
39 Germany..............................4.76 108 Serbia ..................................3.73
40 Slovenia ...............................4.71 109 Italy......................................3.71
41 Netherlands .........................4.67 110 Peru .....................................3.69
42 Austria .................................4.67 111 Bulgaria................................3.65
43 Mauritius .............................4.63 112 Algeria .................................3.63
44 Mali......................................4.61 113 Kuwait .................................3.62
45 Israel ....................................4.60 114 Guatemala ...........................3.57
46 Thailand ...............................4.59 115 Lesotho ...............................3.55
47 Burkina Faso........................4.56 116 Hungary ...............................3.55
48 Botswana ............................4.56 117 Bangladesh..........................3.54
49 Mongolia..............................4.55 118 Burundi ................................3.42
50 United Kingdom...................4.55 119 Nepal ...................................3.39
51 Mozambique........................4.53 120 Slovak Republic ...................3.38
52 Jamaica ...............................4.48 121 Timor-Leste..........................3.33
53 Japan ...................................4.48 122 Chad ....................................3.23
54 Vietnam ...............................4.47 123 Poland..................................3.22
55 Chile ....................................4.46 124 Ecuador ...............................3.11
56 Mauritania............................4.45 125 Kyrgyz Republic ...................3.10
57 Kenya...................................4.44 126 Zimbabwe............................2.95
58 Belgium ...............................4.44 127 Nicaragua.............................2.94
59 New Zealand .......................4.41 128 Venezuela ............................2.93
60 Brazil ....................................4.40 129 Argentina .............................2.88
61 Libya ....................................4.39 130 Bosnia and Herzegovina......2.73
62 Costa Rica ...........................4.37 131 Paraguay..............................2.60
63 Kazakhstan ..........................4.36 132 Bolivia ..................................2.58
64 Ireland..................................4.34 n/a Angola....................................n/a
65 Indonesia .............................4.34 n/a Cape Verde ............................n/a
66 Madagascar .........................4.28 n/a Iran, Islamic Rep....................n/a
67 Montenegro.........................4.27 n/a Lebanon.................................n/a
68 Pakistan ...............................4.27 n/a Moldova.................................n/a
69 Lithuania ..............................4.27 n/a Swaziland...............................n/a
SOURCE: World Economic Forum, Executive Opinion Survey 2008, 2009
The Global Information Technology Report 2010–2011 © 2011 World Economic Forum](https://image.slidesharecdn.com/wef-gitr-2010-2011-110427122231-phpapp01/85/Wef-gitr-2010-2011-410-320.jpg)
![9.02 ICT use and government efficiency
4: Data Tables | 9th pillar: Government usage
To what extent has the use of information and communication technologies by the government improved the efficiency of government services in
your country? [1 = no effect; 7 = has generated considerable improvements] | 2009–2010 weighted average
RANK COUNTRY/ECONOMY SCORE 1 MEAN: 4.30 7 RANK COUNTRY/ECONOMY SCORE 1 MEAN: 4.30 7
1 Qatar....................................6.16 70 Kazakhstan ..........................4.24
2 Singapore ............................6.15 71 Mozambique........................4.24
3 Sweden ...............................5.99 72 Indonesia .............................4.23
4 United Arab Emirates ..........5.99 73 Albania.................................4.23
5 Taiwan, China ......................5.74 74 Mexico.................................4.19
6 Korea, Rep...........................5.73 75 Morocco ..............................4.18
7 Portugal ...............................5.67 76 Italy......................................4.14
8 Estonia.................................5.66 77 El Salvador...........................4.11
9 Malta ...................................5.57 78 Zambia.................................4.10
10 Austria .................................5.54 79 Azerbaijan ............................4.09
11 Hong Kong SAR ..................5.54 80 South Africa.........................4.07
12 Bahrain ................................5.52 81 Iran, Islamic Rep..................4.06
13 Chile ....................................5.49 82 Ethiopia................................4.04
14 Iceland .................................5.42 83 Uganda ................................4.03
15 Malaysia ..............................5.37 84 Hungary ...............................4.01
16 Tunisia..................................5.30 85 Mongolia..............................3.98
17 Saudi Arabia.........................5.30 86 Greece.................................3.98
18 Oman...................................5.29 87 Guatemala ...........................3.96
19 Norway ................................5.28 88 Bulgaria................................3.95
20 Canada.................................5.28 89 Malawi .................................3.93
21 Finland .................................5.28 90 Puerto Rico..........................3.91
22 Switzerland ..........................5.25 91 Pakistan ...............................3.90
23 France..................................5.21 92 Tajikistan ..............................3.89
24 Luxembourg ........................5.20 93 Cambodia ............................3.88
25 Denmark..............................5.18 94 Trinidad and Tobago.............3.84
26 New Zealand .......................5.18 95 Nigeria .................................3.84
27 United States.......................5.08 96 Benin ...................................3.83
28 China ...................................5.03 97 Tanzania ...............................3.82
29 Cape Verde ..........................5.02 98 Ecuador ...............................3.81
30 Netherlands .........................5.01 99 Serbia ..................................3.79
31 Australia...............................4.95 100 Mauritania............................3.73 389
32 Germany..............................4.94 101 Croatia .................................3.71
33 Brazil ....................................4.86 102 Latvia ...................................3.70
34 Lithuania ..............................4.84 103 Honduras .............................3.70
35 Israel....................................4.79 104 Russian Federation..............3.70
36 Gambia, The ........................4.78 105 Kuwait .................................3.66
37 Dominican Republic.............4.76 106 Guyana ................................3.66
38 Turkey ..................................4.76 107 Ghana ..................................3.62
39 Slovenia ...............................4.71 108 Moldova...............................3.61
40 Jordan..................................4.71 109 Armenia ...............................3.59
41 India.....................................4.69 110 Namibia ...............................3.58
42 United Kingdom...................4.69 111 Côte d’Ivoire ........................3.56
43 Ireland..................................4.69 112 Ukraine ................................3.56
44 Uruguay ...............................4.66 113 Philippines ...........................3.56
45 Vietnam ...............................4.64 114 Lesotho ...............................3.54
46 Brunei Darussalam ..............4.62 115 Madagascar .........................3.53
47 Colombia .............................4.61 116 Bangladesh..........................3.48
48 Cyprus .................................4.60 117 Angola .................................3.46
49 Sri Lanka..............................4.59 118 Slovak Republic ...................3.46
50 Georgia ................................4.58 119 Poland..................................3.43
51 Senegal................................4.58 120 Cameroon............................3.41
52 Thailand ...............................4.52 121 Algeria .................................3.38
53 Mauritius .............................4.52 122 Paraguay..............................3.33
54 Panama................................4.50 123 Chad ....................................3.33
55 Barbados .............................4.47 124 Romania ..............................3.32
56 Macedonia, FYR ..................4.45 125 Libya ....................................3.32
57 Burkina Faso........................4.45 126 Timor-Leste..........................3.27
58 Spain....................................4.43 127 Syria.....................................3.25
59 Egypt ...................................4.43 128 Burundi ................................3.21
60 Montenegro.........................4.41 129 Nepal ...................................3.21
61 Czech Republic....................4.40 130 Argentina .............................3.20
62 Botswana ............................4.38 131 Bolivia ..................................3.16
63 Kenya...................................4.35 132 Venezuela ............................3.09
64 Mali......................................4.33 133 Nicaragua.............................3.05
65 Costa Rica ...........................4.32 134 Swaziland ............................2.85
66 Jamaica ...............................4.29 135 Bosnia and Herzegovina......2.80
67 Peru .....................................4.29 136 Lebanon...............................2.72
68 Japan ...................................4.28 137 Kyrgyz Republic ...................2.62
69 Belgium ...............................4.27 138 Zimbabwe............................2.59
SOURCE: World Economic Forum, Executive Opinion Survey 2009, 2010
The Global Information Technology Report 2010–2011 © 2011 World Economic Forum](https://image.slidesharecdn.com/wef-gitr-2010-2011-110427122231-phpapp01/85/Wef-gitr-2010-2011-411-320.jpg)