Downloaded 123 times


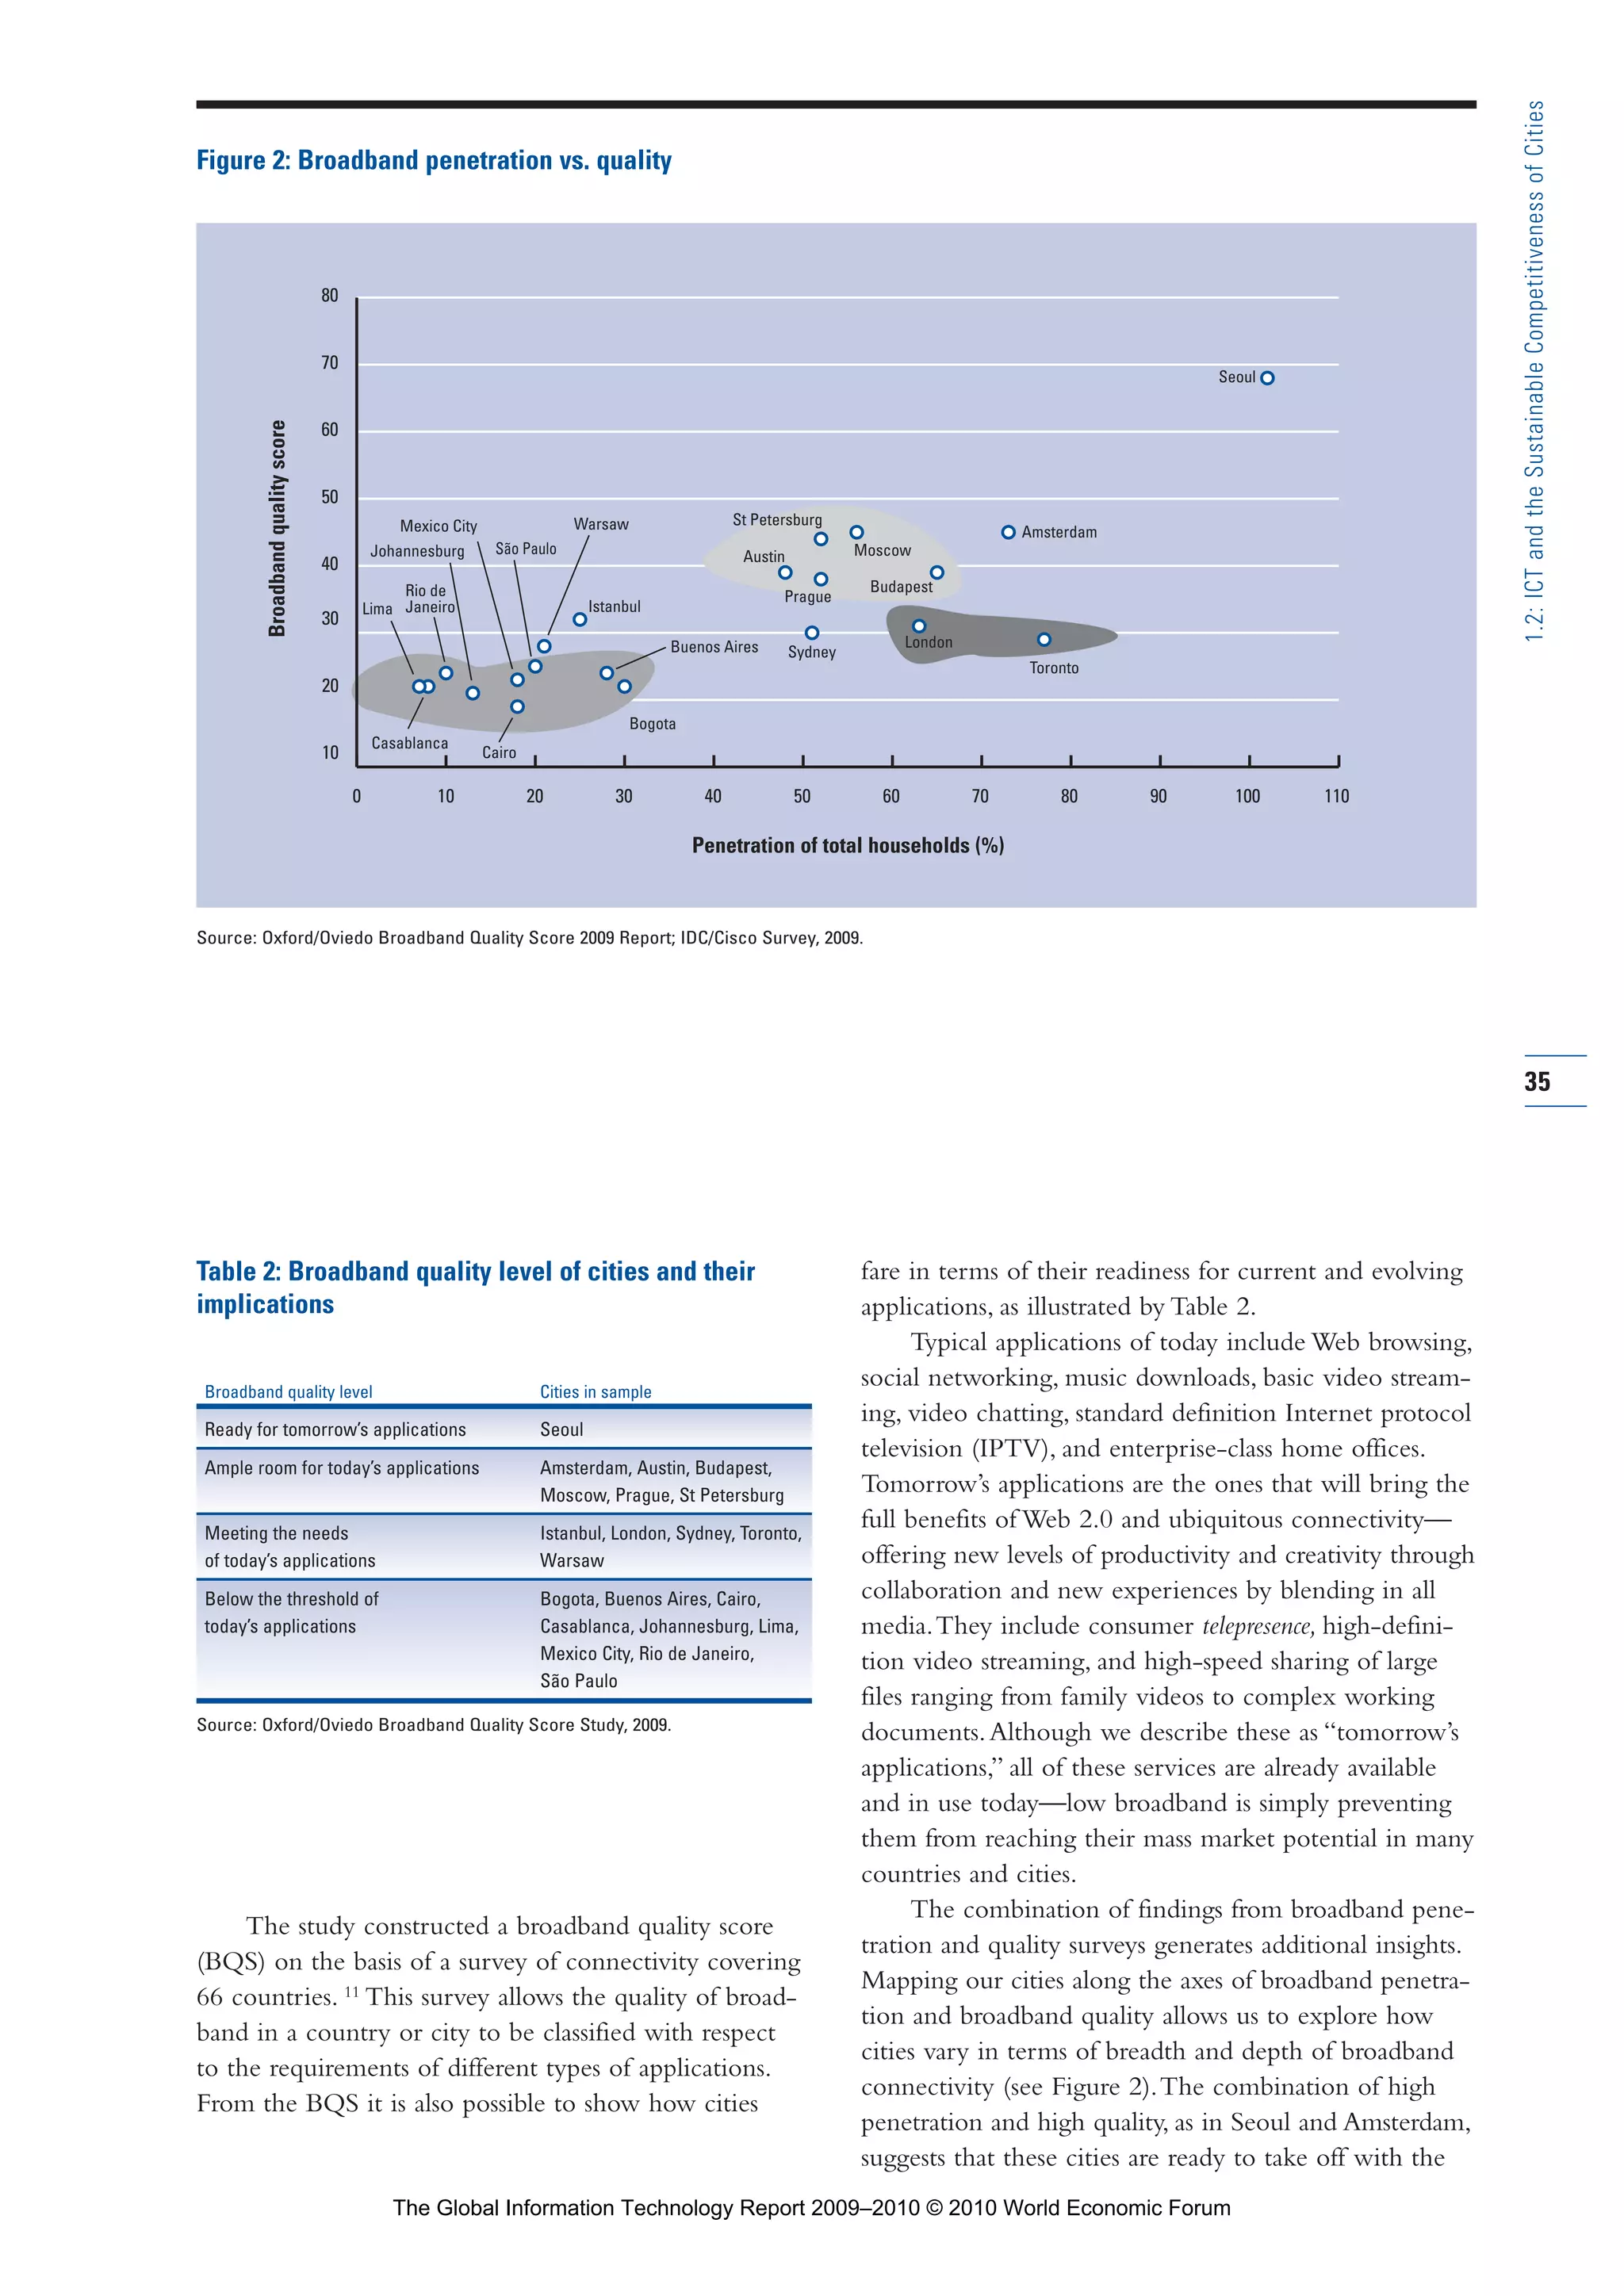
![benefits of Web 2.0 (as long as they can maintain the
quality as penetration keeps expanding). One of the
factors behind high penetration and quality appears to
be the structure of the market—the degree of diversity
in technology platforms (asymmetric digital subscriber
line [ADSL], cable, etc.) in particular.The countries and
cities with highest penetration and best quality of
broadband tend to have more diverse market structures.
High penetration and low-to-medium quality is not
an uncommon combination, and it generally indicates
rapid broadband deployment using existing copper infra-
structure that is now stretching the limits of network
capacity (as appears to be the case of London and
Toronto, for instance). High quality and low penetration
is a rare combination that can reflect small city “niches”
and is not present in our sample. Finally, low penetration
and quality—which affects a number of cities in our
sample—indicates the signi-ficant challenge in taking
advantage of the opportunity of broadband connectivity.
An interesting leapfrogging phenomenon is reflected in
cities such as Budapest, Moscow, Prague, and St
Petersburg, where limited legacy networks paradoxically
created the impetus for investing in network technology
that allows for better broadband quality.
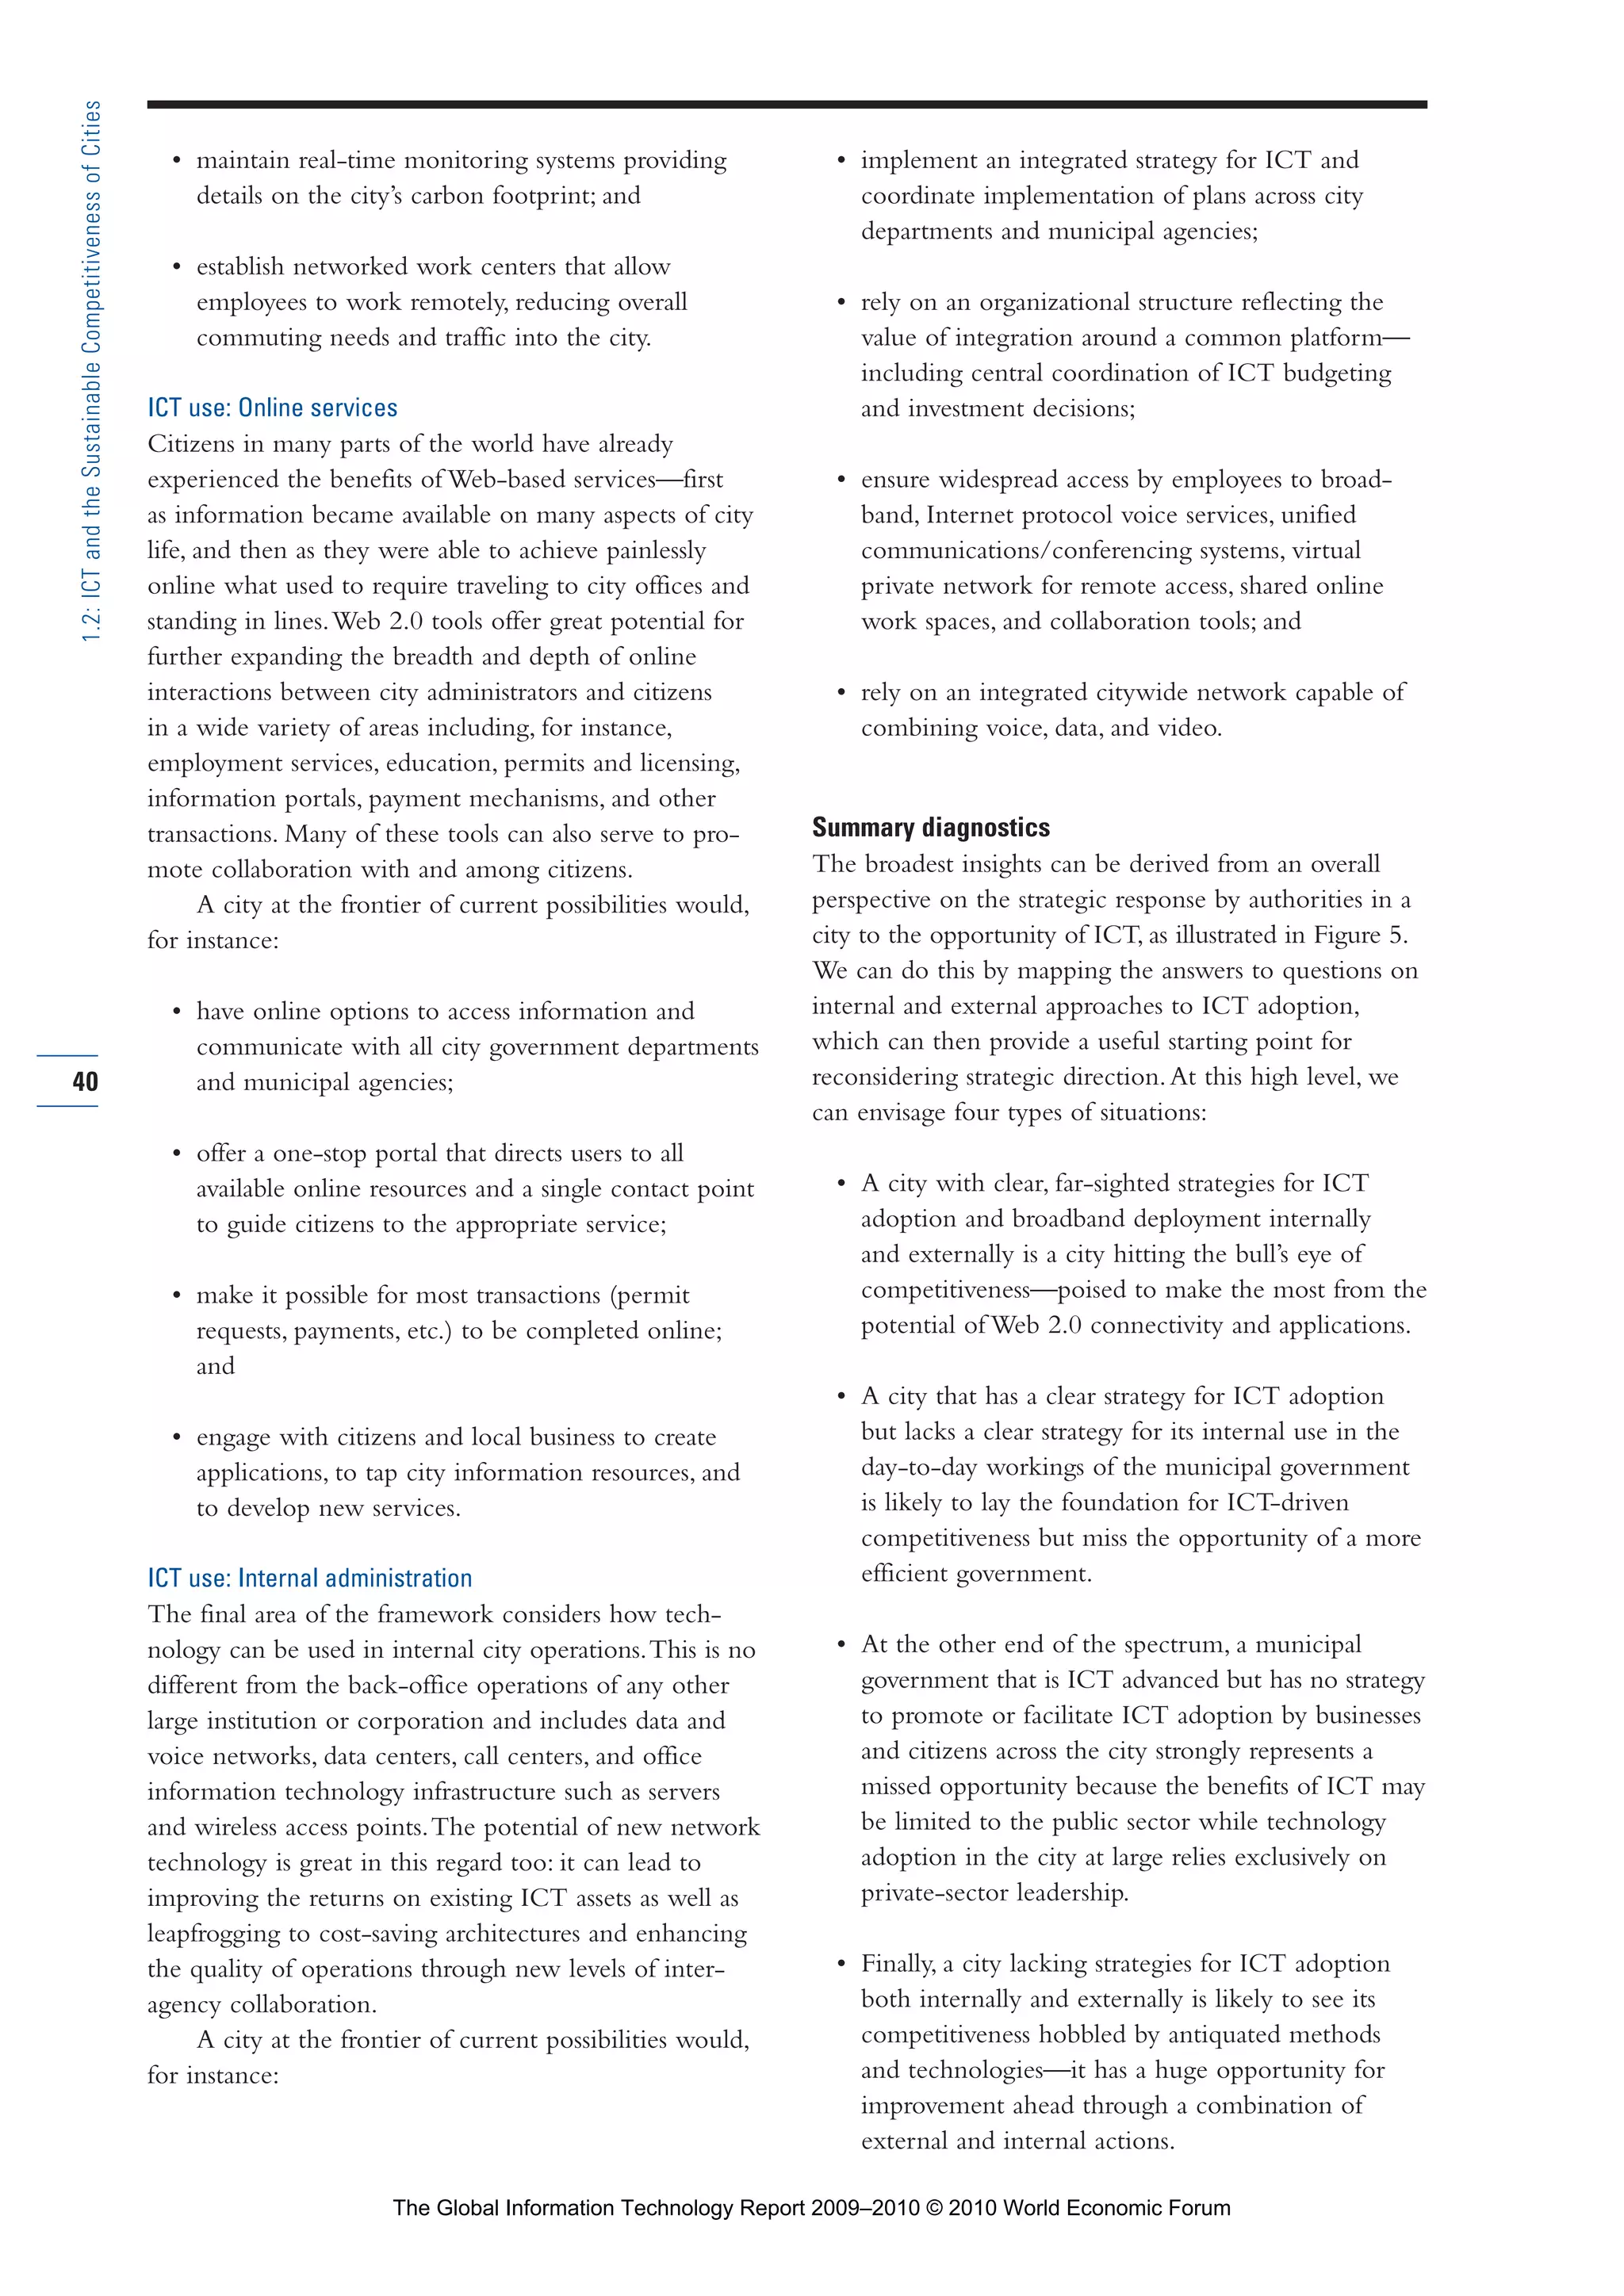
ICT environment and use
As we noted above, the global city phenomenon raises the
competitiveness stakes.What does it take to make a city
competitive in the global arena? What can city leaders
(be they in government, business, or civil society organi-
zations) do to improve their city’s competitiveness—and
sustain it? We believe that a large part of the answer has
to do with ICT—and, more specifically, with networks.
The purpose of the assessment exercise underway is
to provide an overview of the ways in which municipal
governments influence the ICT environment in their
cities and to explore in detail how they use ICT in city
operations.The assessment uses the framework developed
for the purpose by Cisco (and a survey instrument
designed with help from Illuminas Global PLC).
This framework was specifically designed to explore
the environment and use of ICT in cities and to provide
a diagnostic perspective in enough detail that it can guide
the formulation of action plans.The first stage of the
assessment has already allowed us to establish best prac-
tice boundaries. In the second stage, individual cities can
be benchmarked against both the frontier of possibilities
and existing best practice so that avenues for progress—
or opportunity gaps—can be identified.
Cities, of course, operate under an umbrella of
national policies, regulations, infrastructures, and capabil-
ities.A chapter in The Global InformationTechnology Report
(GITR) 2007–2008 explored the importance of the bal-
ance between the “ecosystem” (policies and regulations
affecting ICT directly, as well as the business and inno-
vation environments) and investments in infrastructure
and capabilities.A chapter in The GITR 2008–2009
then proposed an approach for developing national
net strategies, many aspects of which are also relevant for
cities.12
The complementary framework we propose here
is specifically focused on cities.
Before going into the specifics of the ICT environ-
ment and use framework, it is worth stepping back and
thinking about how competitiveness and ICT relate to
three major goals that most city leaders have in mind:
• Economic growth and job creation. This
is one of the main aims of competitiveness
improvements—which attract investment and
generate a virtuous circle that takes advantage of
the potential agglomeration economies. Basic
infrastructure is a key competitiveness factor.As
broadband becomes the basic infrastructure factor
for the knowledge economy (with a significant
impact on total factor productivity), it also moves to
the center of the competitiveness strategies of cities.
• Social welfare. As information about city condi-
tions flows, and as people across the world become
more mobile, the performance of a city in terms of
services offered to its citizens is a major determinant
of whether the city is seen as an attractive place to
live and work—hence able to draw and retain tal-
ented people, which is another major competitive-
ness factor. ICT can be used to achieve dramatic
improvements in efficiency and effectiveness in the
provision of services, as well as to reduce the trans-
action costs in the city-citizen relationship—at both
the economic and political levels.
• Environmental sustainability. Increasingly a con-
cern for citizens and businesses, the choices made by
a city and their impact on the environment are also
becoming a crucial factor of long-term competitive-
ness. ICT offerings are more and more able to address
environmental sustainability concerns in ways that can
also be aligned with social and economic goals.This
win-win approach is the focus of efforts in many
cities across the world. Pilot programs and informa-
tion sharing, among other things, are being promoted
by a collaborative effort among the Massachusetts
Institute of Technology (MIT), Cisco, and global
cities that focuses on the use of ICT to launch a new
wave of innovation in urban development affecting
the flow of people, knowledge, traffic, and energy.13
Conventional discussions of competitiveness have
focused mostly on factors in the economic and social
spheres, but increasingly factors from the “green” sphere
are taking center stage and should now be considered an
integral part of sustainable competitiveness.
Because city governments and other local authori-
ties in metropolitan areas are increasingly expected to
36
1.2:ICTandtheSustainableCompetitivenessofCities
Part 1.r2 3/2/10 4:40 AM Page 36
The Global Information Technology Report 2009–2010 © 2010 World Economic Forum](https://image.slidesharecdn.com/cusersdesktop2010gitr2009-2010fullreportfinal-100402152331-phpapp01/75/The-Global-Information-Technology-Report-2009-2010-56-2048.jpg)

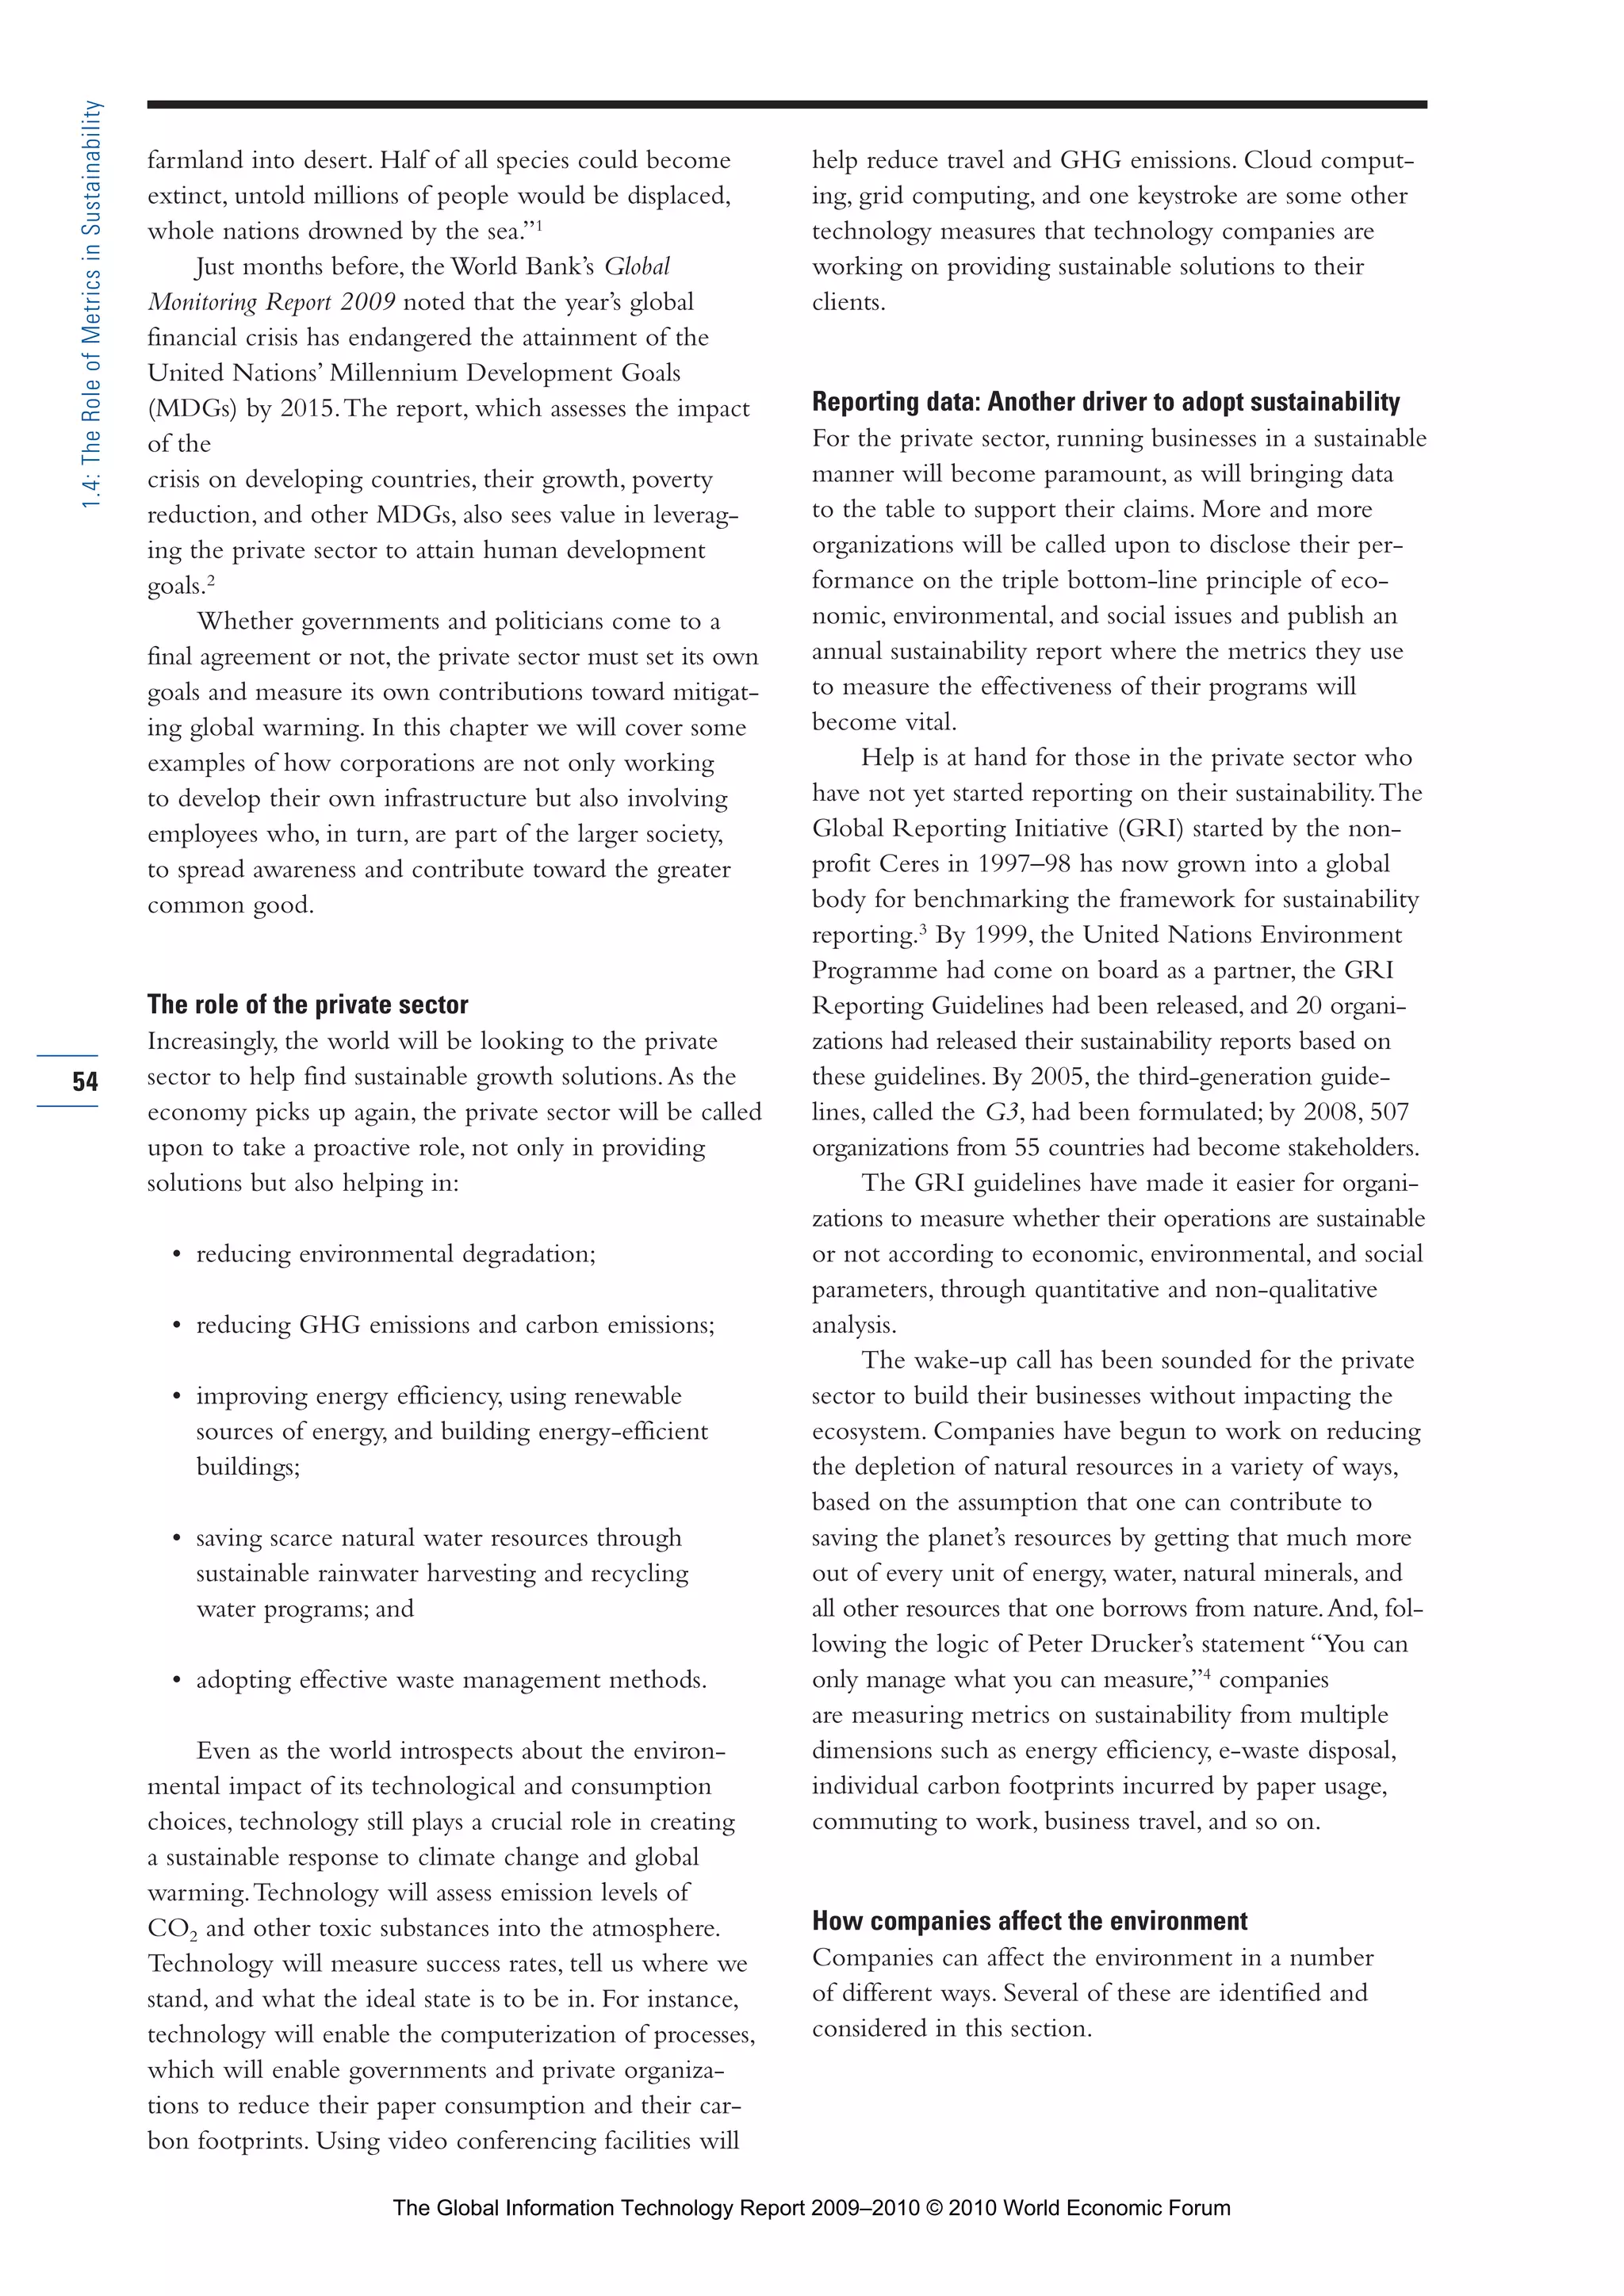
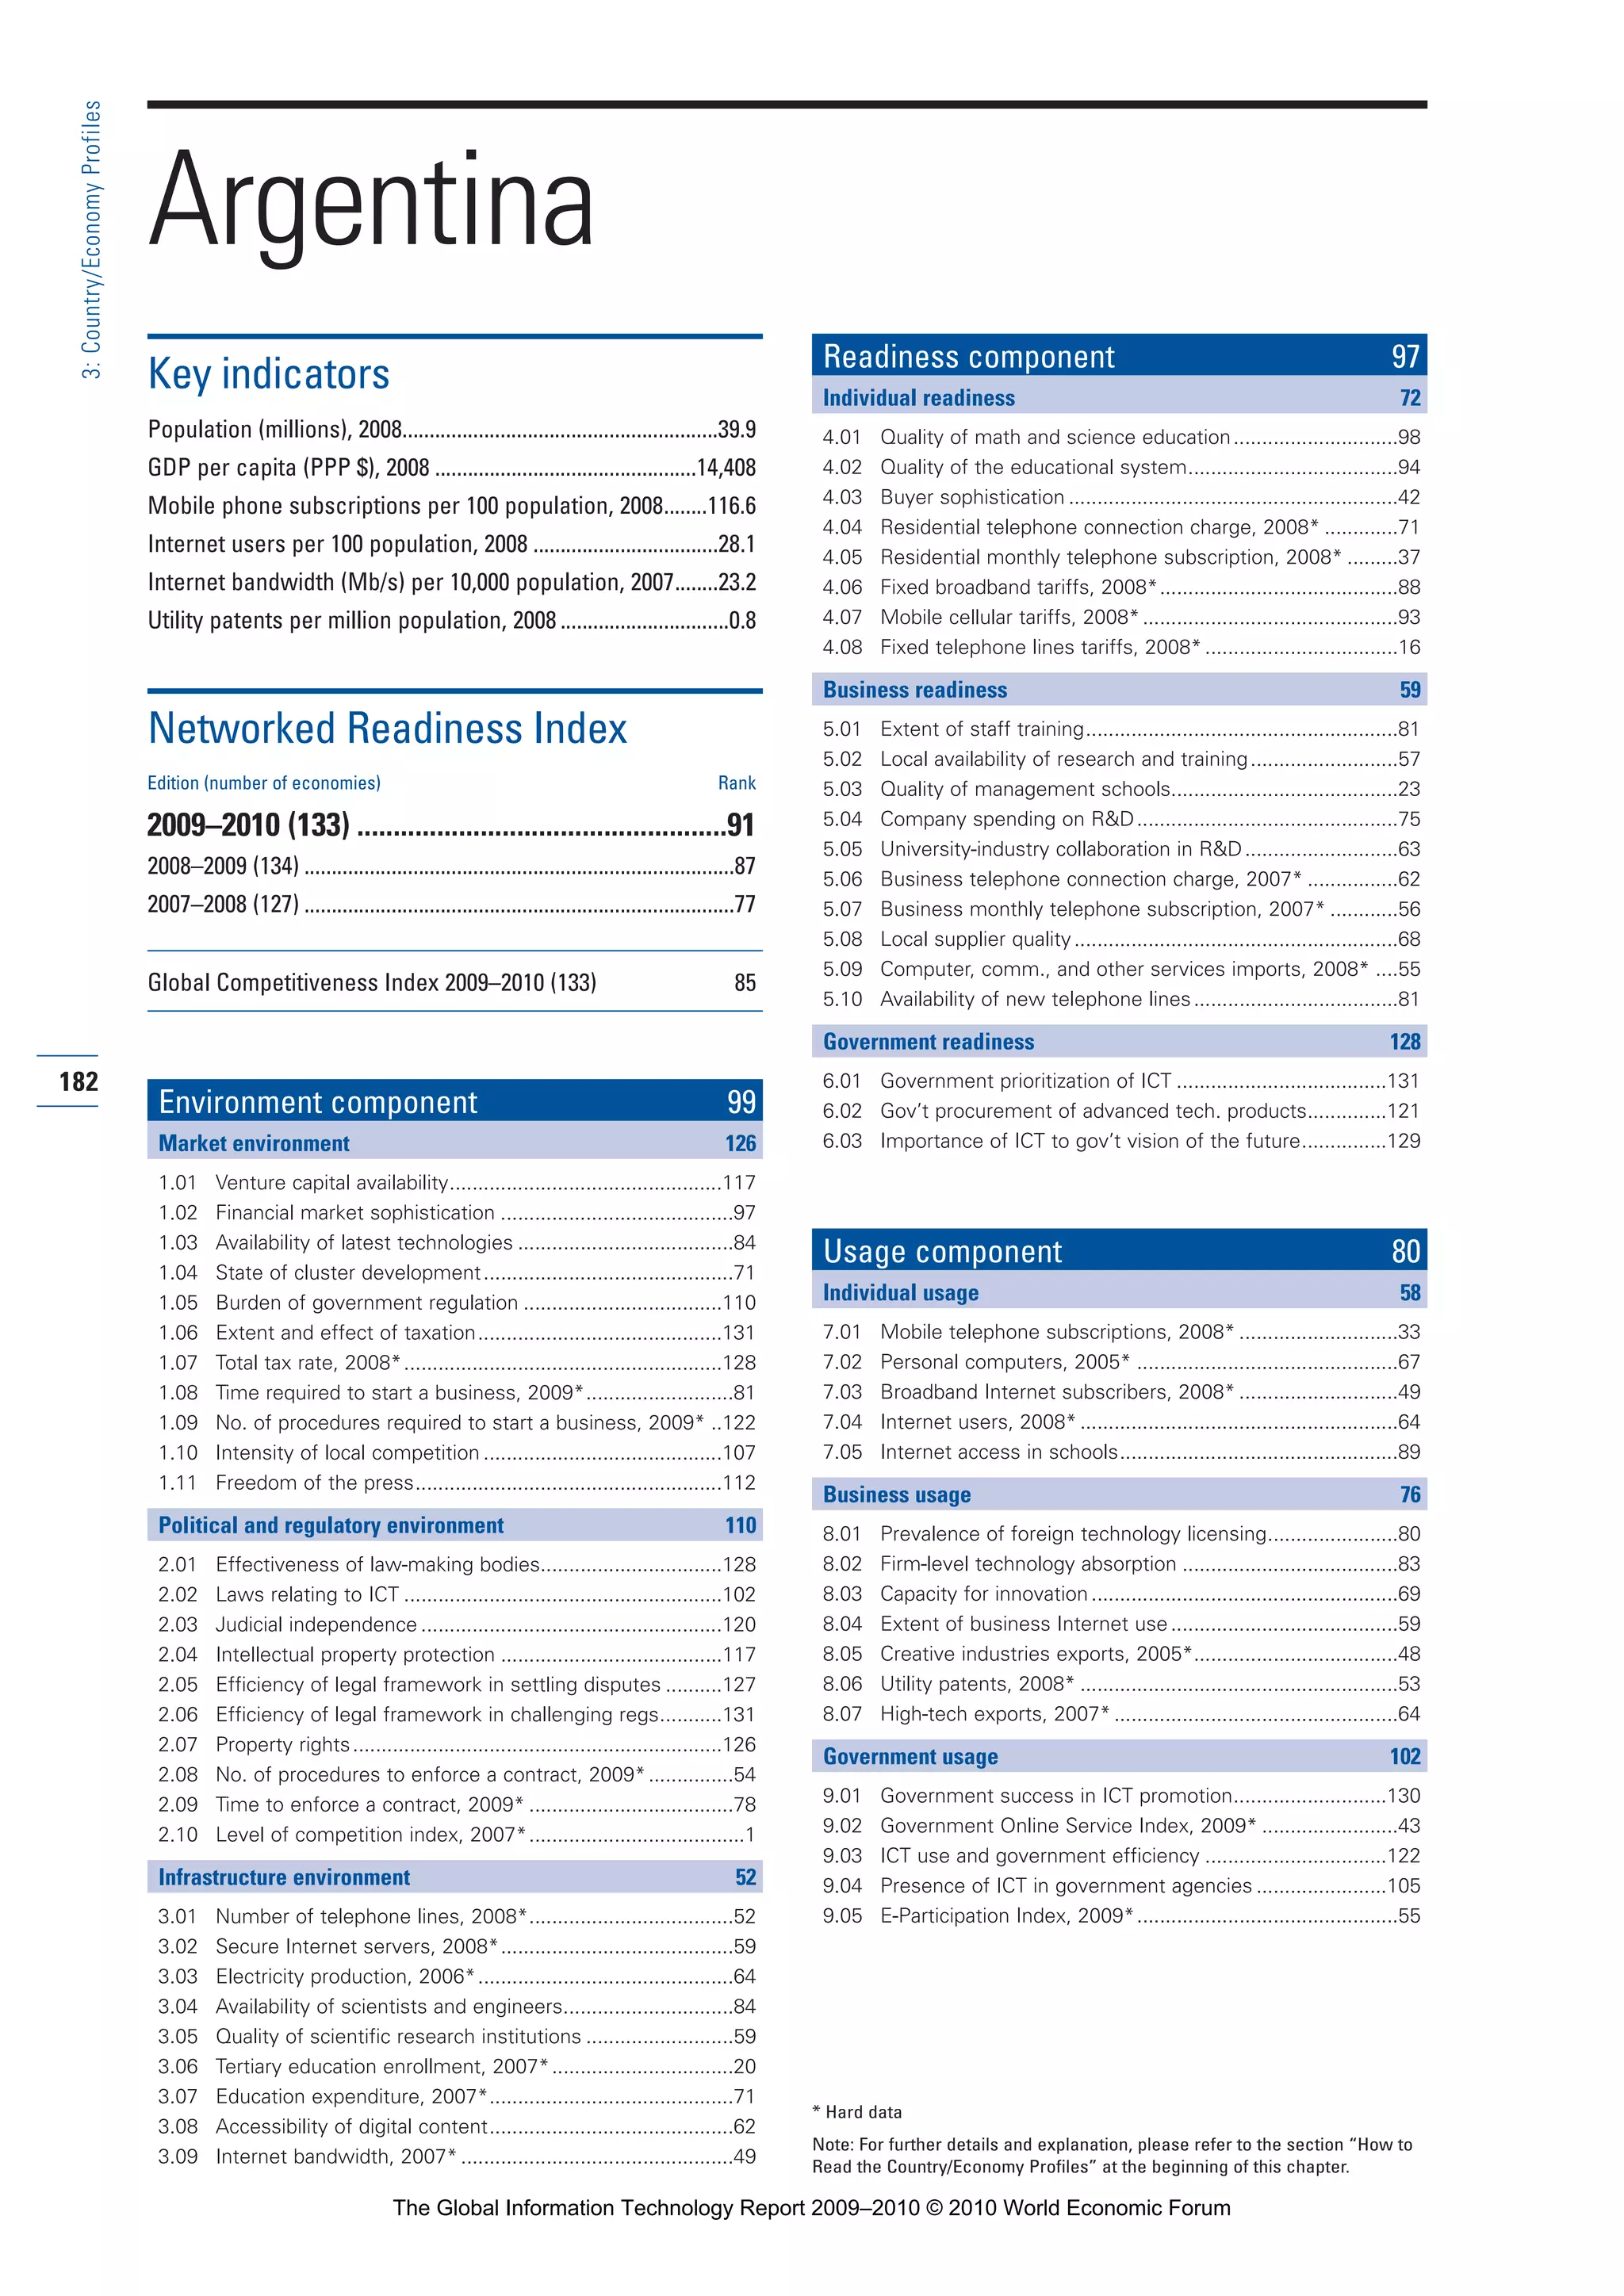
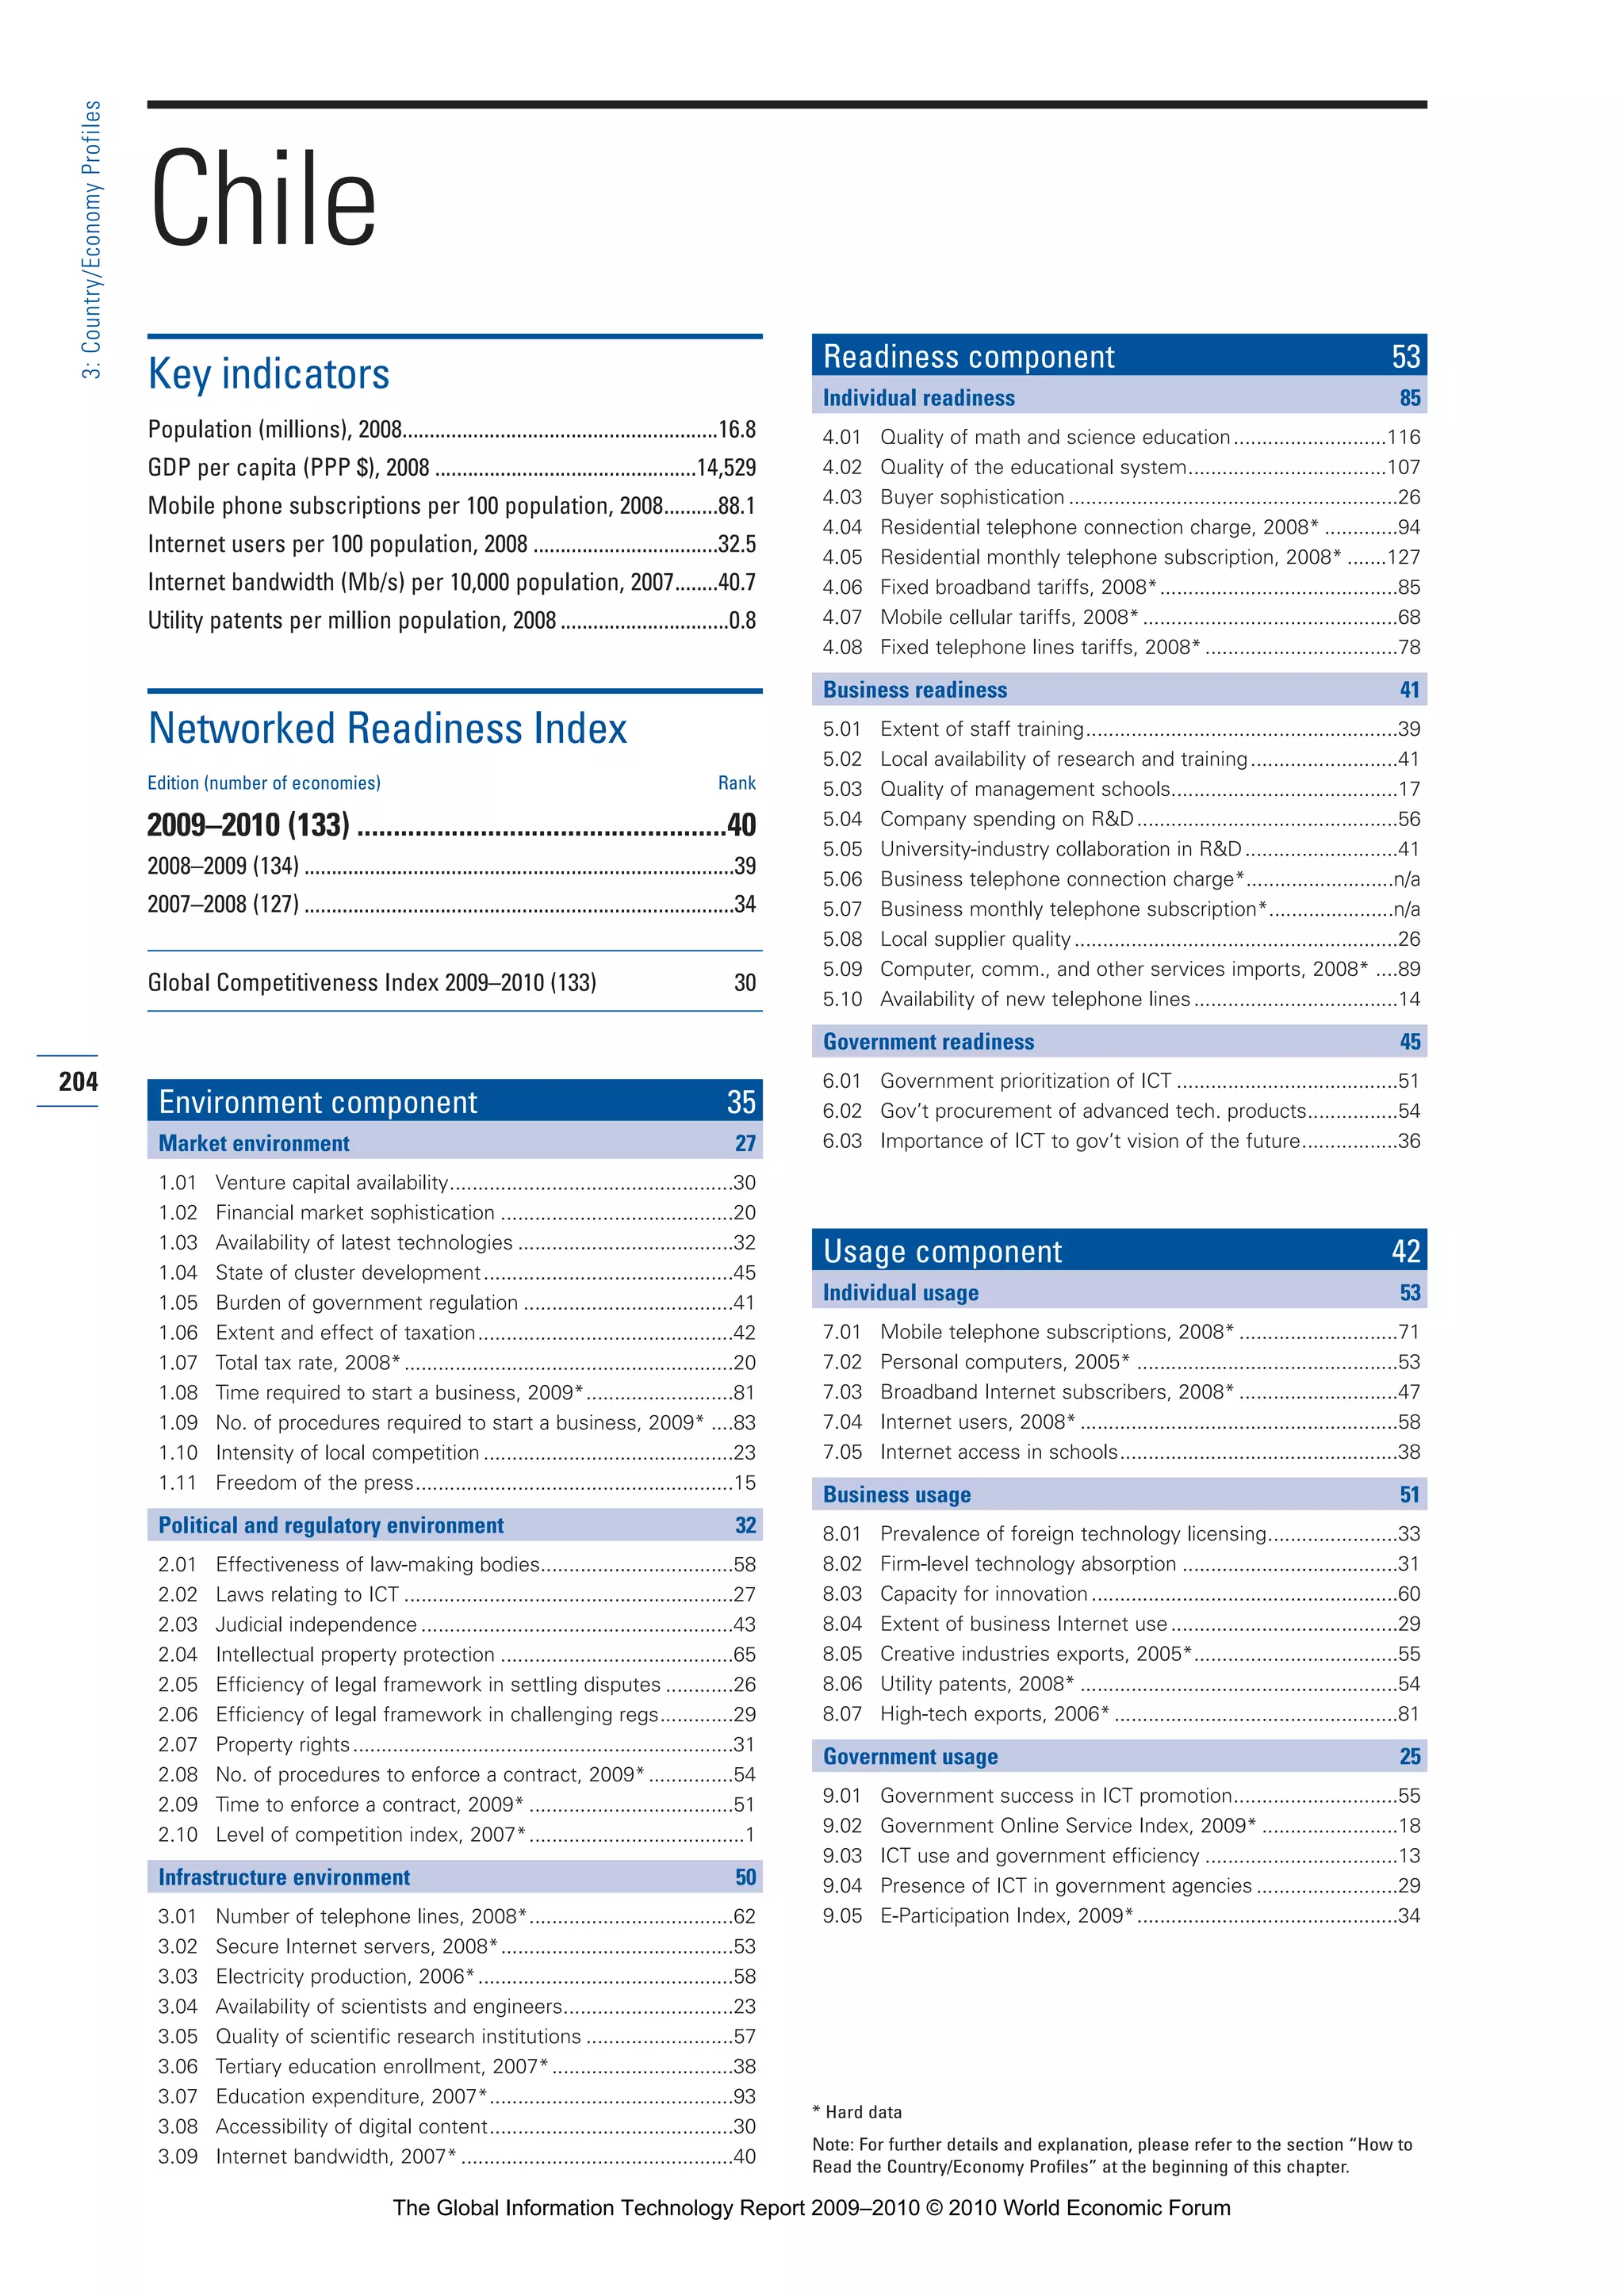
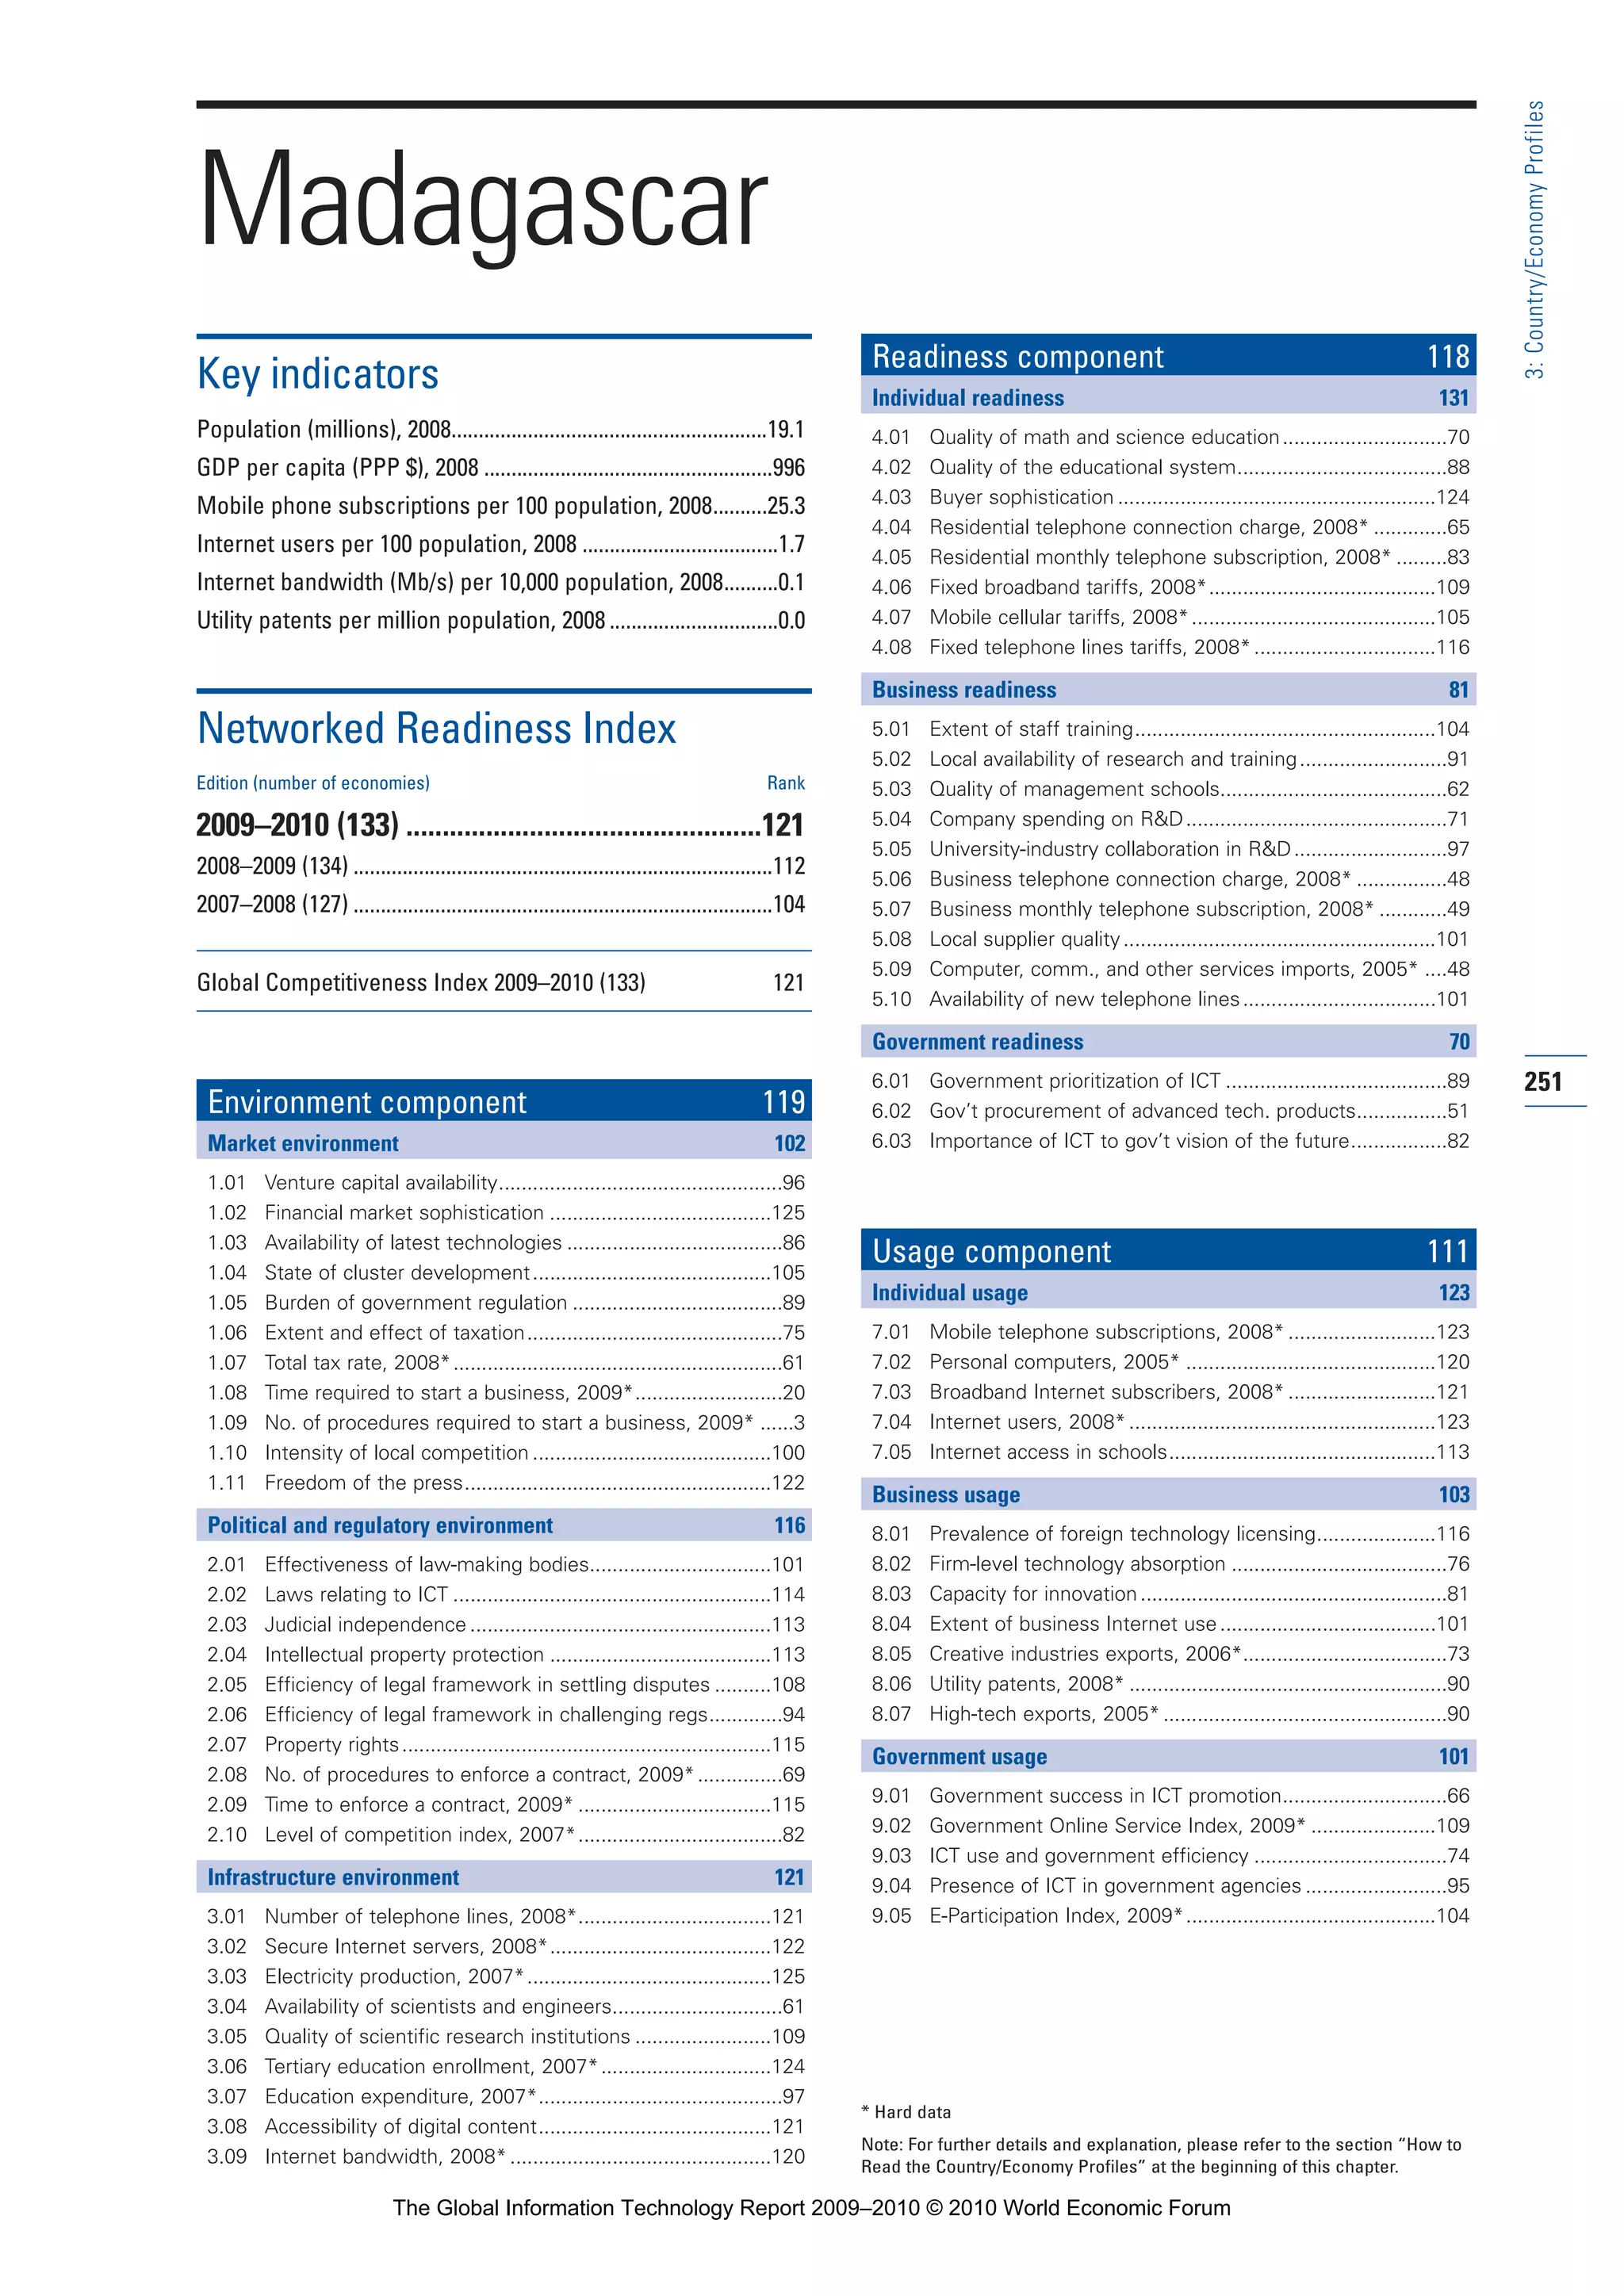
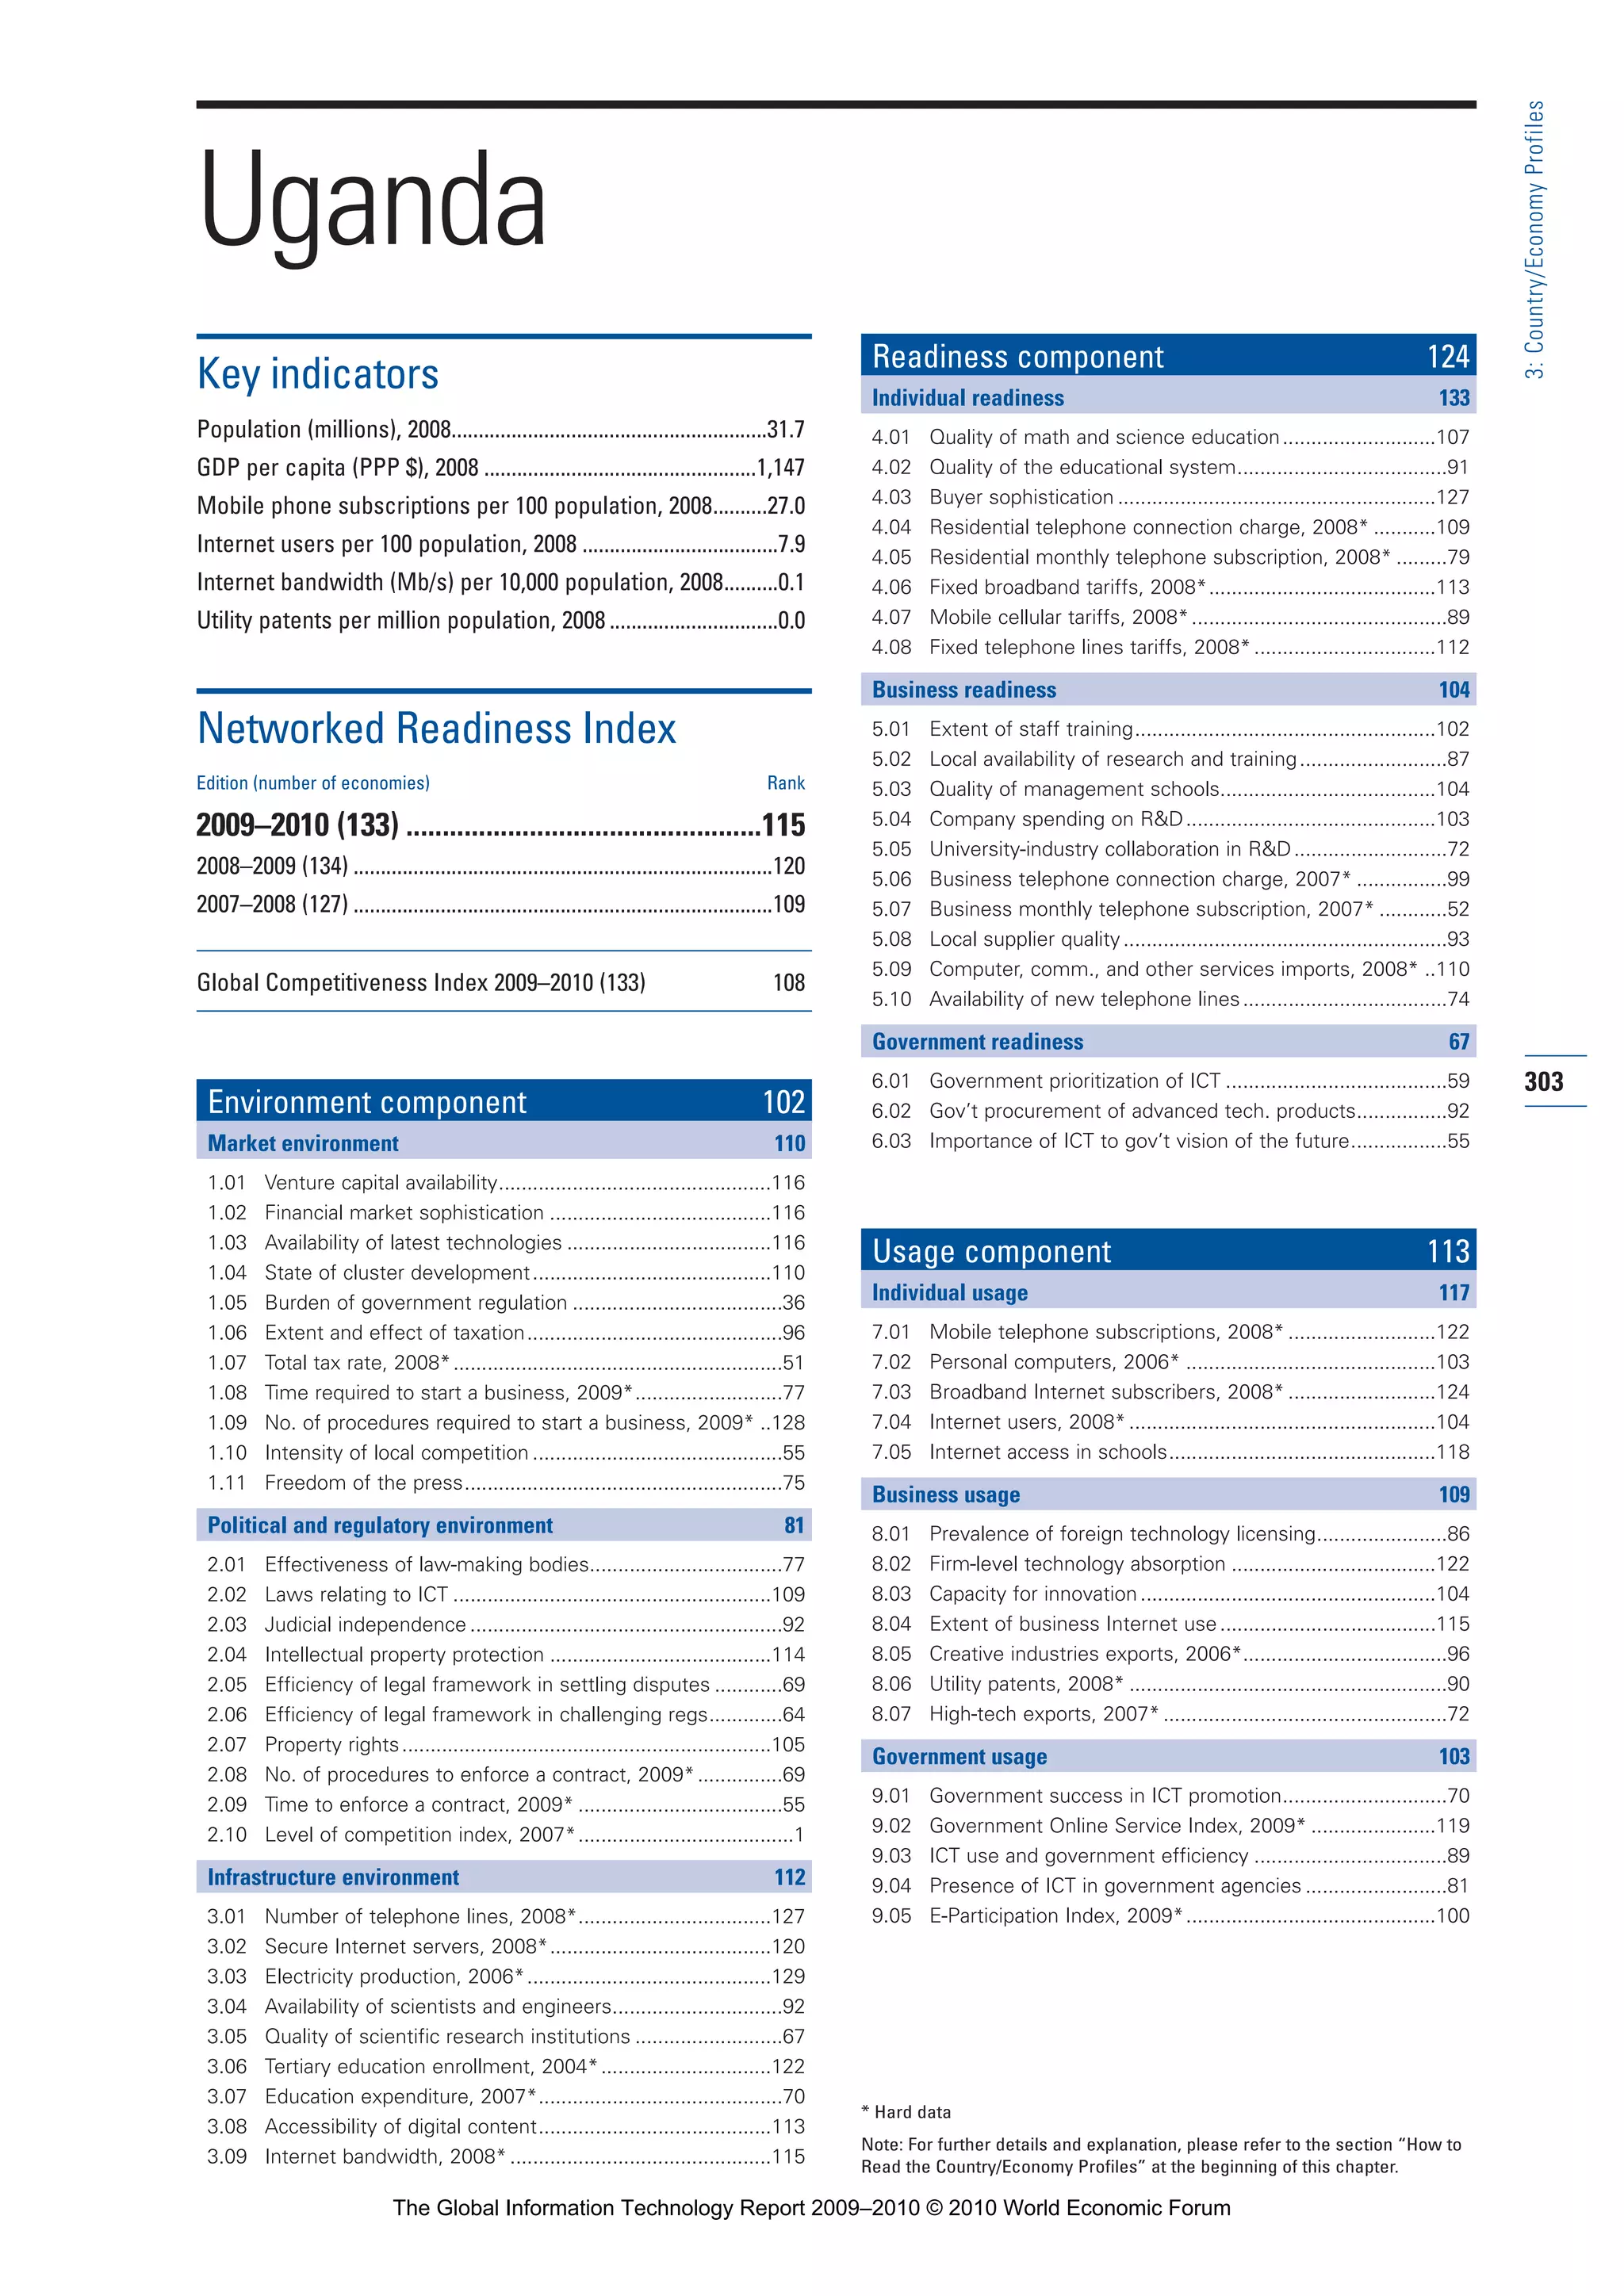
![Building total
Building envelope
(wall, roof, window)
Heating, ventilation,
and air conditioning
Lighting
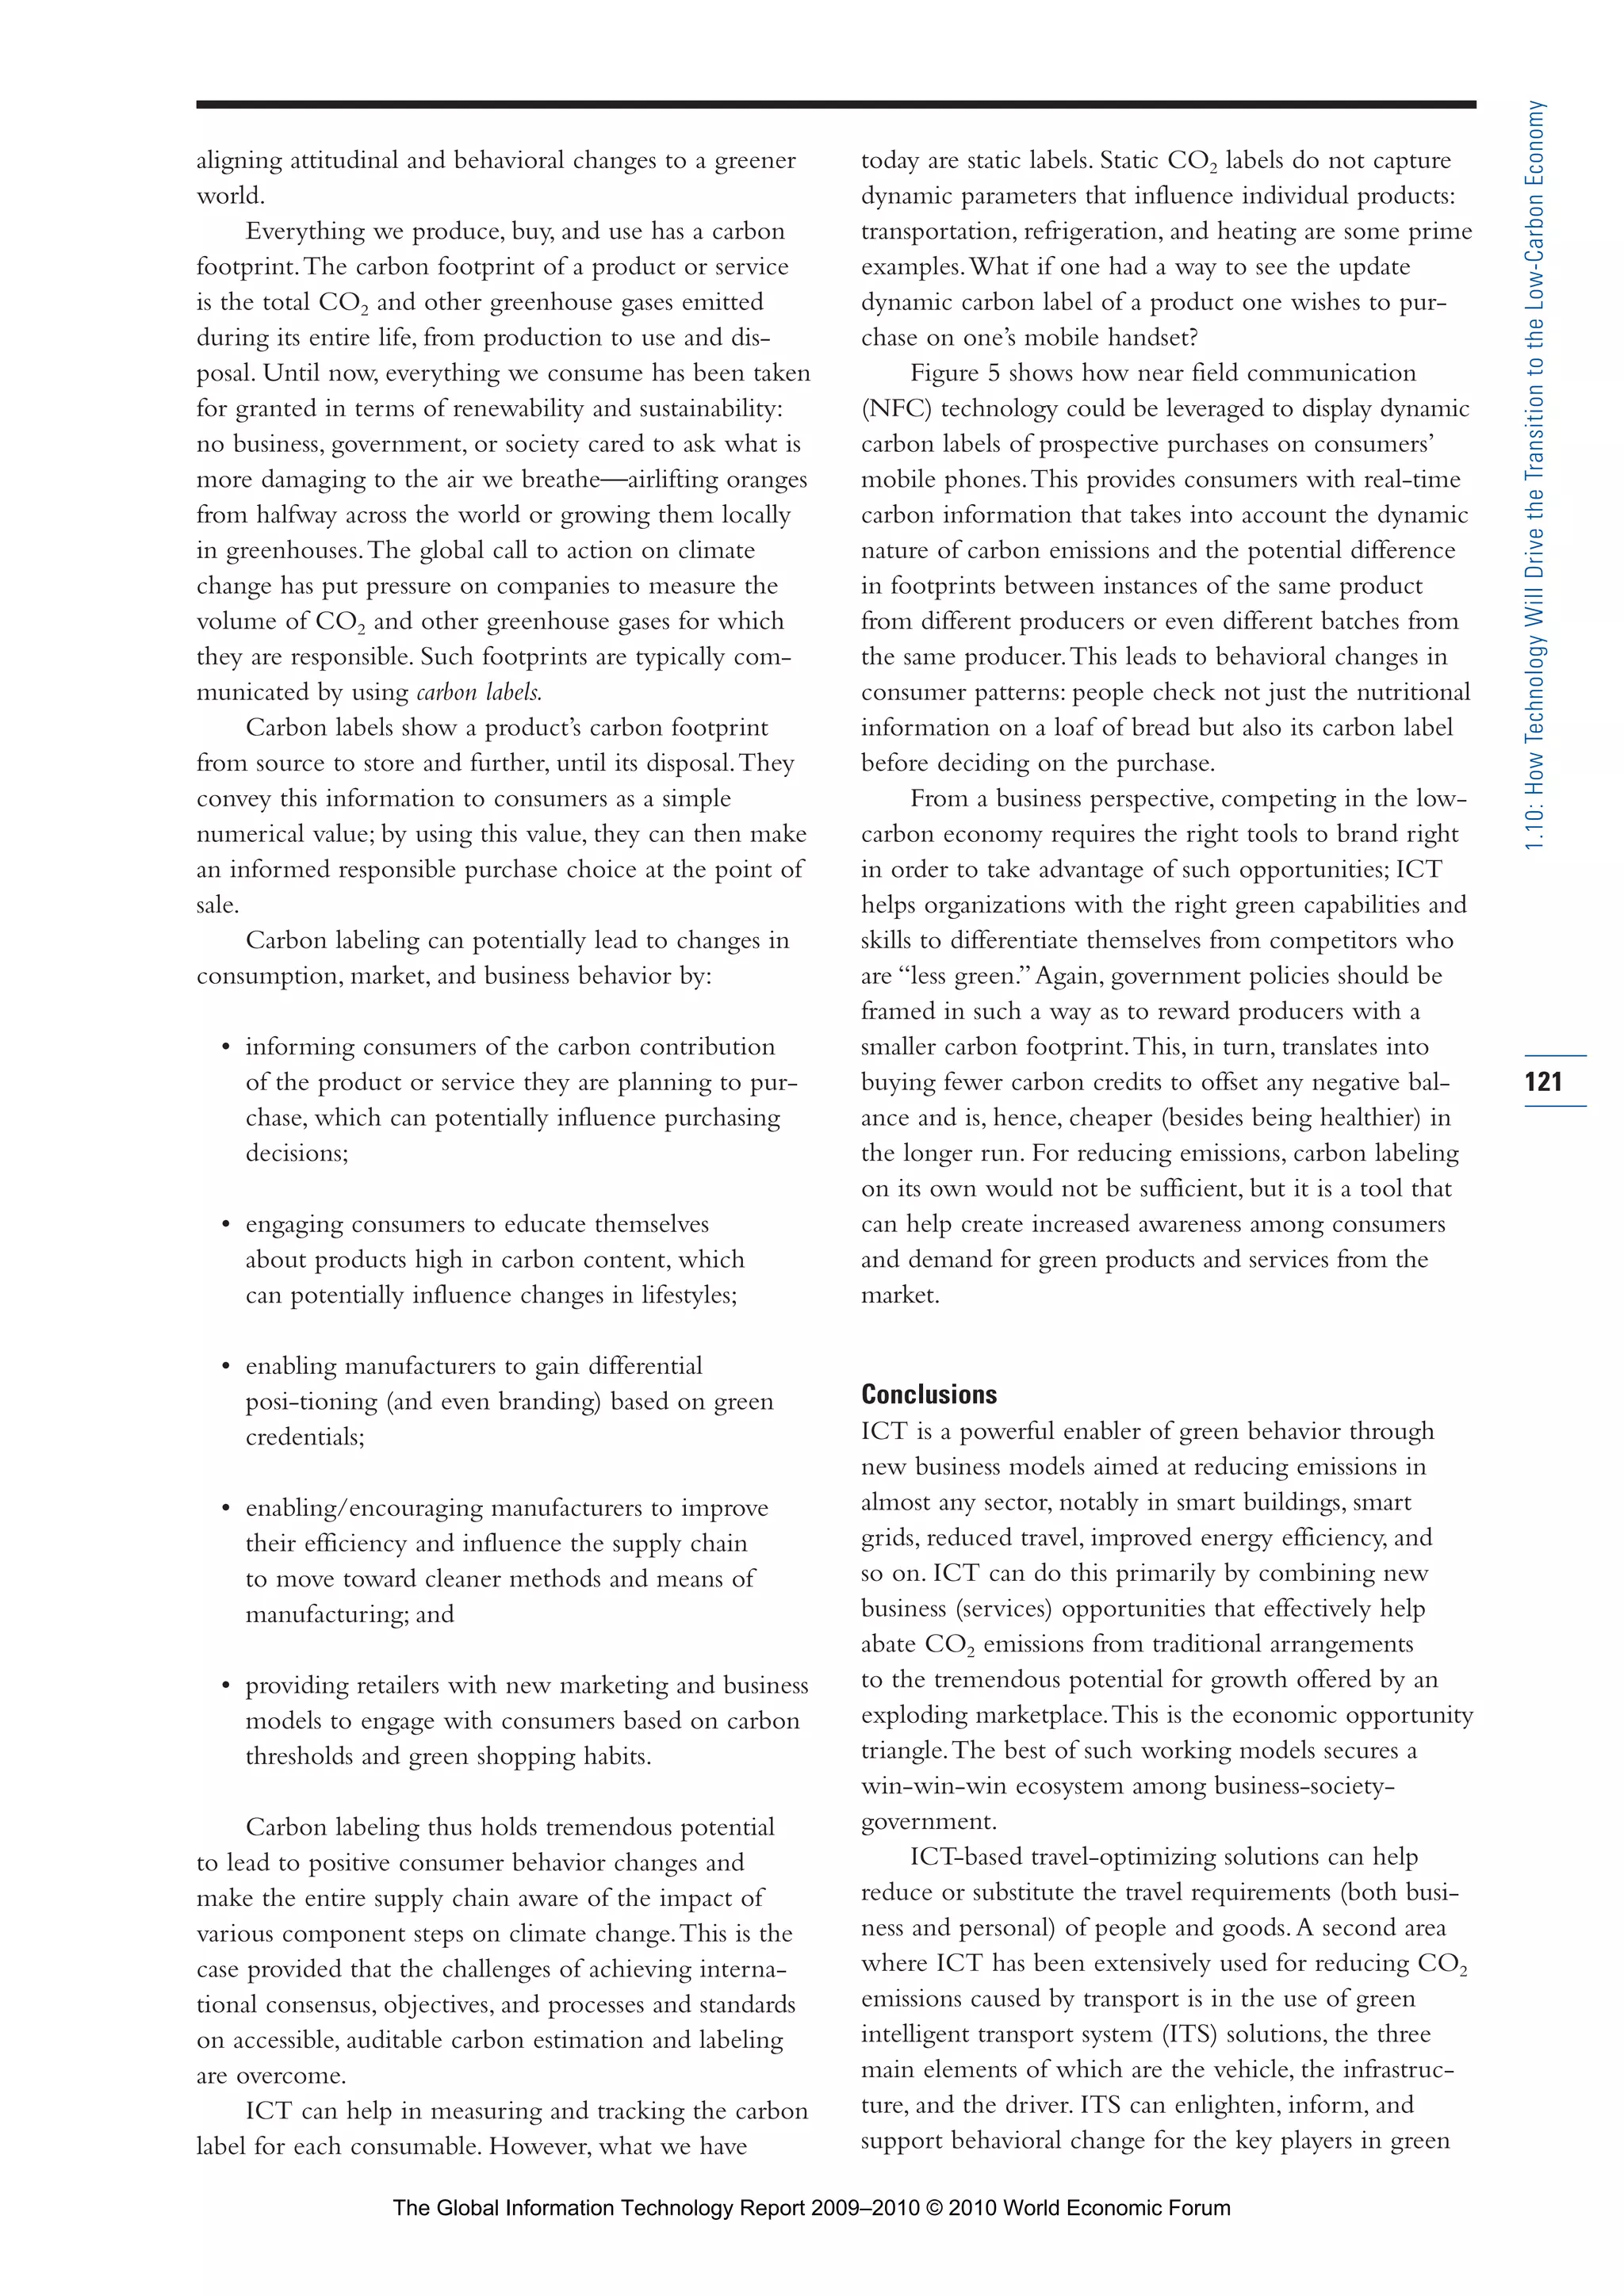
Recently, conscious efforts have been made in the
private sector to measure data accurately at a more
granular level.This exercise has provided deep insights
into areas where further improvements can be made in
the efficiency of current operations.
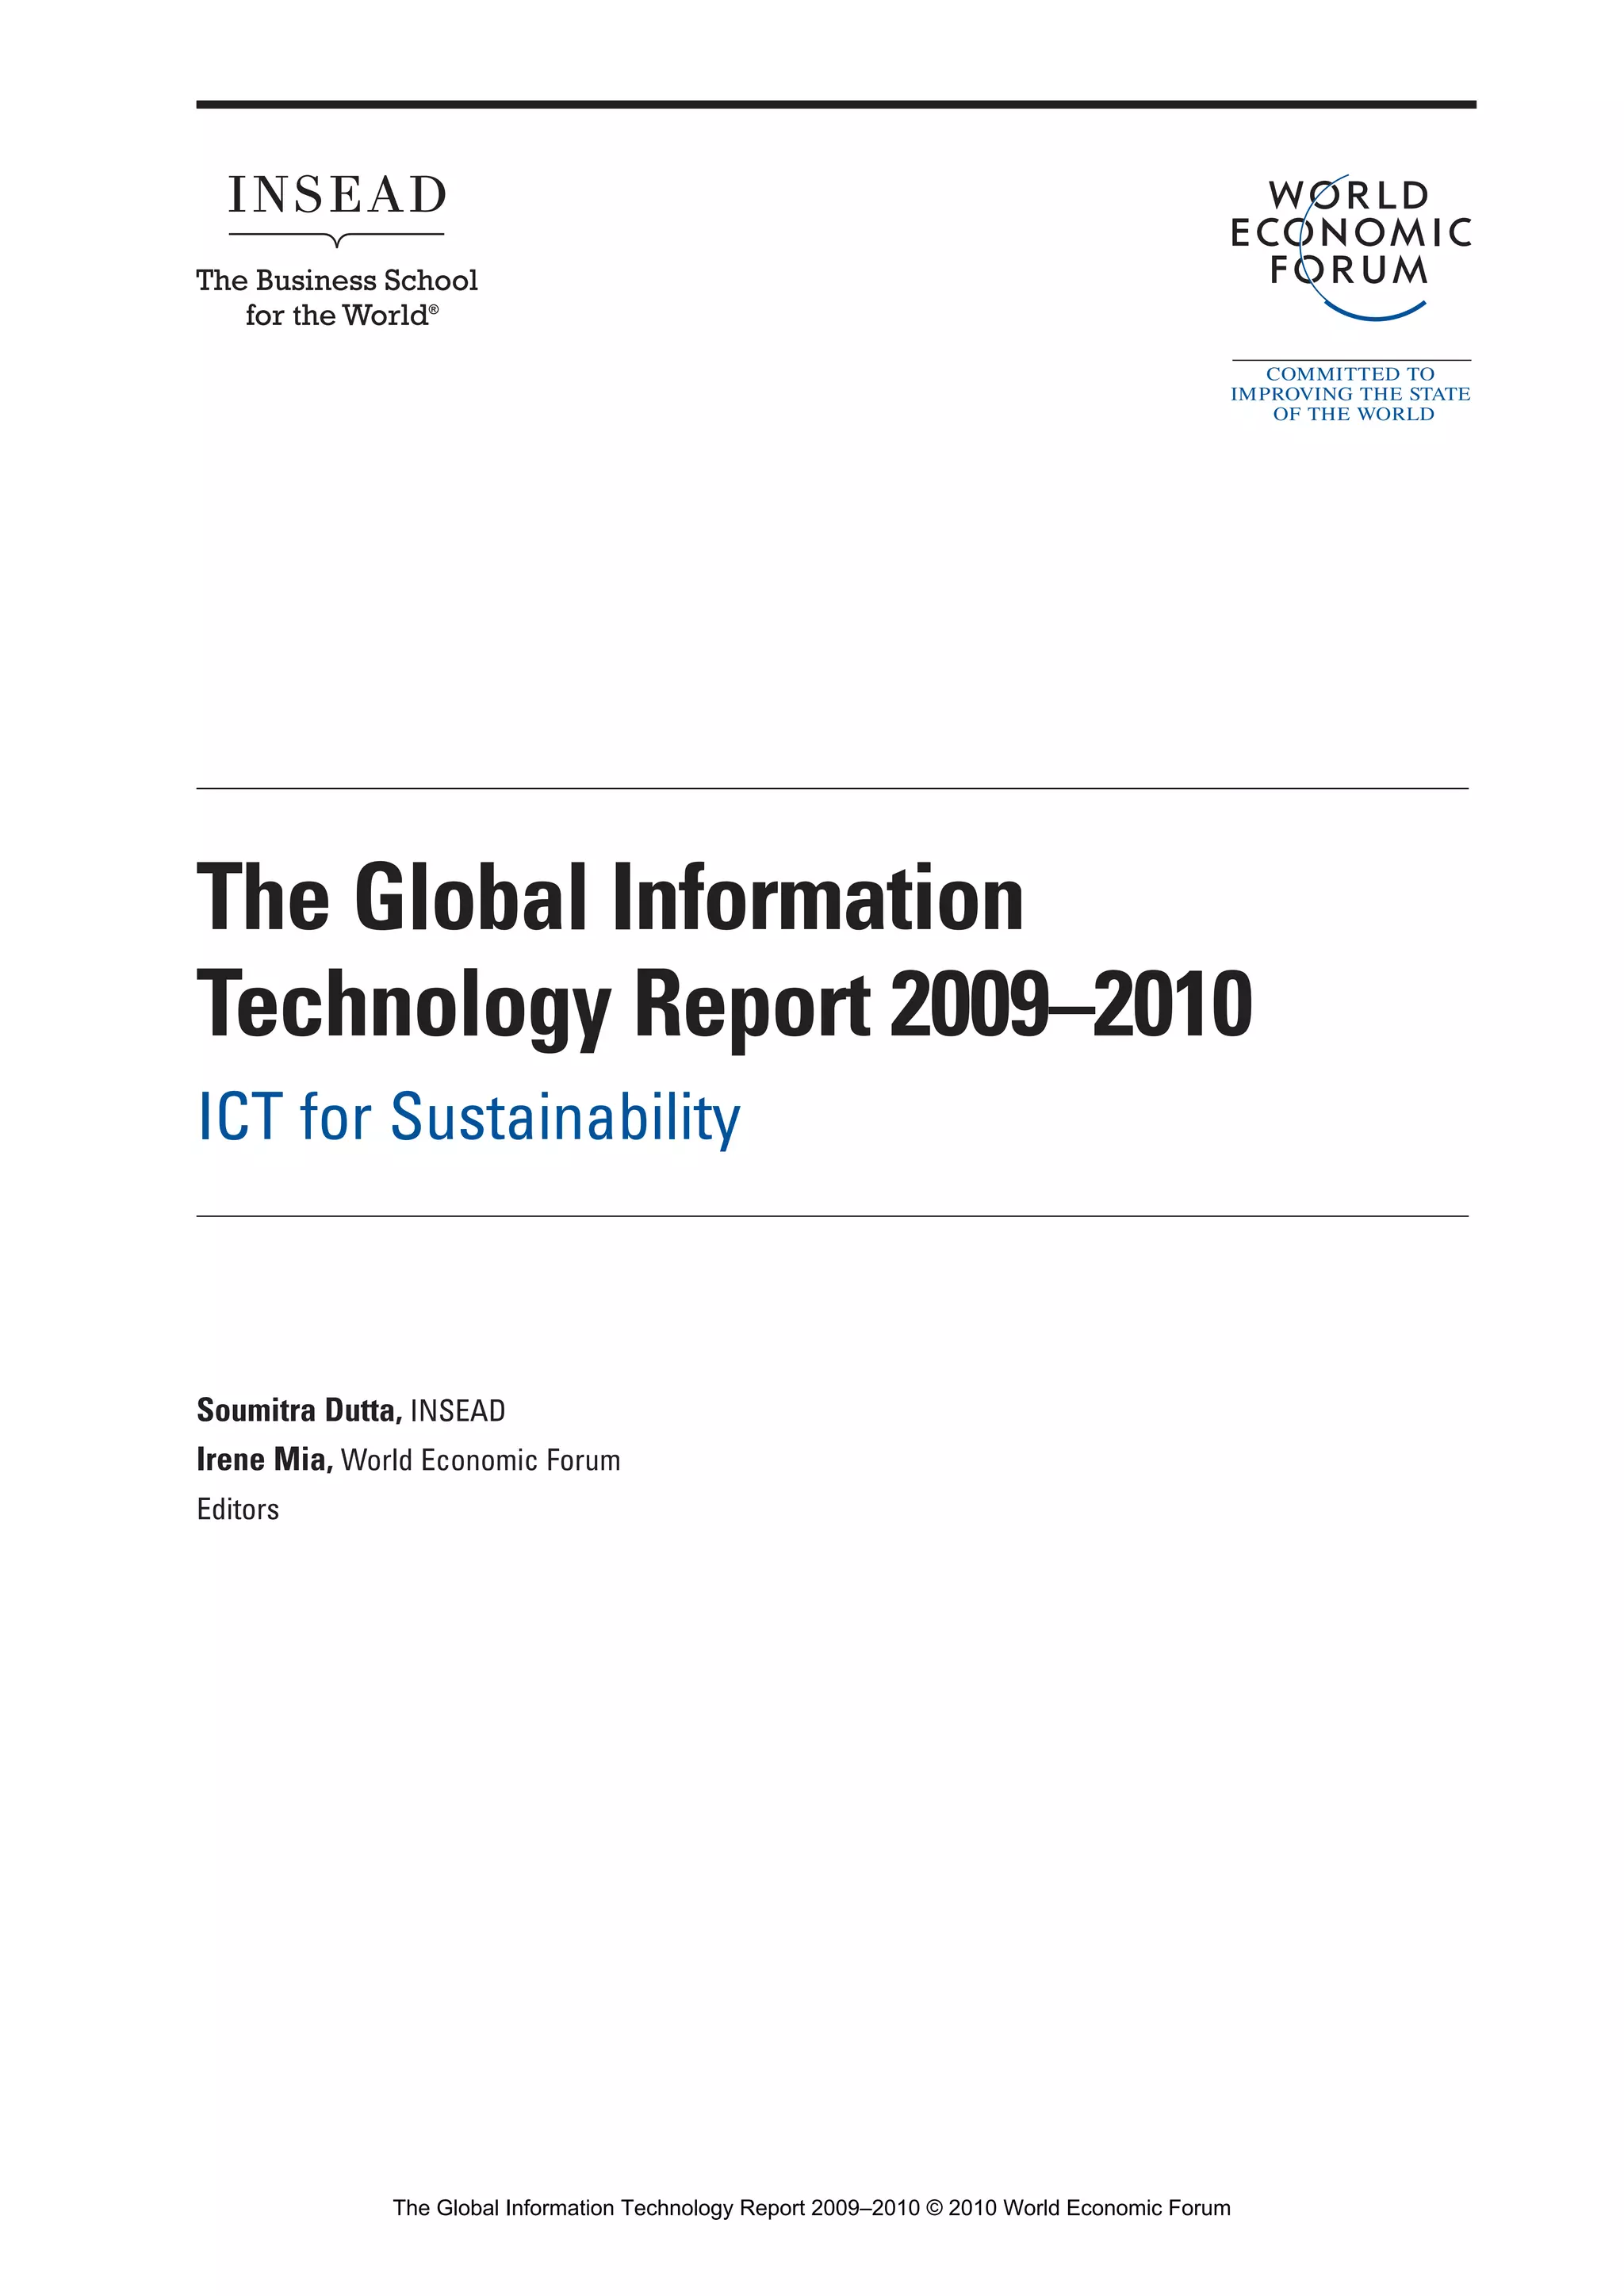
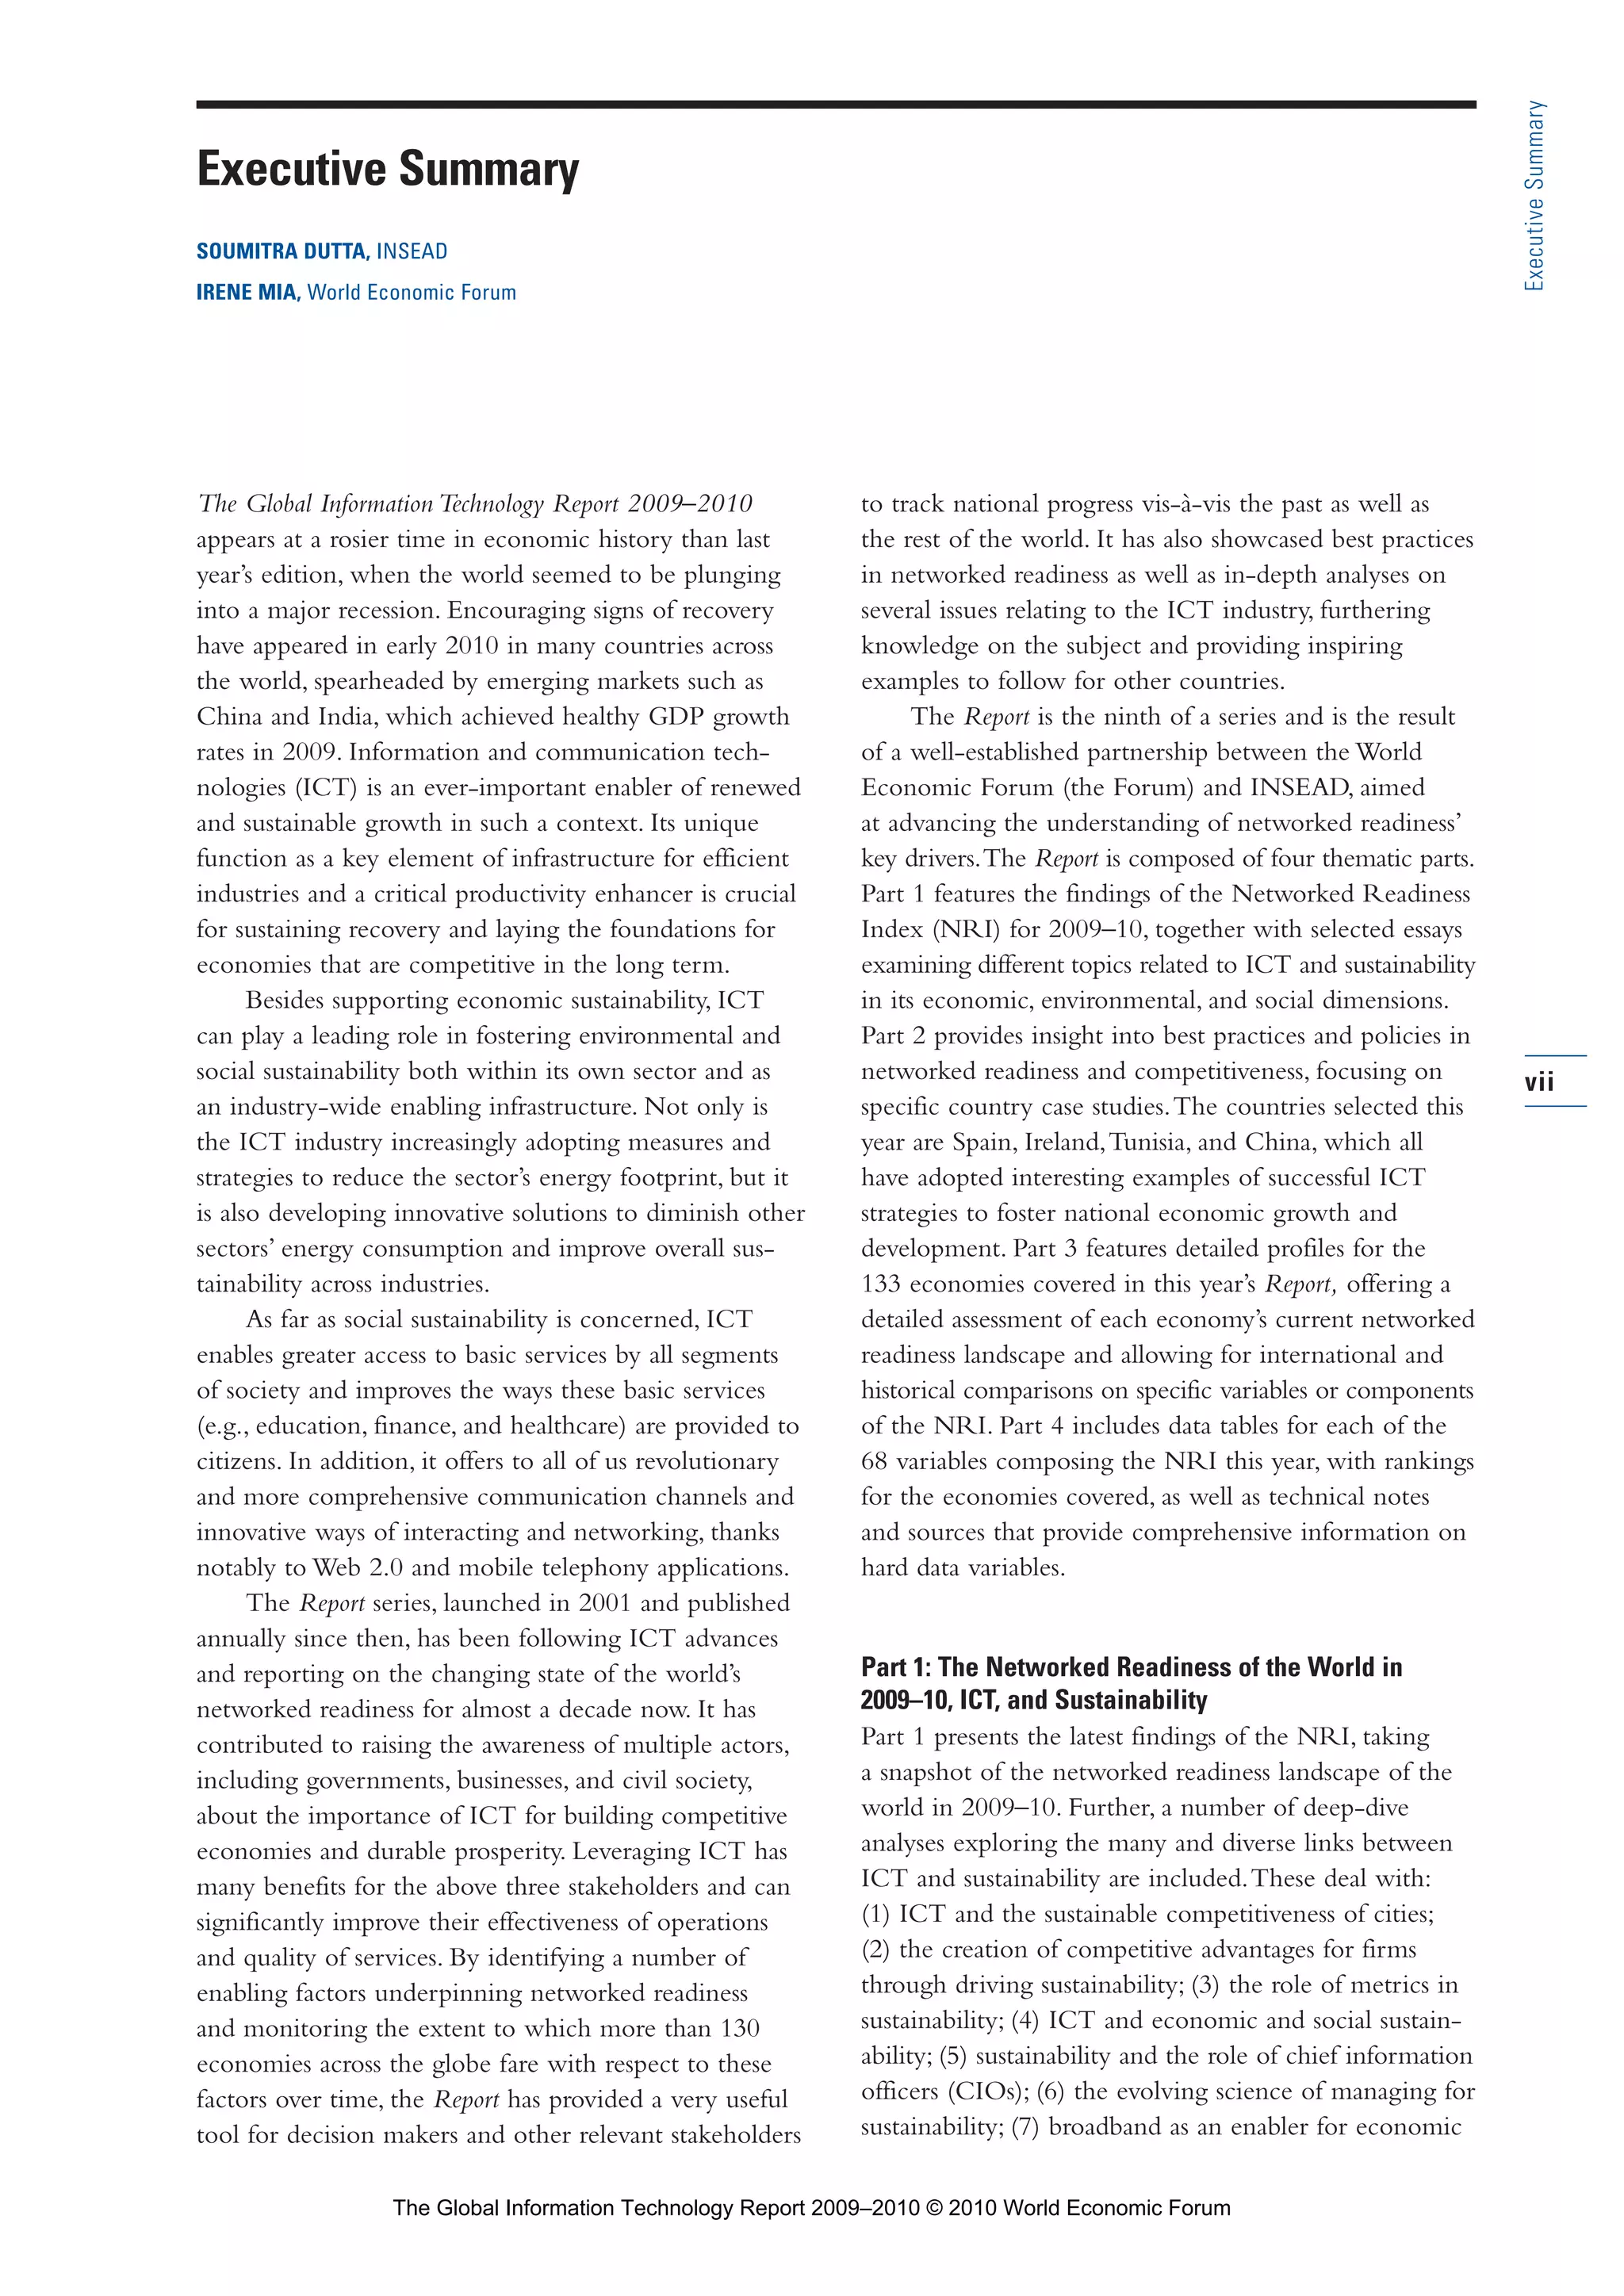
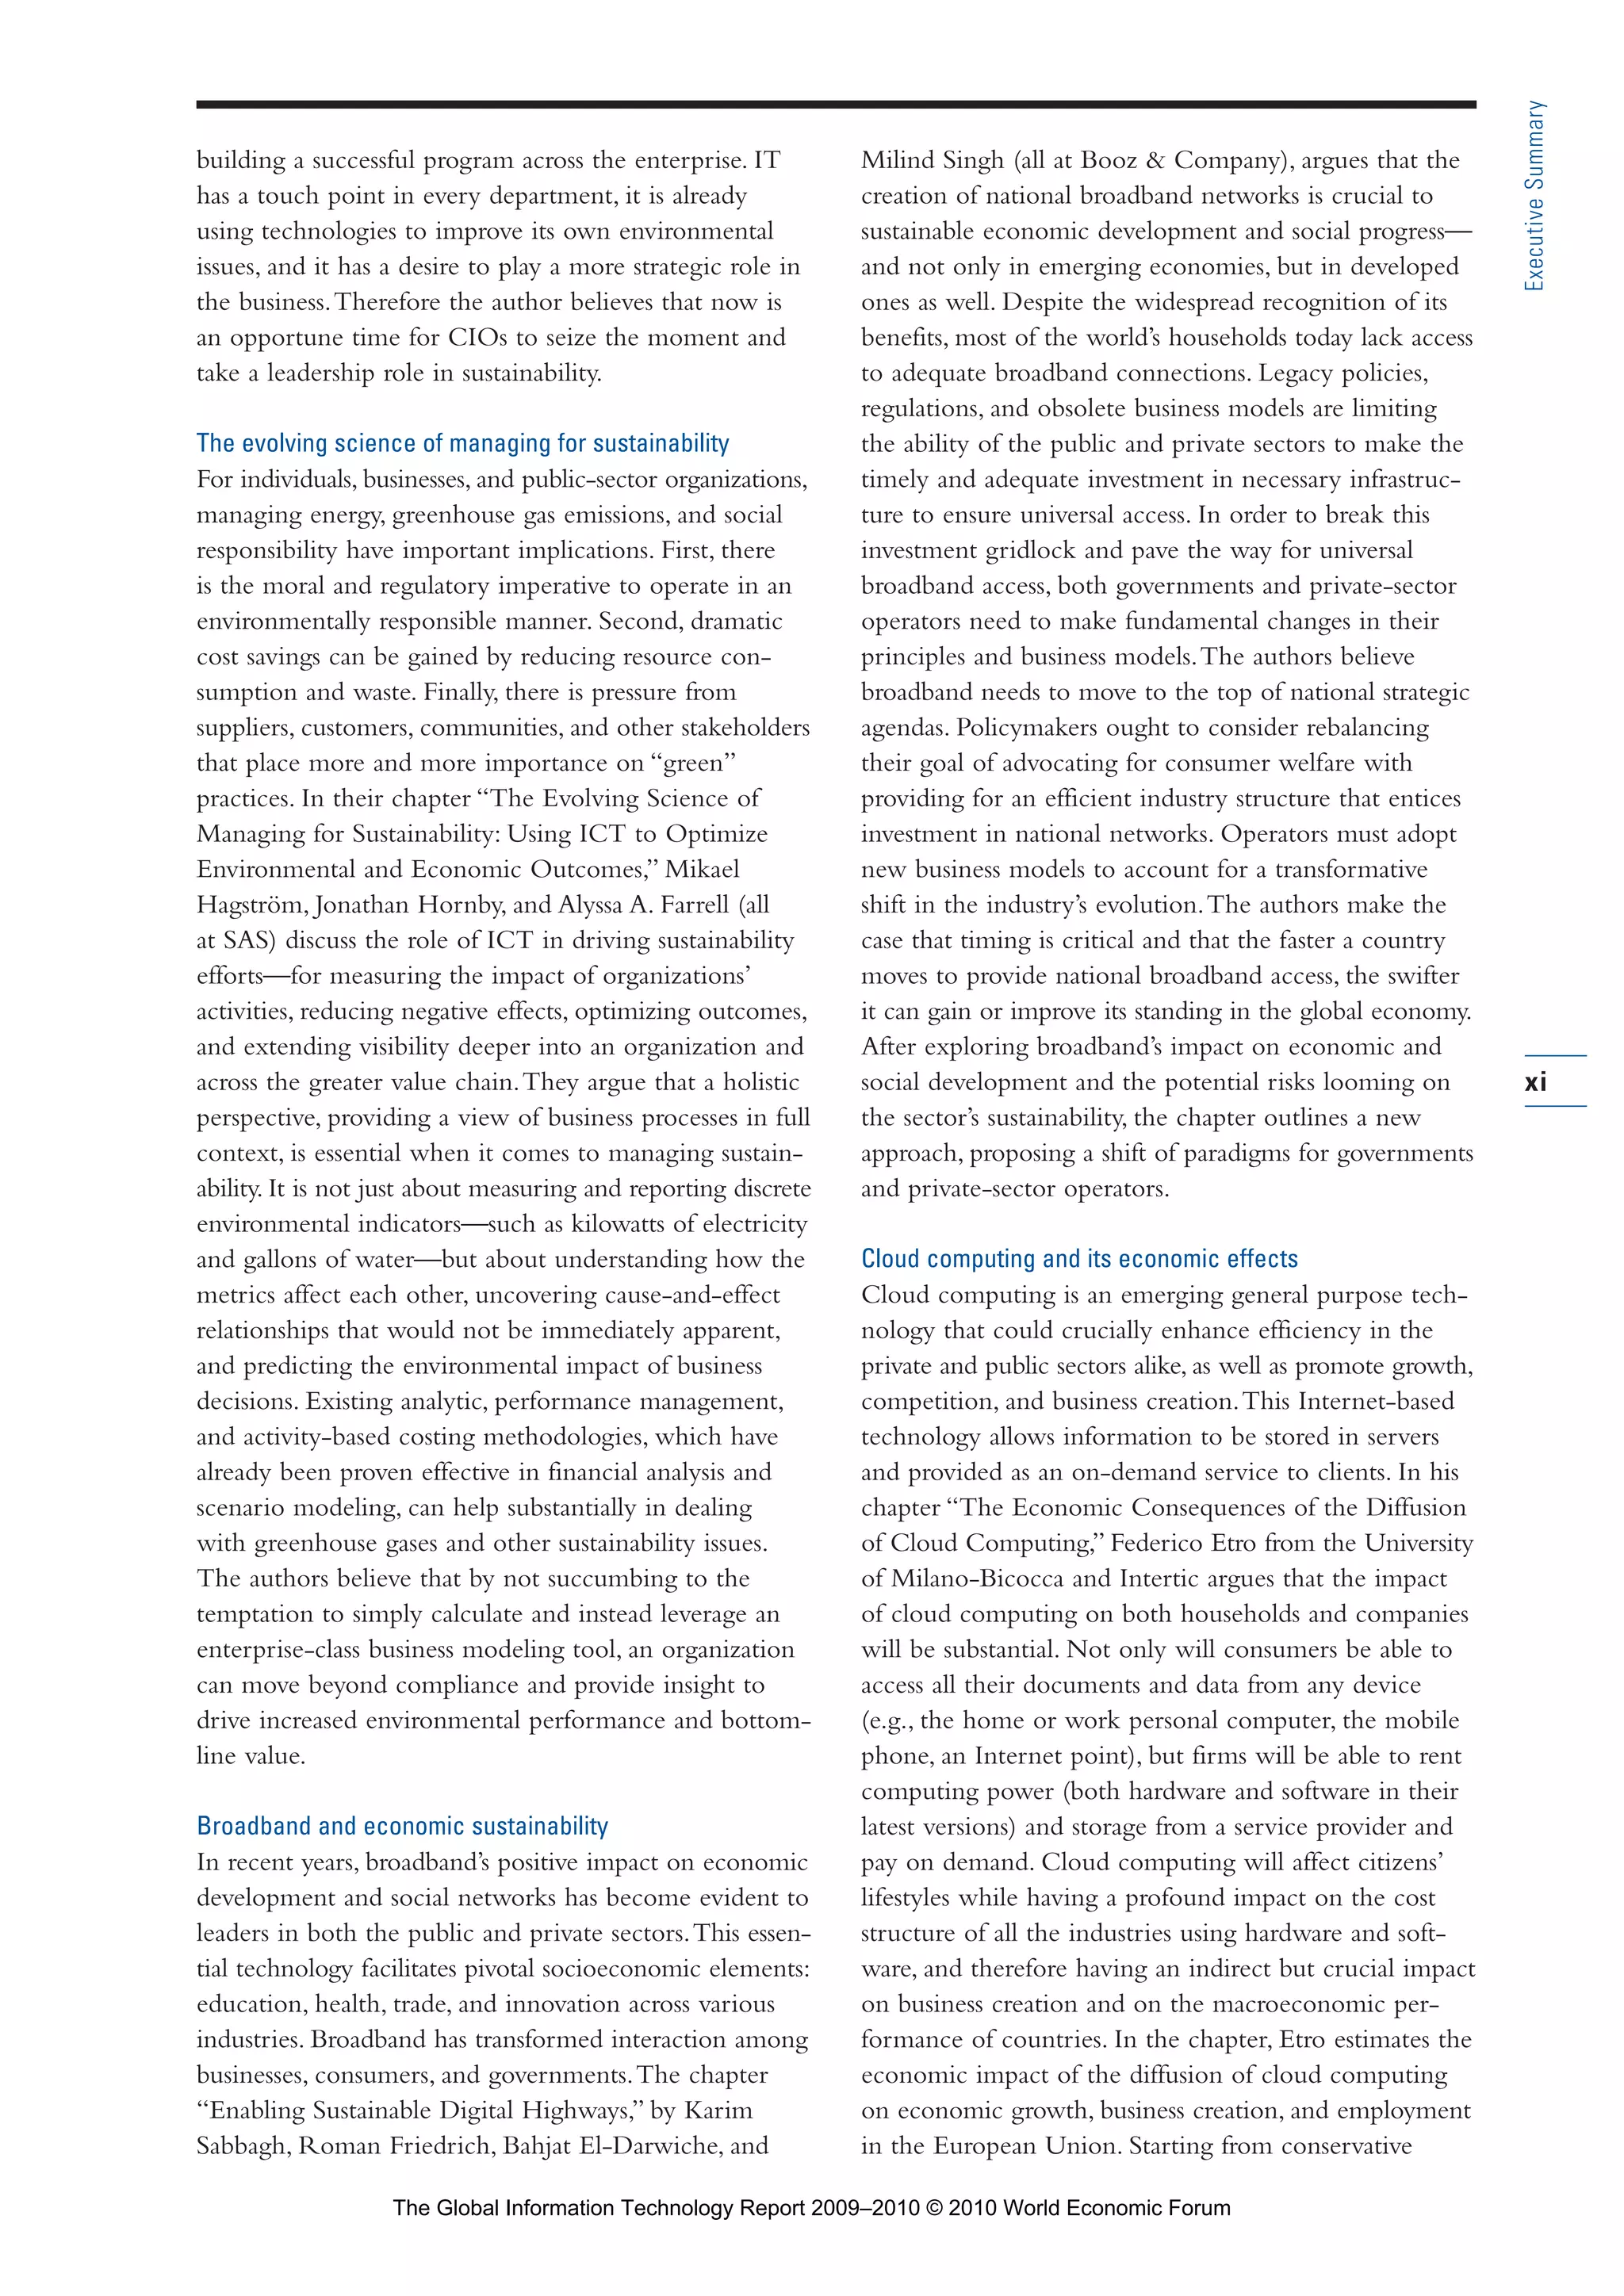
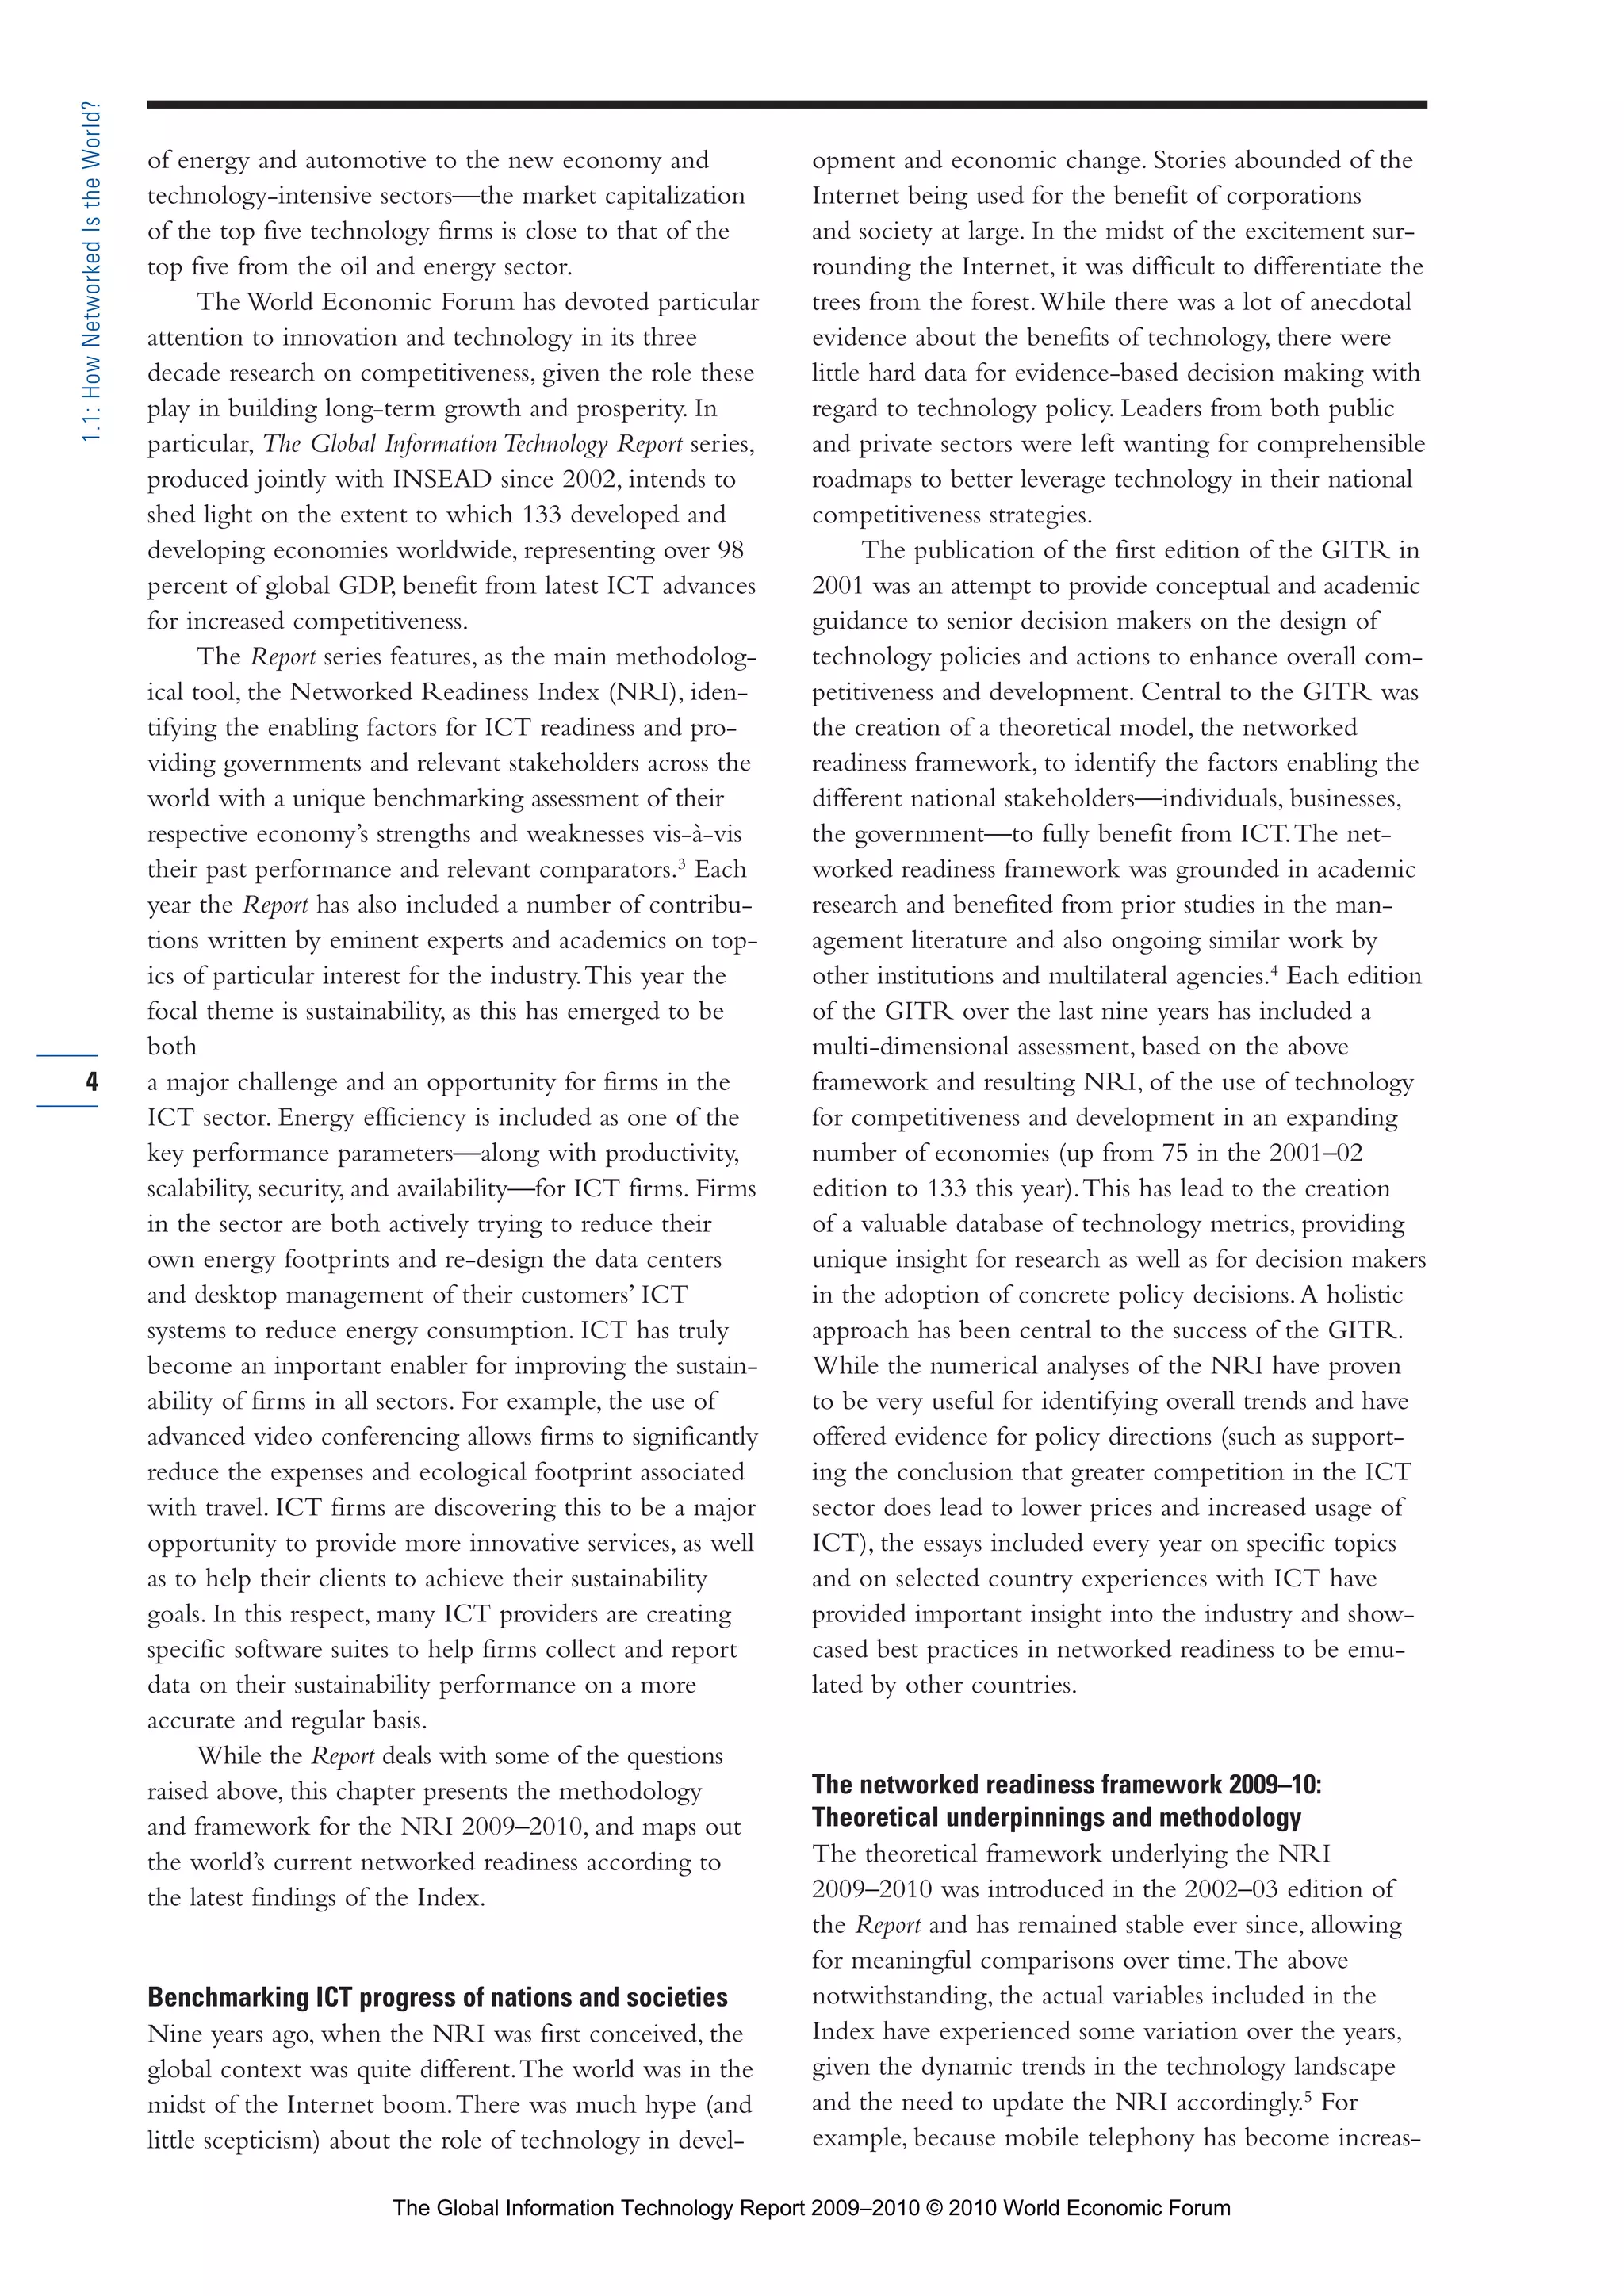
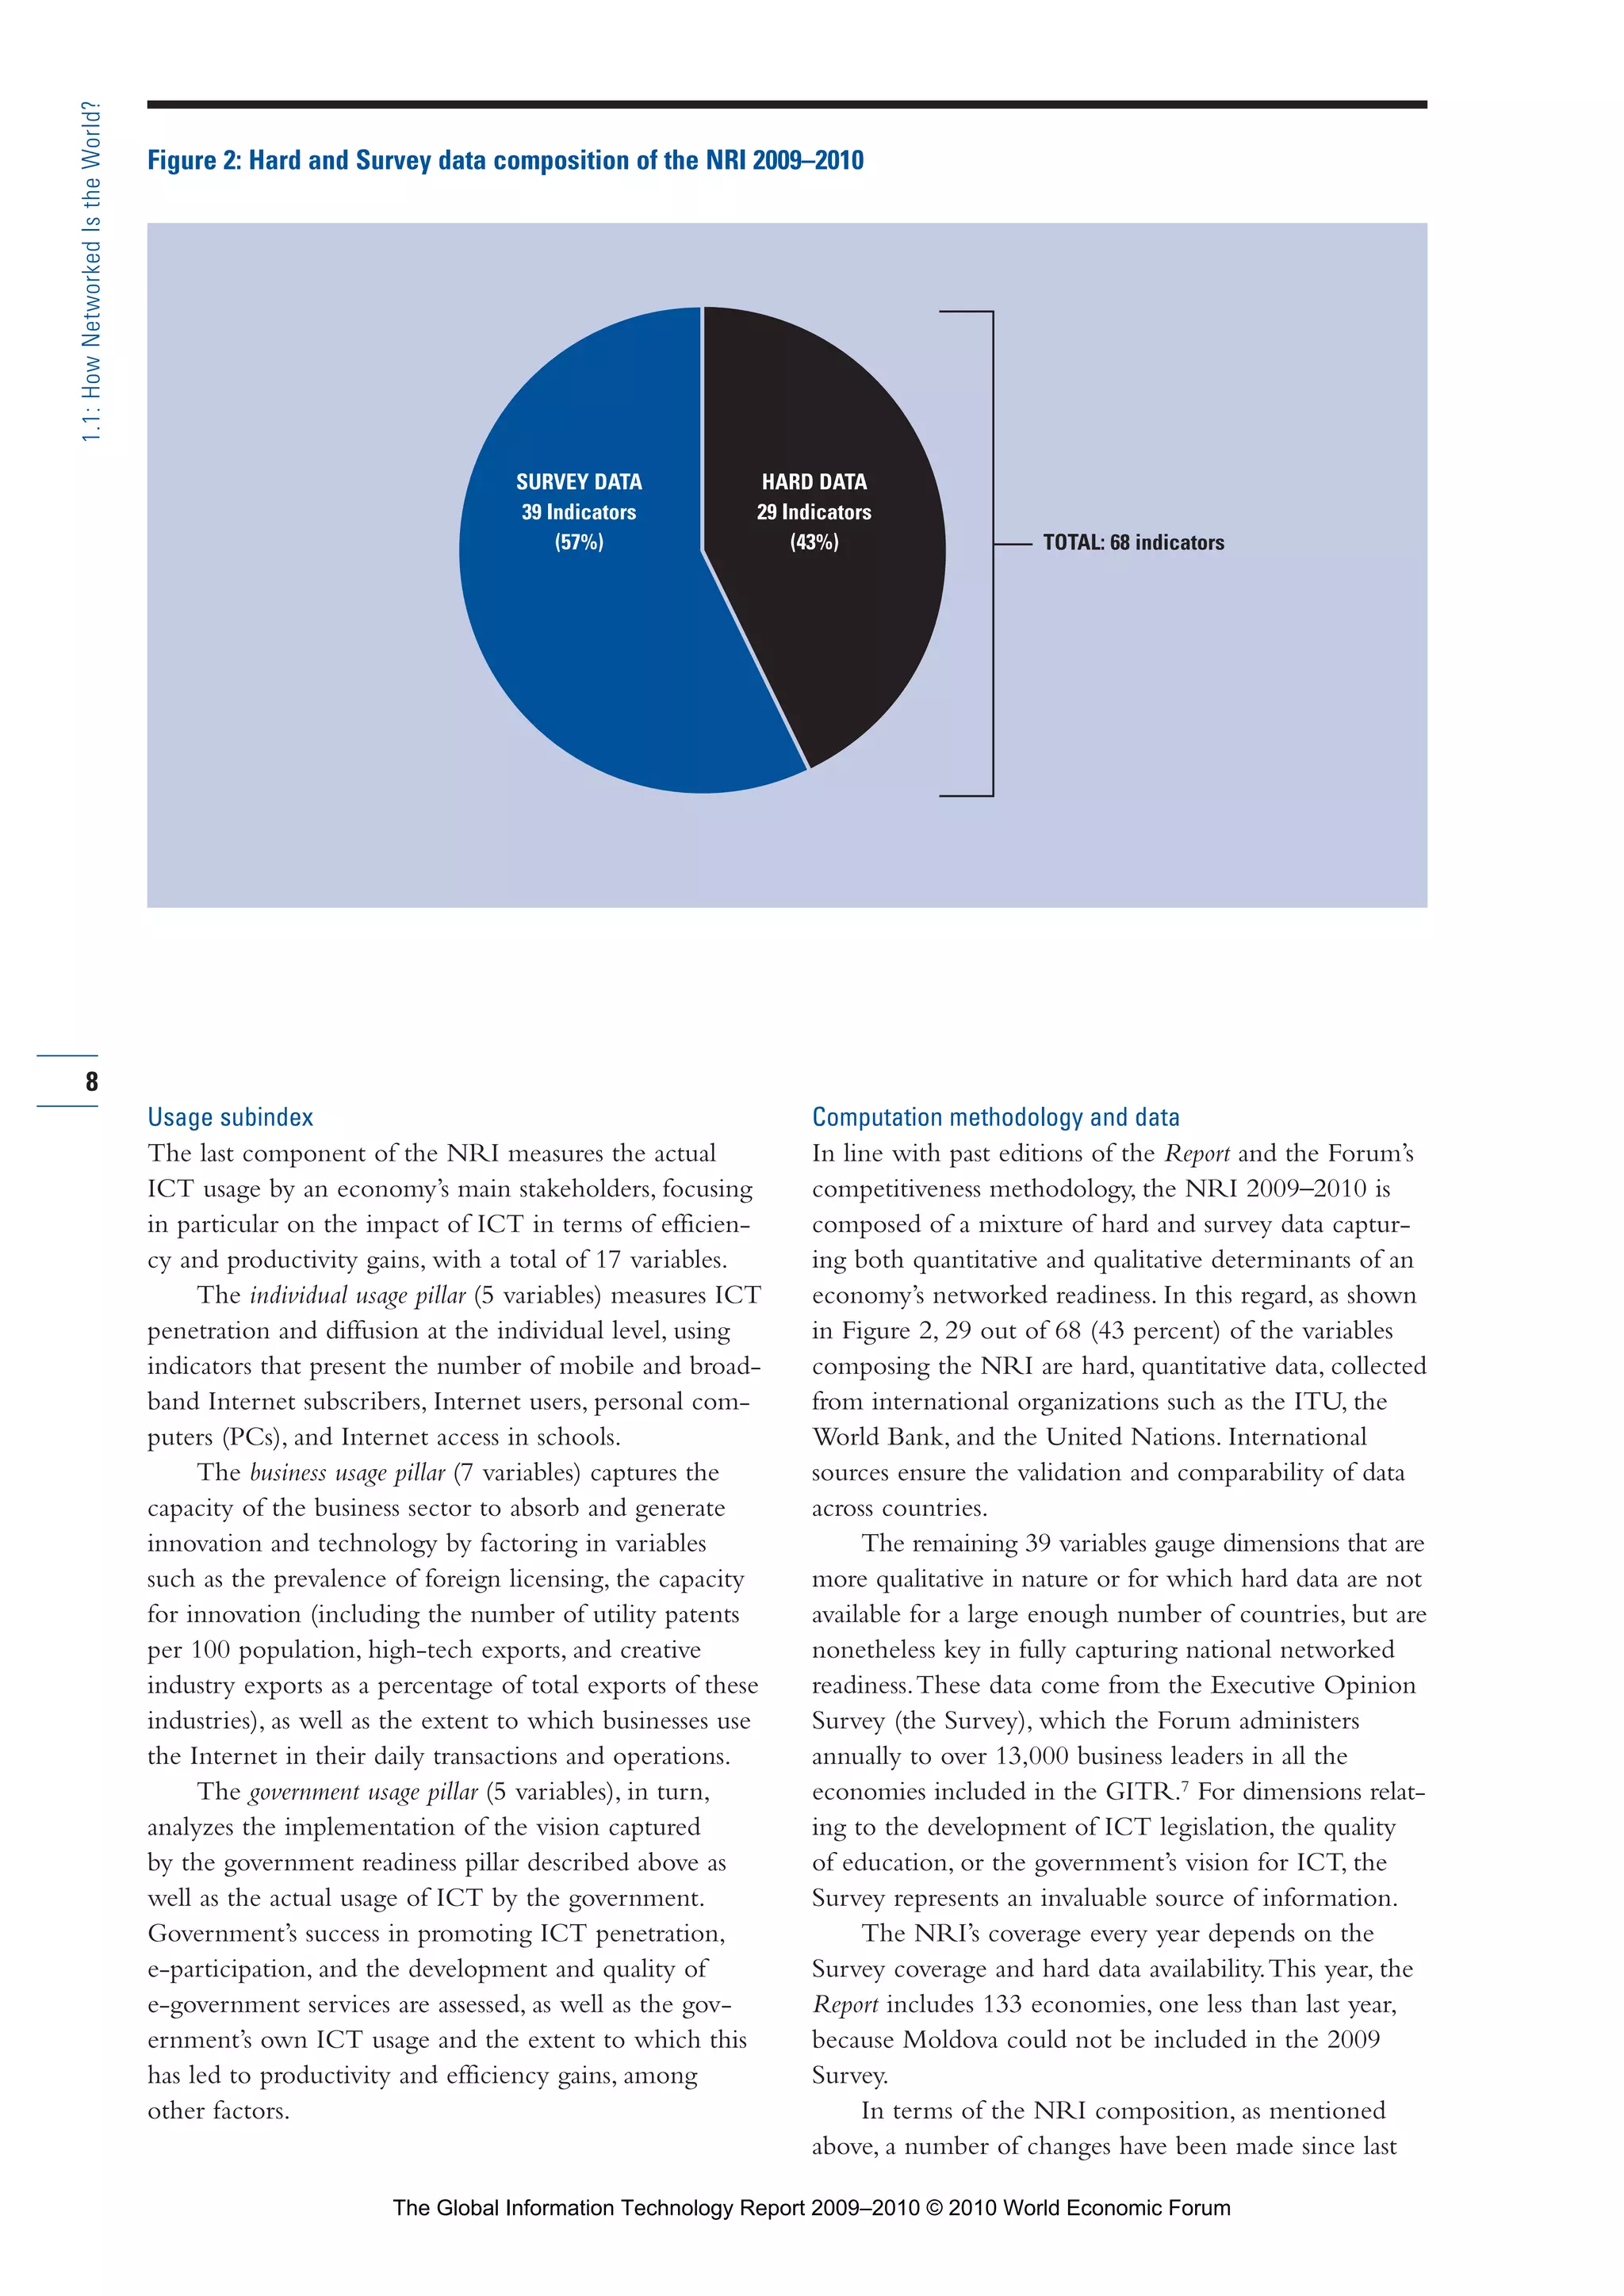
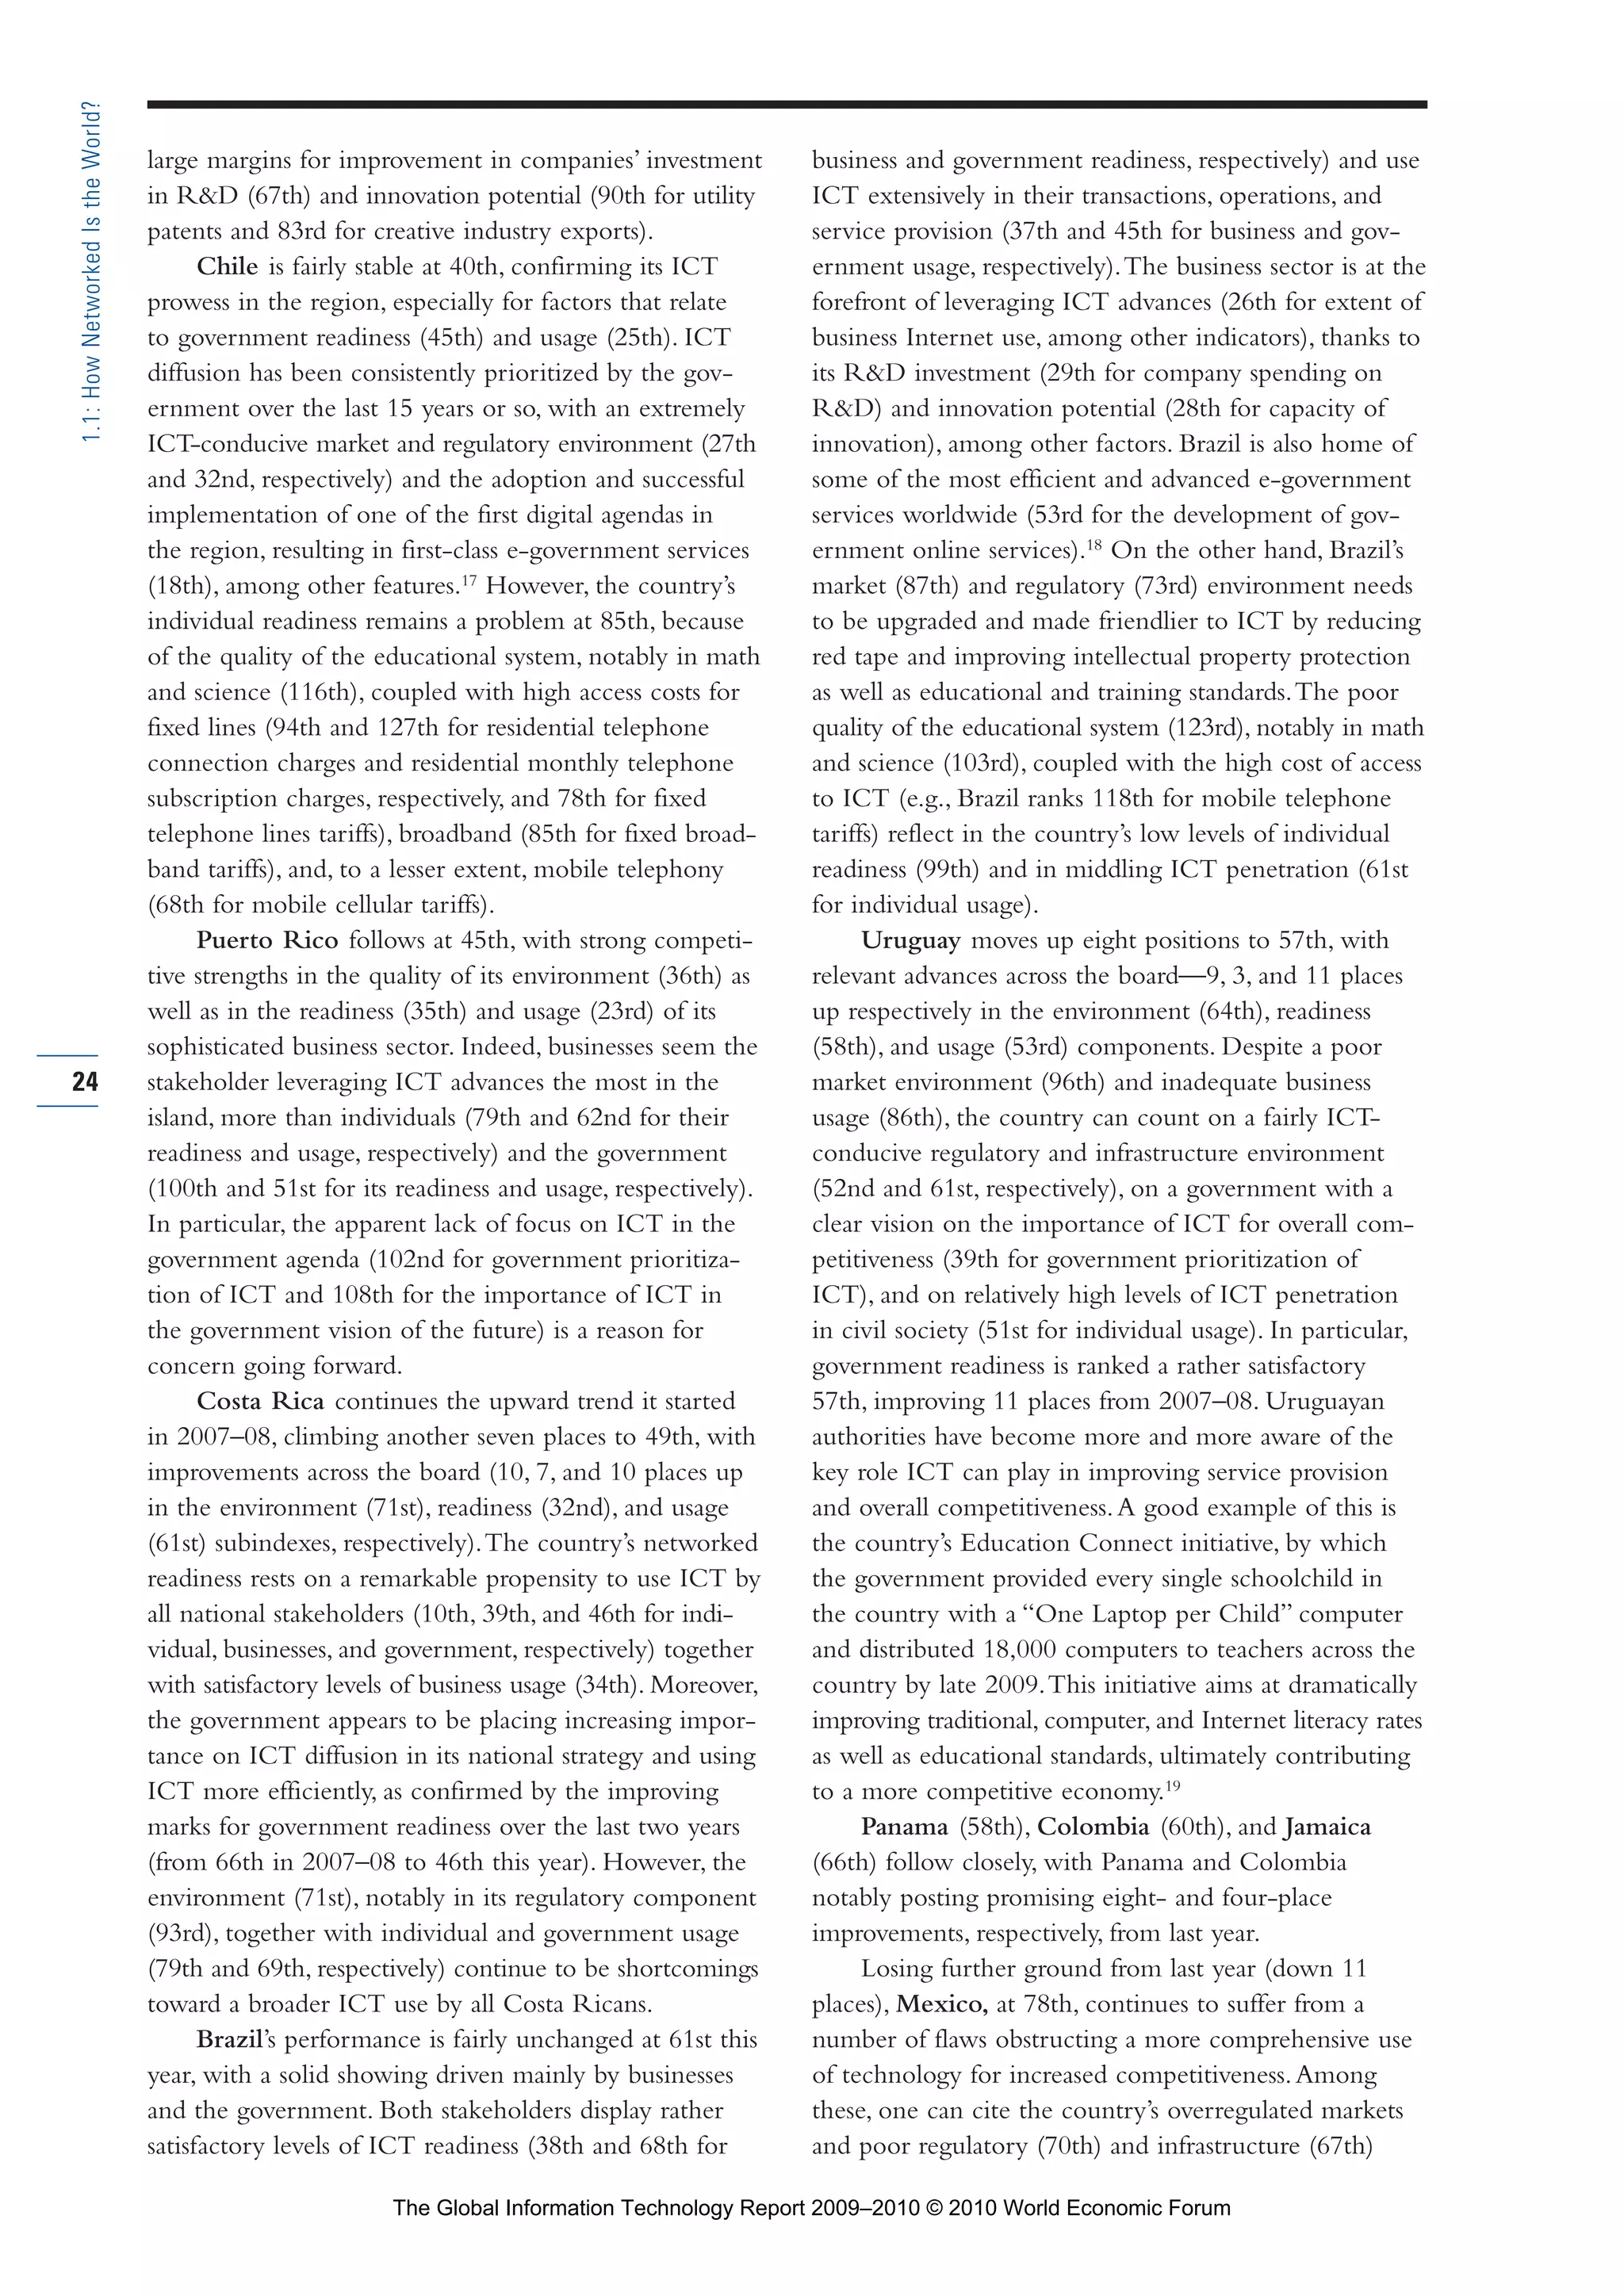
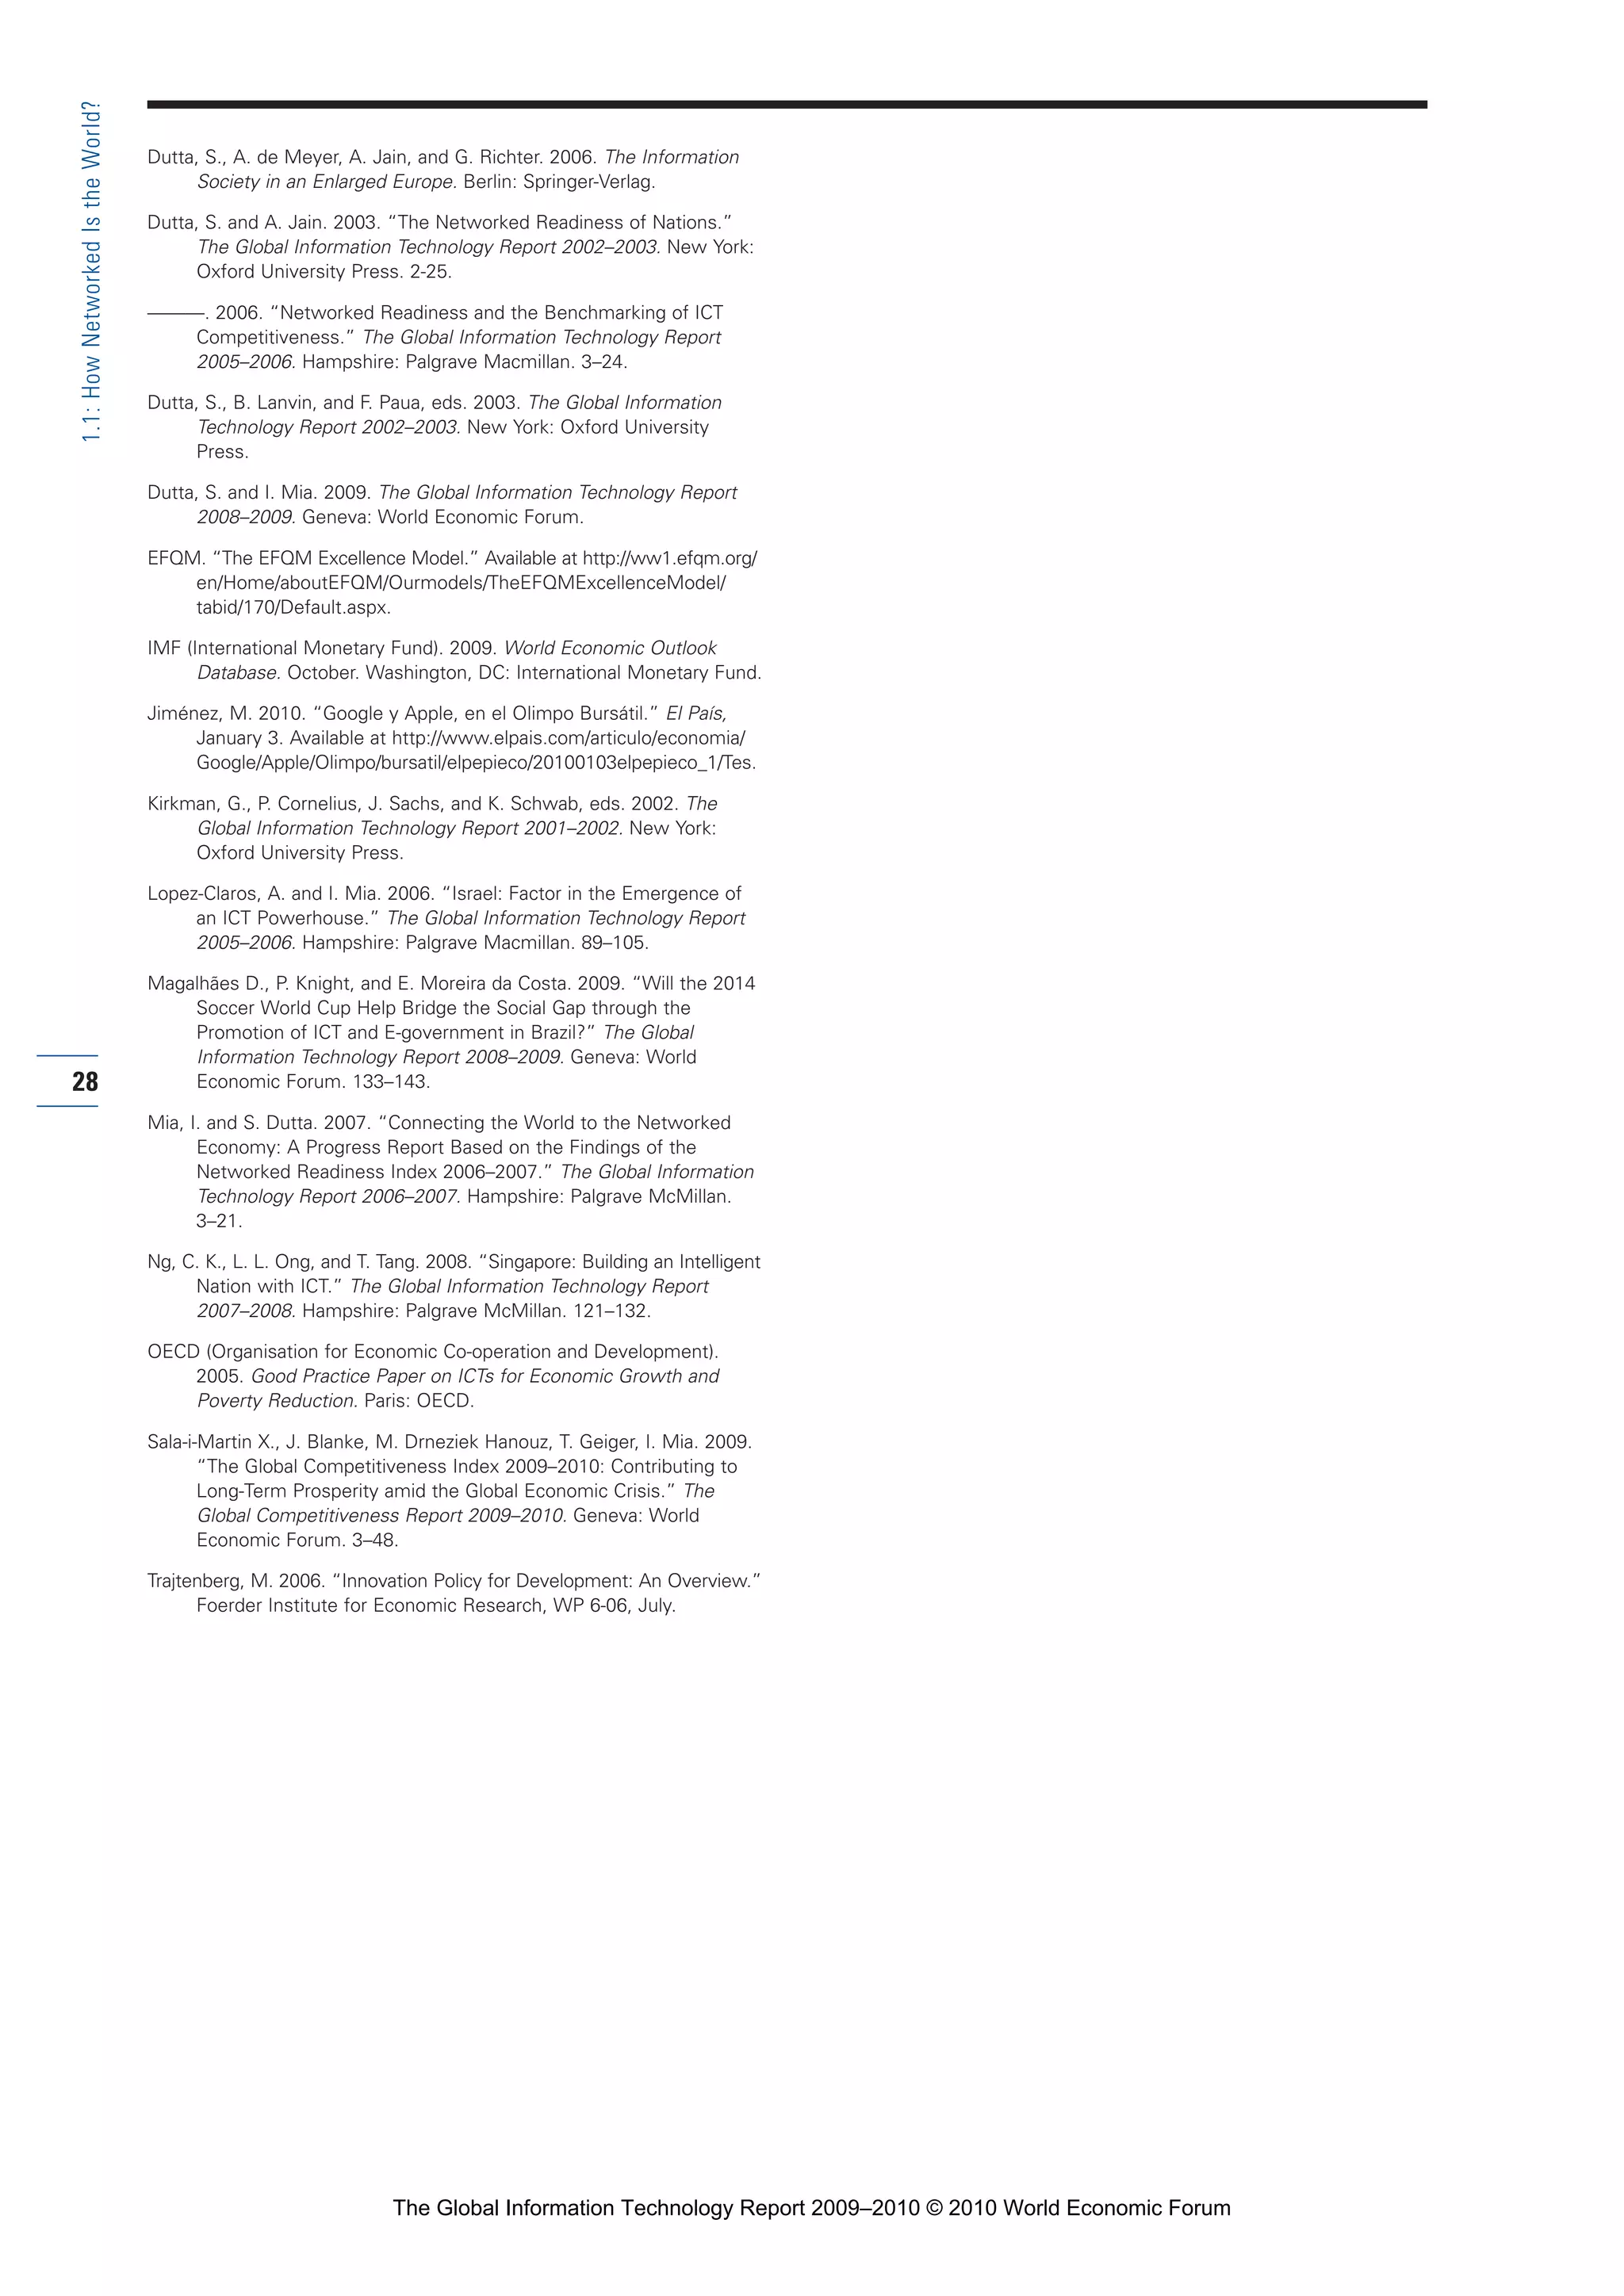
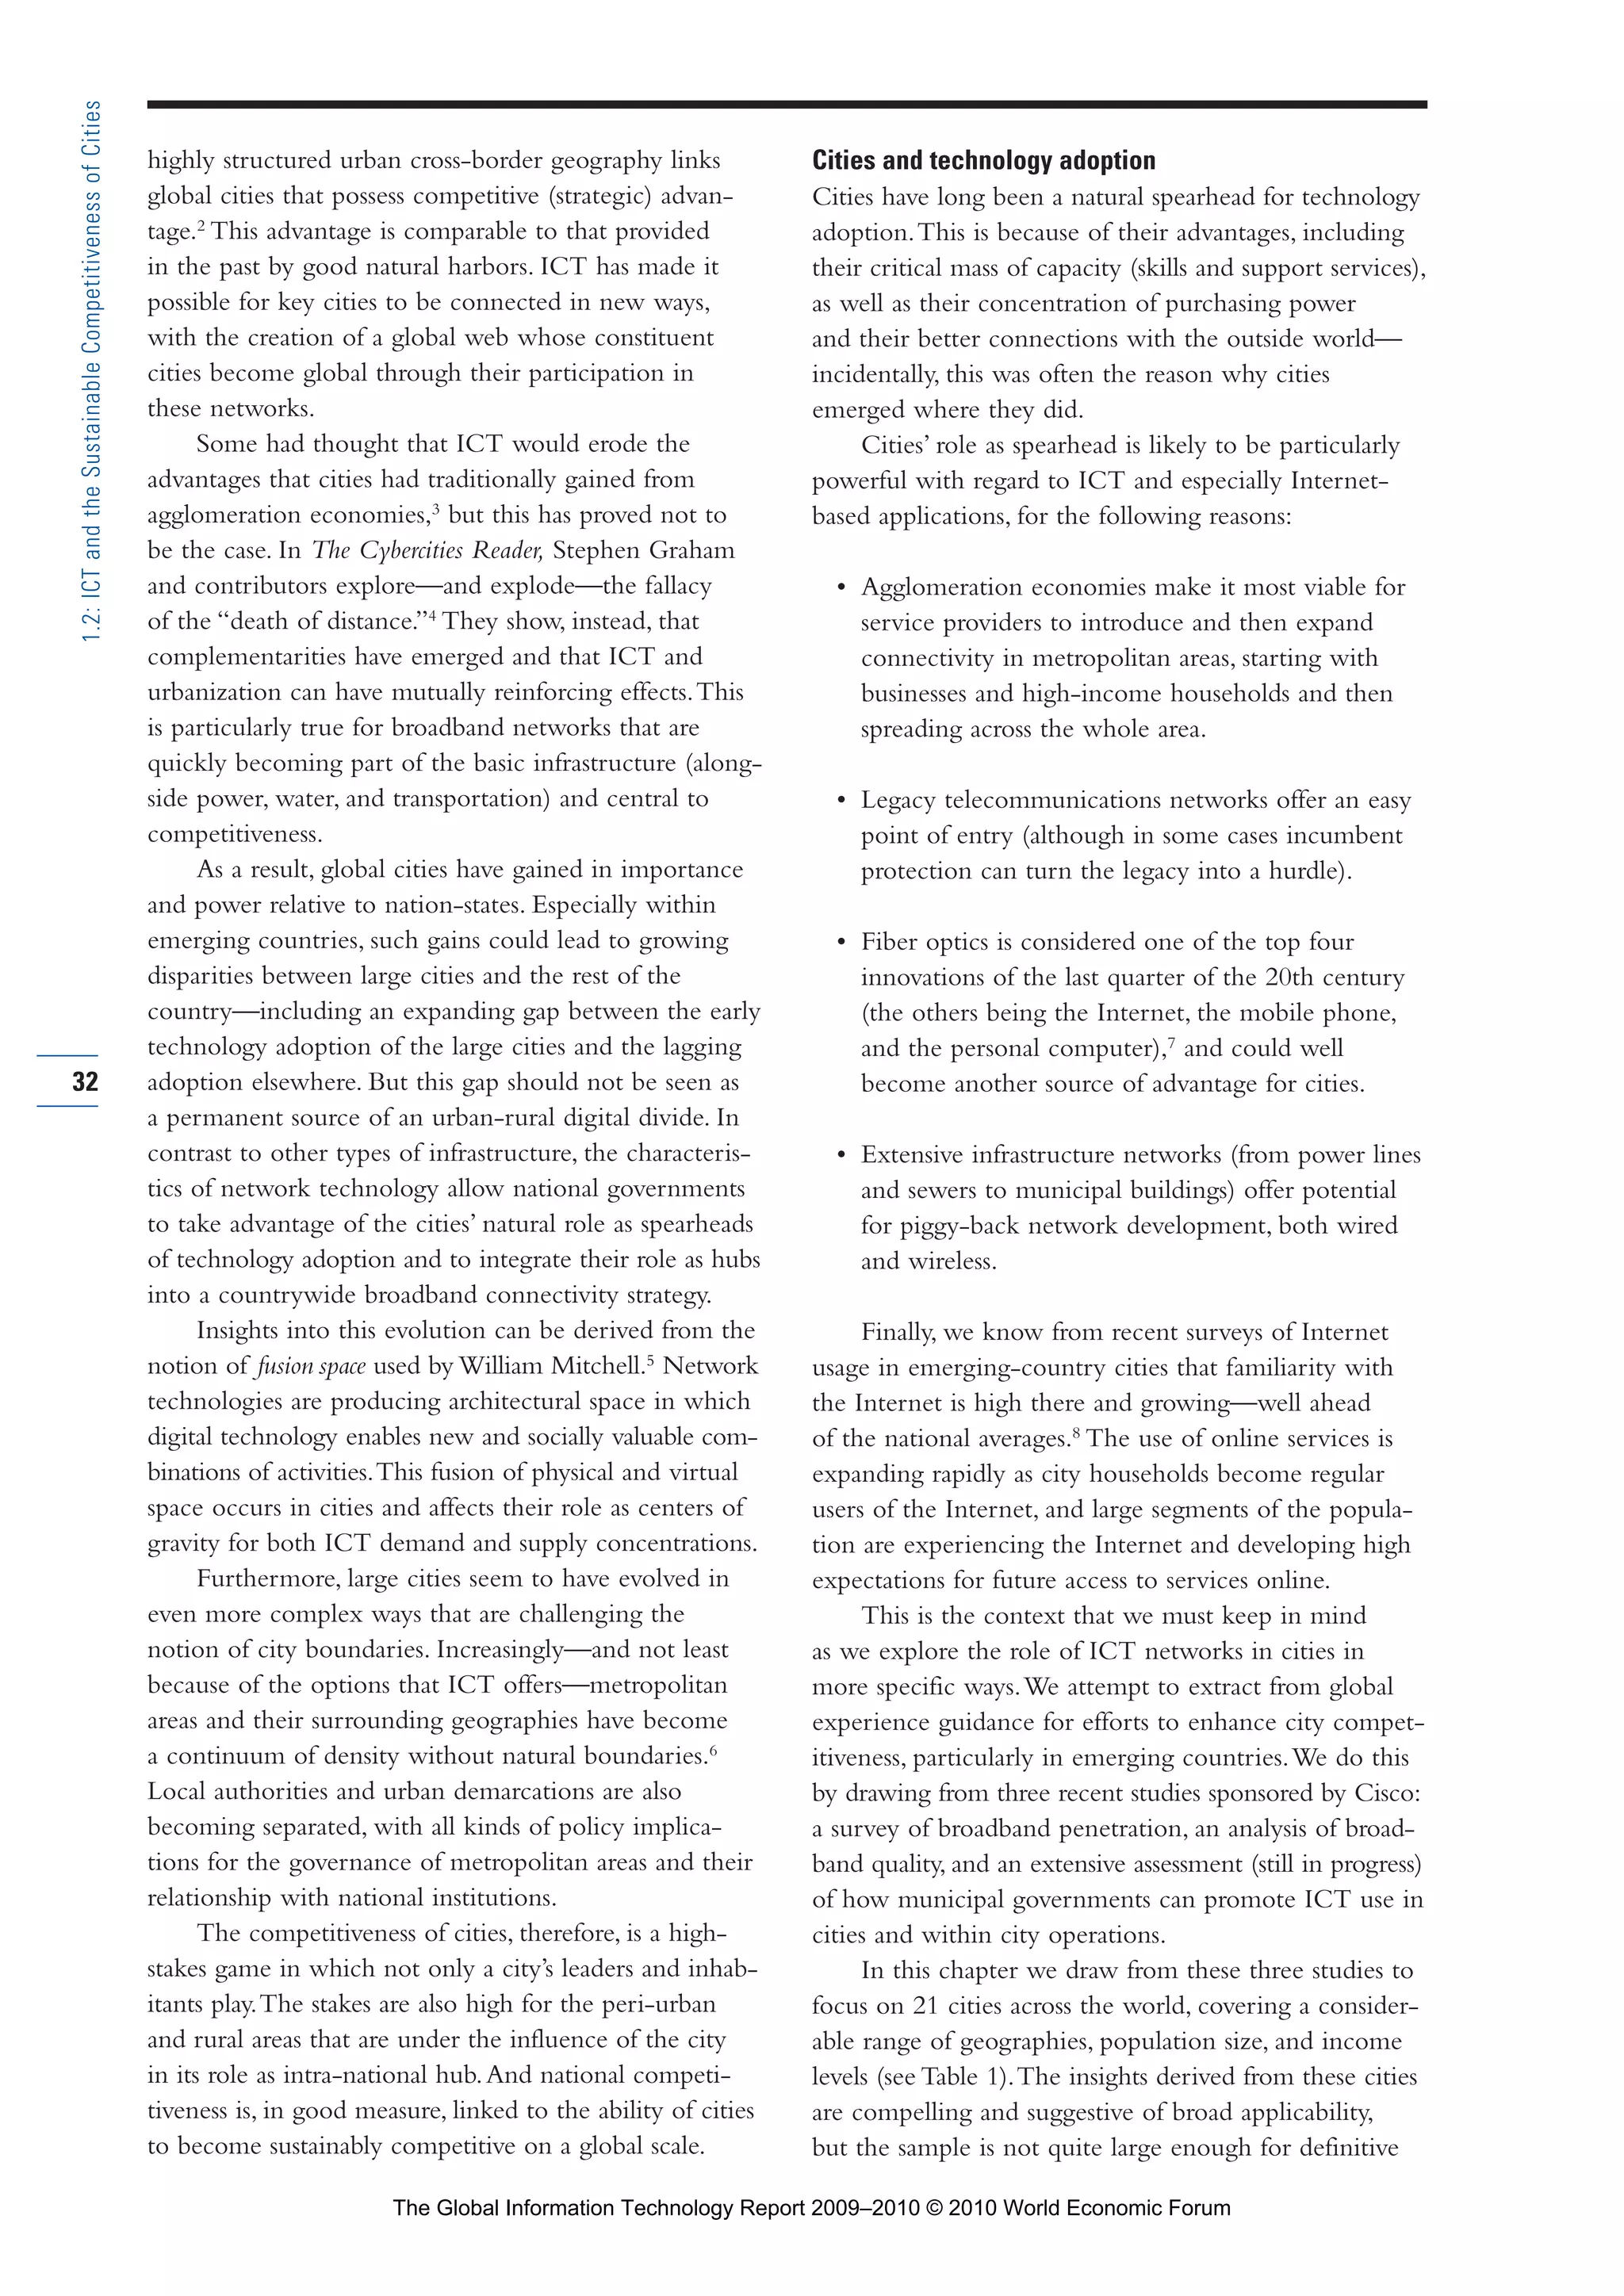
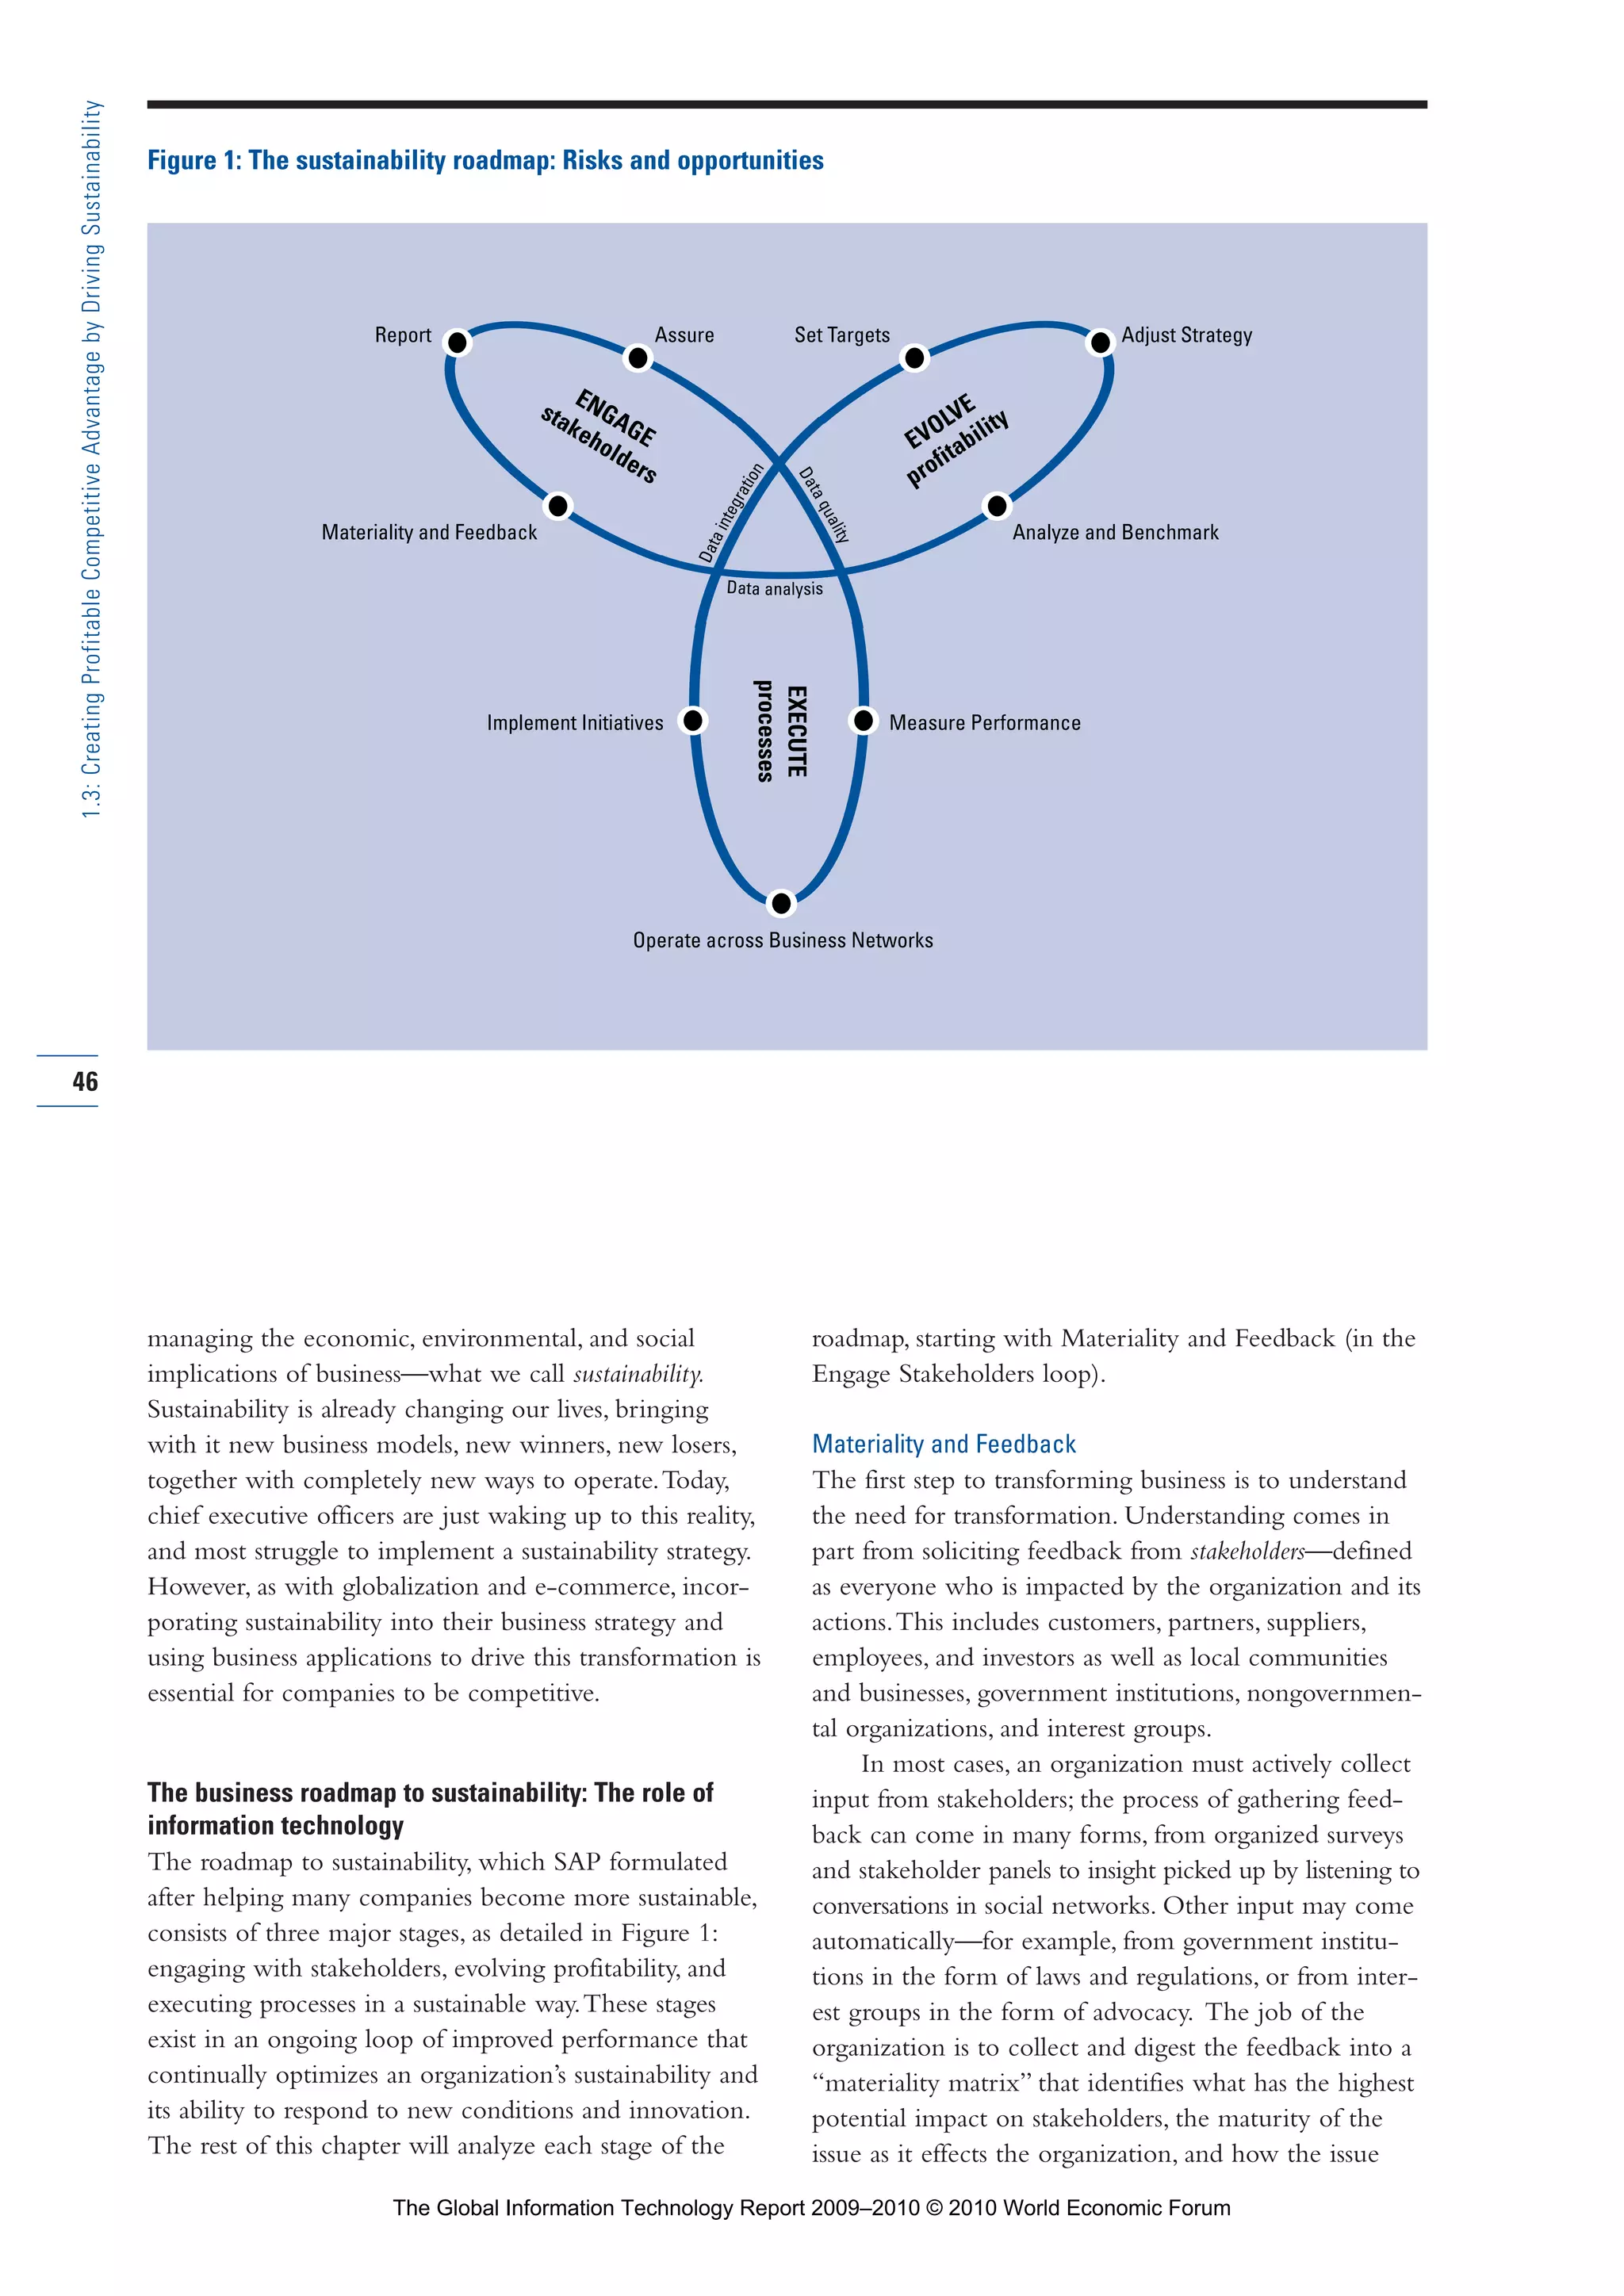
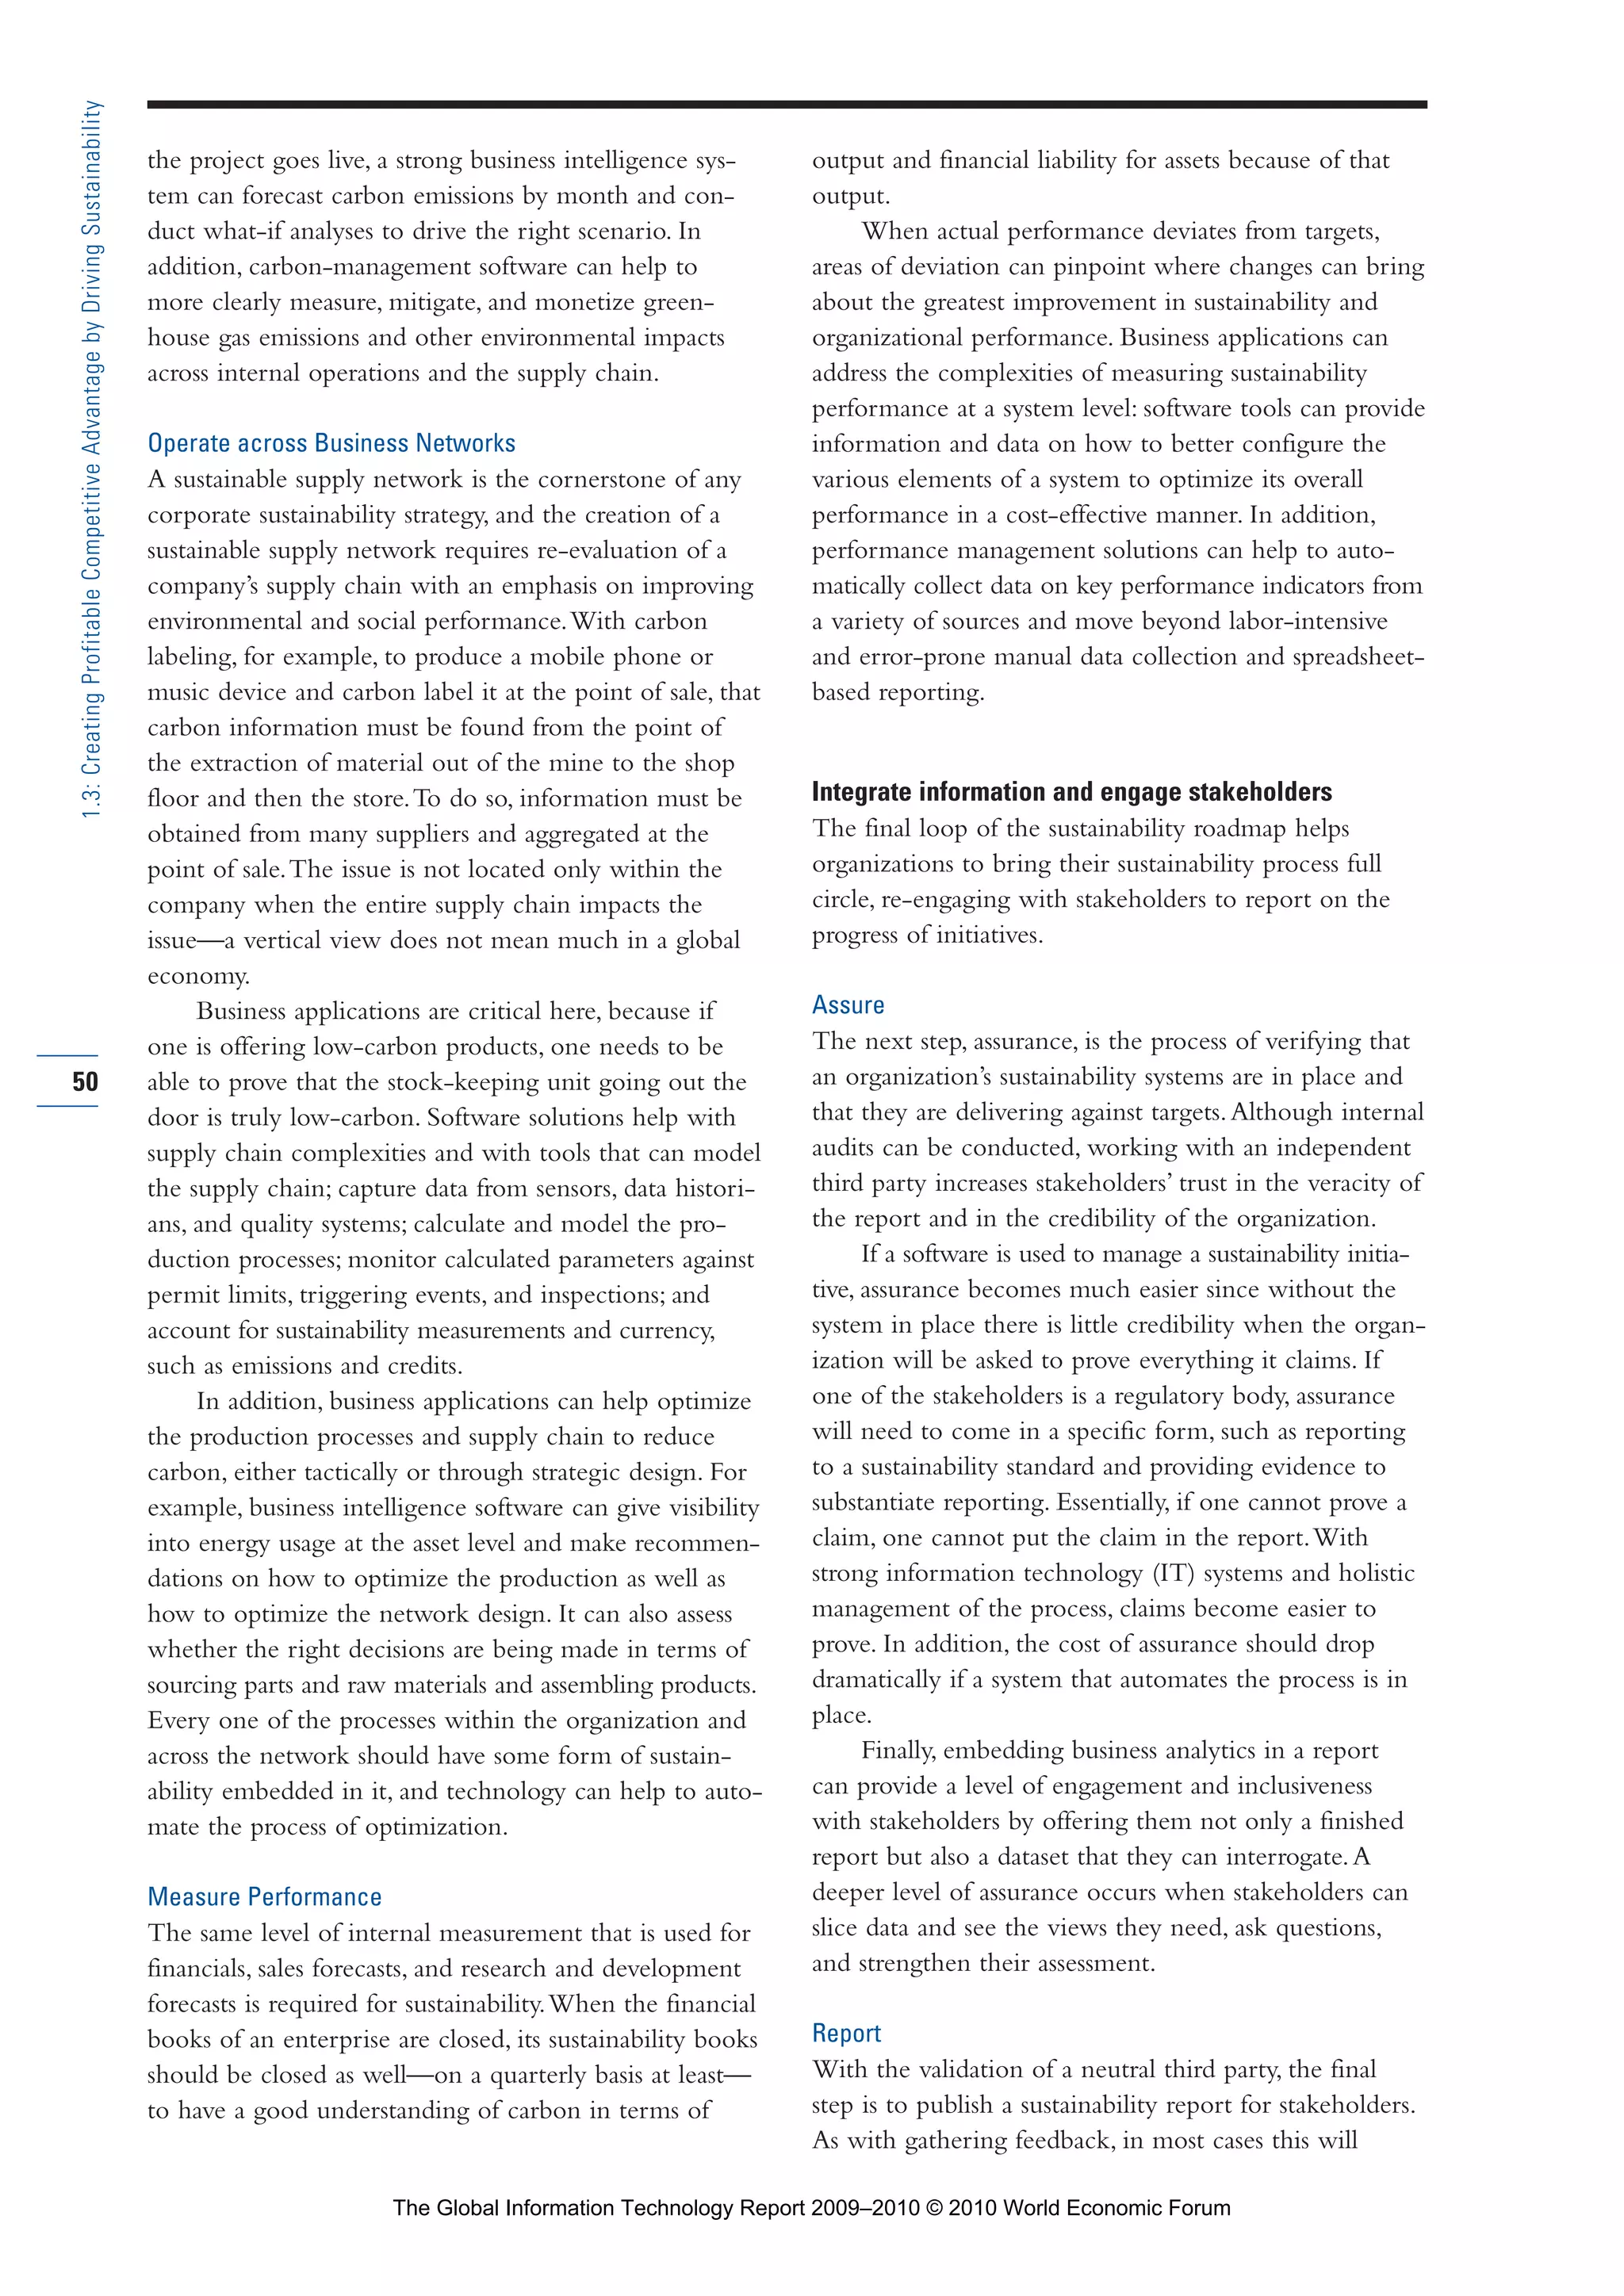
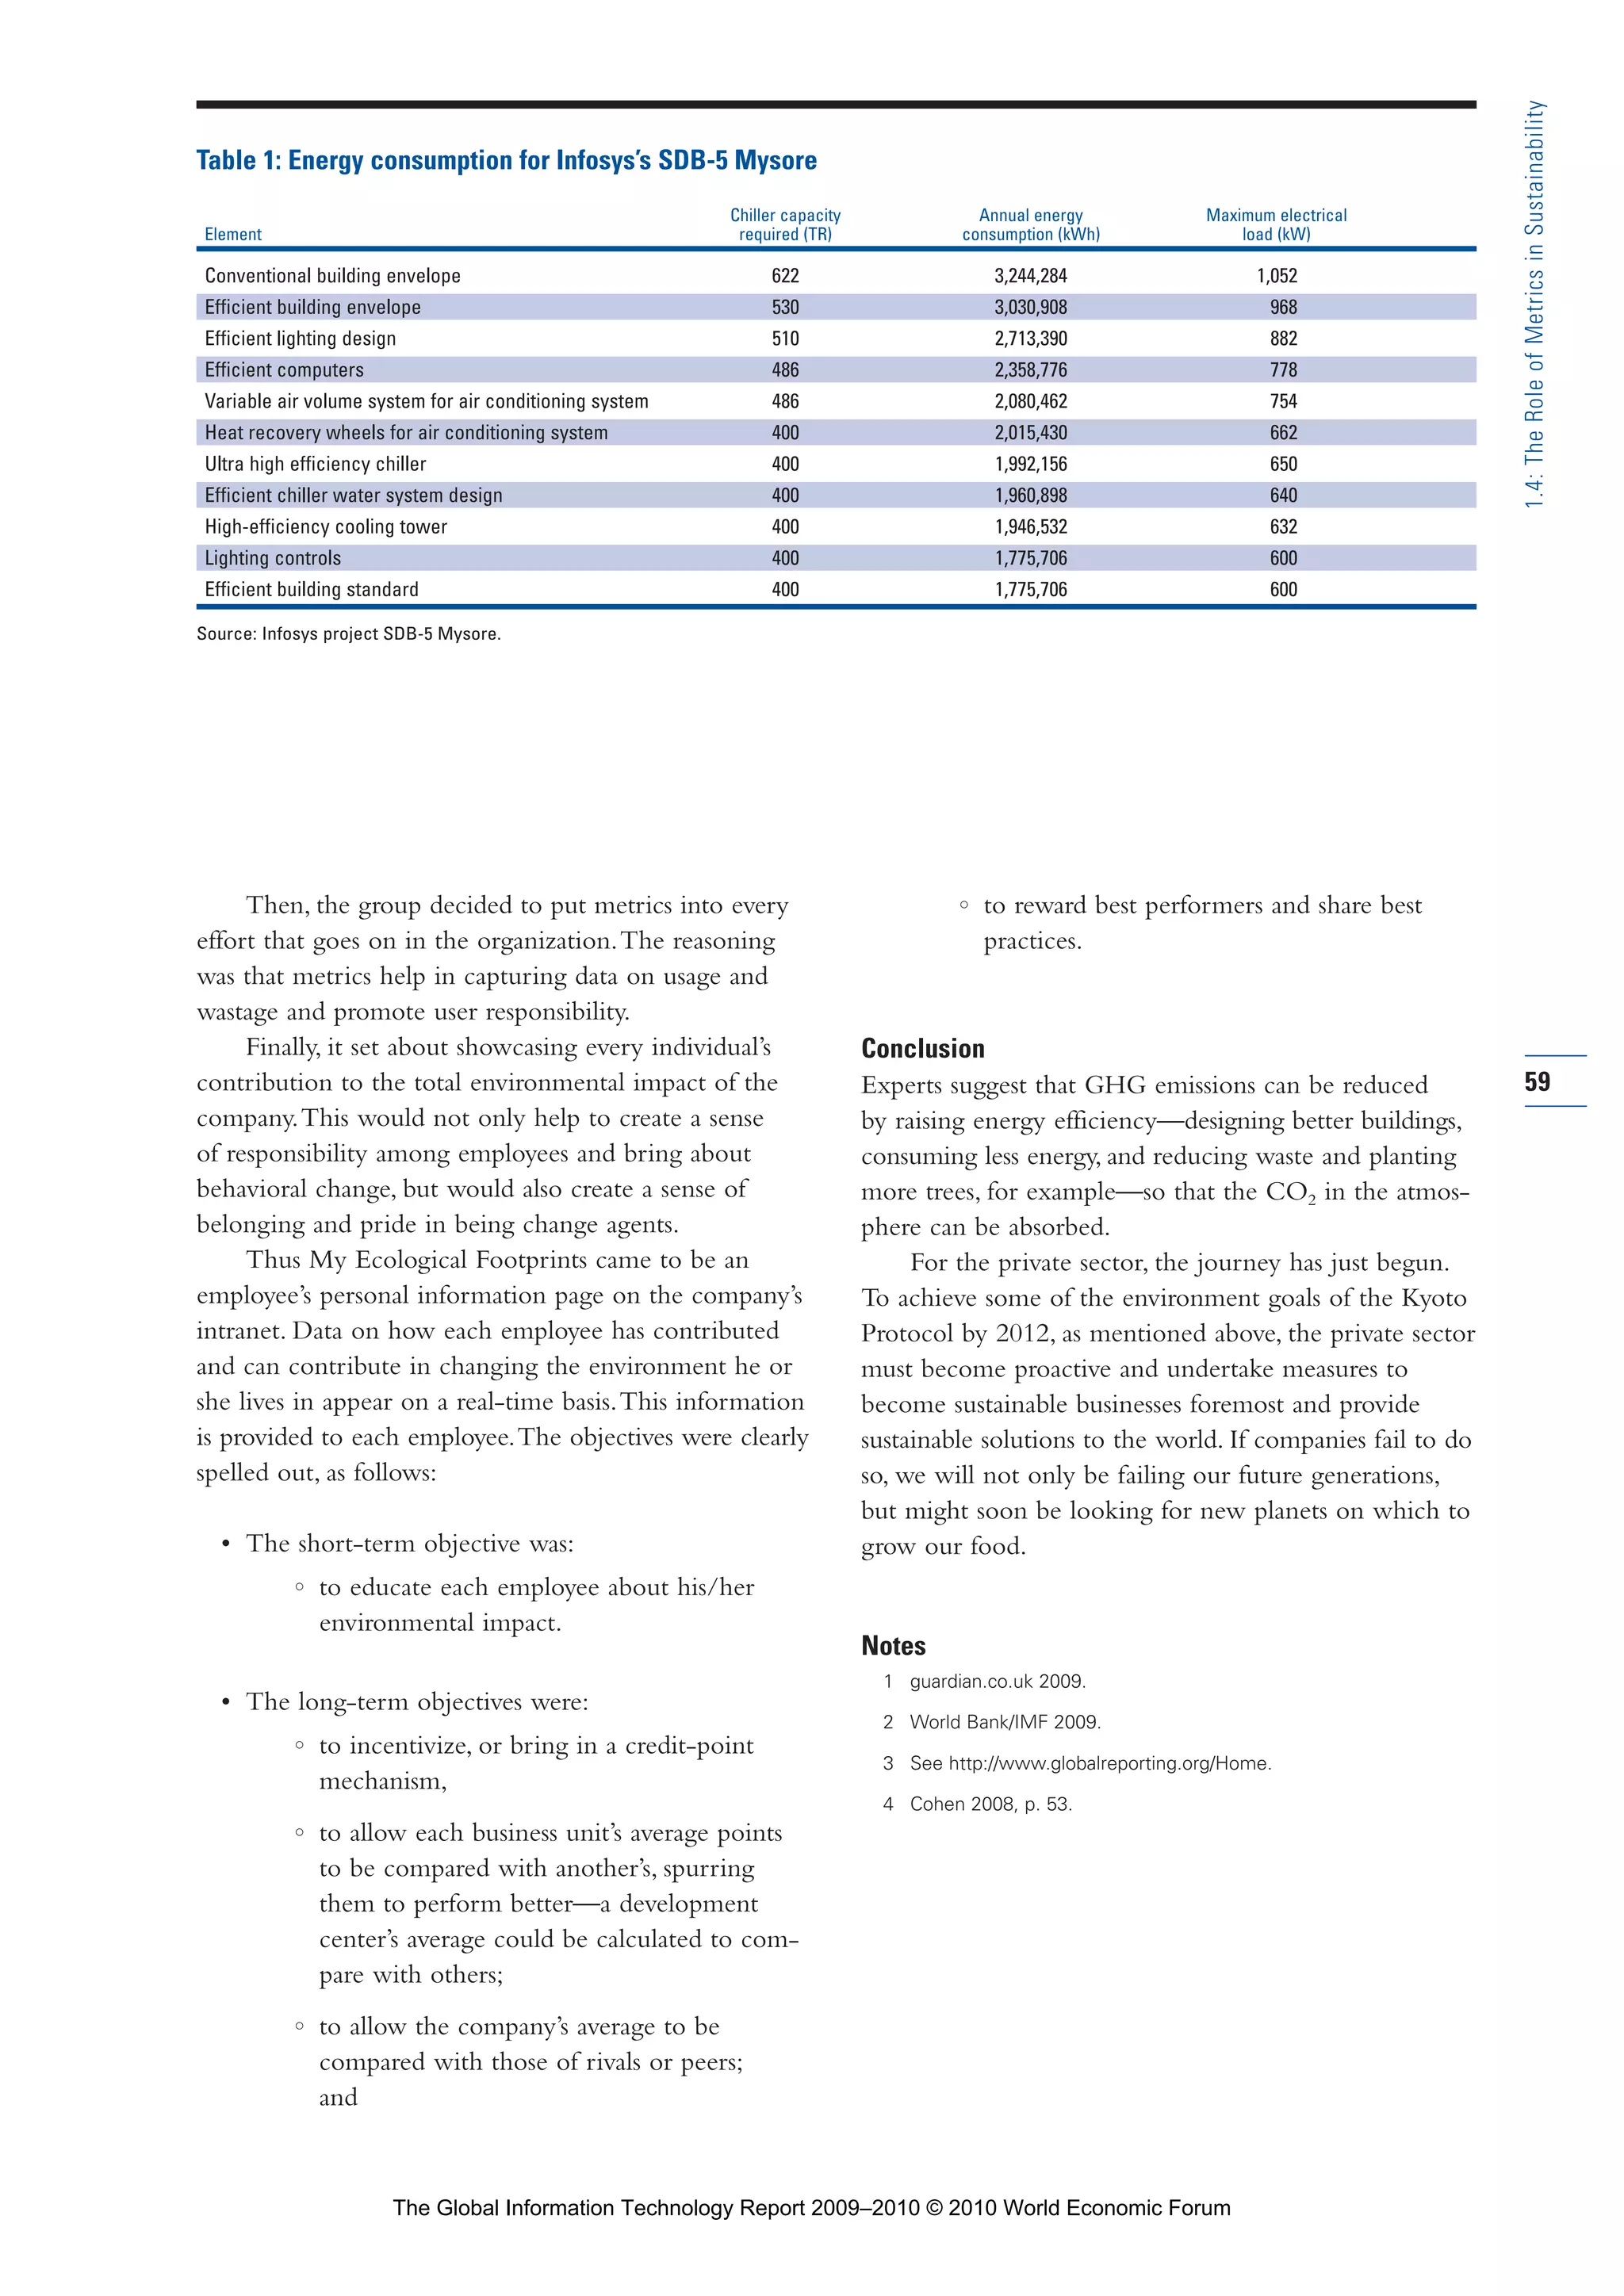
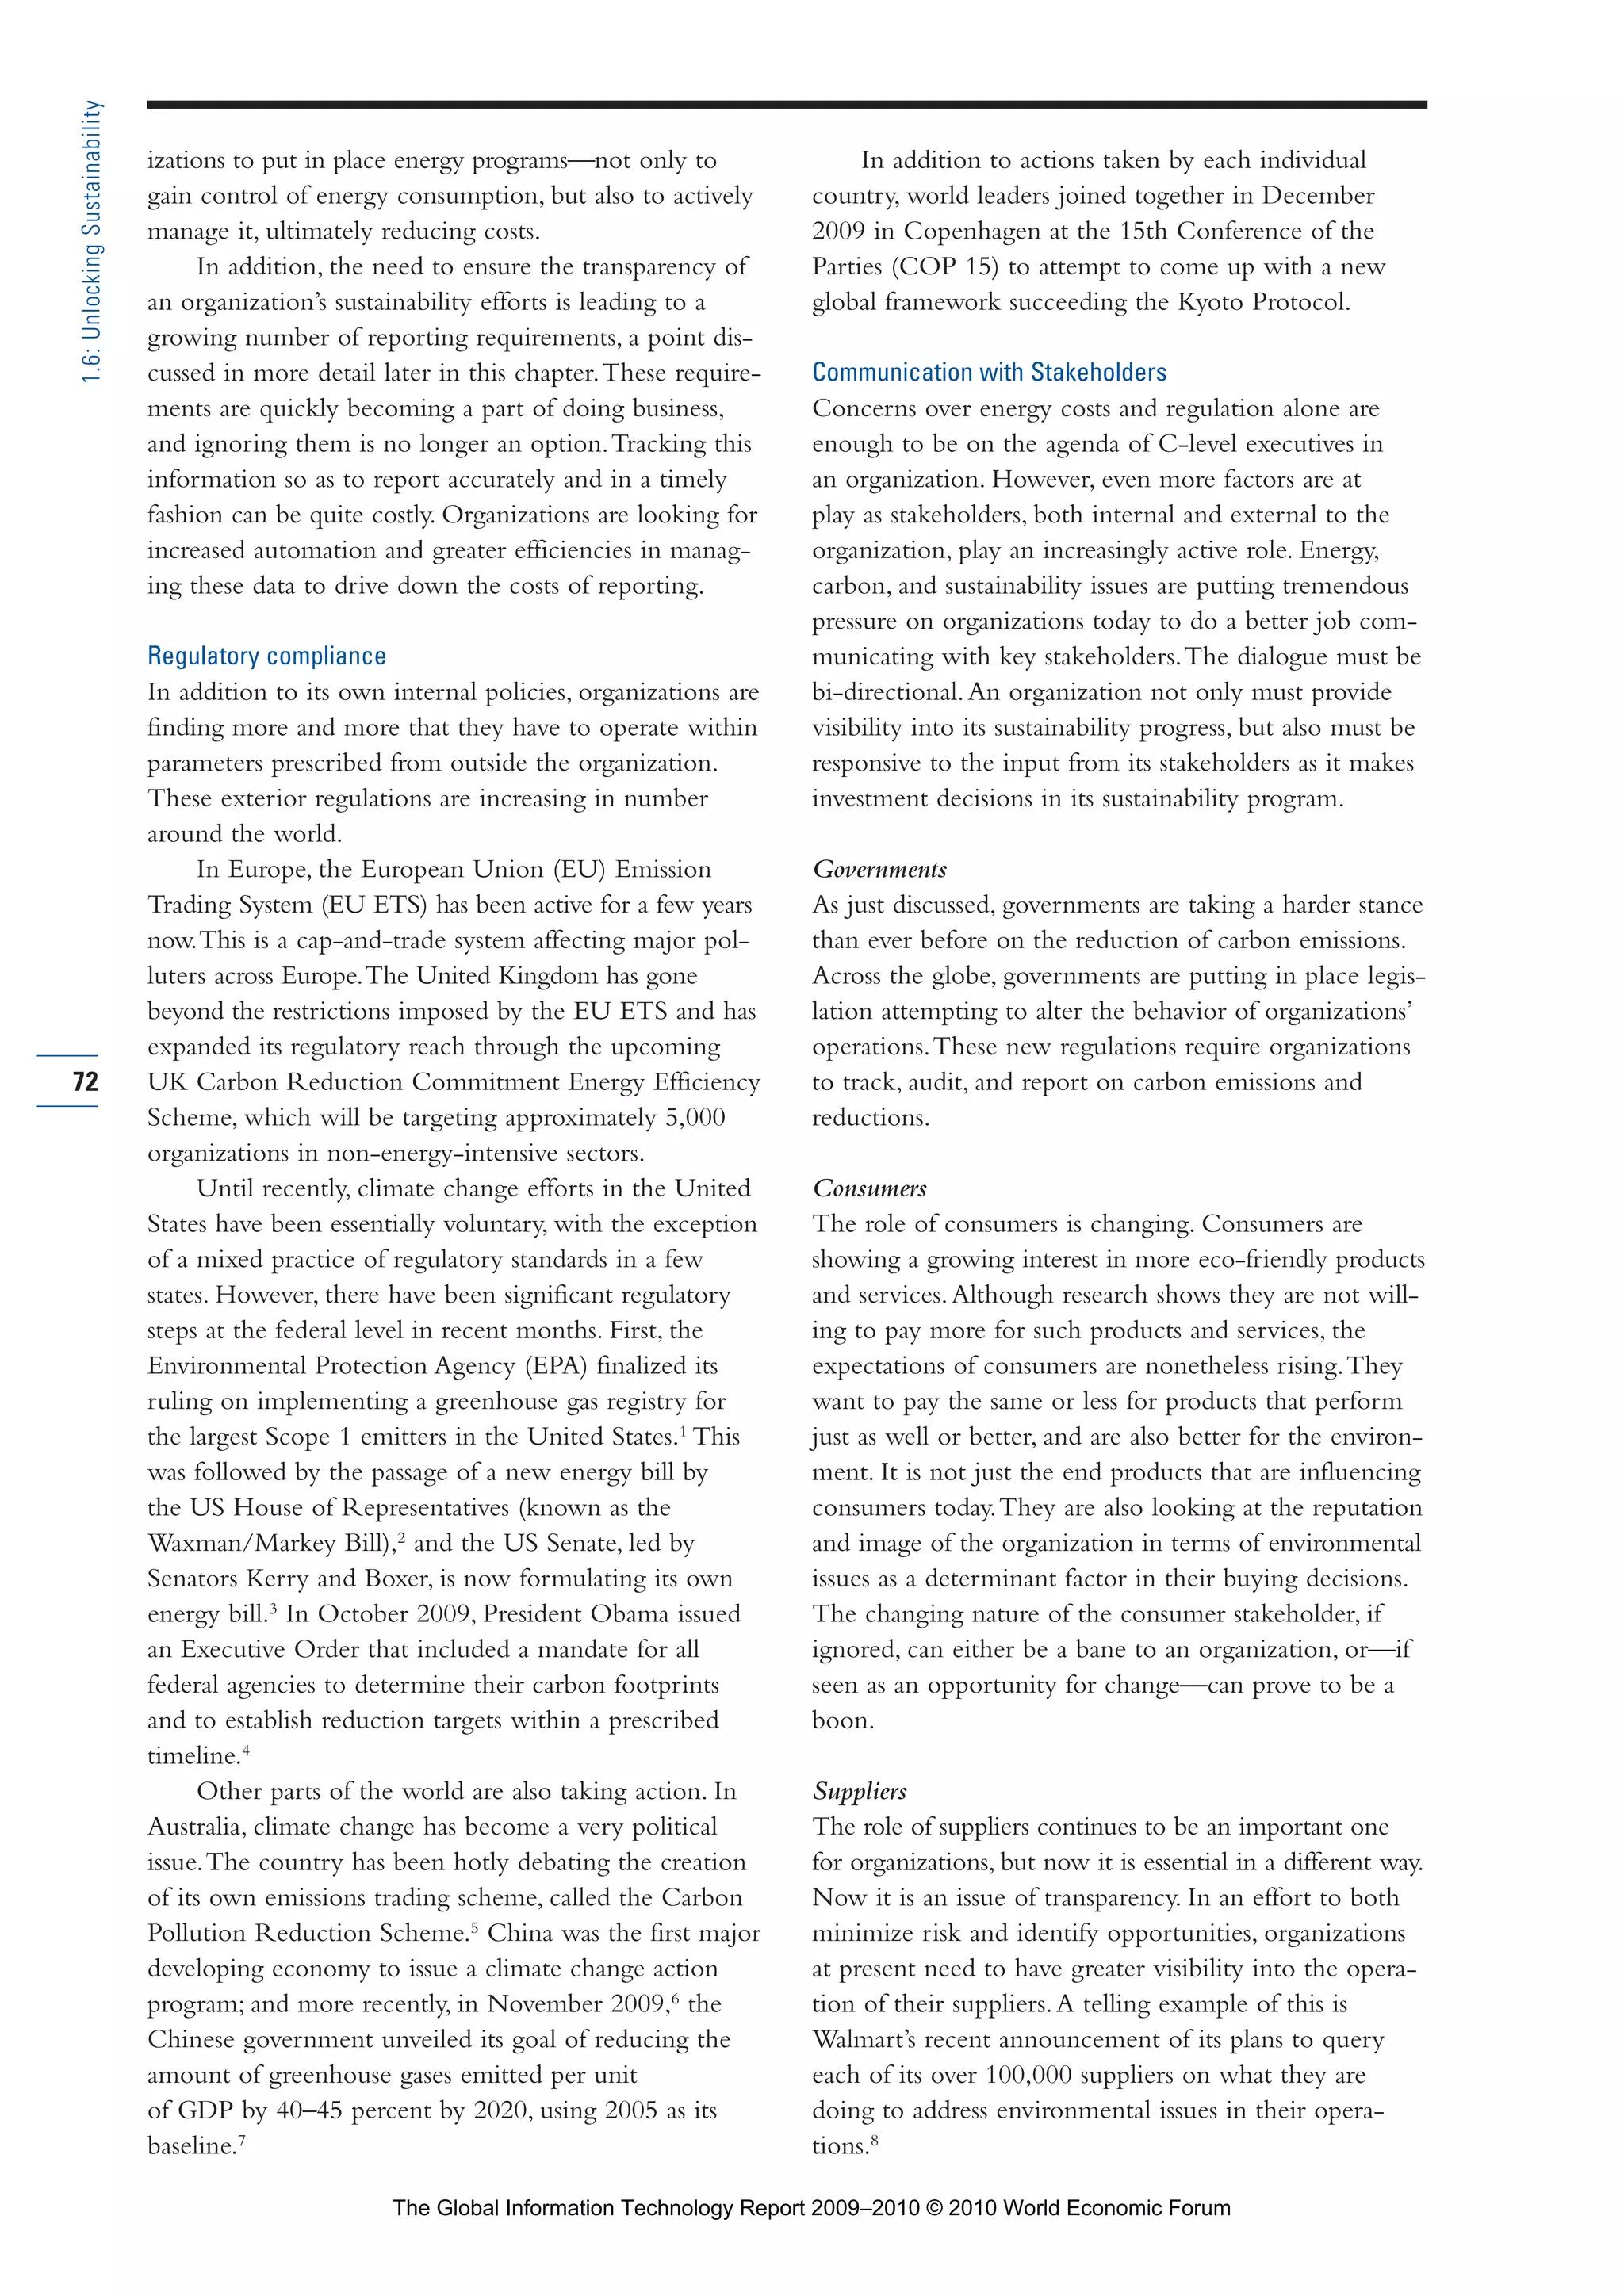
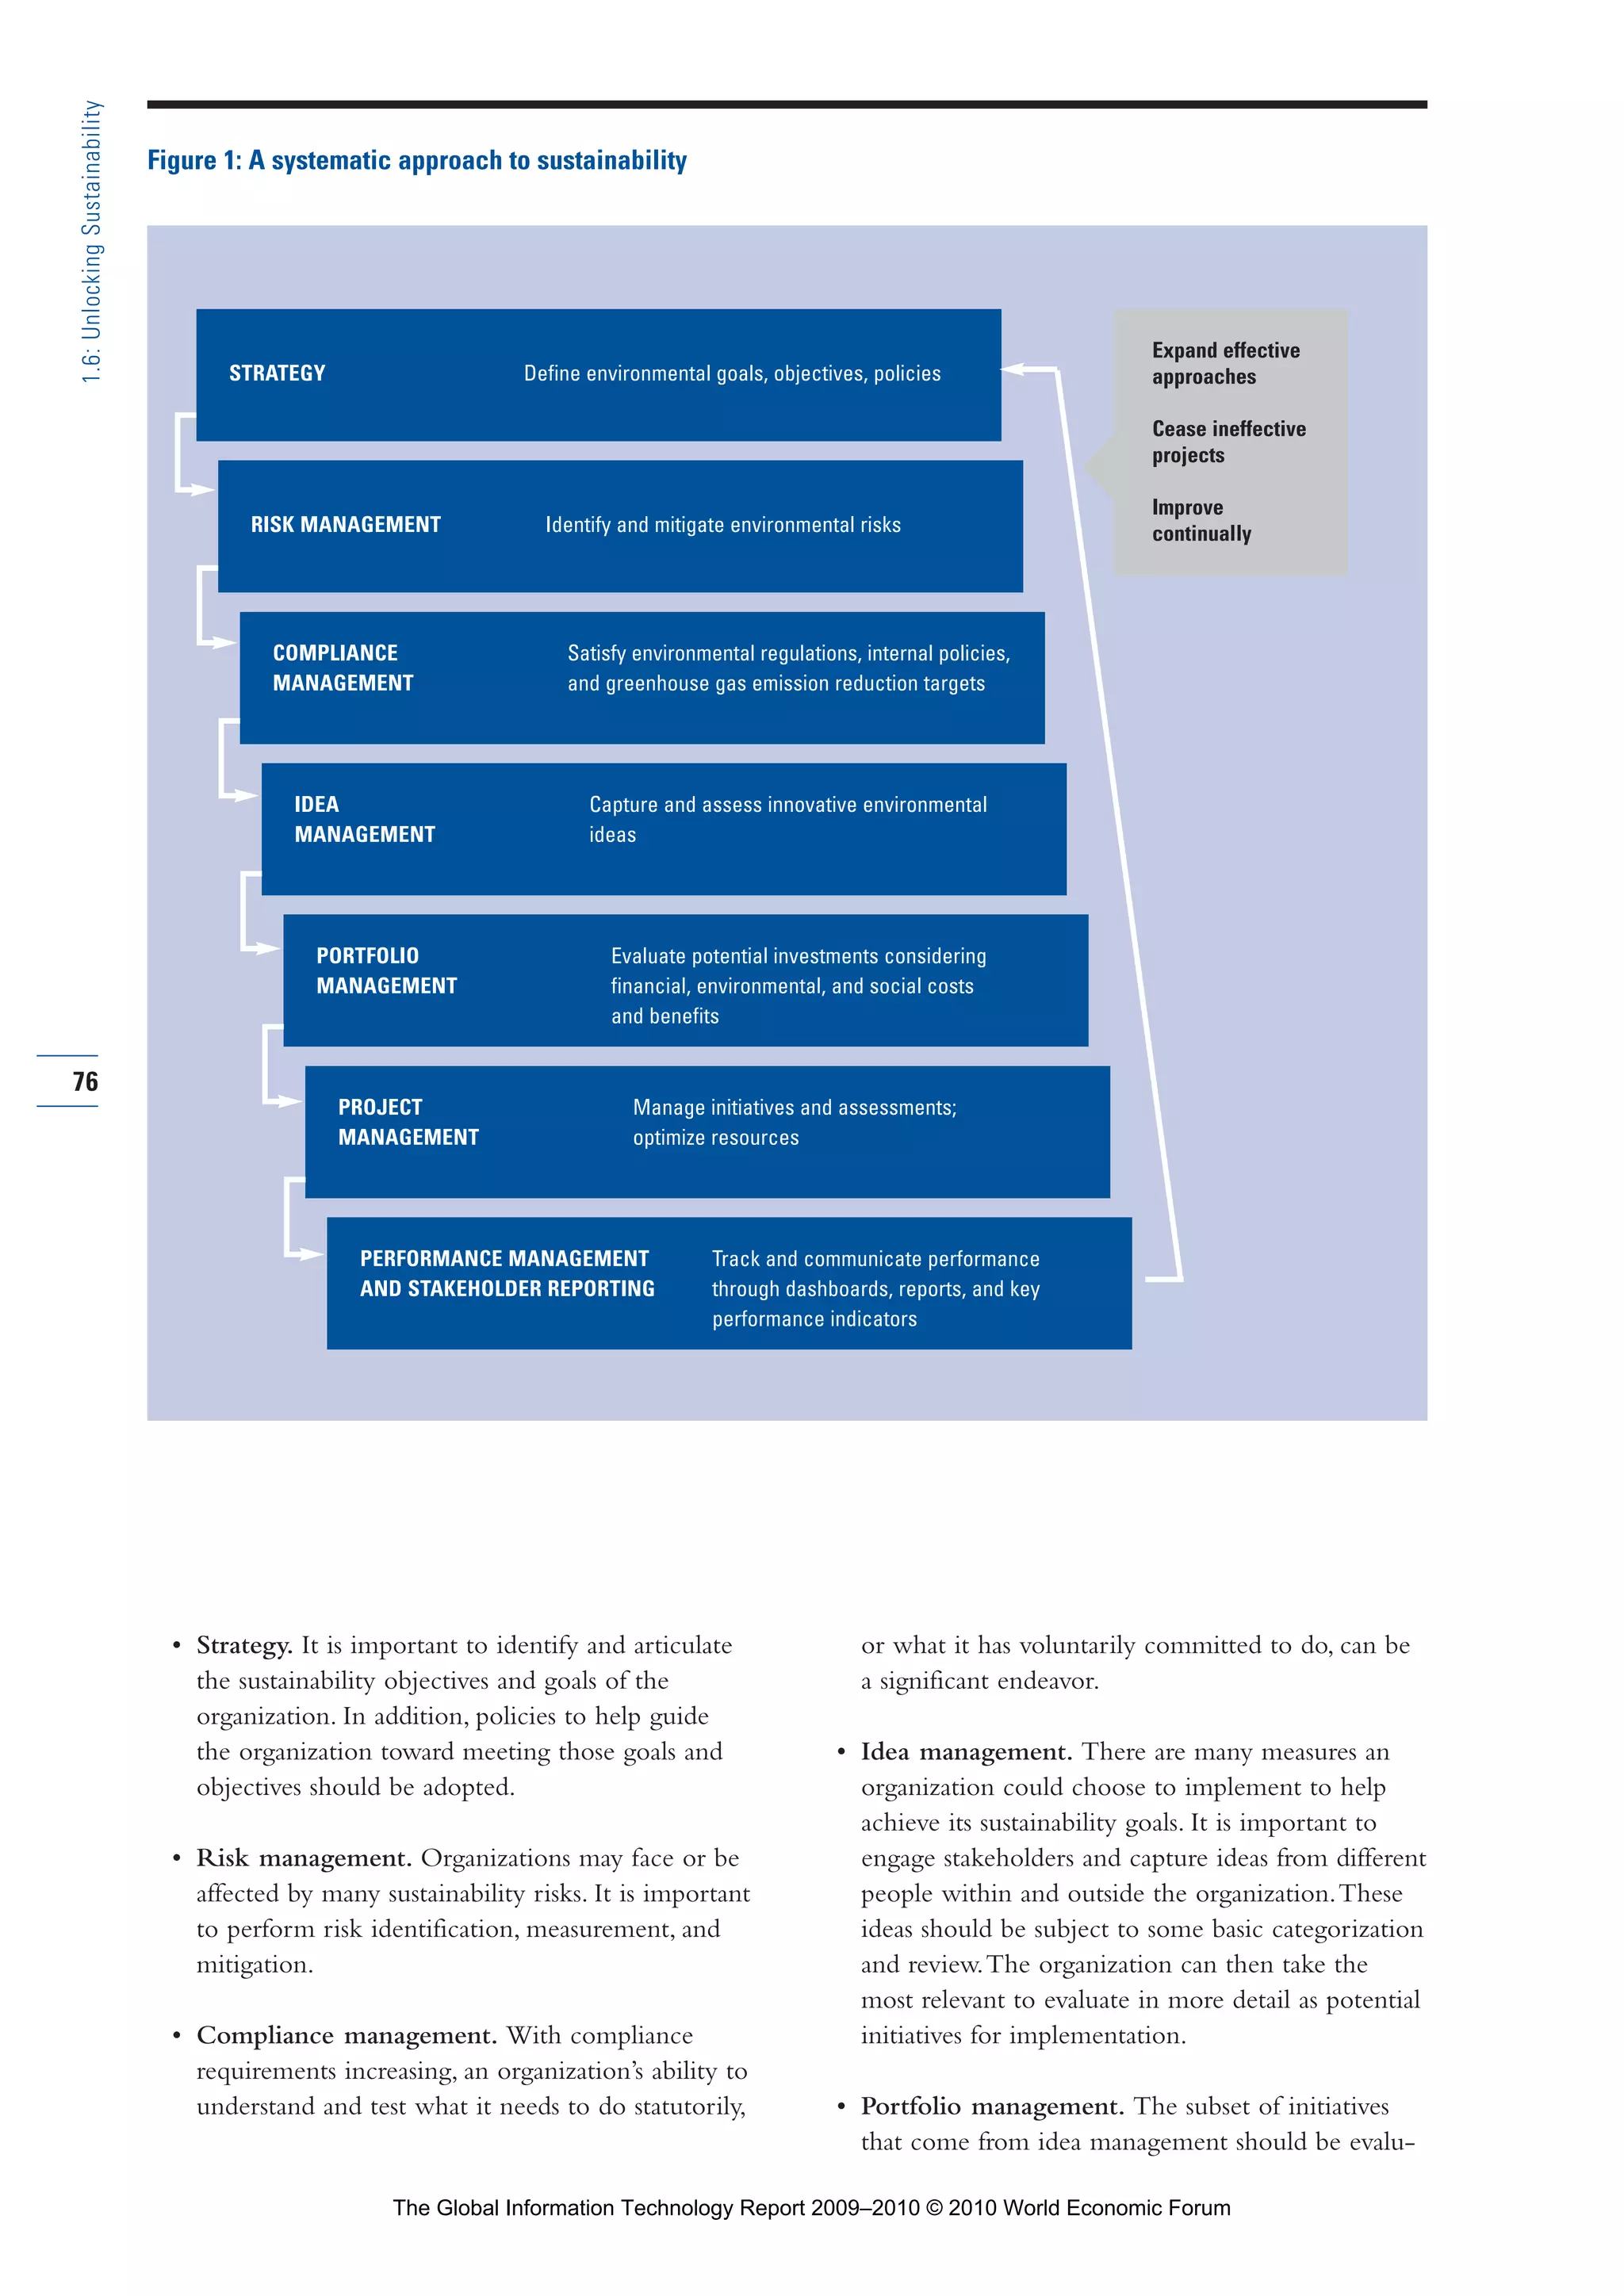
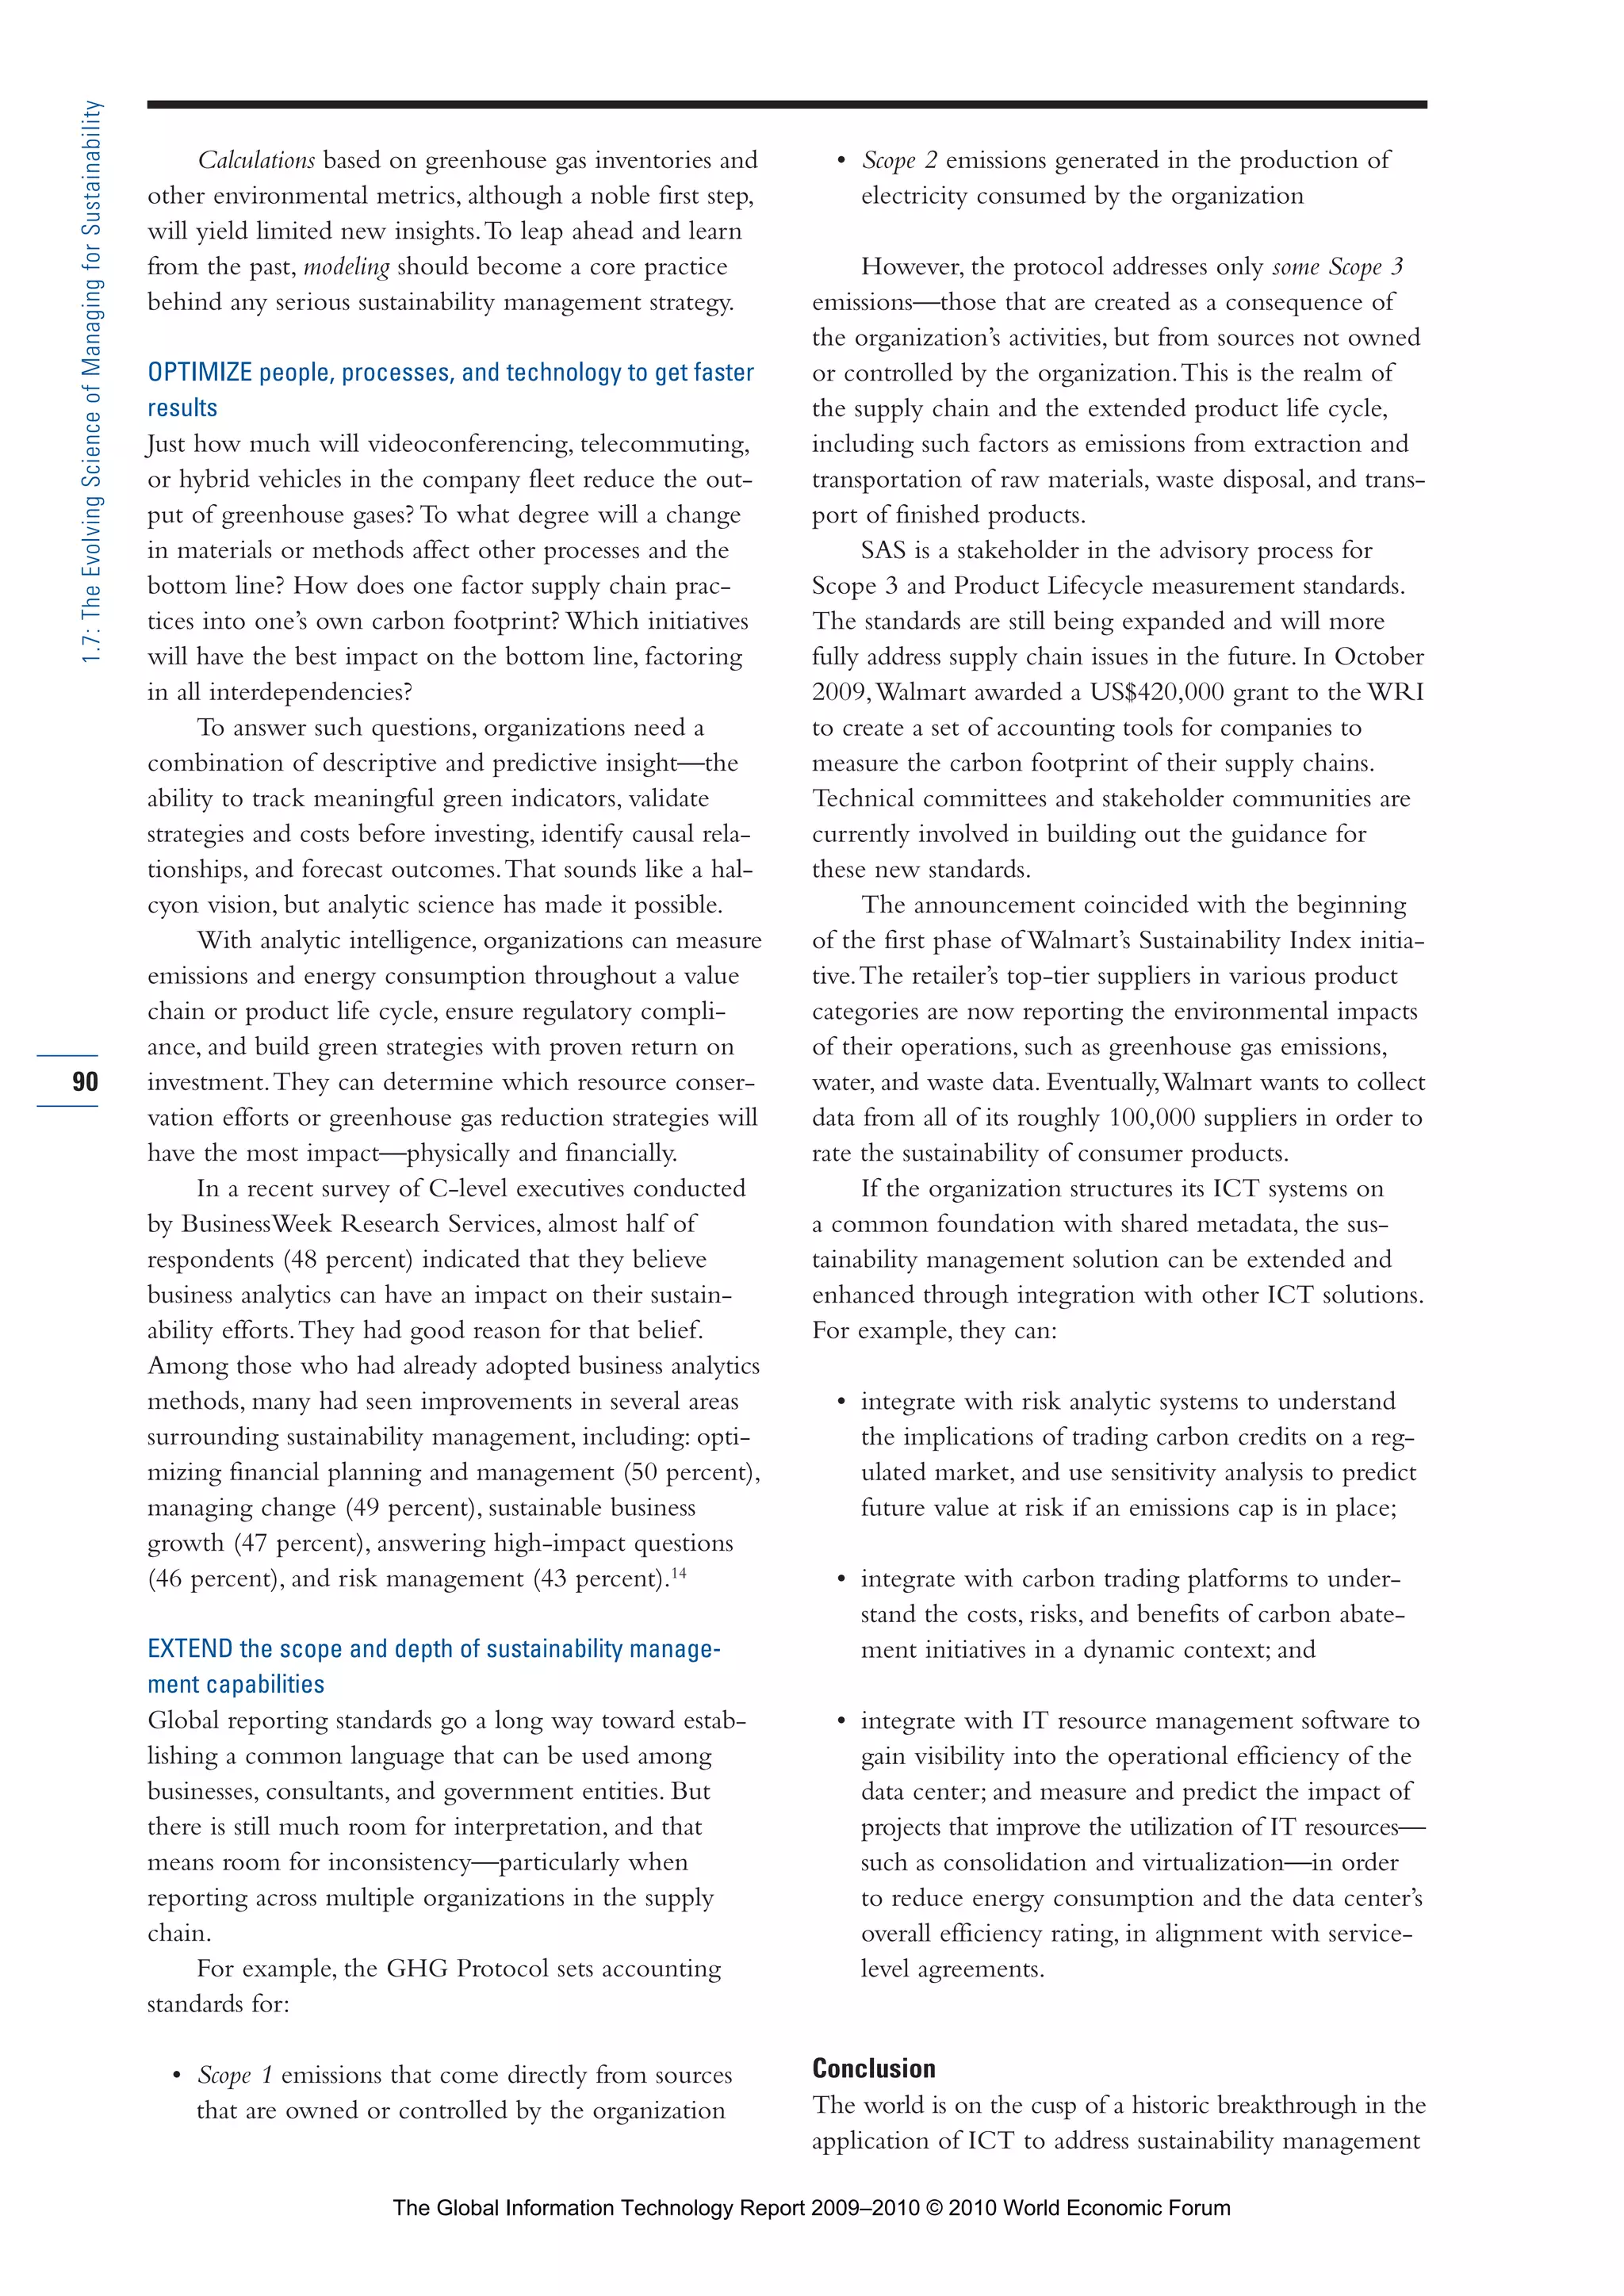
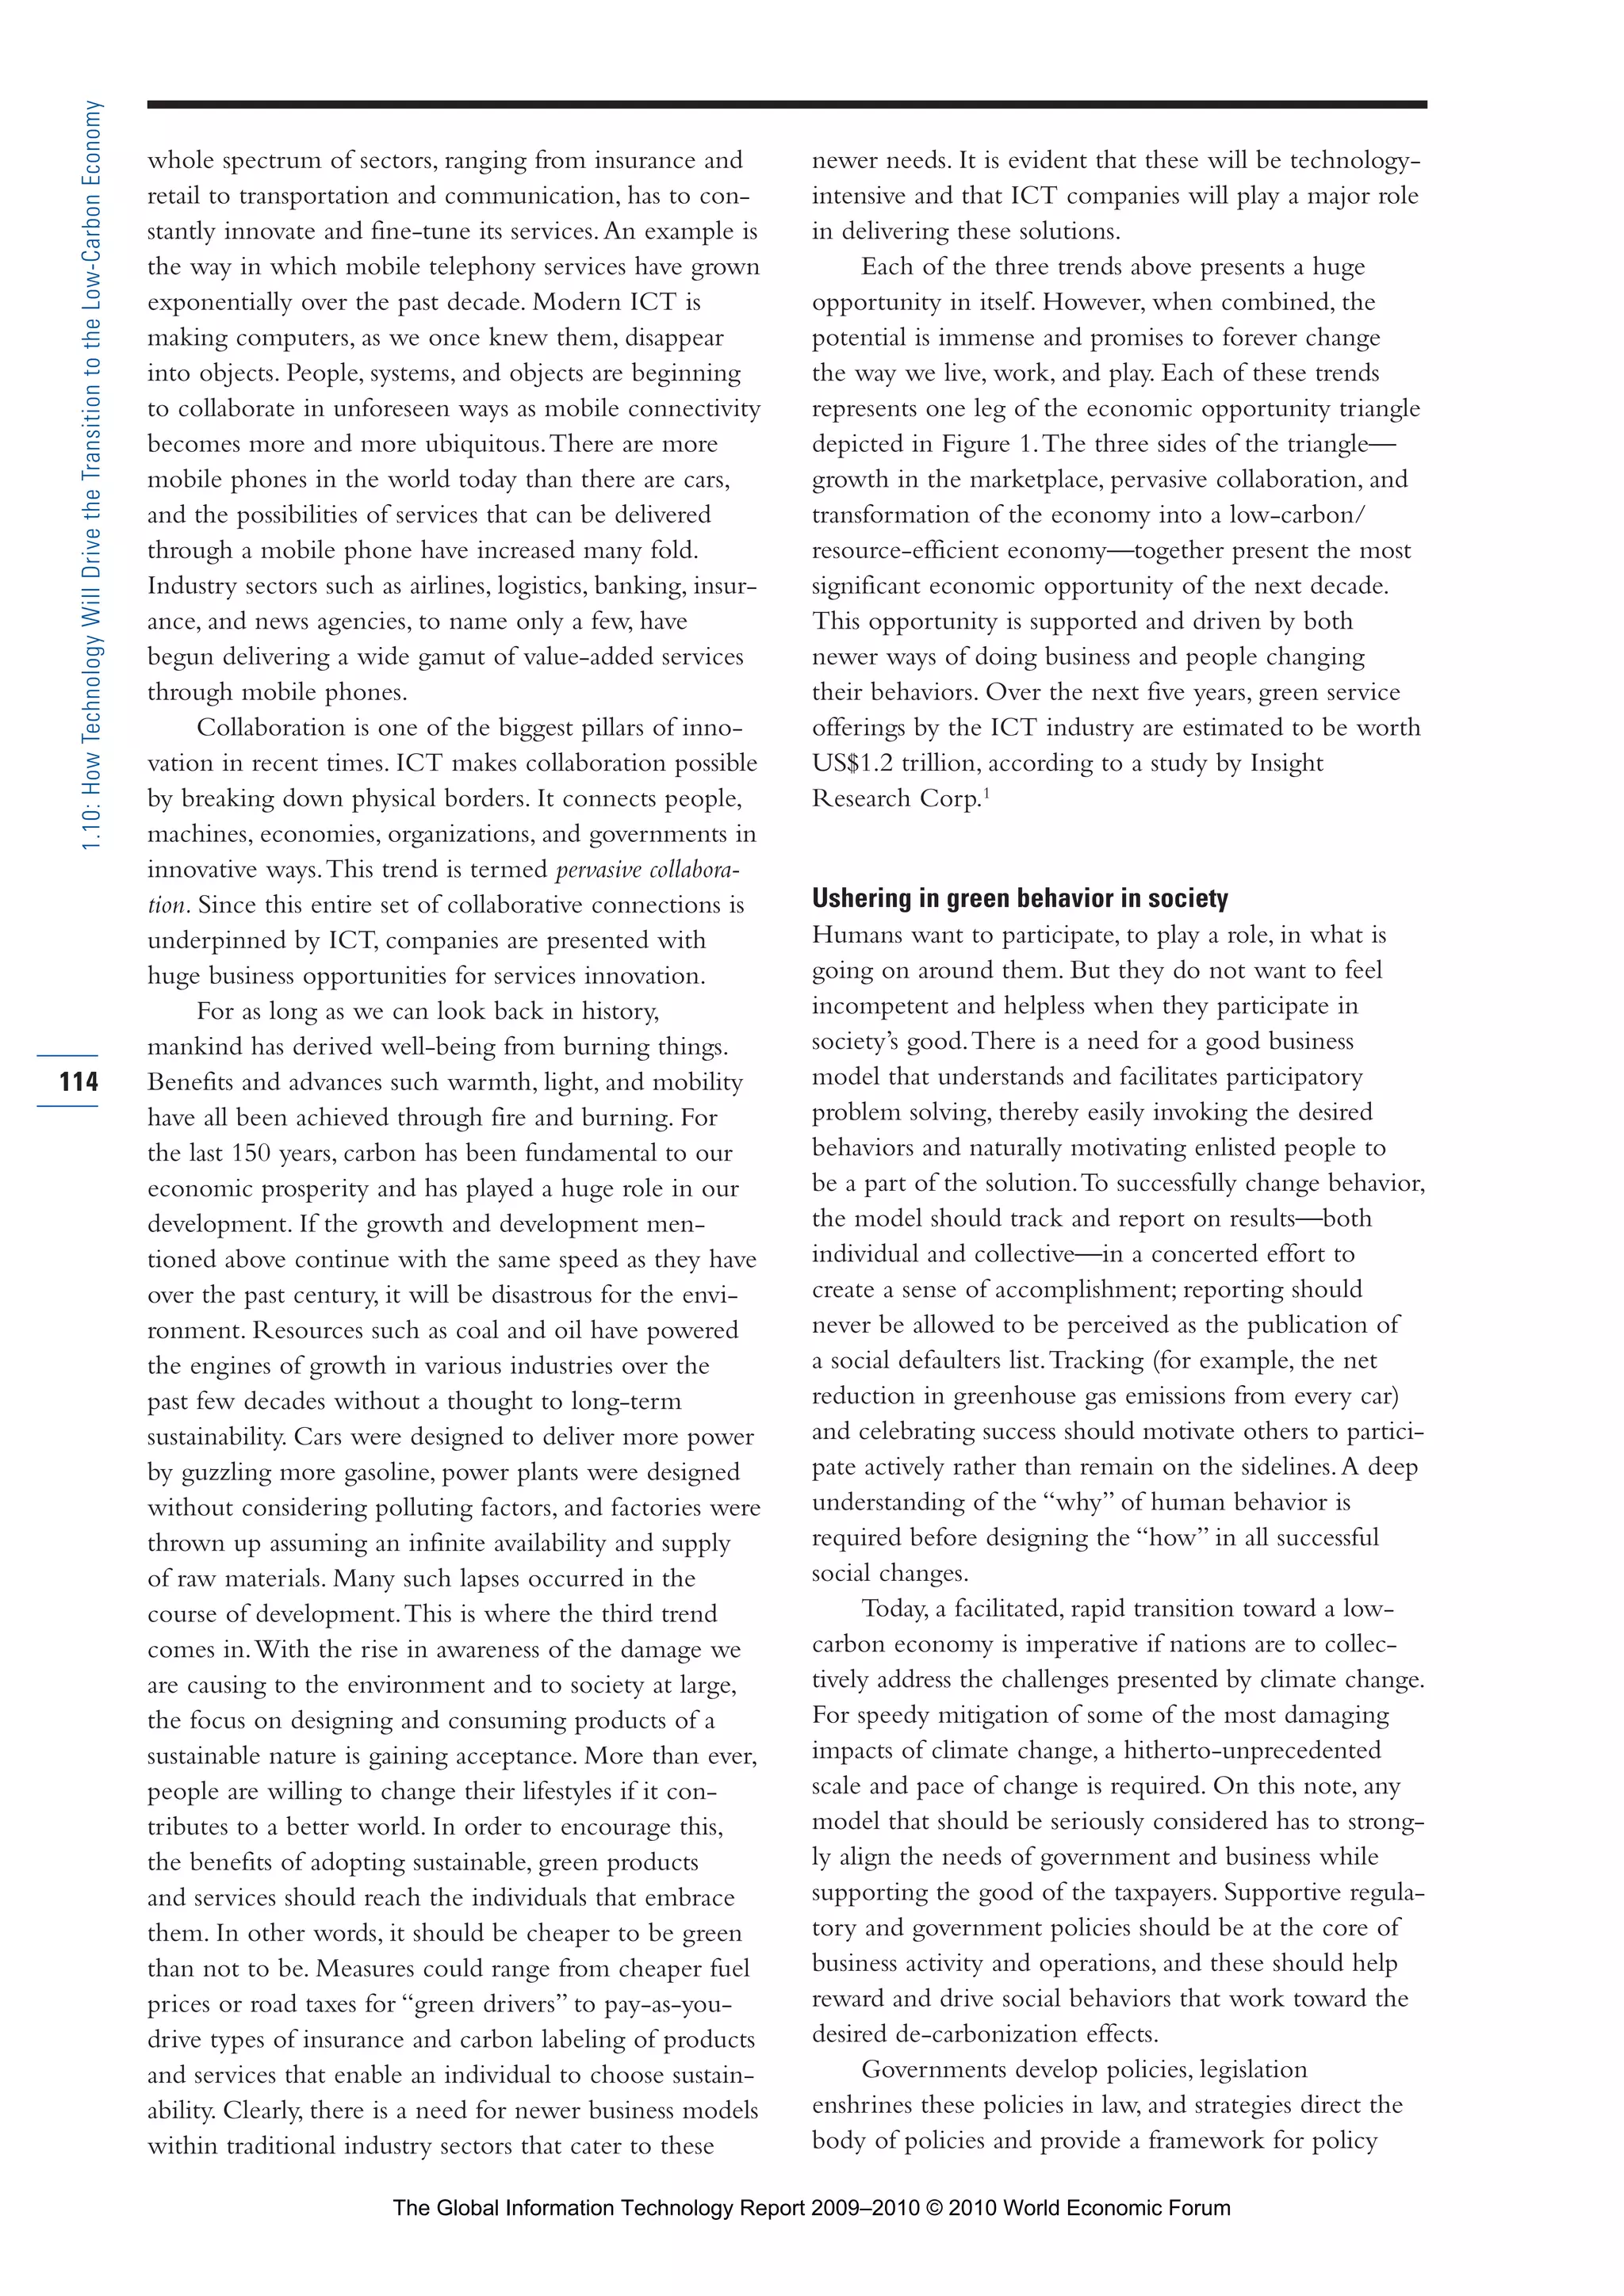
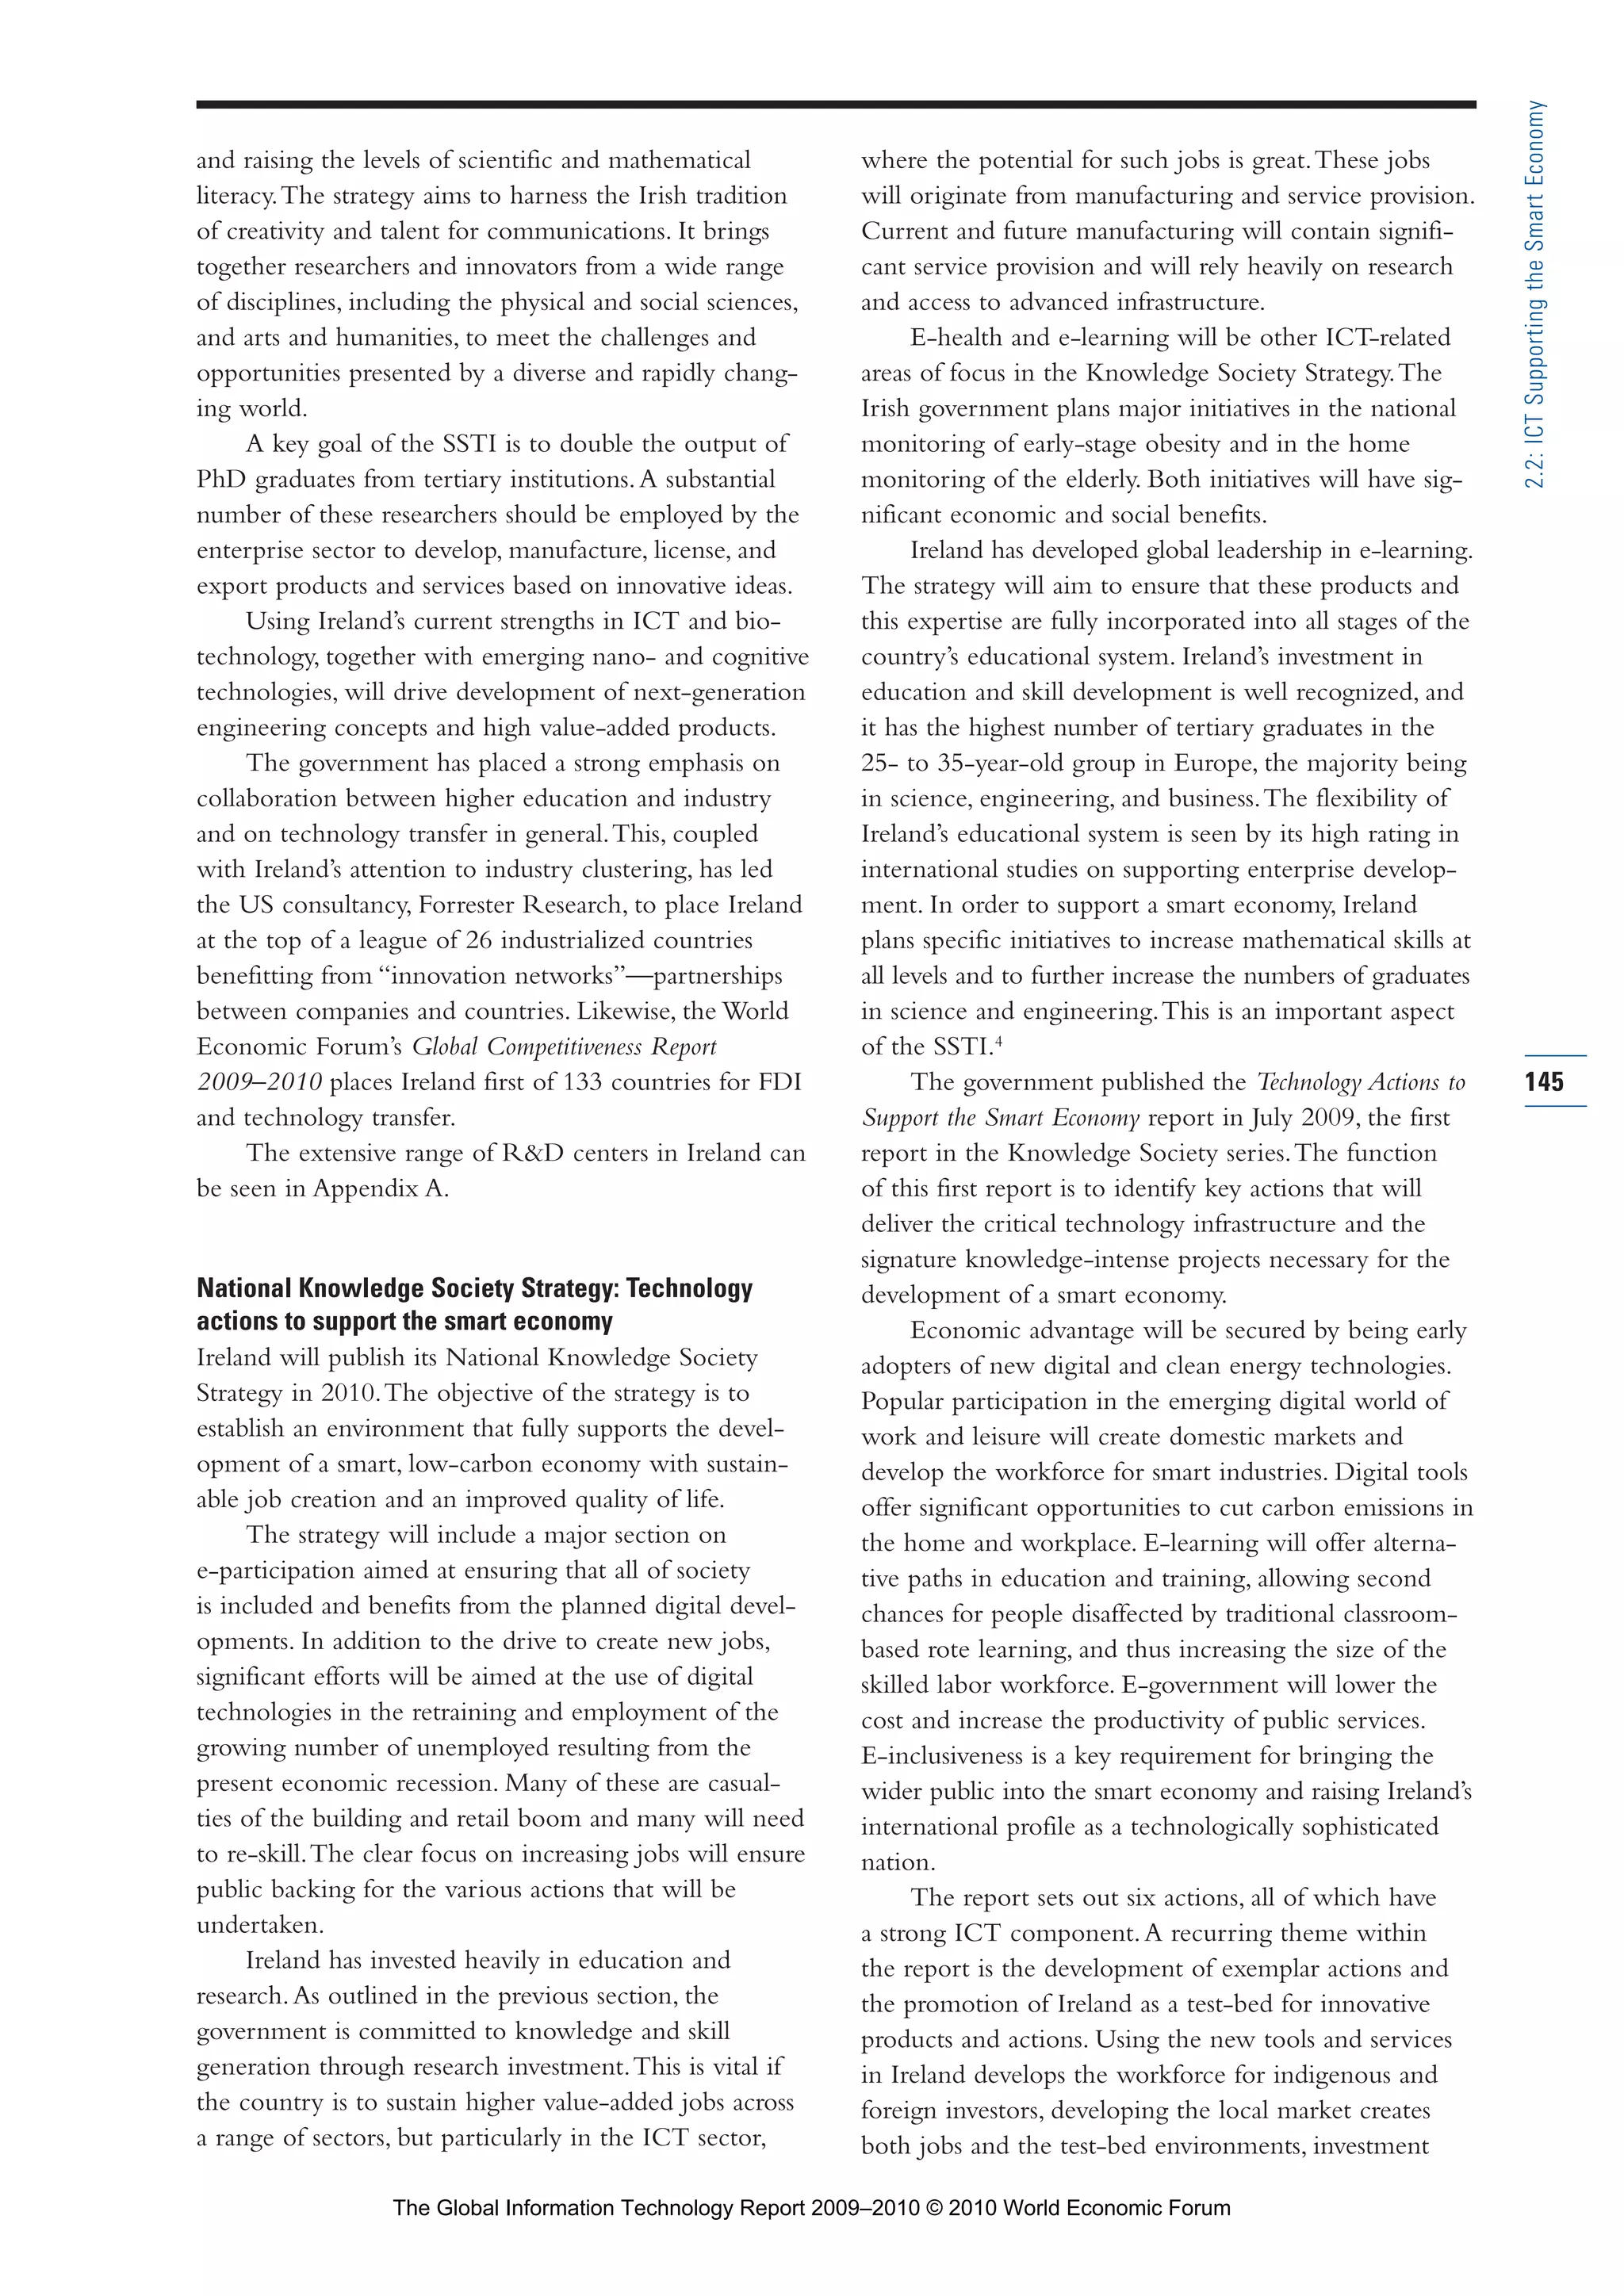
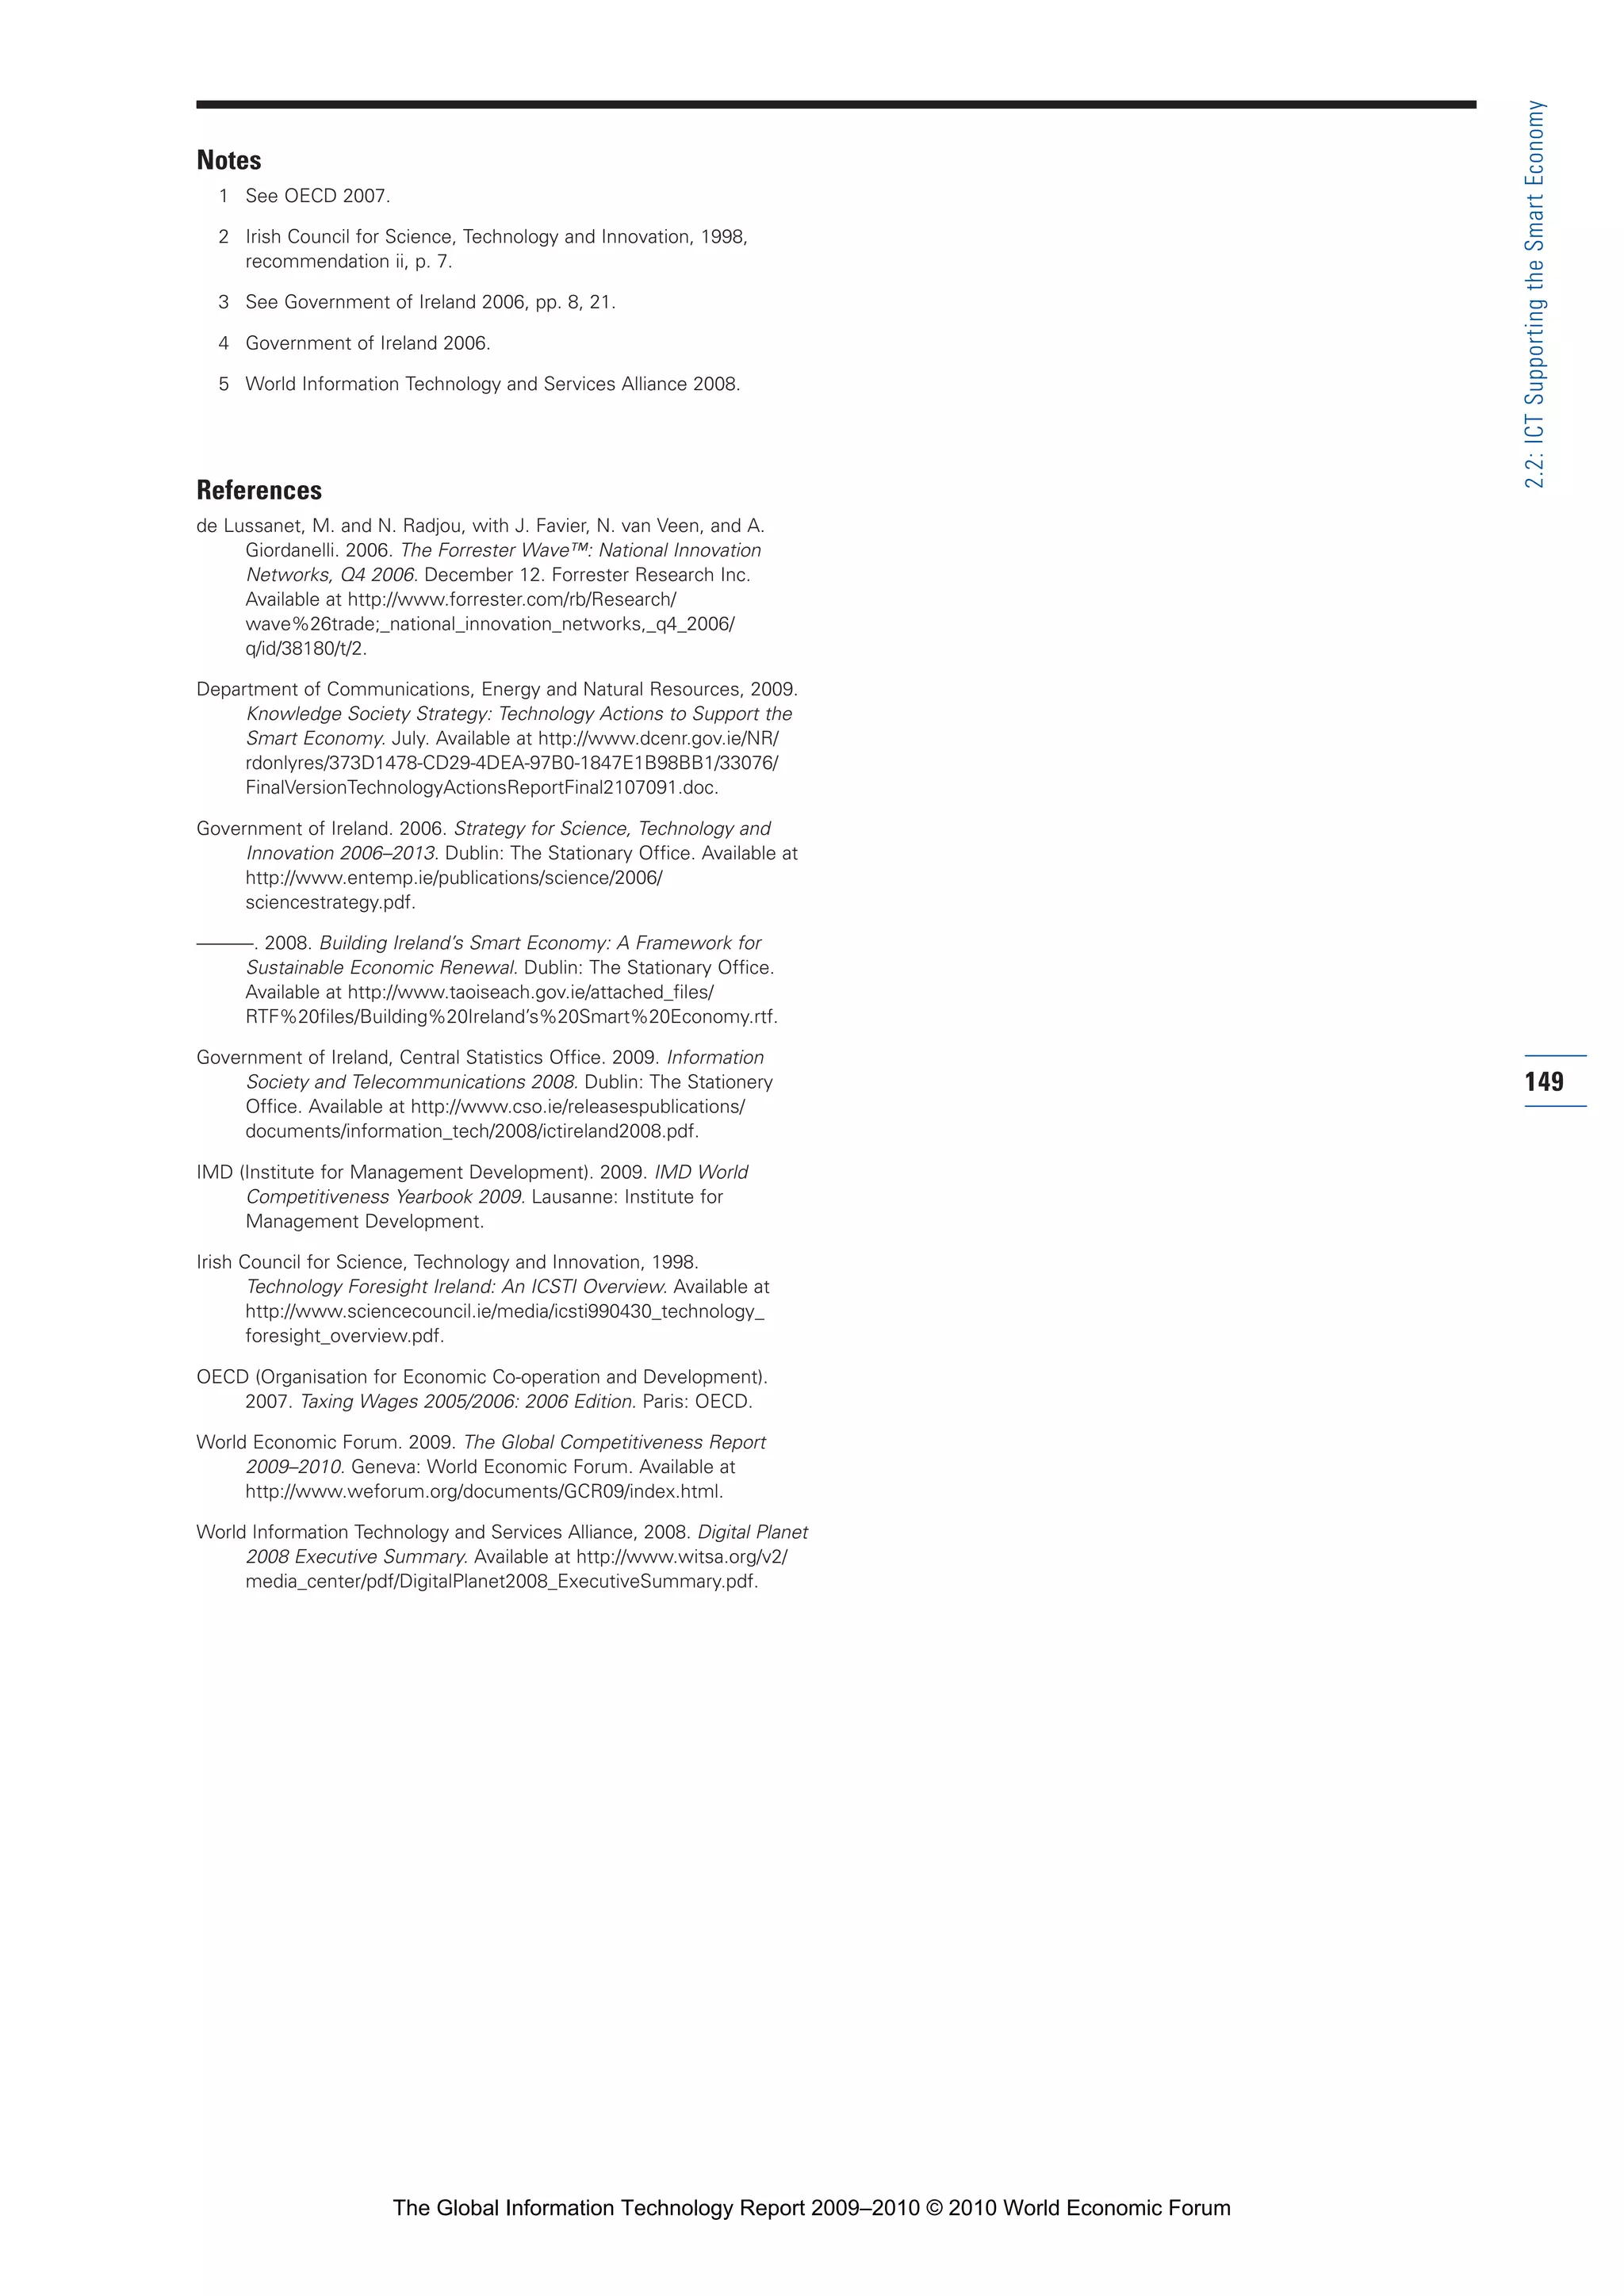
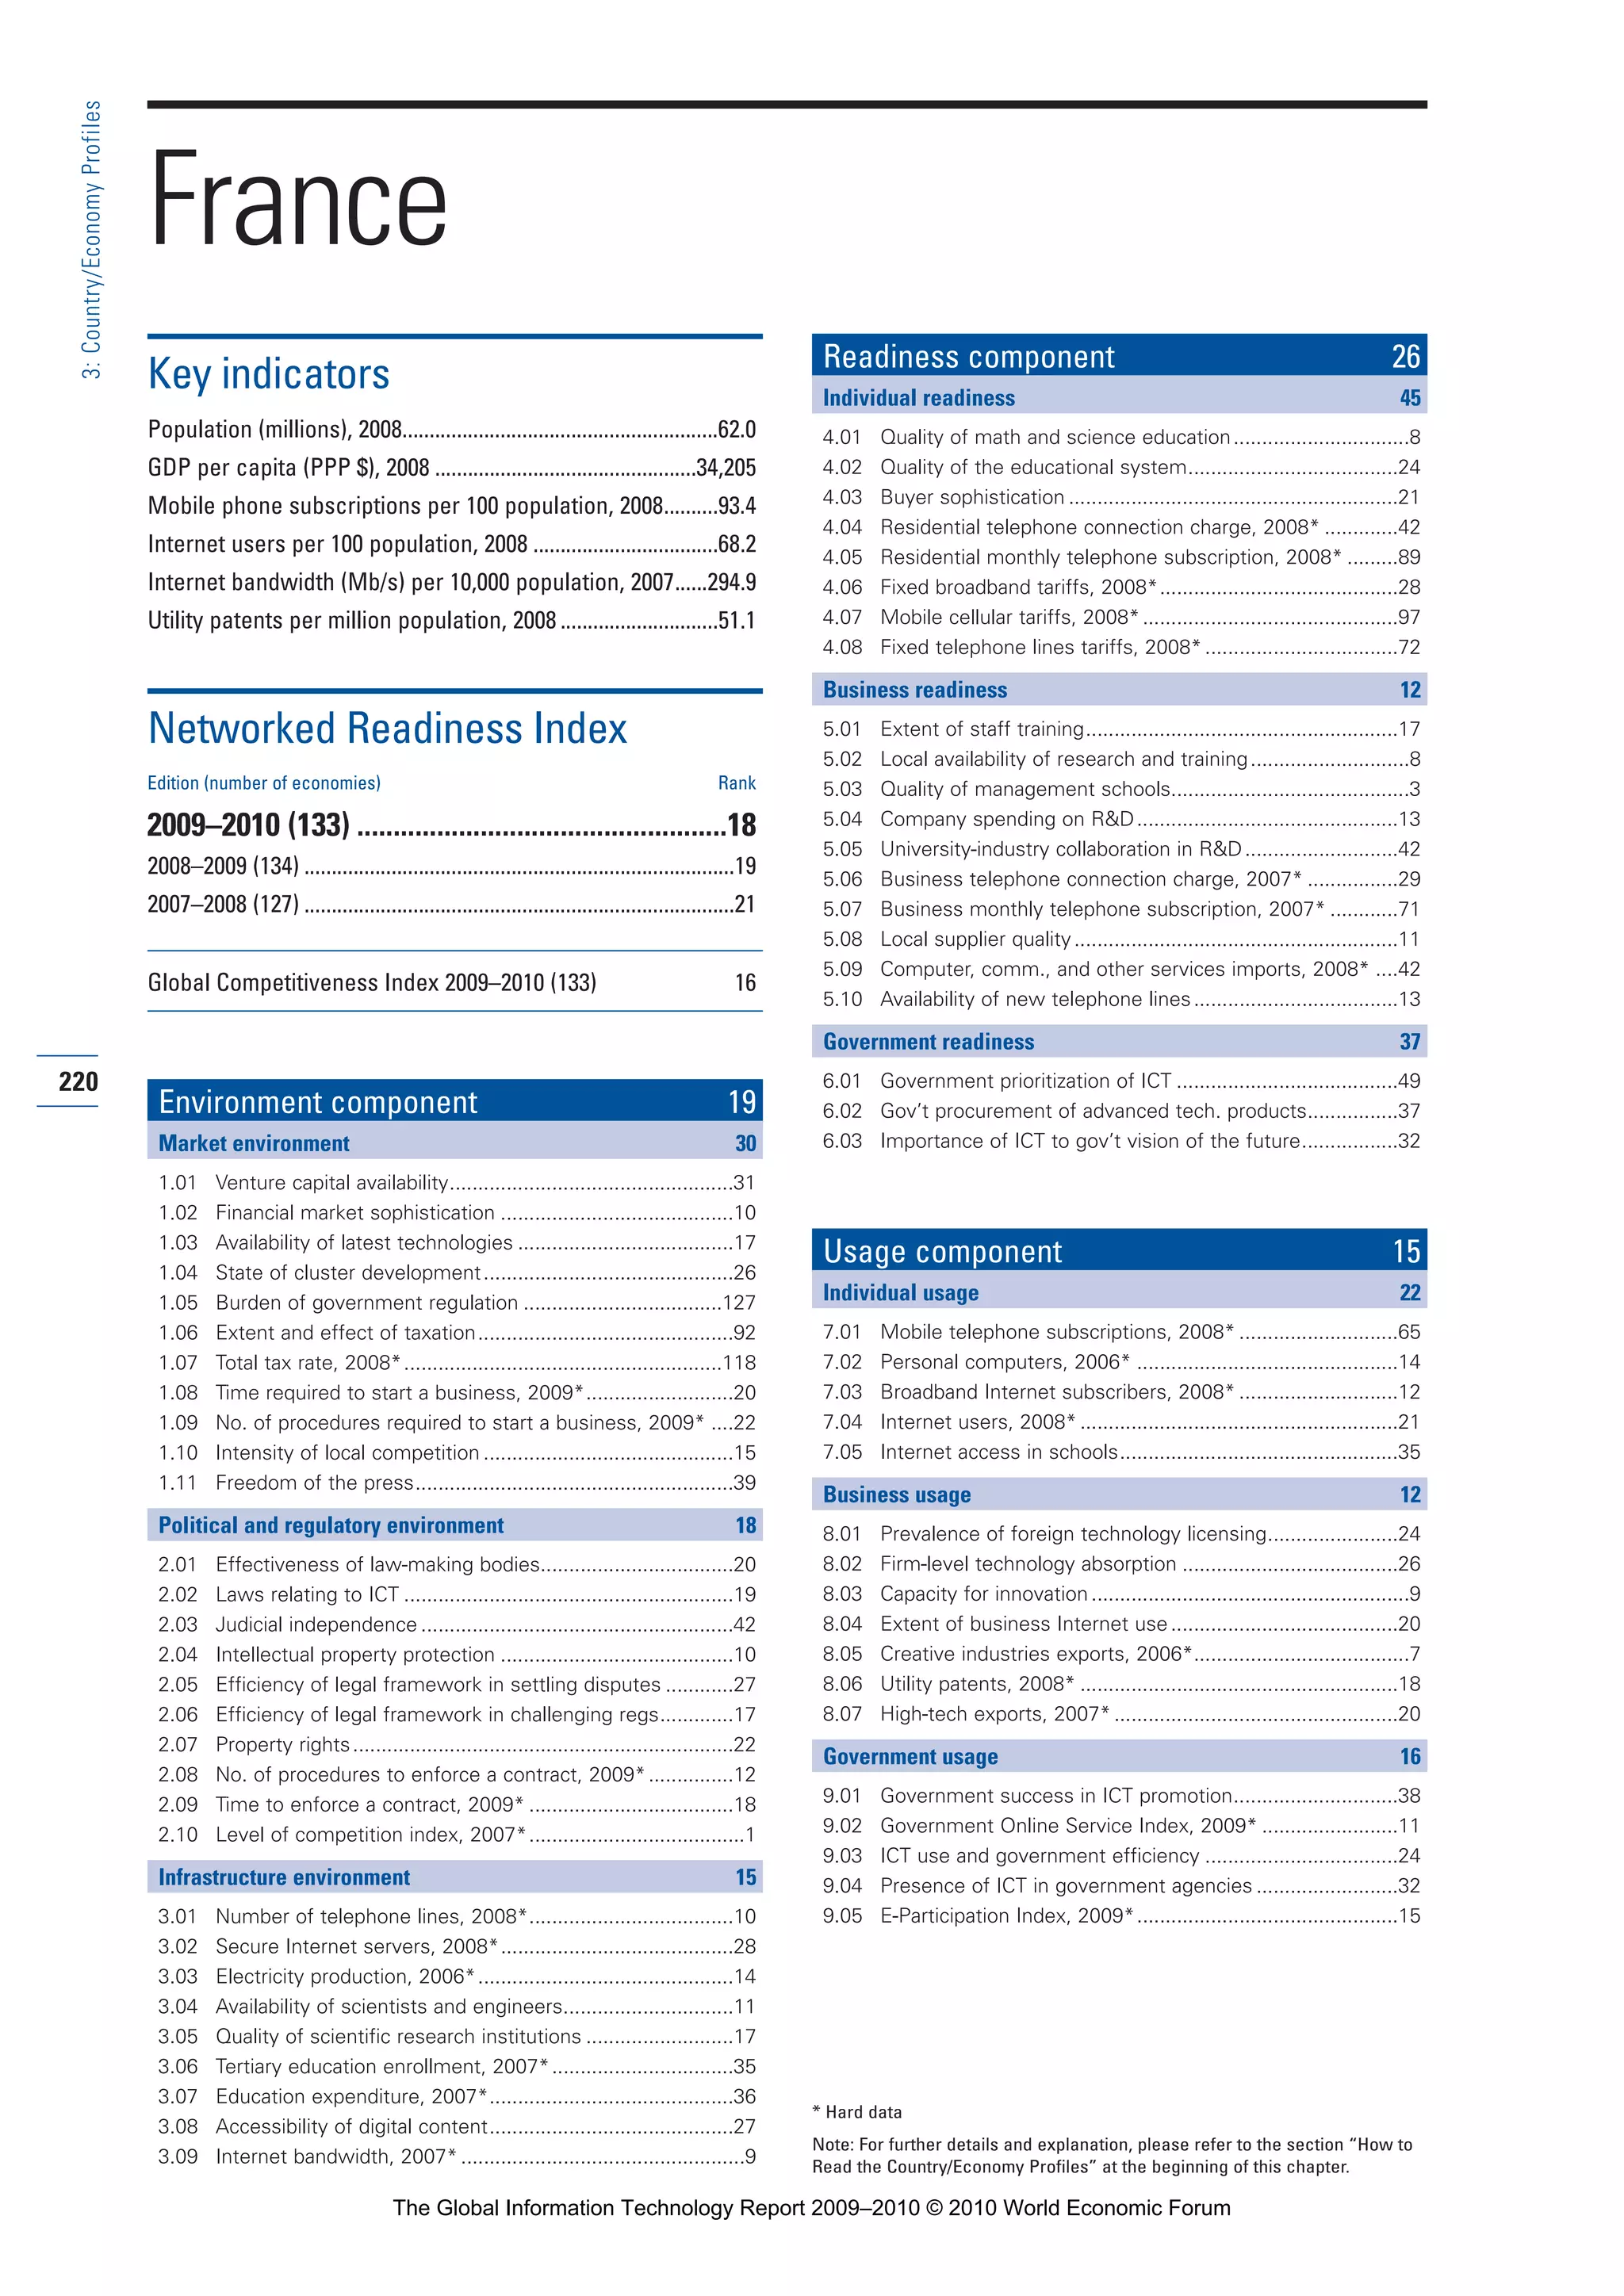
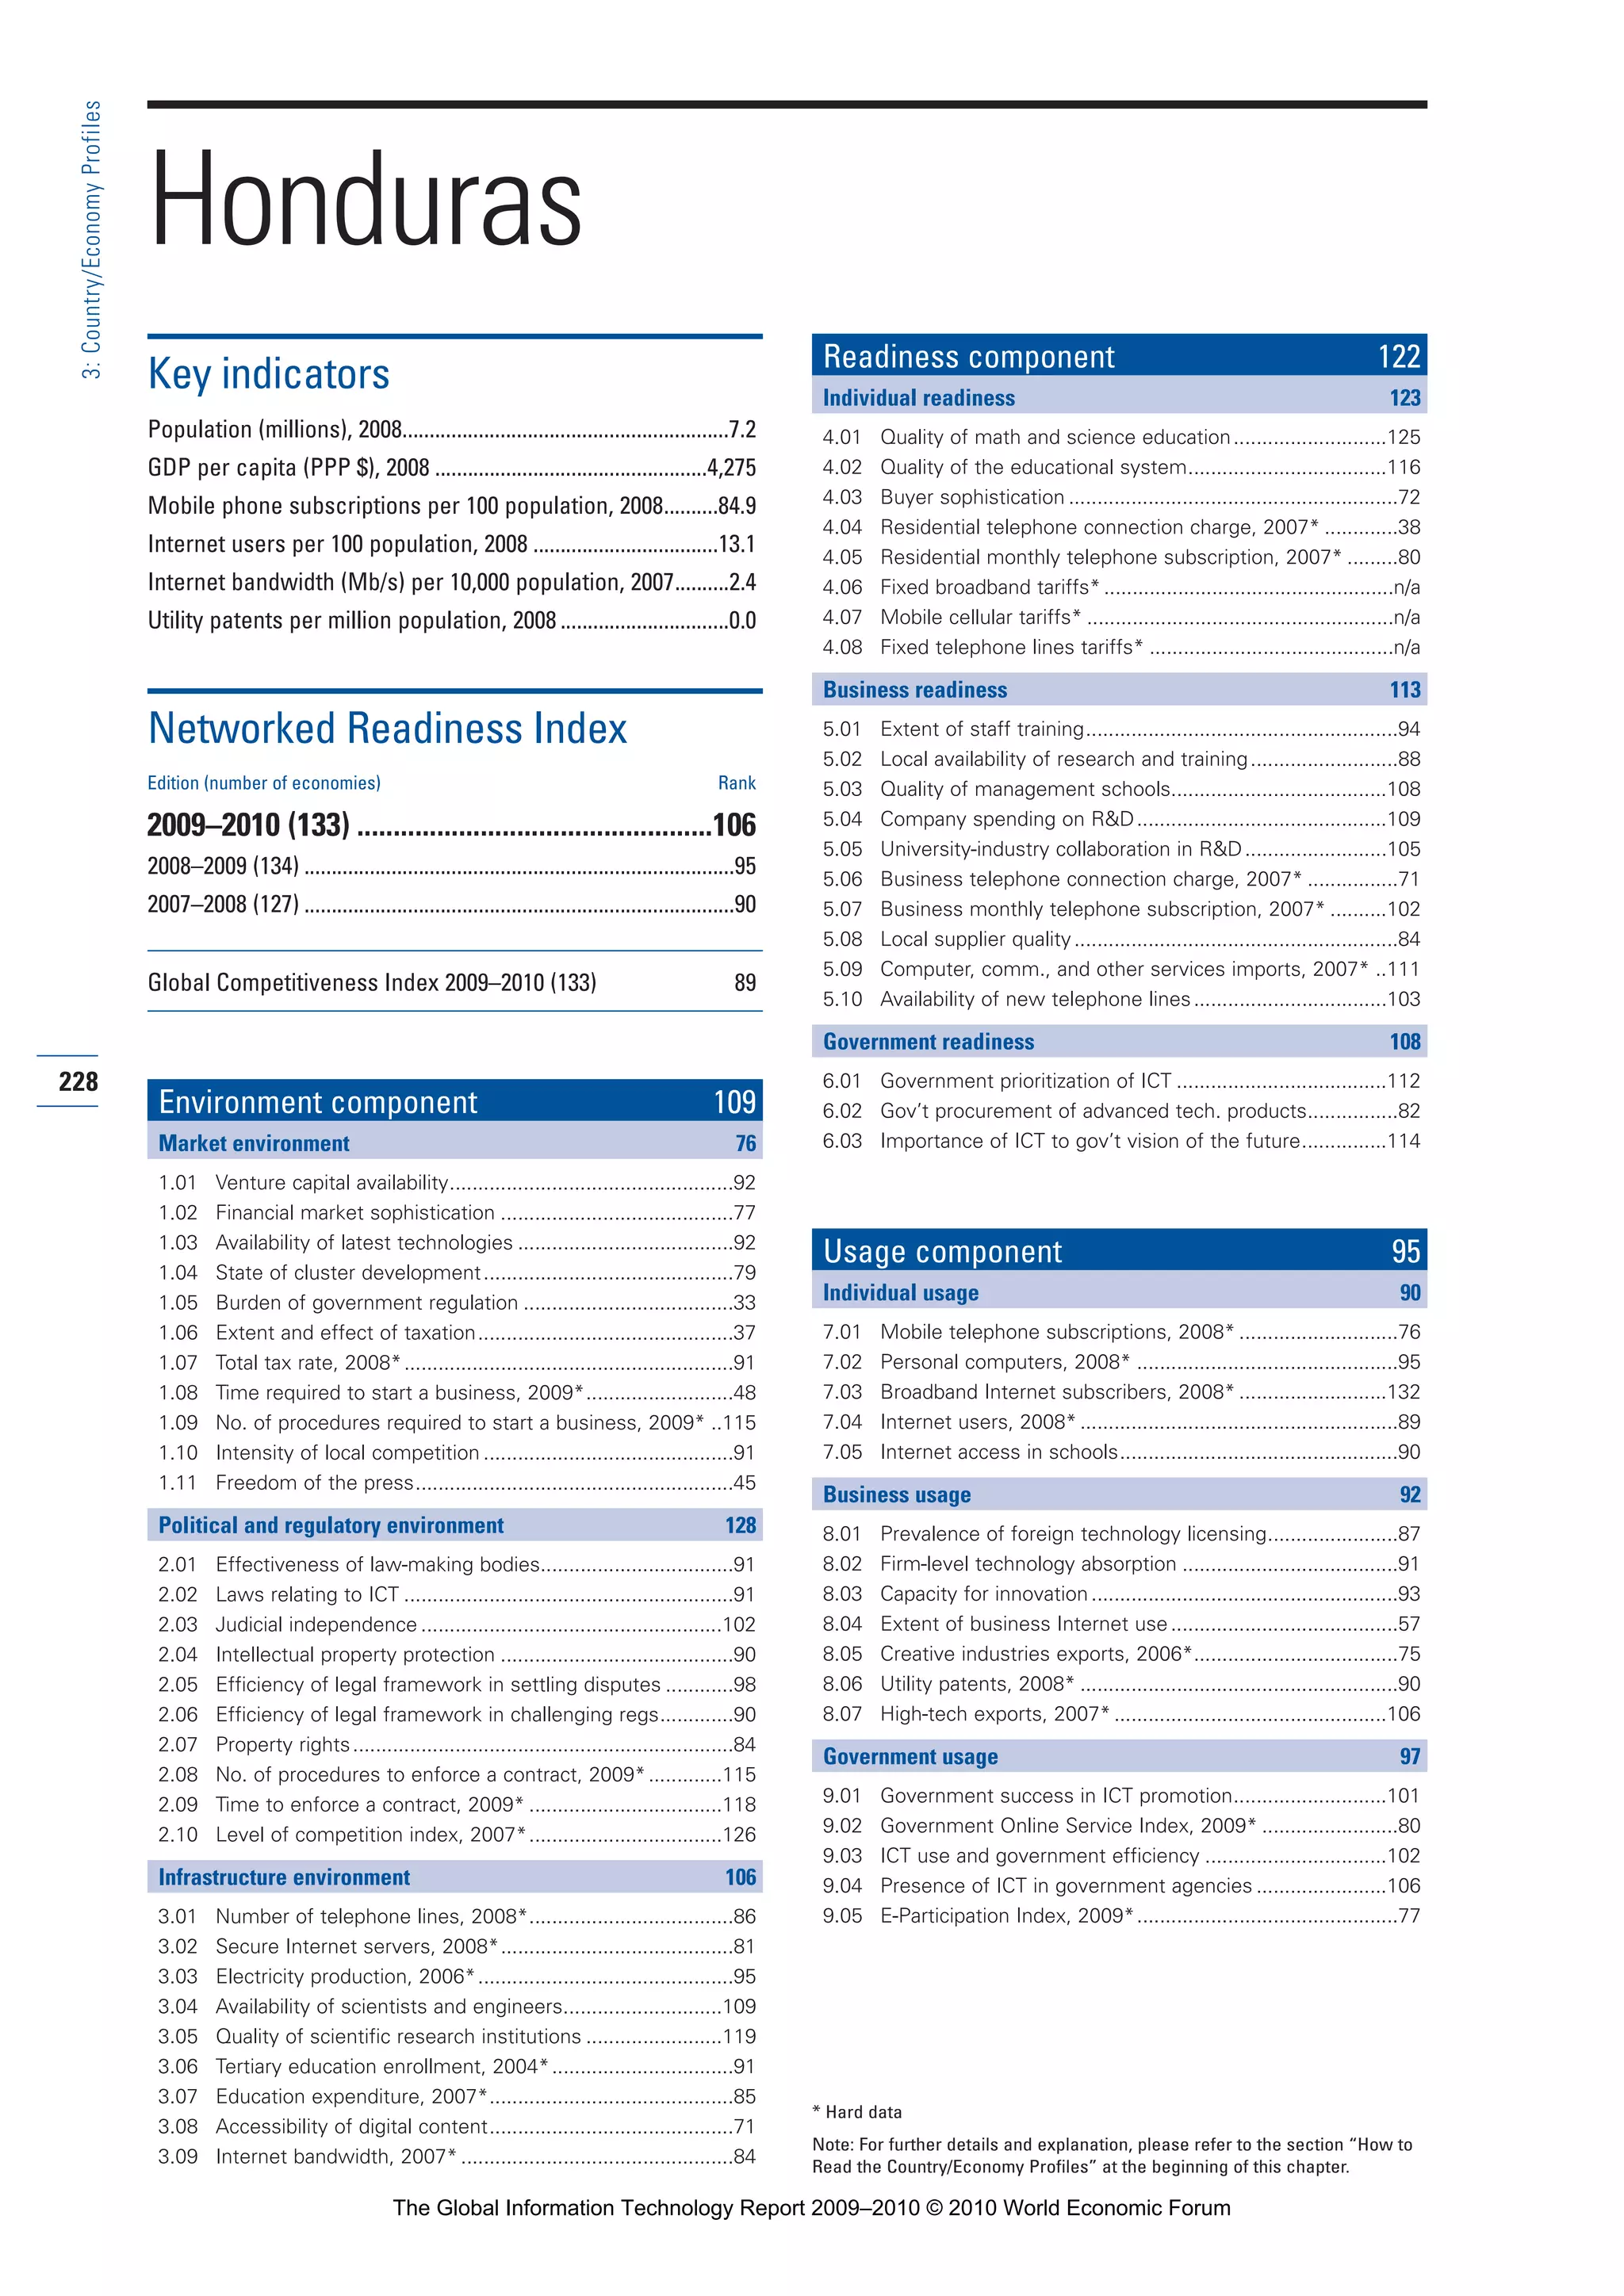
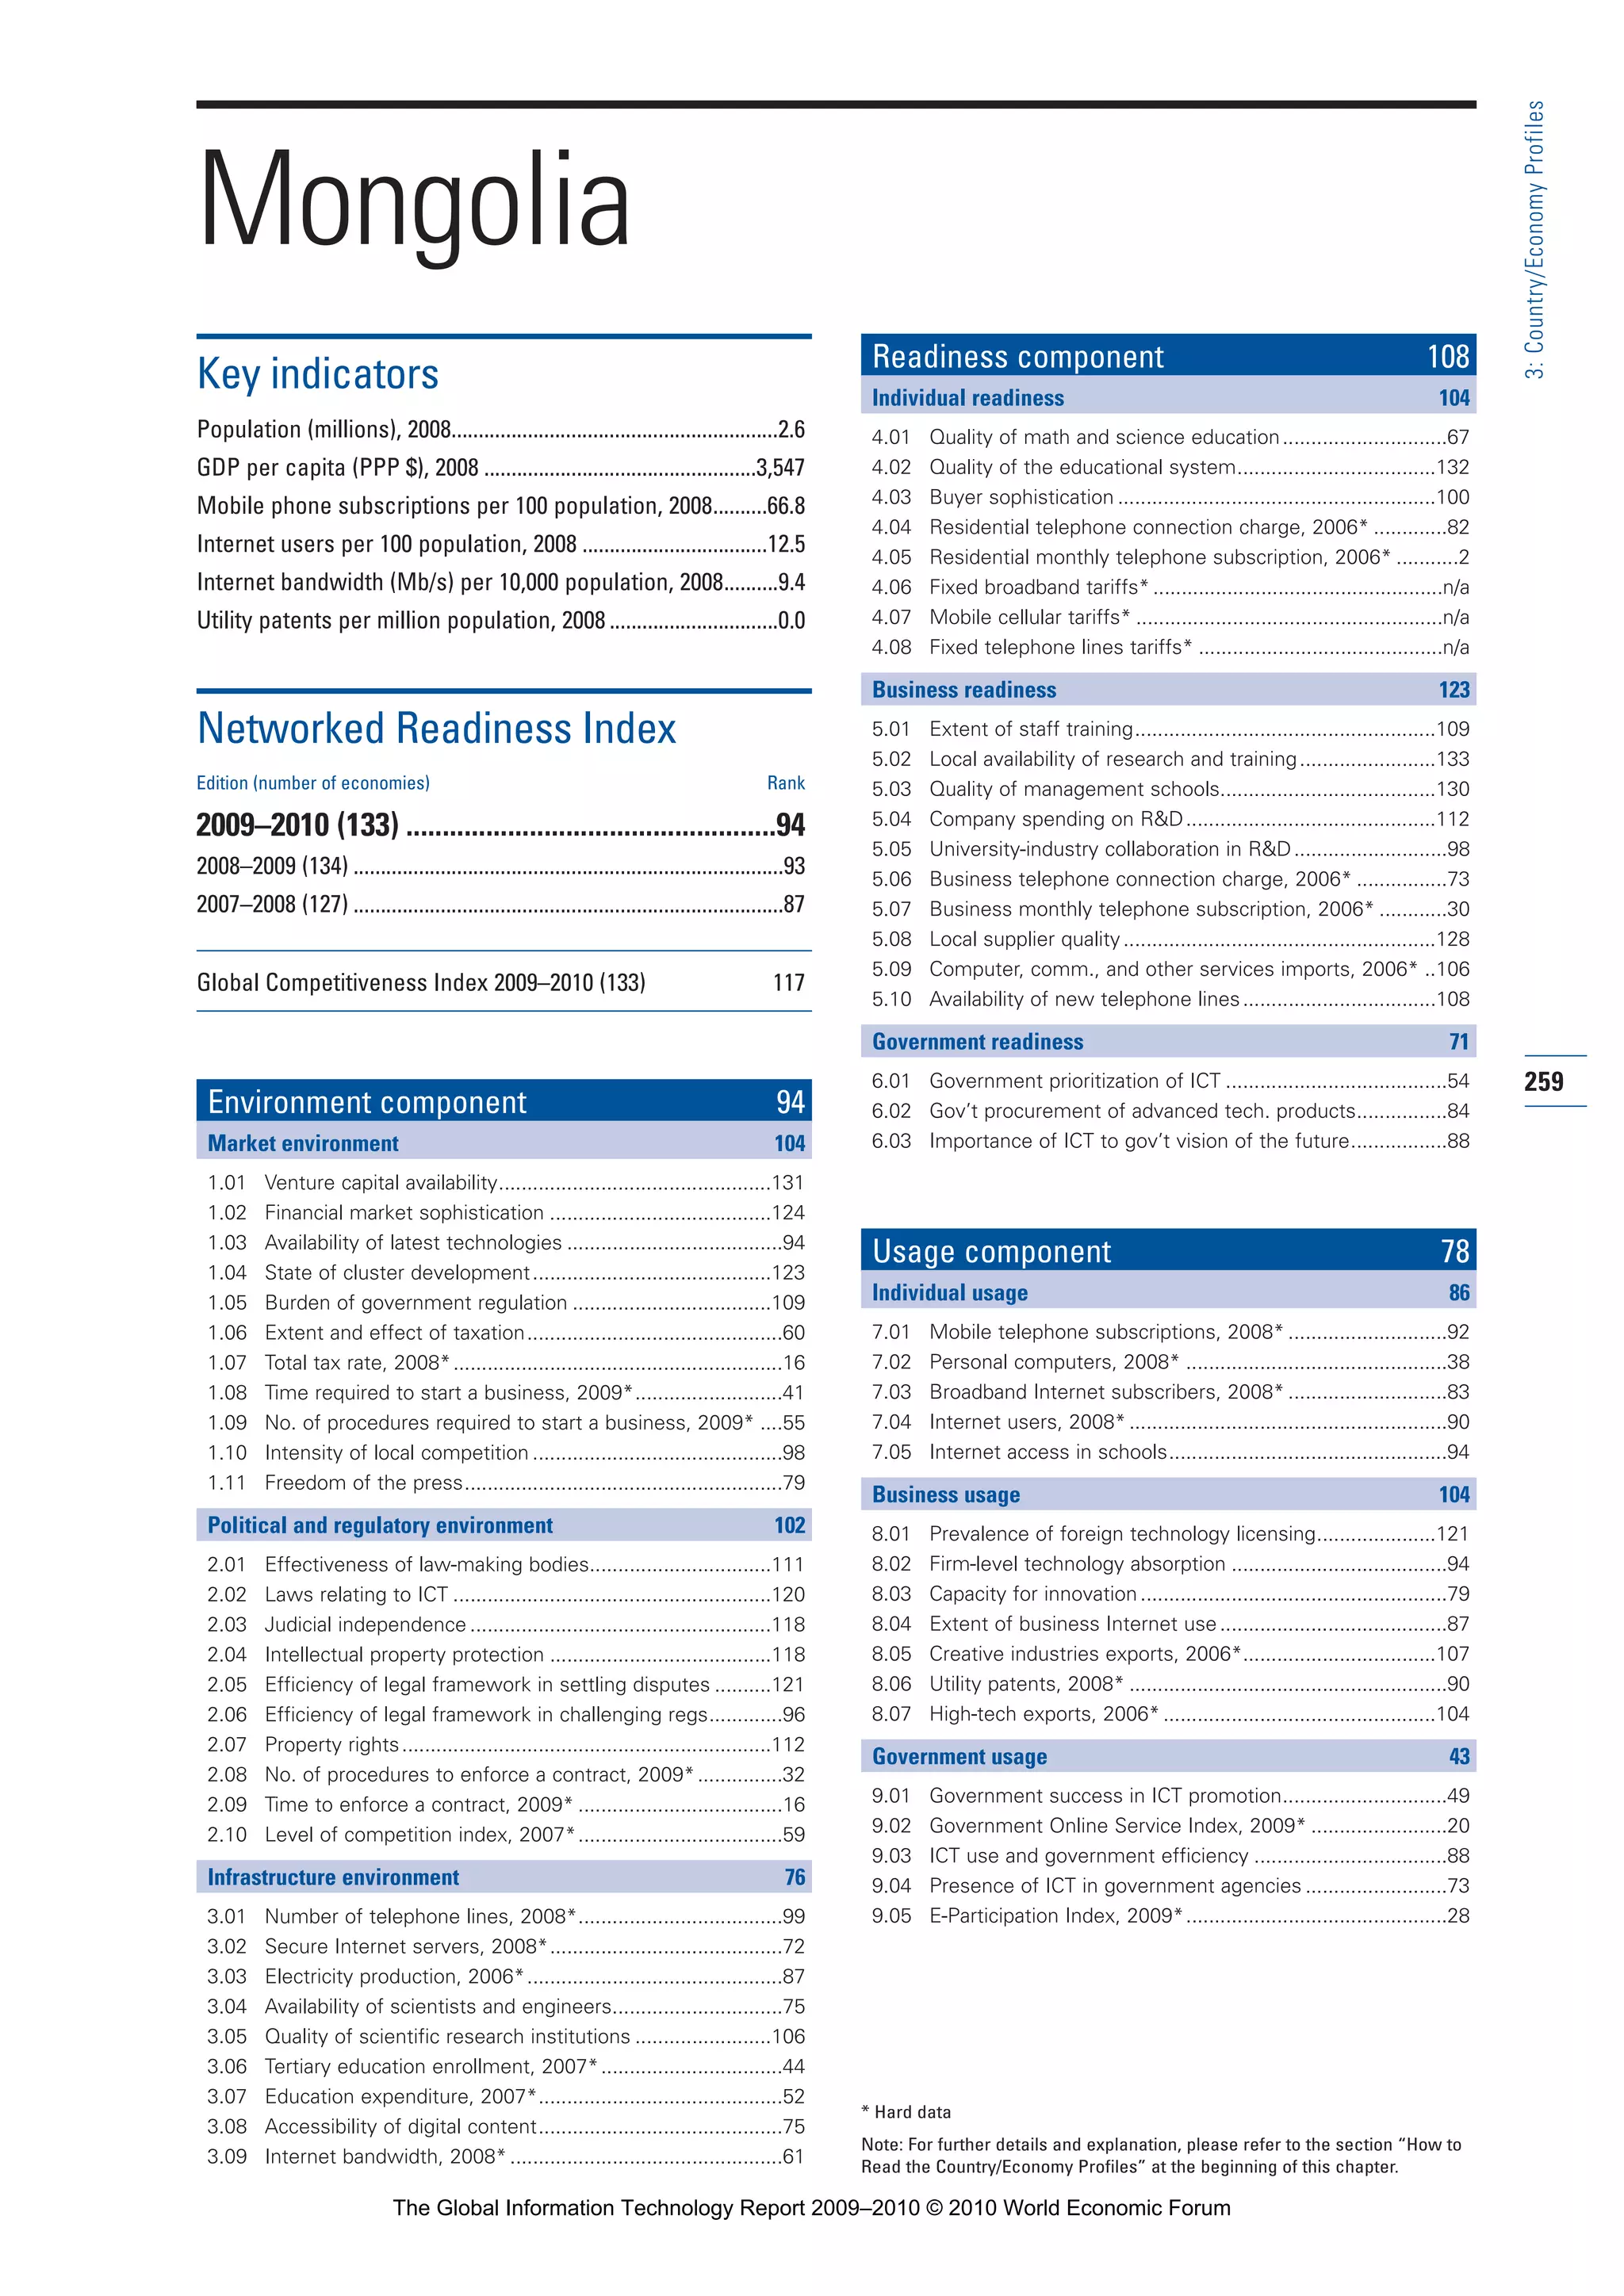
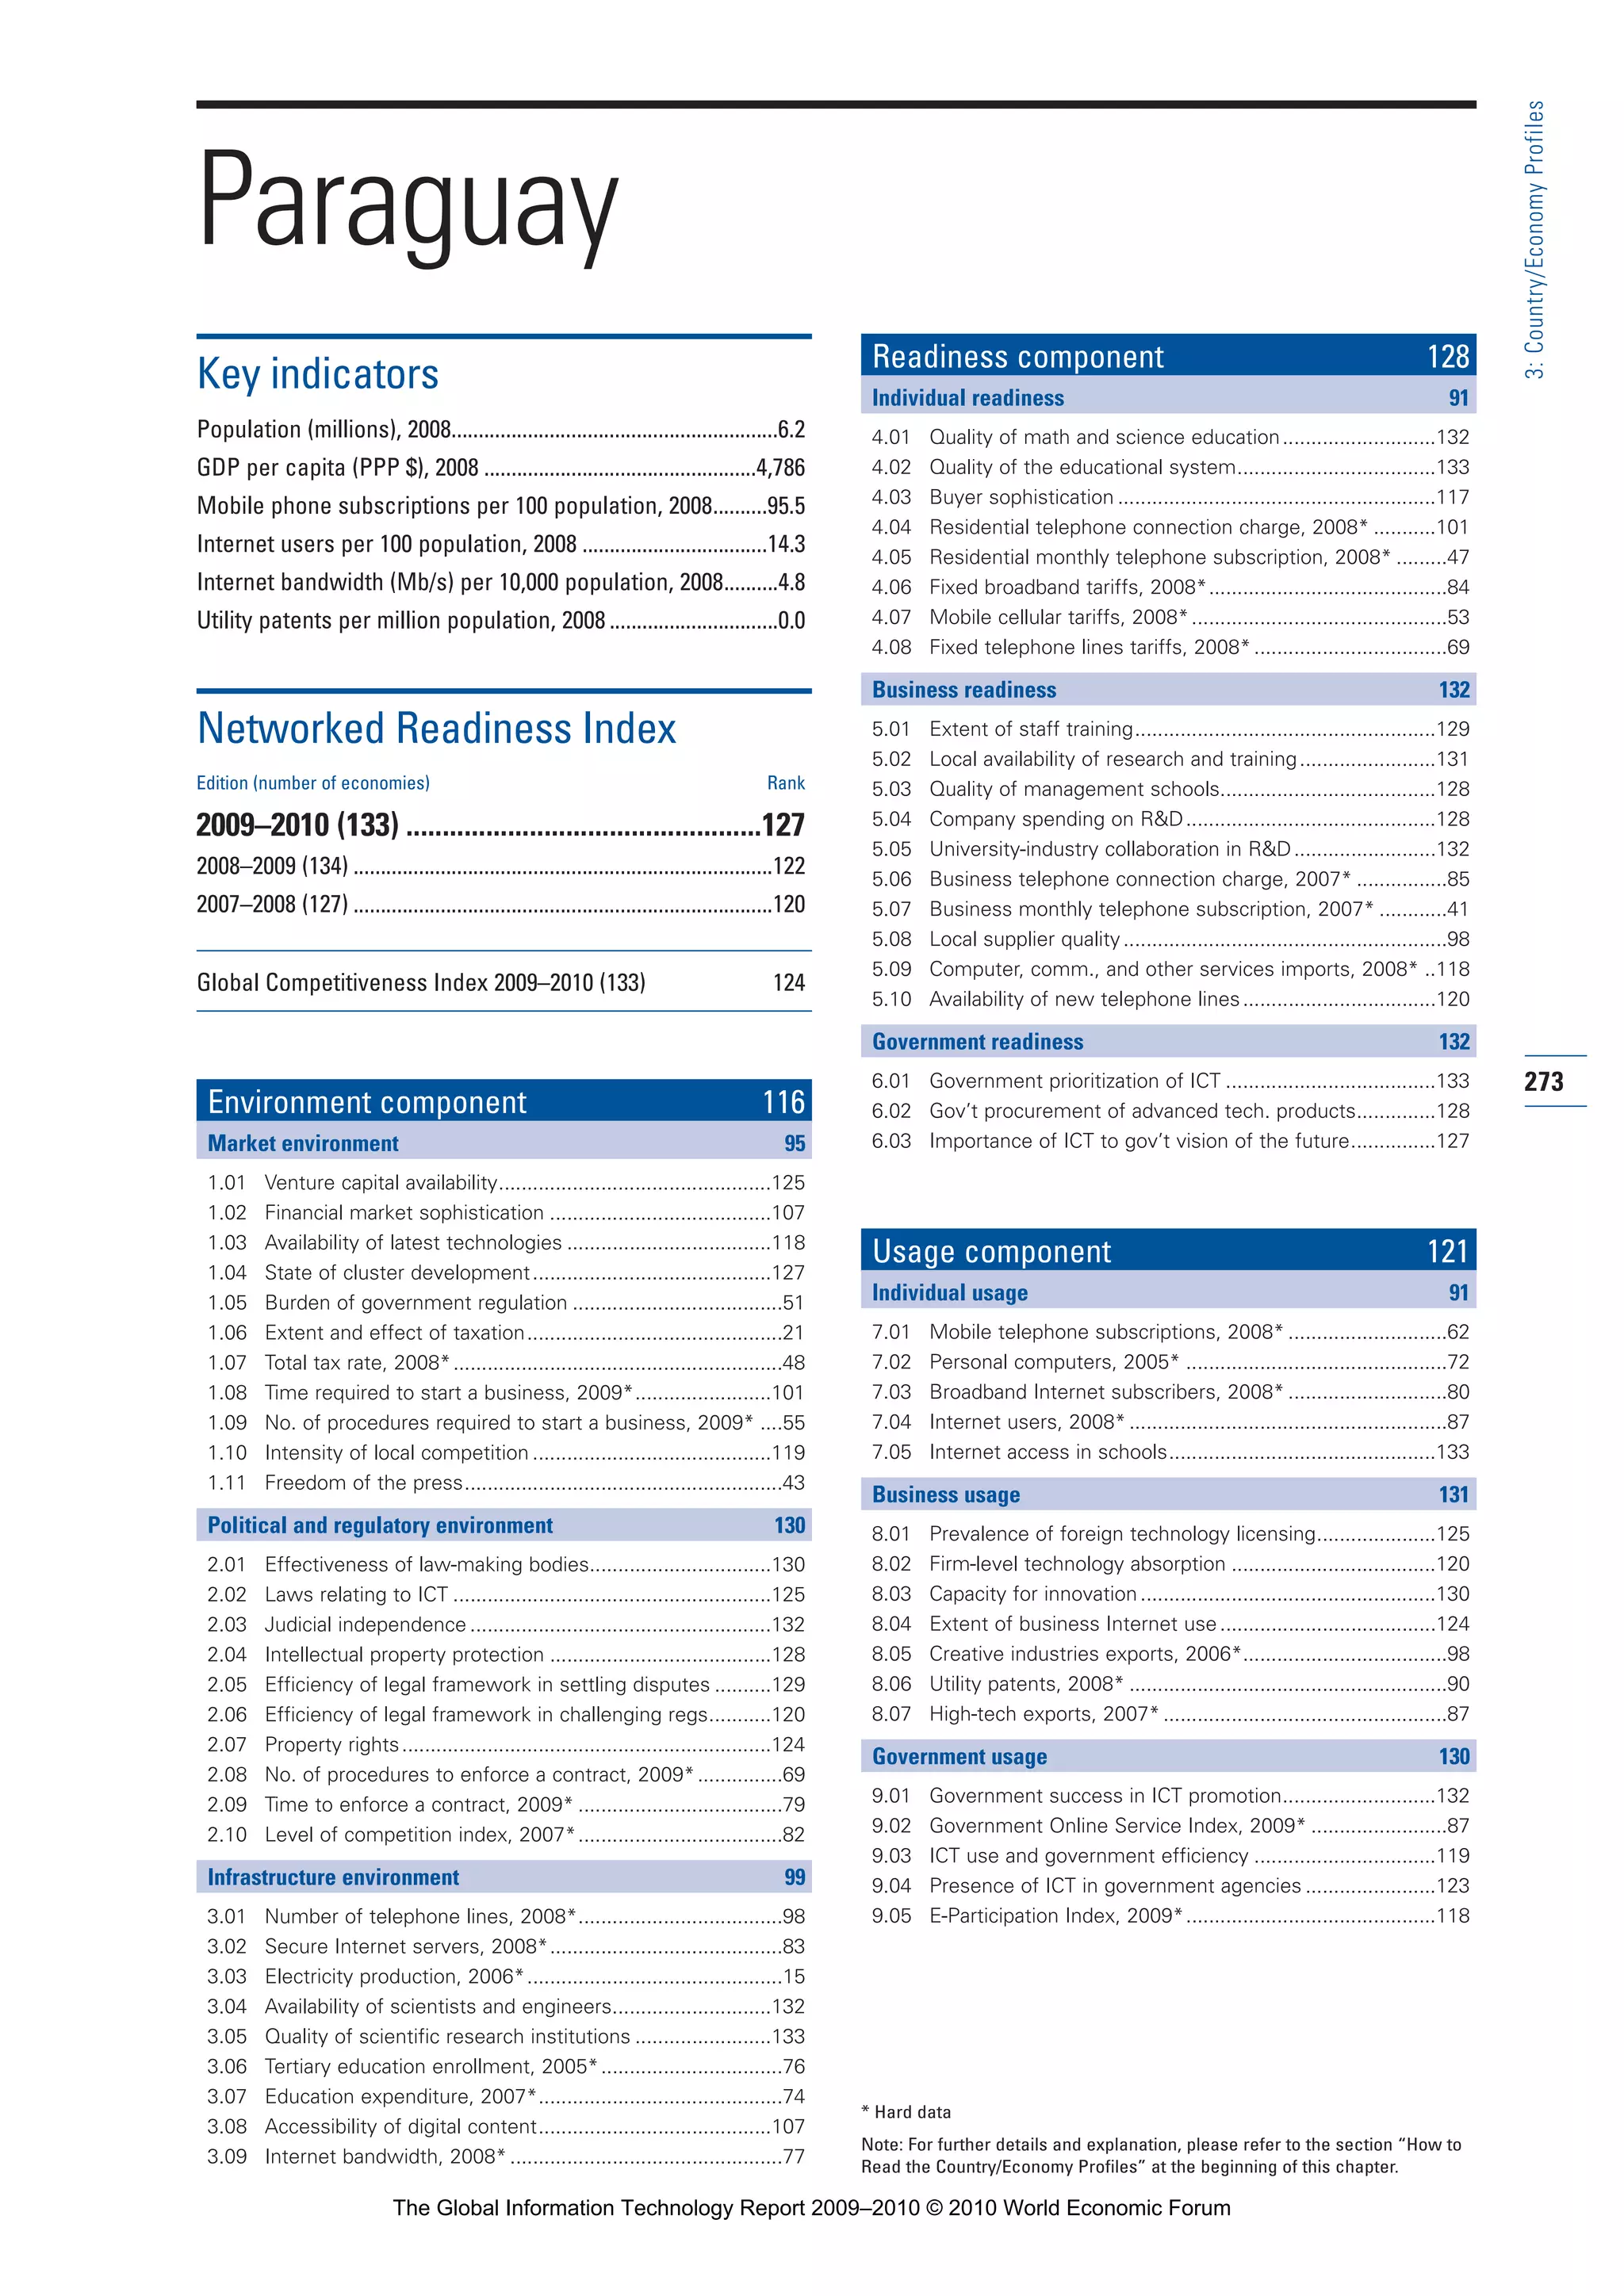
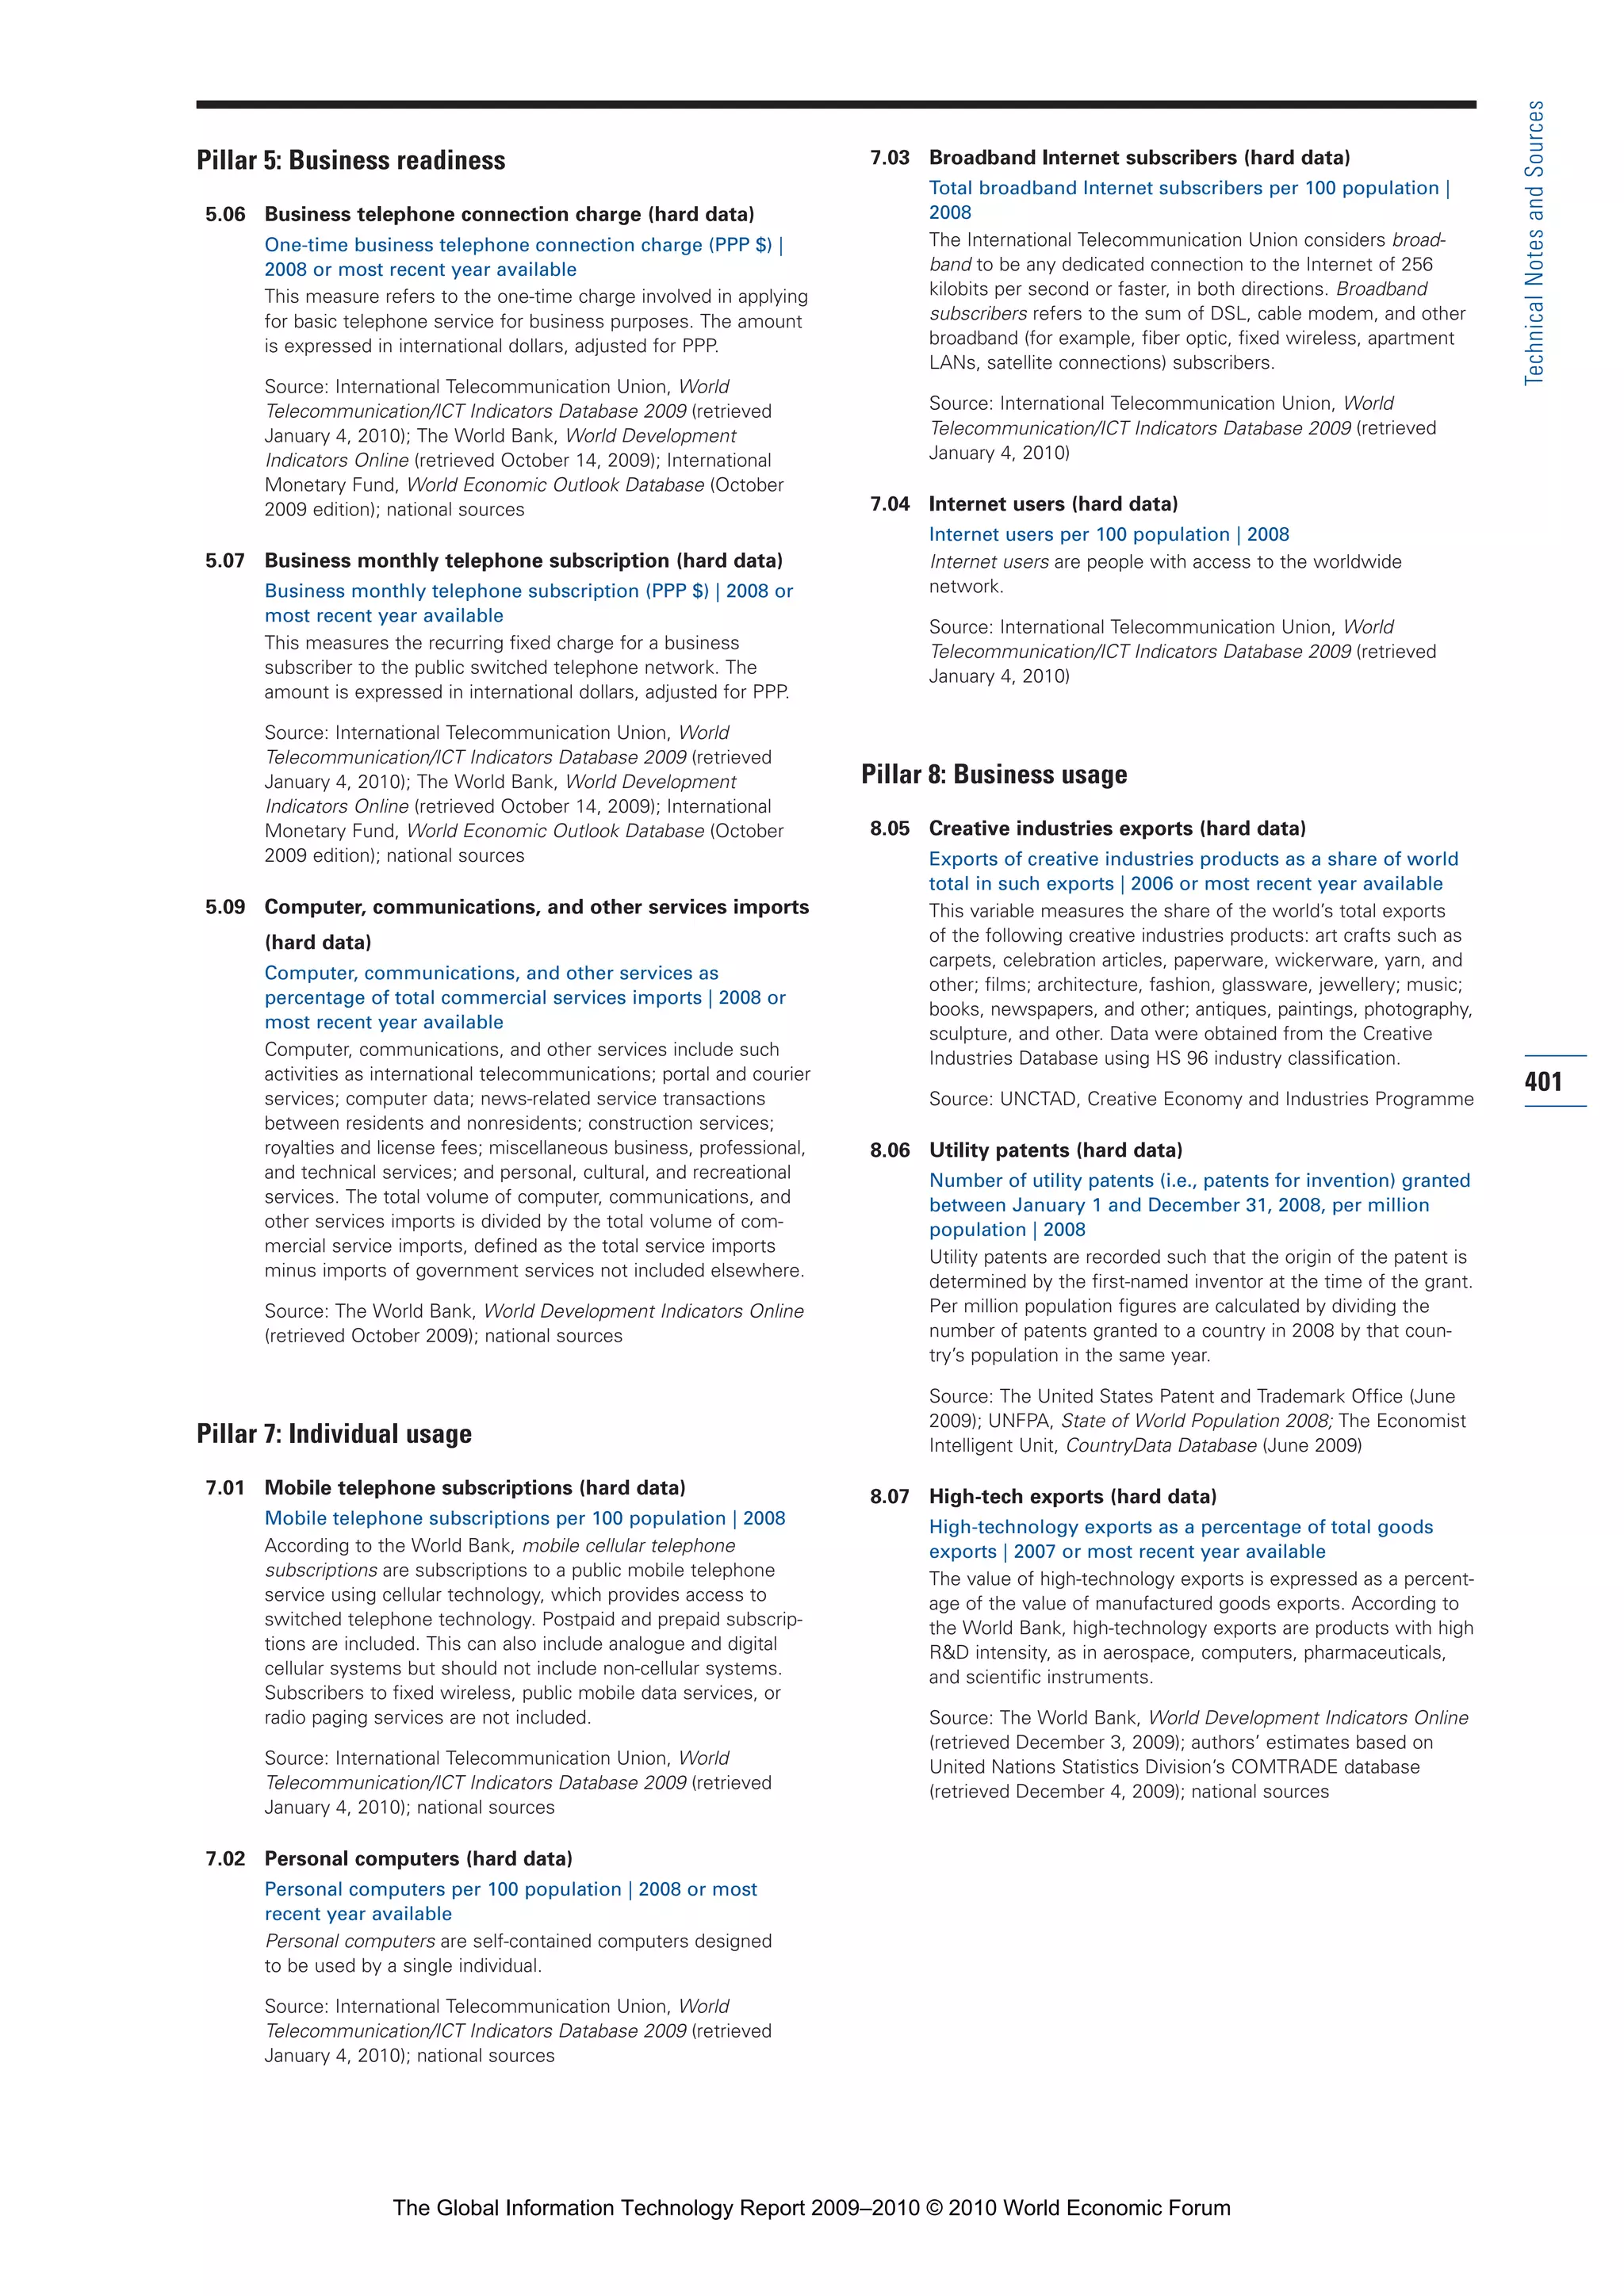
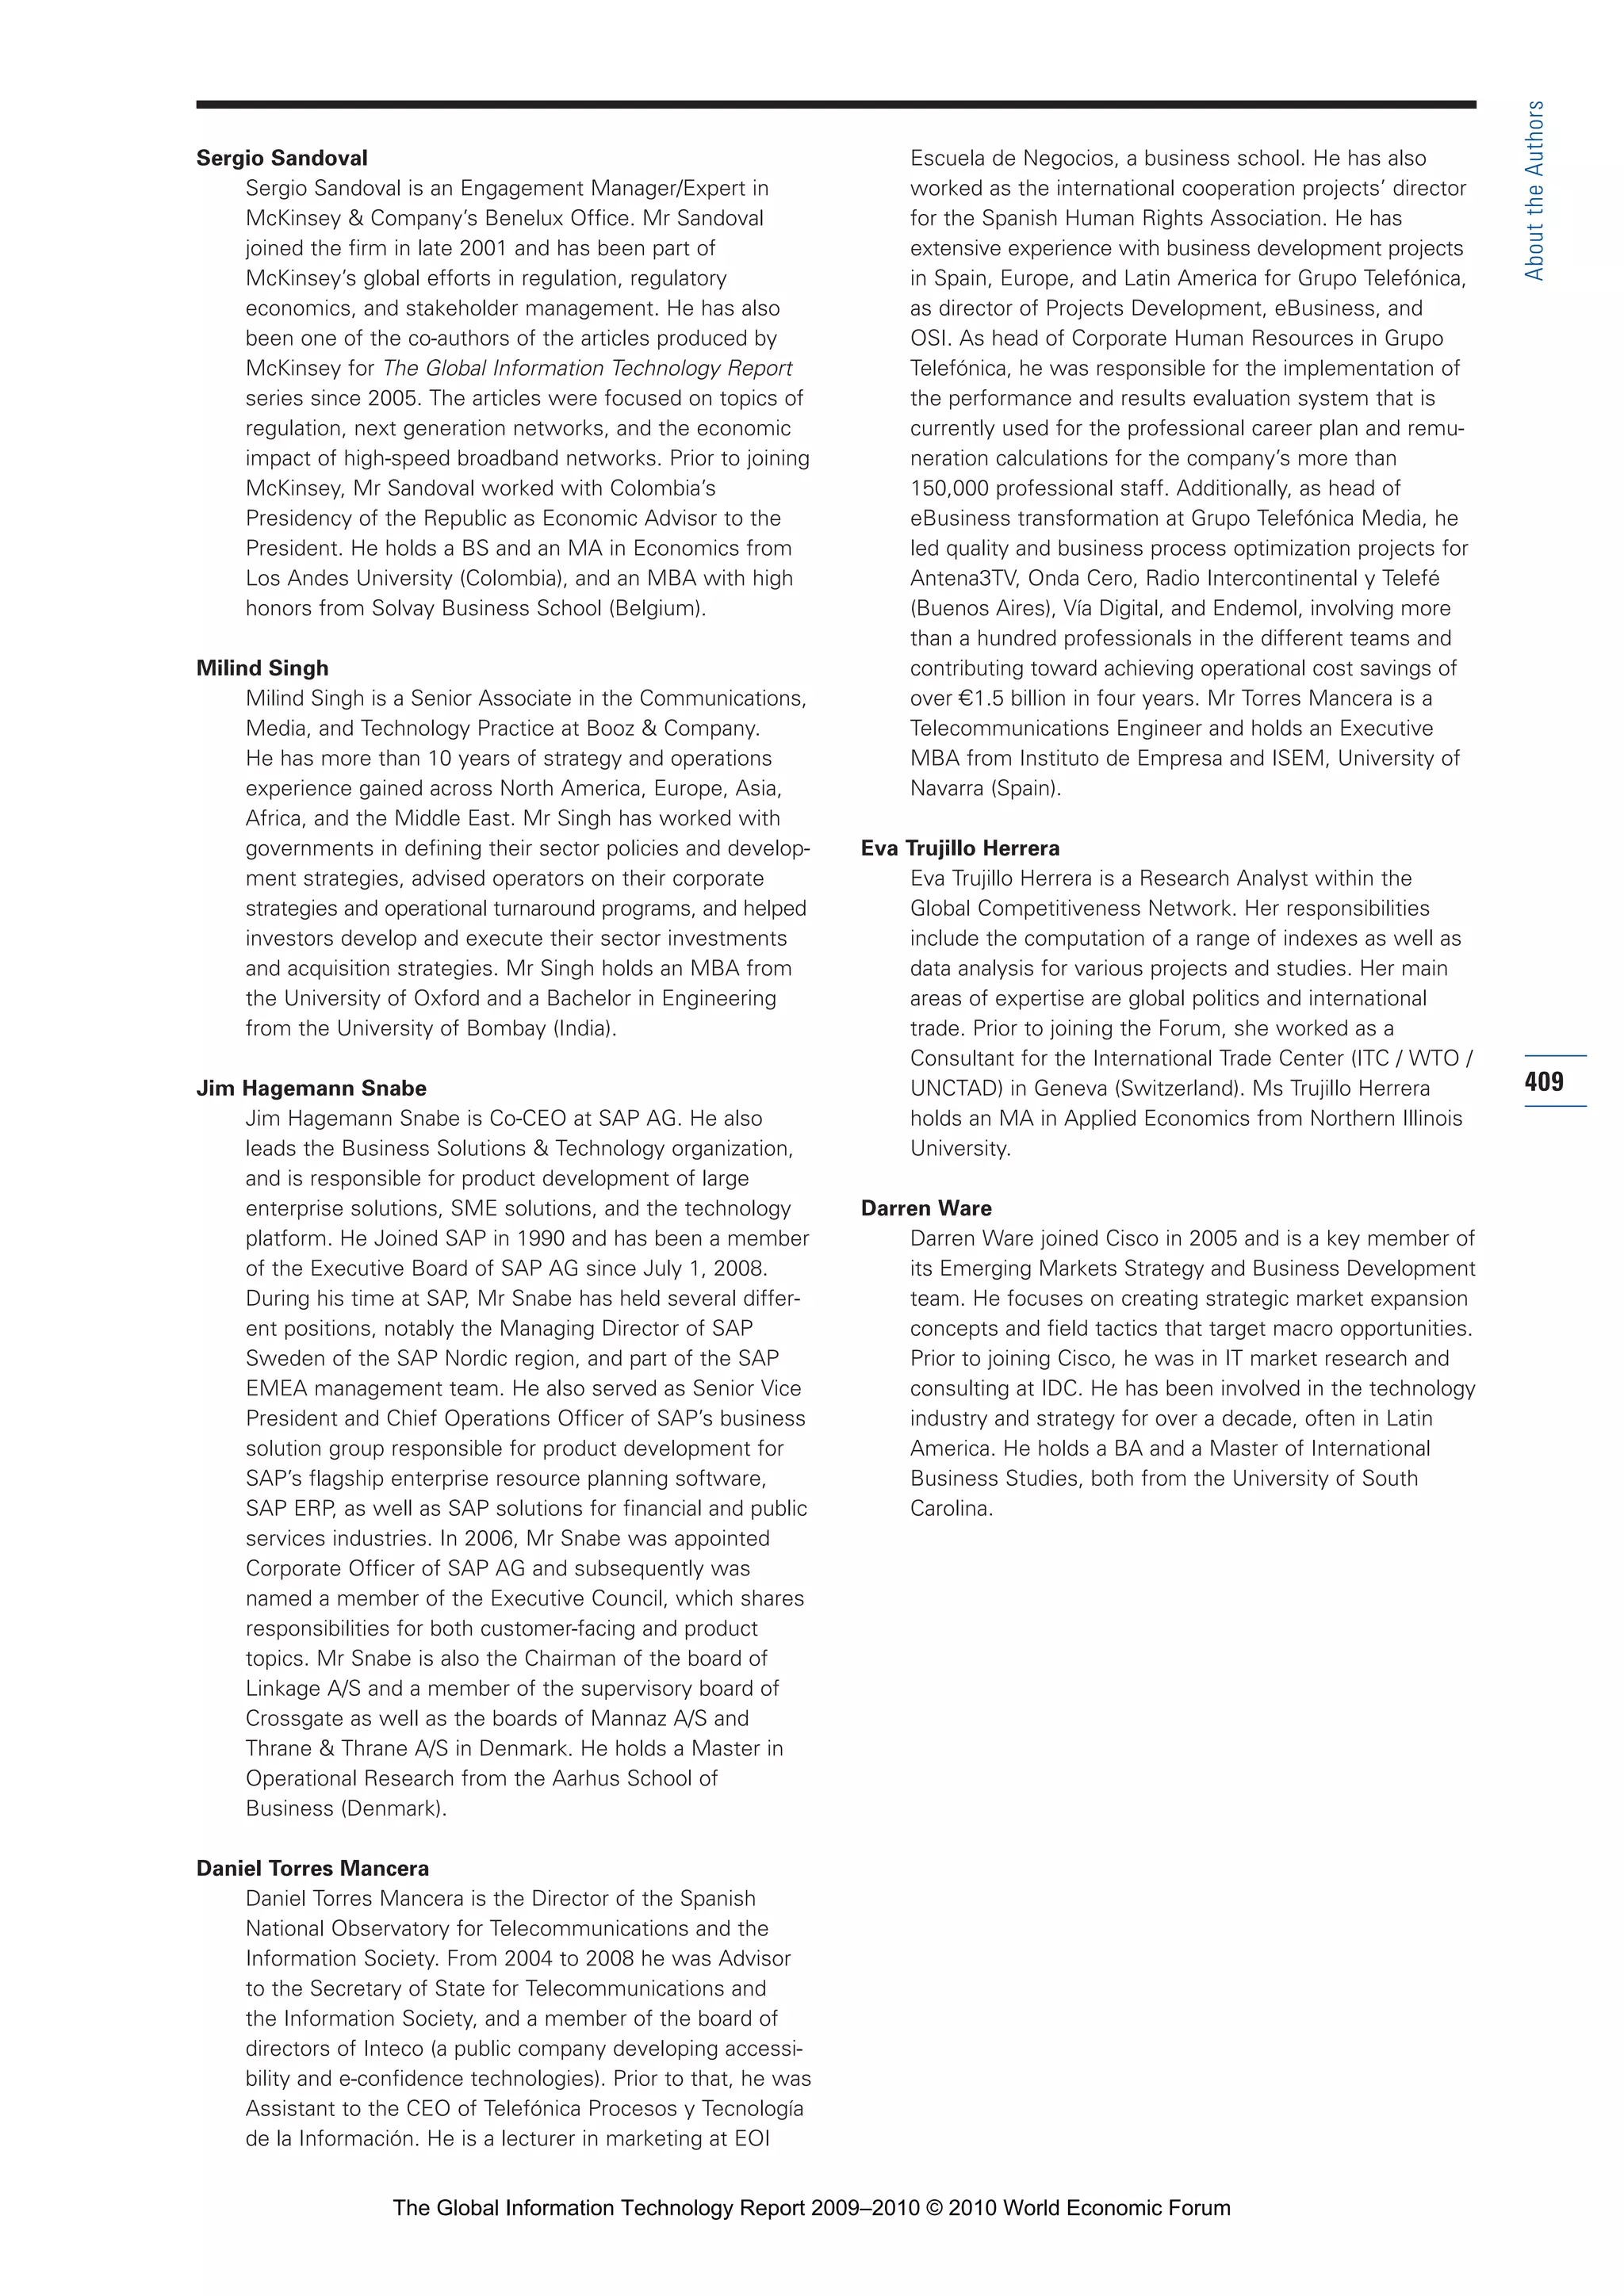
There are several aspects of a green building that
can provide significant energy savings. Every new build-
ing designed should incorporate the following design
optimization processes (see Figure 1):
• optimize the building envelope to minimize the
heat entering the building;
• minimize internal heat loads such as lighting, equip-
ment (e.g., computers), and fresh air treatment.
These two steps will reduce the requirement for
air-conditioning; and
• improve further, after minimizing all the heat loads,
by efficient system design and operation sequence.
The building envelope in a green building opti-
mizes the building design process for energy efficiency.
The kind of envelope (or exterior surface) used deter-
mines the amount of heat and daylight entering the
building.This, in turn, affects the design of the lighting
system and the air-conditioning system for the building,
both of which are major energy consumers.
Building envelope optimization is realized by
designing efficient walls, roofs, and windows. Hourly
simulation software can be used to model the buildings,
predicting different scenarios of daylight, glare at differ-
ent times of the day, and heat gains into the building.
This is an iterative process, performed with various
combinations of glass and shading, to get the best com-
bination that will bring in maximum daylight and at
the same time reduce heat and glare entering the build-
ing.The shading on the windows cuts down direct radi-
ation, thereby reducing heat gains into the building and
minimizing visual glare.Technologies such as light
shelves are used to cut off direct sunlight and reflect
light deep into the office spaces.
Insulation is used for walls and roof for thermal
resistance, so that the heat coming into the building is
minimized.At Infosys’s Software Development Block-5
(SDB-5) building in its Mysore Development Center,
the walls (cavity wall with 50 millimeters [mm] extrud-
ed polystyrene insulation) have a thermal resistance five
times higher than the regular brick walls of conventional
buildings.This means the heat ingress through the walls
is five times less. Similarly, the insulated roof (RCC roof
with 75mm extruded polystyrene over-deck insulation)
provides resistance eight times that of a conventional
RCC roof.The air-conditioning requirement has been
reduced from 622 tonnage of refrigeration (TR) to 530
TR because of the efficient envelope, and thus the elec-
trical load and energy consumption of the building fell
correspondingly.
The next major heat source is fresh air provided to
the building’s air-conditioning system.About 85 percent
57
1.4:TheRoleofMetricsinSustainability
Building envelope
(wall, roof, window)
Lighting
Heating, ventilation,
and air conditioning
Building total
Figure 1: Design optimization process
Part 1.r2 3/2/10 4:40 AM Page 57
The Global Information Technology Report 2009–2010 © 2010 World Economic Forum](https://image.slidesharecdn.com/cusersdesktop2010gitr2009-2010fullreportfinal-100402152331-phpapp01/75/The-Global-Information-Technology-Report-2009-2010-77-2048.jpg)
![themselves and family members (e.g., birth, marriage,
and death certificates) dating back to the 1880s. Benefits
for governments that are offering these types of services
are huge.“As recent research shows,” noted
Eurochambres Secretary-General Arnaldo Abruzzini in
November 2009,“electronic procedures will lead to
more bidders and thus increased competition, which
could create savings in the order of 150 billion EU-
wide.”22
Improving information access and communications
ICT is changing the way people access information
(with Google and Wikipedia, for example) and interact
with each other (through blogs, social
networking sites, virtual reality sites, and so forth).
Social networking websites have changed the job
recruitment rules.Today these sites are the places to find
a job and recruit talent.A recent survey, conducted in
May 2009, revealed that 72 percent of US companies
plan to increase their use of social network recruiting.
Ninety-five percent of companies used LinkedIn;
Facebook use by companies grew from 36 percent in
2008 to 59 percent in 2009.23
Interestingly, it also seems
that employers are more satisfied with the quality of
candidates from employee referrals and social networks
than of those from job boards. From the candidate’s
point of view, a recent survey showed that today 6 per-
cent of respondents found their last job via a social net-
working site—which is fairly high when one takes into
account that these websites started to acquire a critical
mass only a few years ago.24
It seems likely that such
sources for job hunting and recruiting will only grow in
importance given their overall growth in use.
The latest presidential election in the United States
heavily leveraged these types of social networking
websites. Internet users could have a connection with
then-Senator Obama on more than 15 social network-
ing sites,25
meaning that regardless of Internet users’
preferences, all of them could connect with Obama’s
pages. For instance, on Facebook, the largest group of
Obama’s supporters is composed of 1 million people,
the Obama MySpace page currently has 1.9 million
friends,26
and Obama has 3.1 million followers on
Twitter.27
He also created his own social network web-
site, MyBarackObama.com, where 2 million profiles
were created.28
The large network created by online
channels allowed Obama to reach out to people who
had not been involved in politics before and would have
not been involved otherwise.
The power of the change generated by social net-
works was also evident when a 25-year-old Moldovan
woman put a message in Twitter after she and her six
other friends were discussing doing something about
the recent—and allegedly fraudulent—parliamentary
elections.This message created a demonstration that
raided the parliament and pushed the Moldovan presi-
dent to order a recount of the recently held elections.
Speaking about the power of Twitter, the woman said
“we expected at the most a couple of hundred friends,
friends of friends, and colleagues […] when we went to
the square, there were 20,000 people waiting there. It
was unbelievable.”29
All these examples show new ways in which inno-
vative ICT technologies are having a profound impact
on the way people interact and communicate with each
other. Many of these technologies will undoubtedly lead
to new social benefits.
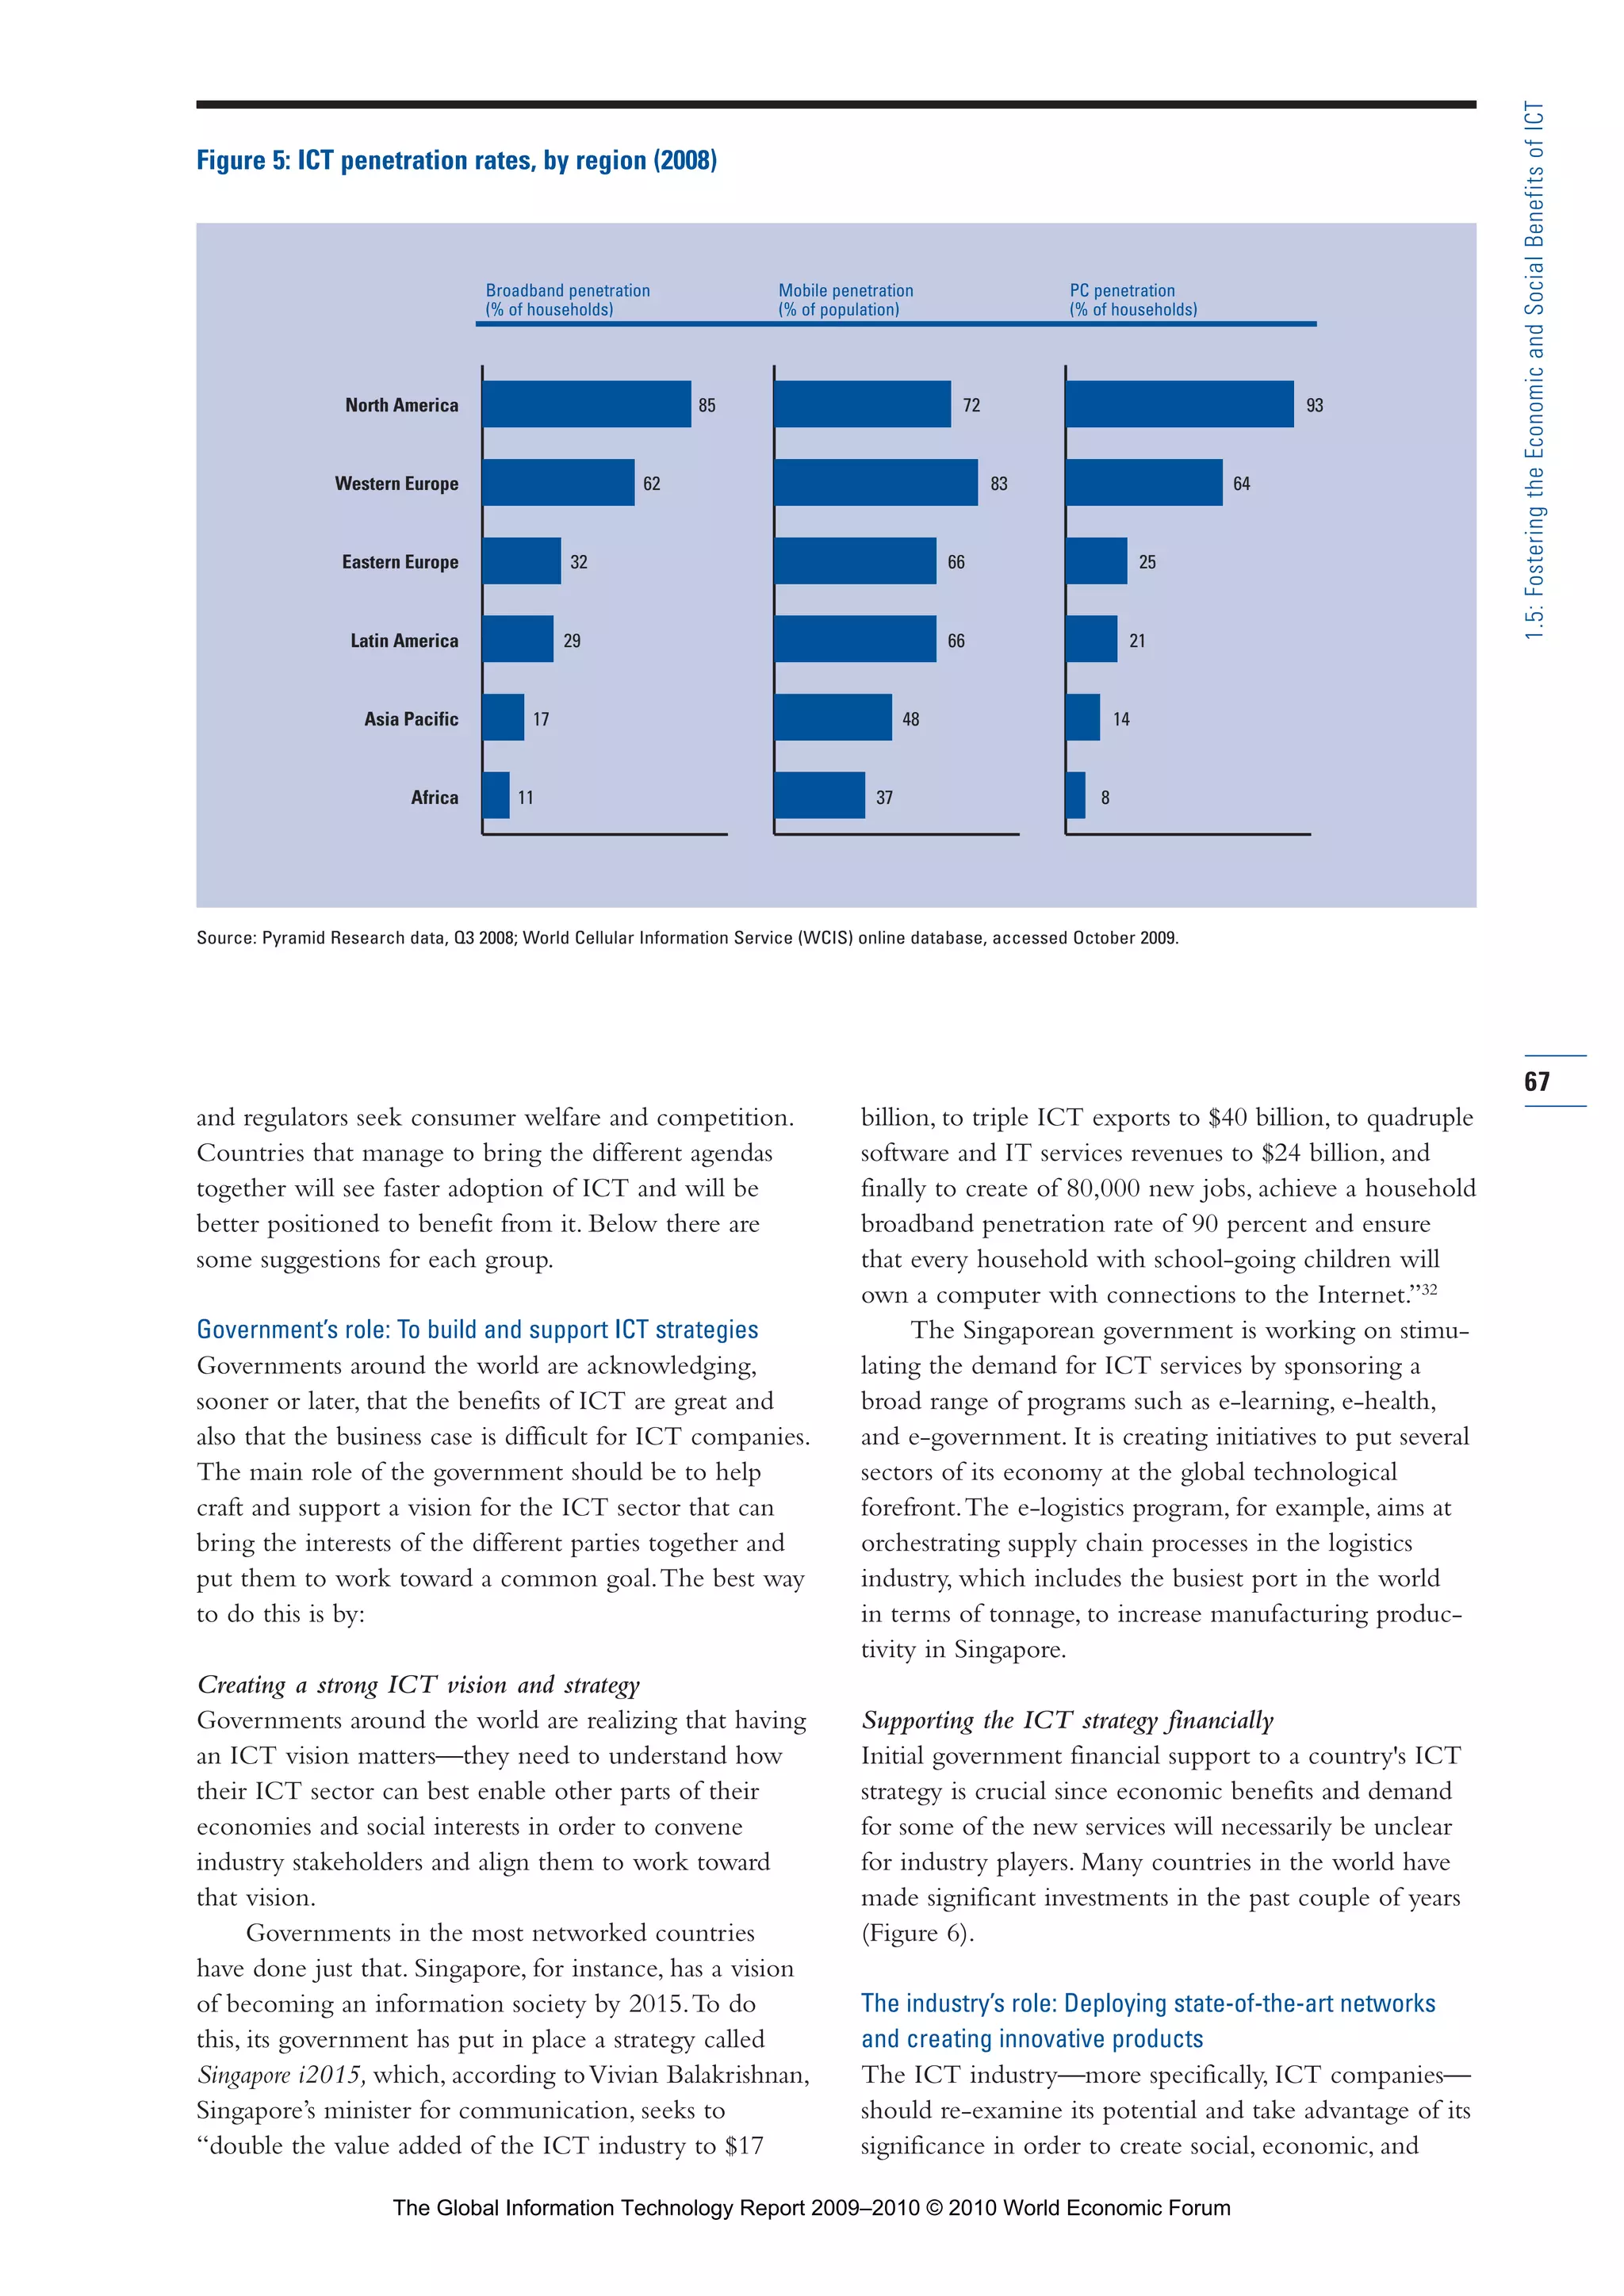
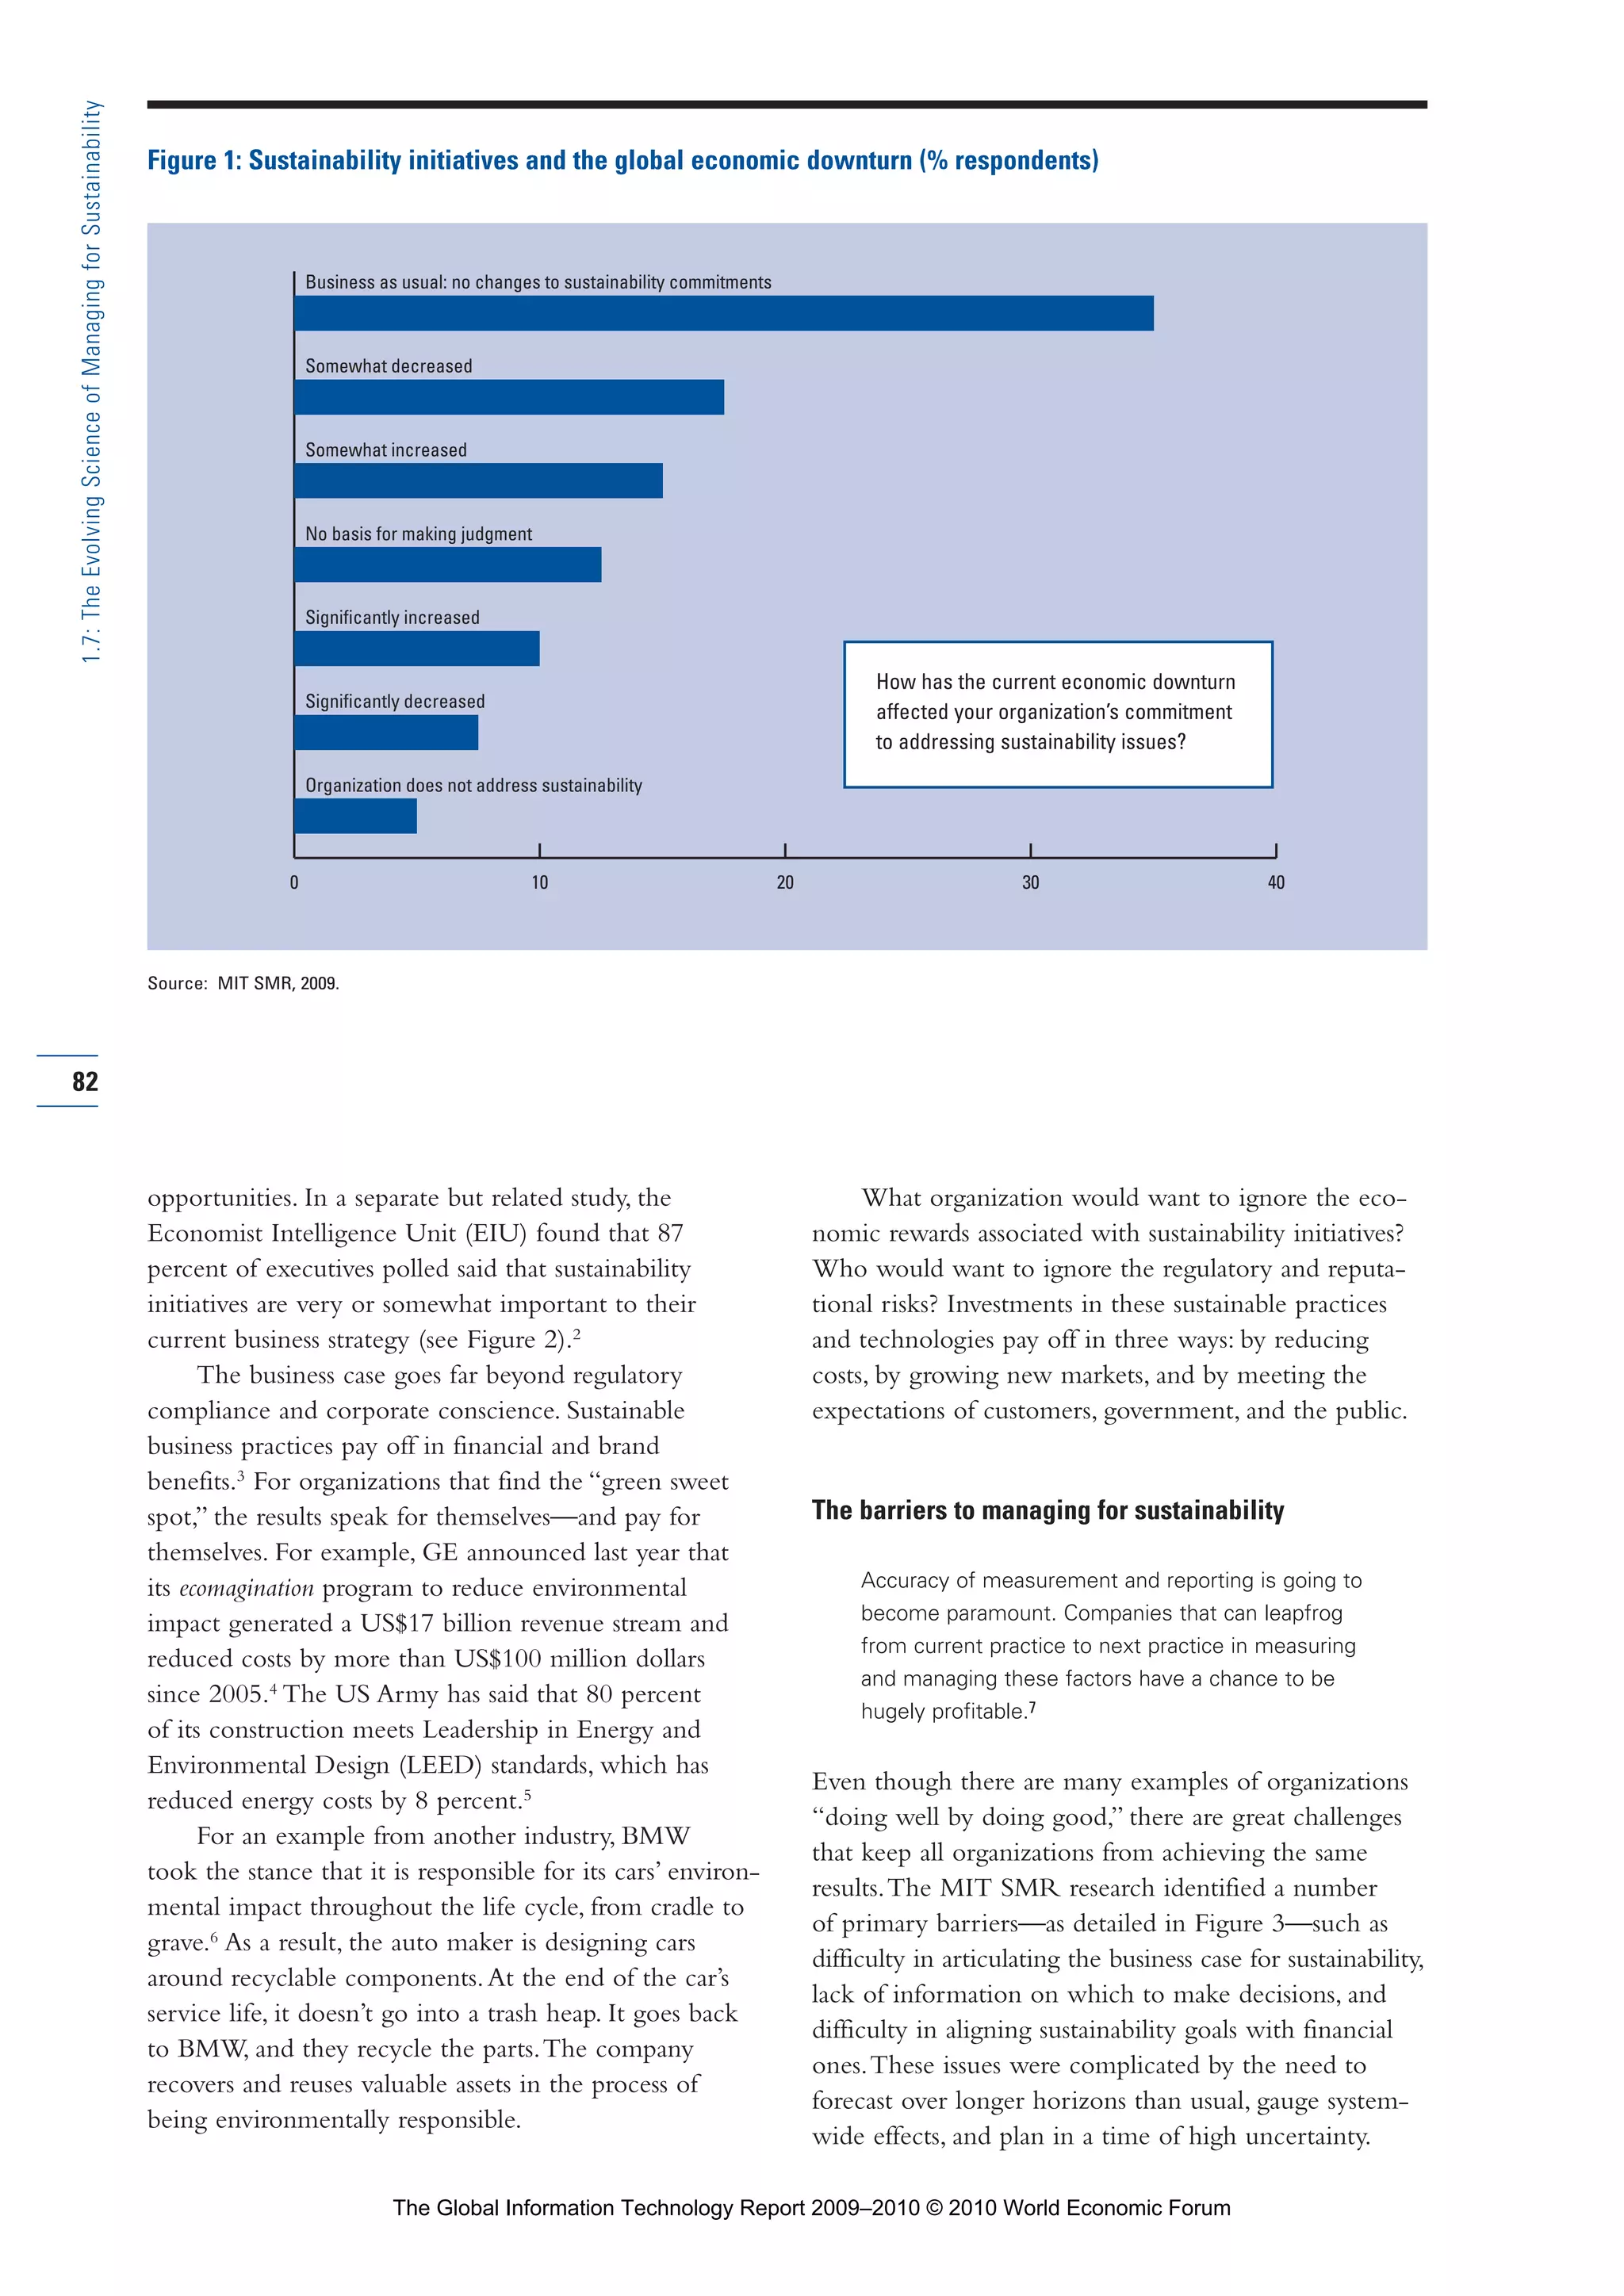
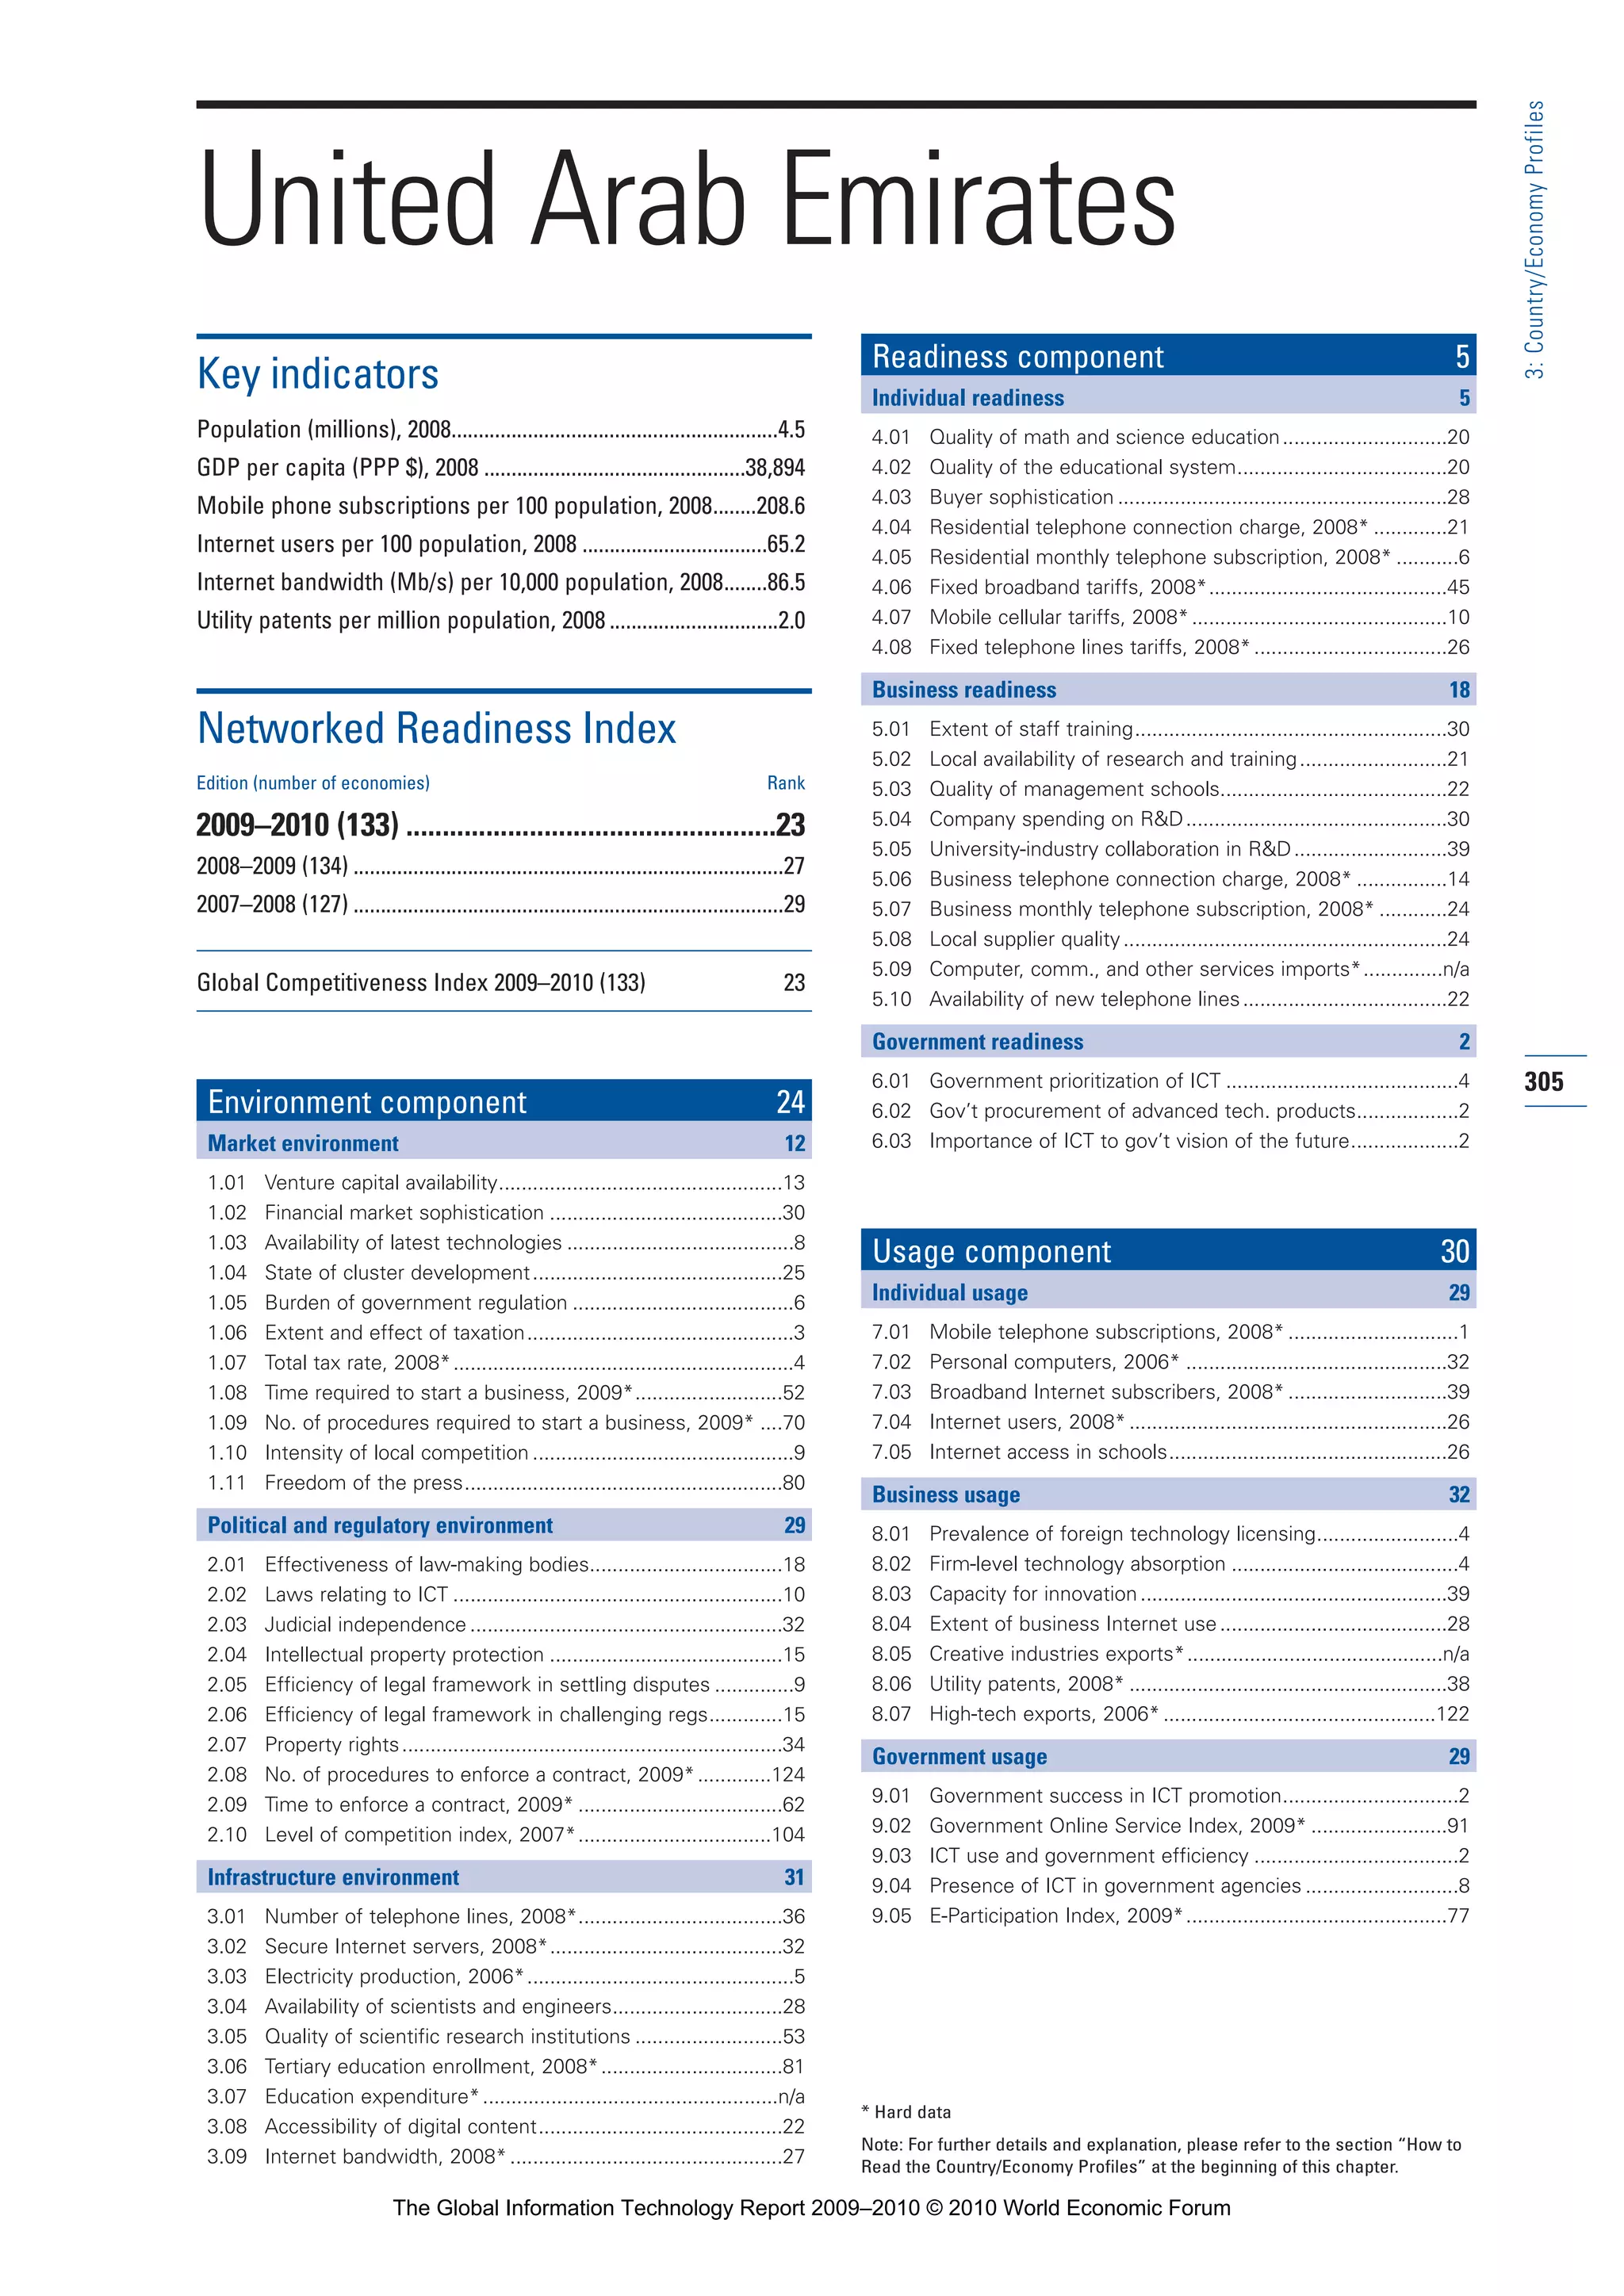
Unleashing the potential of ICT requires investments
The economic and social benefits of ICT are clear.
However, this impact could be significantly increased if
the penetration of ICT, including mobile phones, broad-
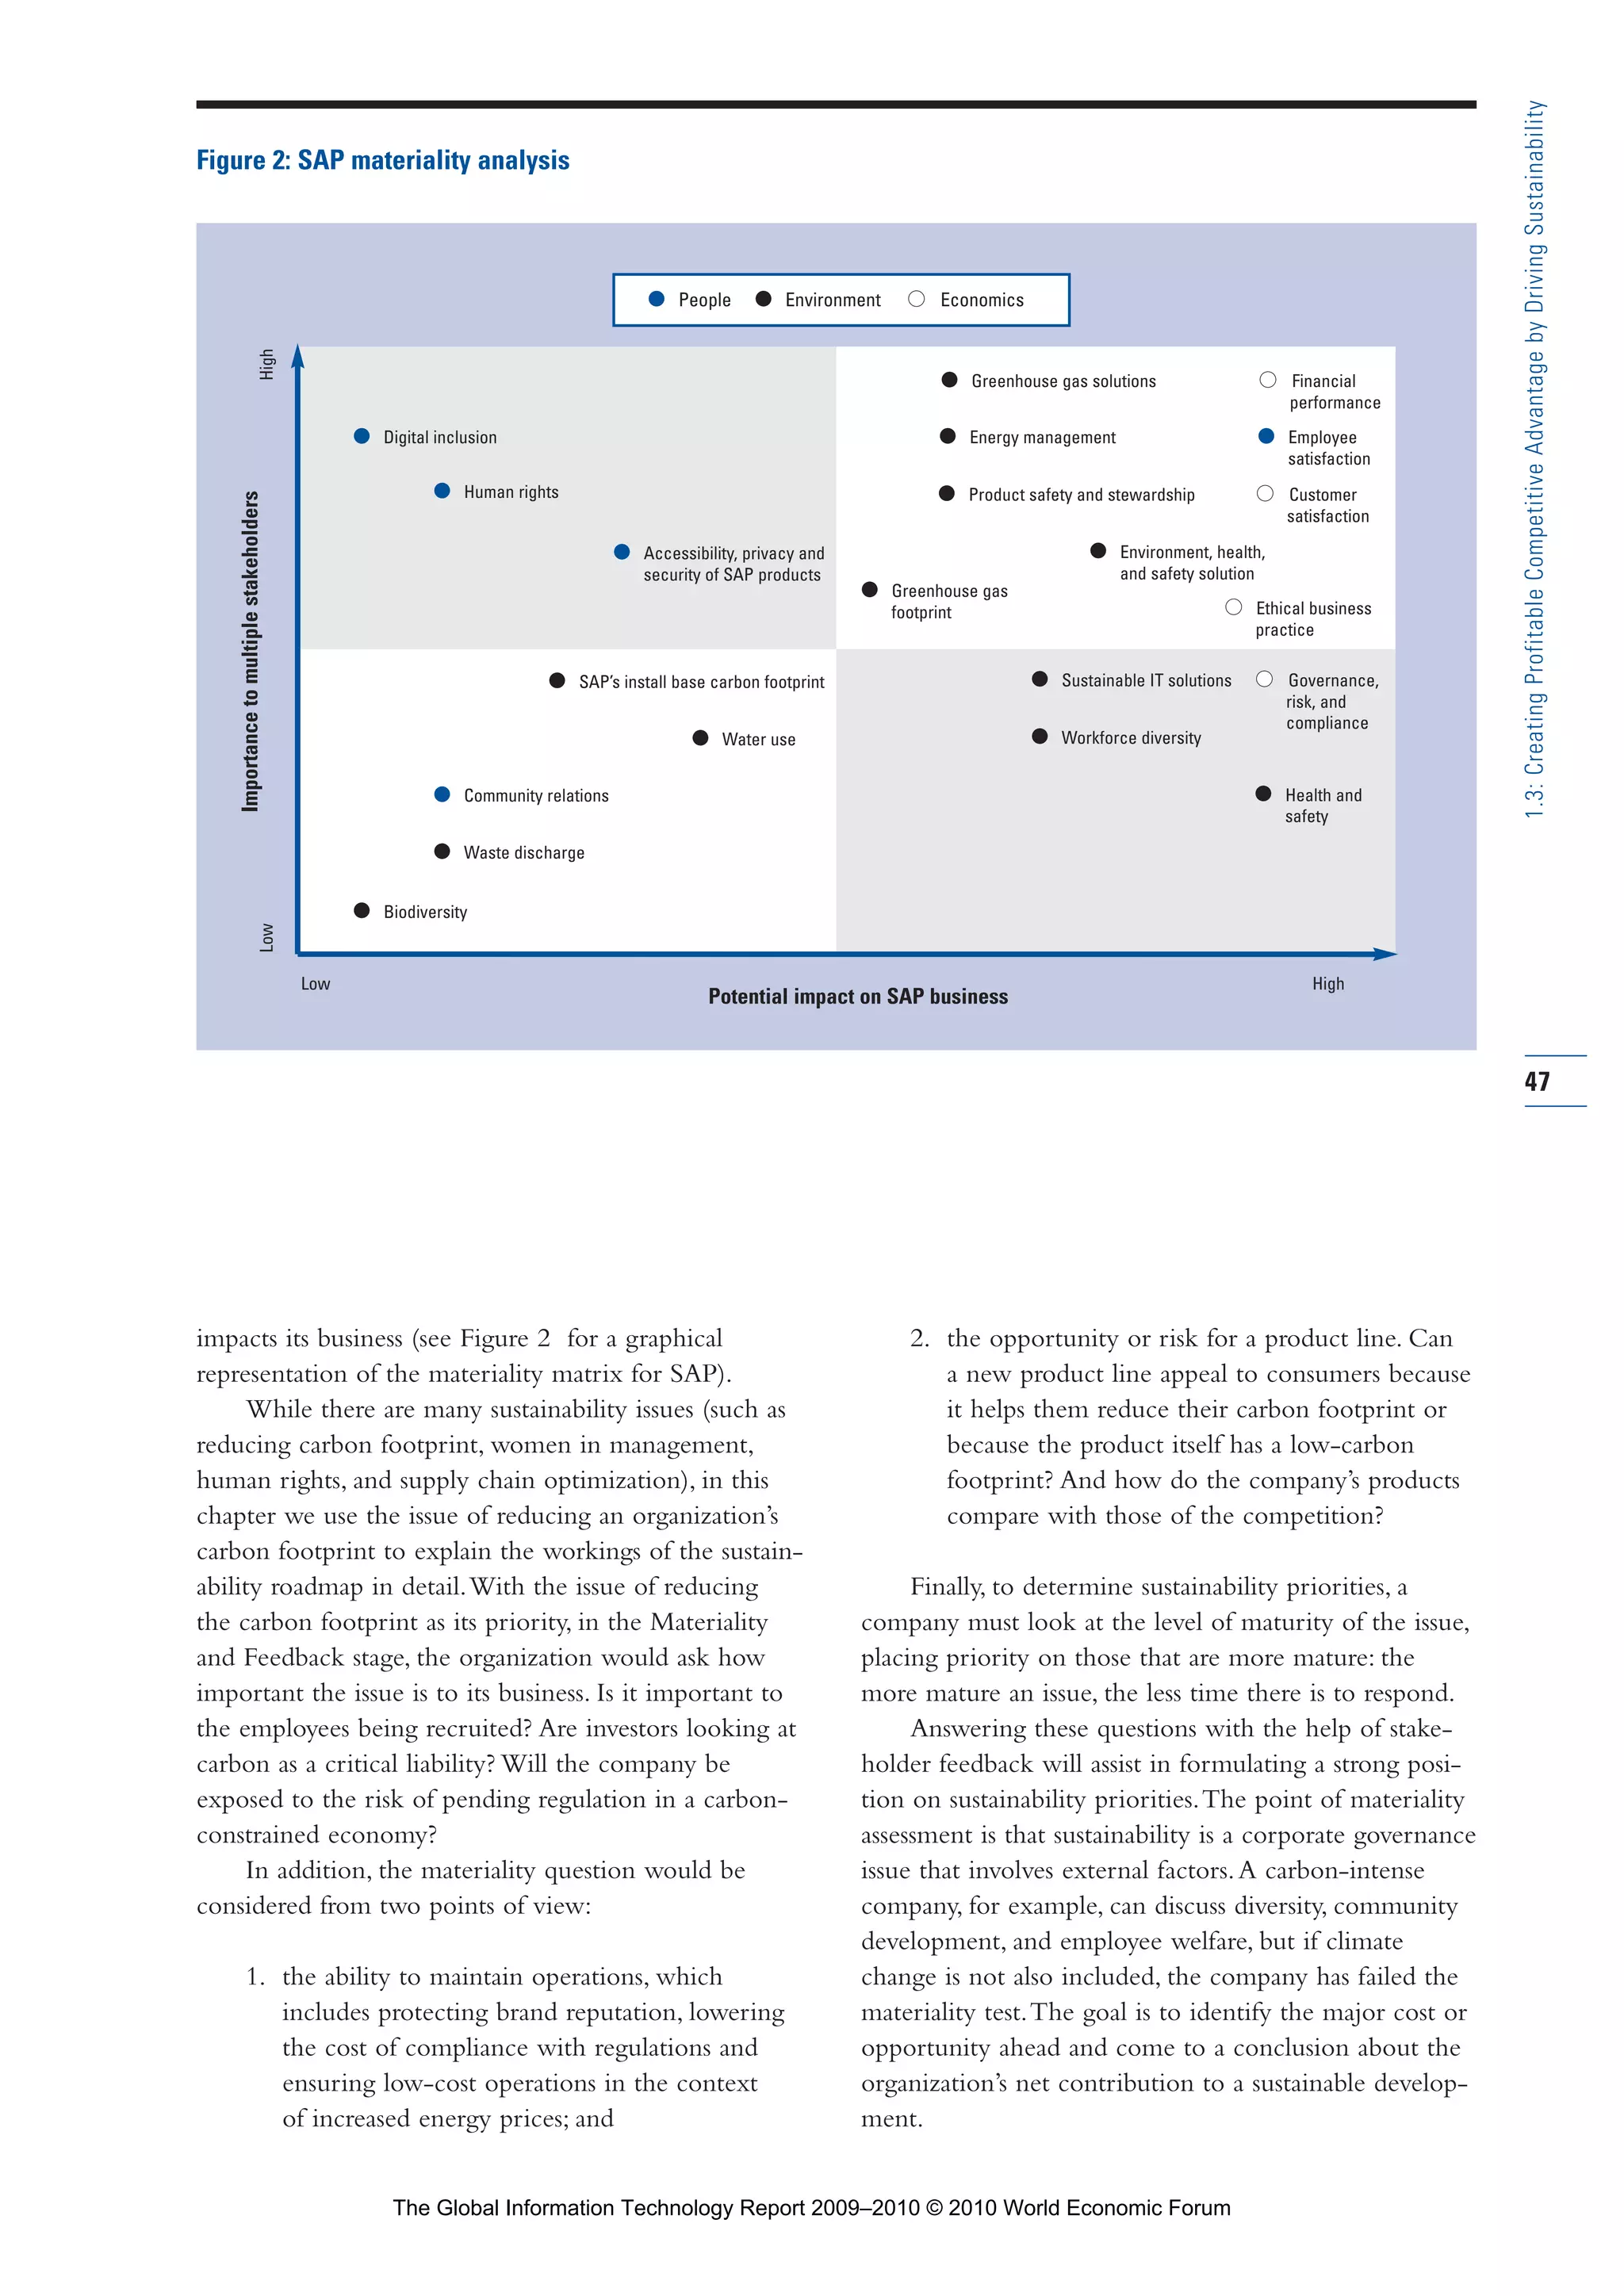
band, and PCs, was expanded. Figure 5 shows the cover-
age of these technologies in the different regions of the
world. Developed countries have room to continue to
expand their current penetration of these technologies,
but also—and possibly more pressing—emerging
economies need to close the gap with more advanced
economies to reap the benefits of ICT. If they can, ICT
will likely bring them even more significant benefits
than it will to developed economies.
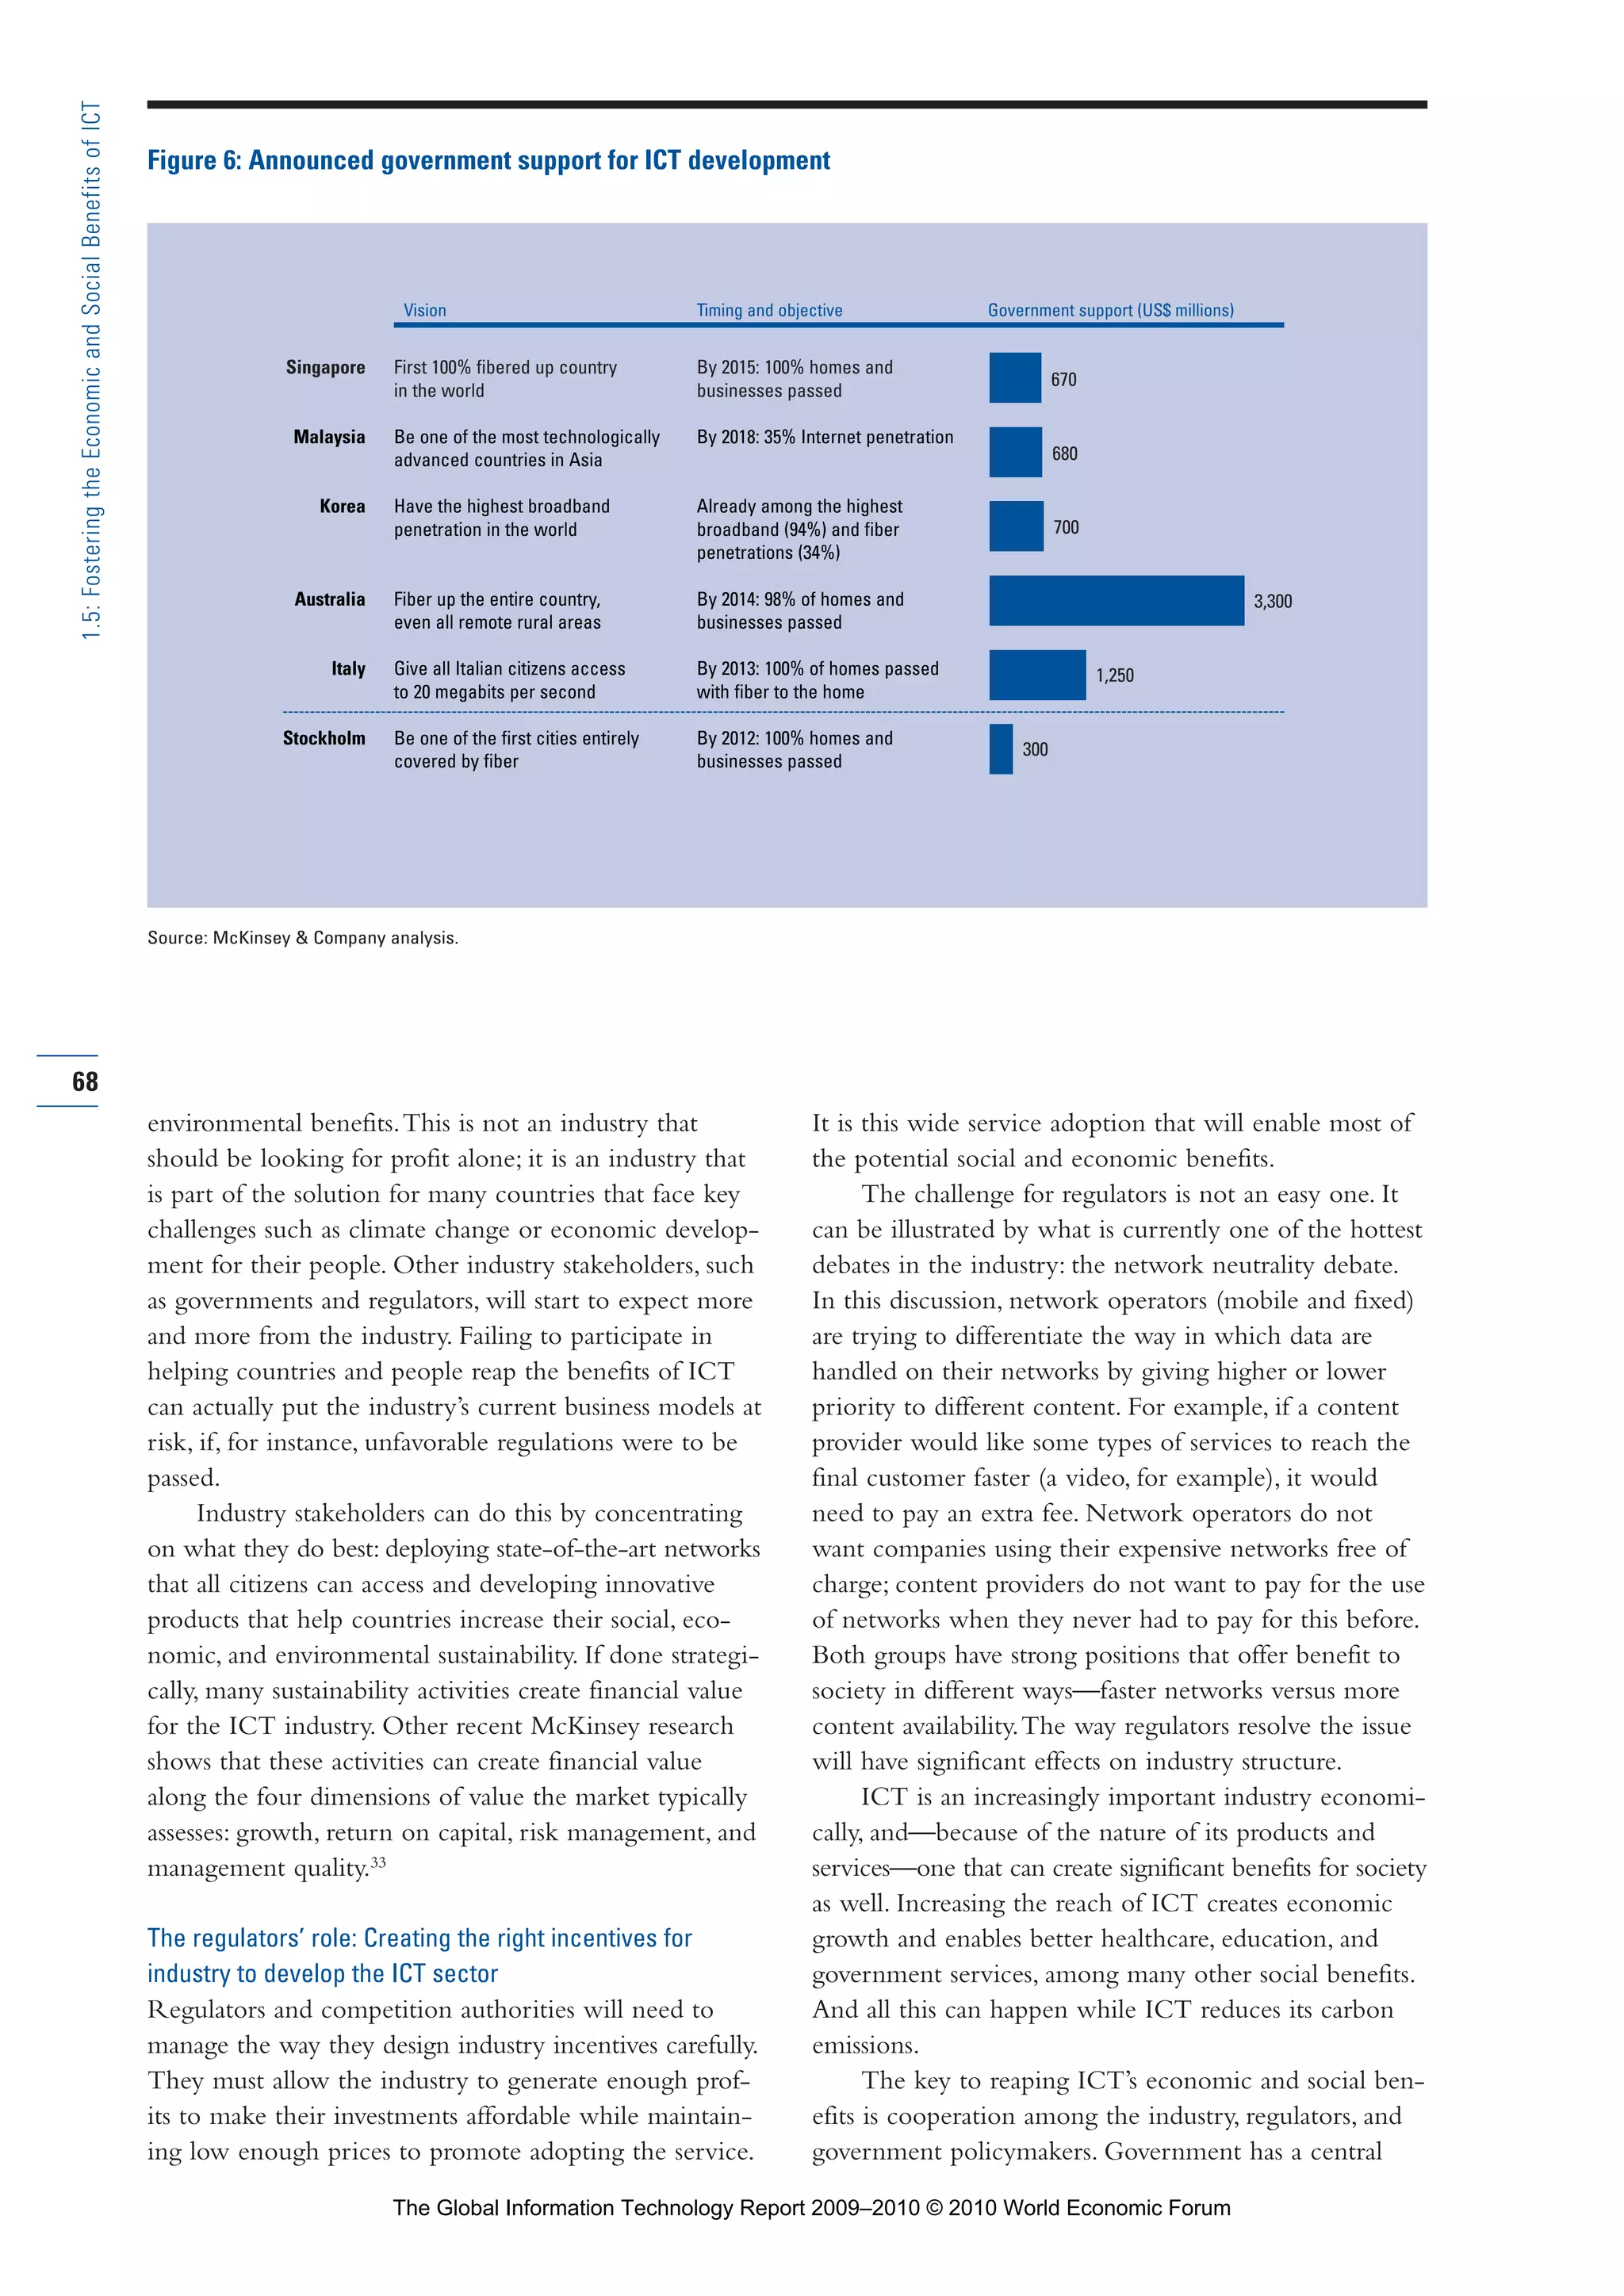
Increasing the penetration levels of high-speed
broadband, mobile, and PCs wasin developed and devel-
oping countries will be extremely costly and is not like-
ly to be profitable for ICT companies alone. For exam-
ple, in the EU15 countries, McKinsey estimates that the
capital investments required to bring high-speed, fixed
broadband networks will be as much as 250–300 bil-
lion over the next couple of years.30
But in this same
region, the industry will generate some 250 billion in
cash flows over the next five years.31
That means that
the industry would need to invest all available cash to
build these networks, leaving nothing for maintenance
or other types of network upgrades, or anything else.At
its current investment rates, the industry would take
some 15 years to roll out new networks.The situation is
obviously even more unbalanced in emerging economies,
where penetration levels are lower—and consequently
the necessary investments would be higher—than in
Europe.
The estimates above indicate that governments,
at least in Europe, will need to invest large amounts
of money to enable their countries with ICT. Making
these investments work will require a concerted
approach among all industry stakeholders.
All stakeholders need to adapt their strategies and
cooperate
It is no easy task to align the interests of the various
stakeholders when so much is at stake: ICT companies
seek revenue, governments seek access to innovative
services and tax revenues as well as economic growth,
66
1.5:FosteringtheEconomicandSocialBenefitsofICT
Part 1.r2 3/2/10 4:40 AM Page 66
The Global Information Technology Report 2009–2010 © 2010 World Economic Forum](https://image.slidesharecdn.com/cusersdesktop2010gitr2009-2010fullreportfinal-100402152331-phpapp01/75/The-Global-Information-Technology-Report-2009-2010-86-2048.jpg)

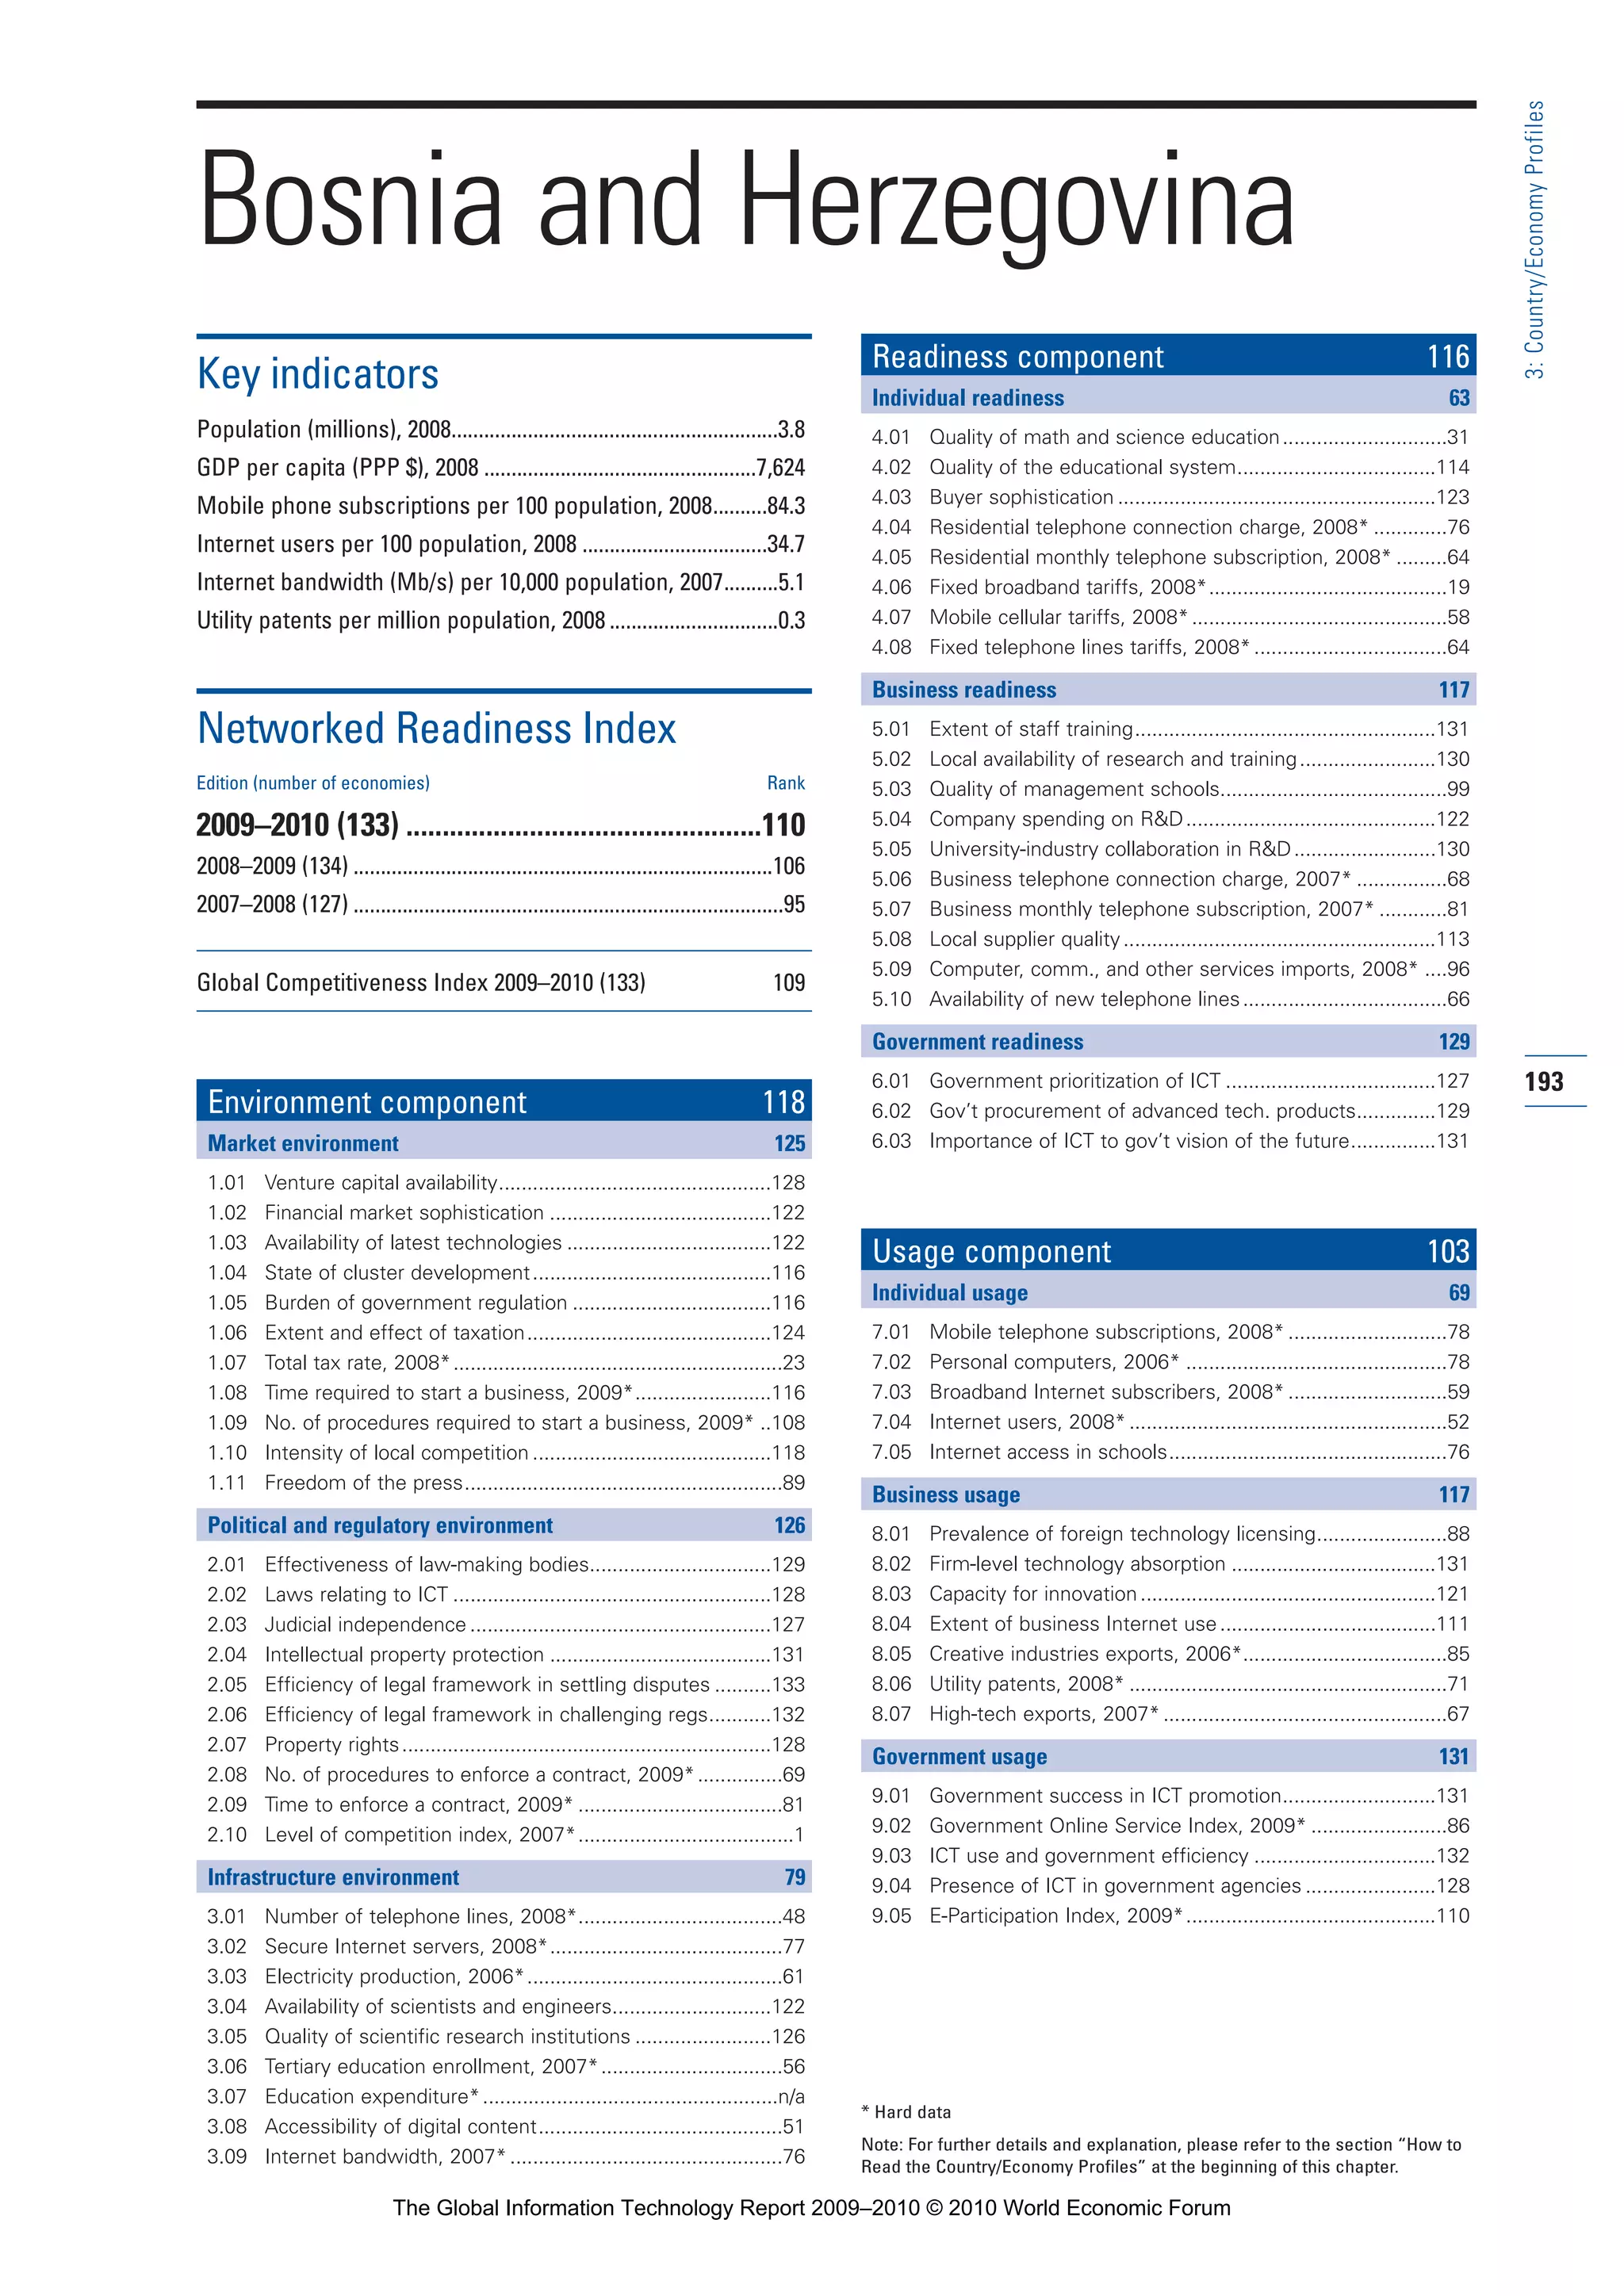
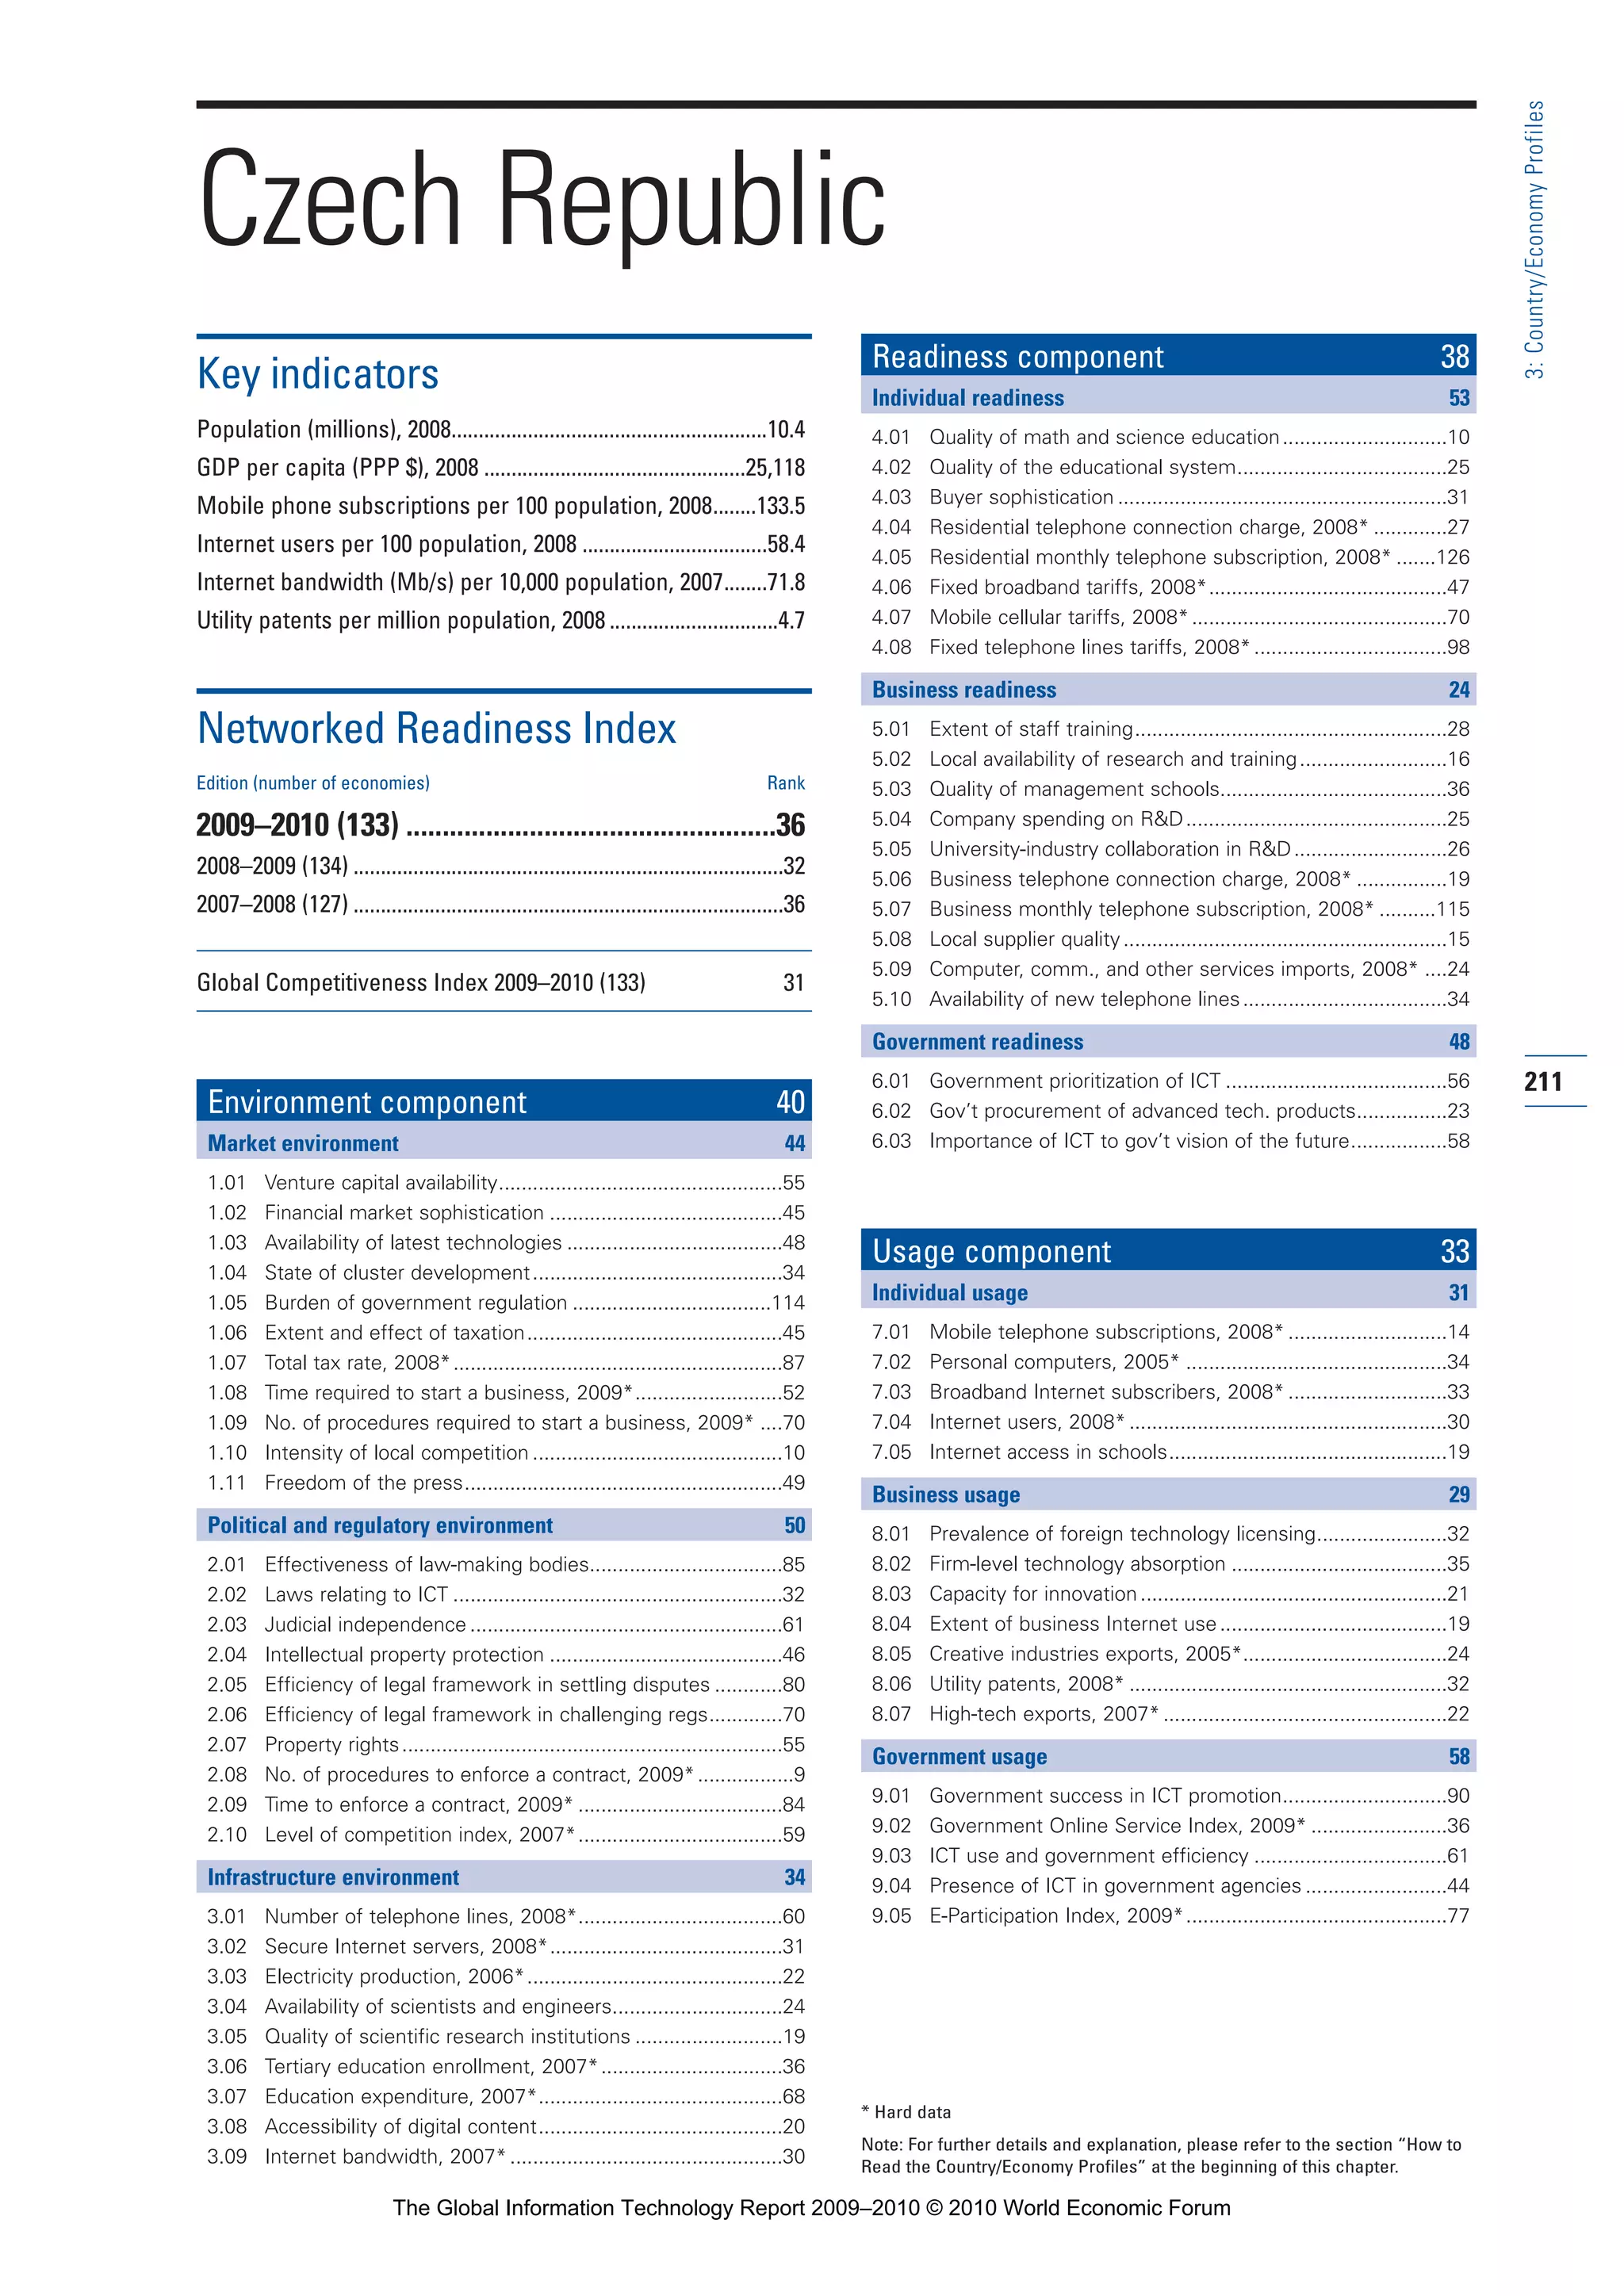
![Sources of CO2
equivalents
Resource module
As a simple example, to reduce the energy use of a
building one must change the properties of the building
itself or manage what goes on inside that building.To
do this, one must understand how these activities affect
the use of the building—activities that are not usually
measured or metered independently.
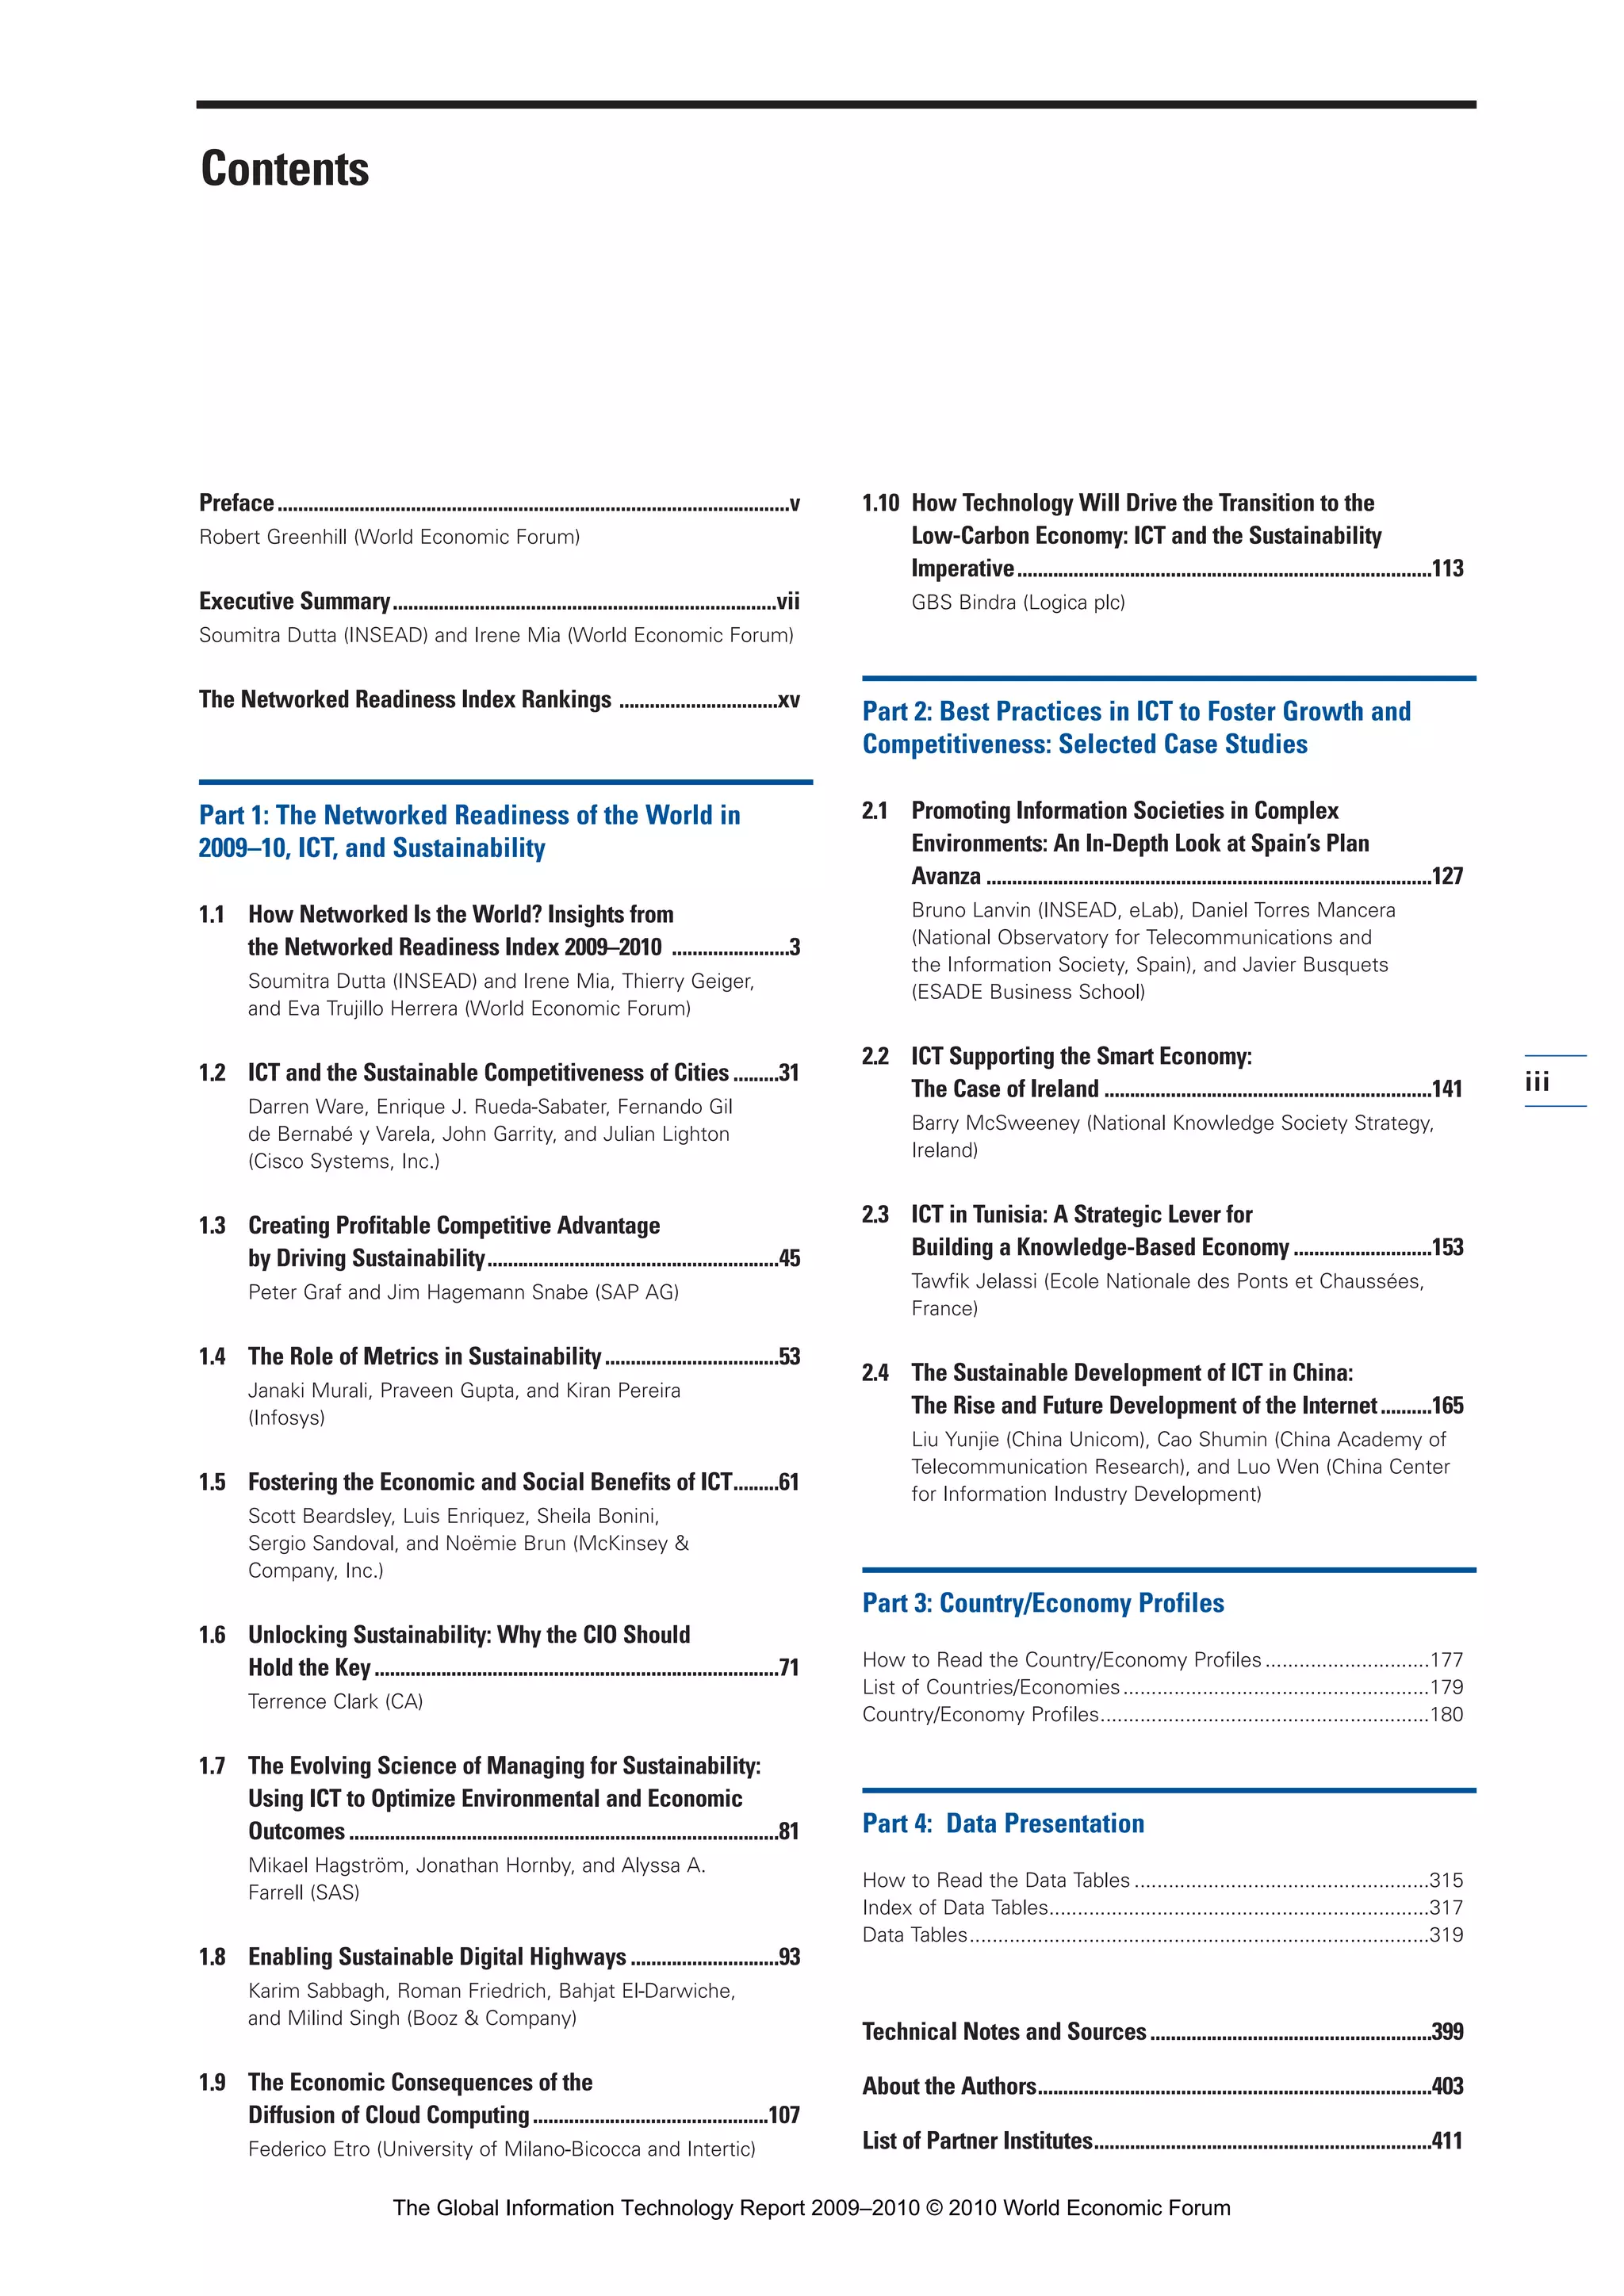
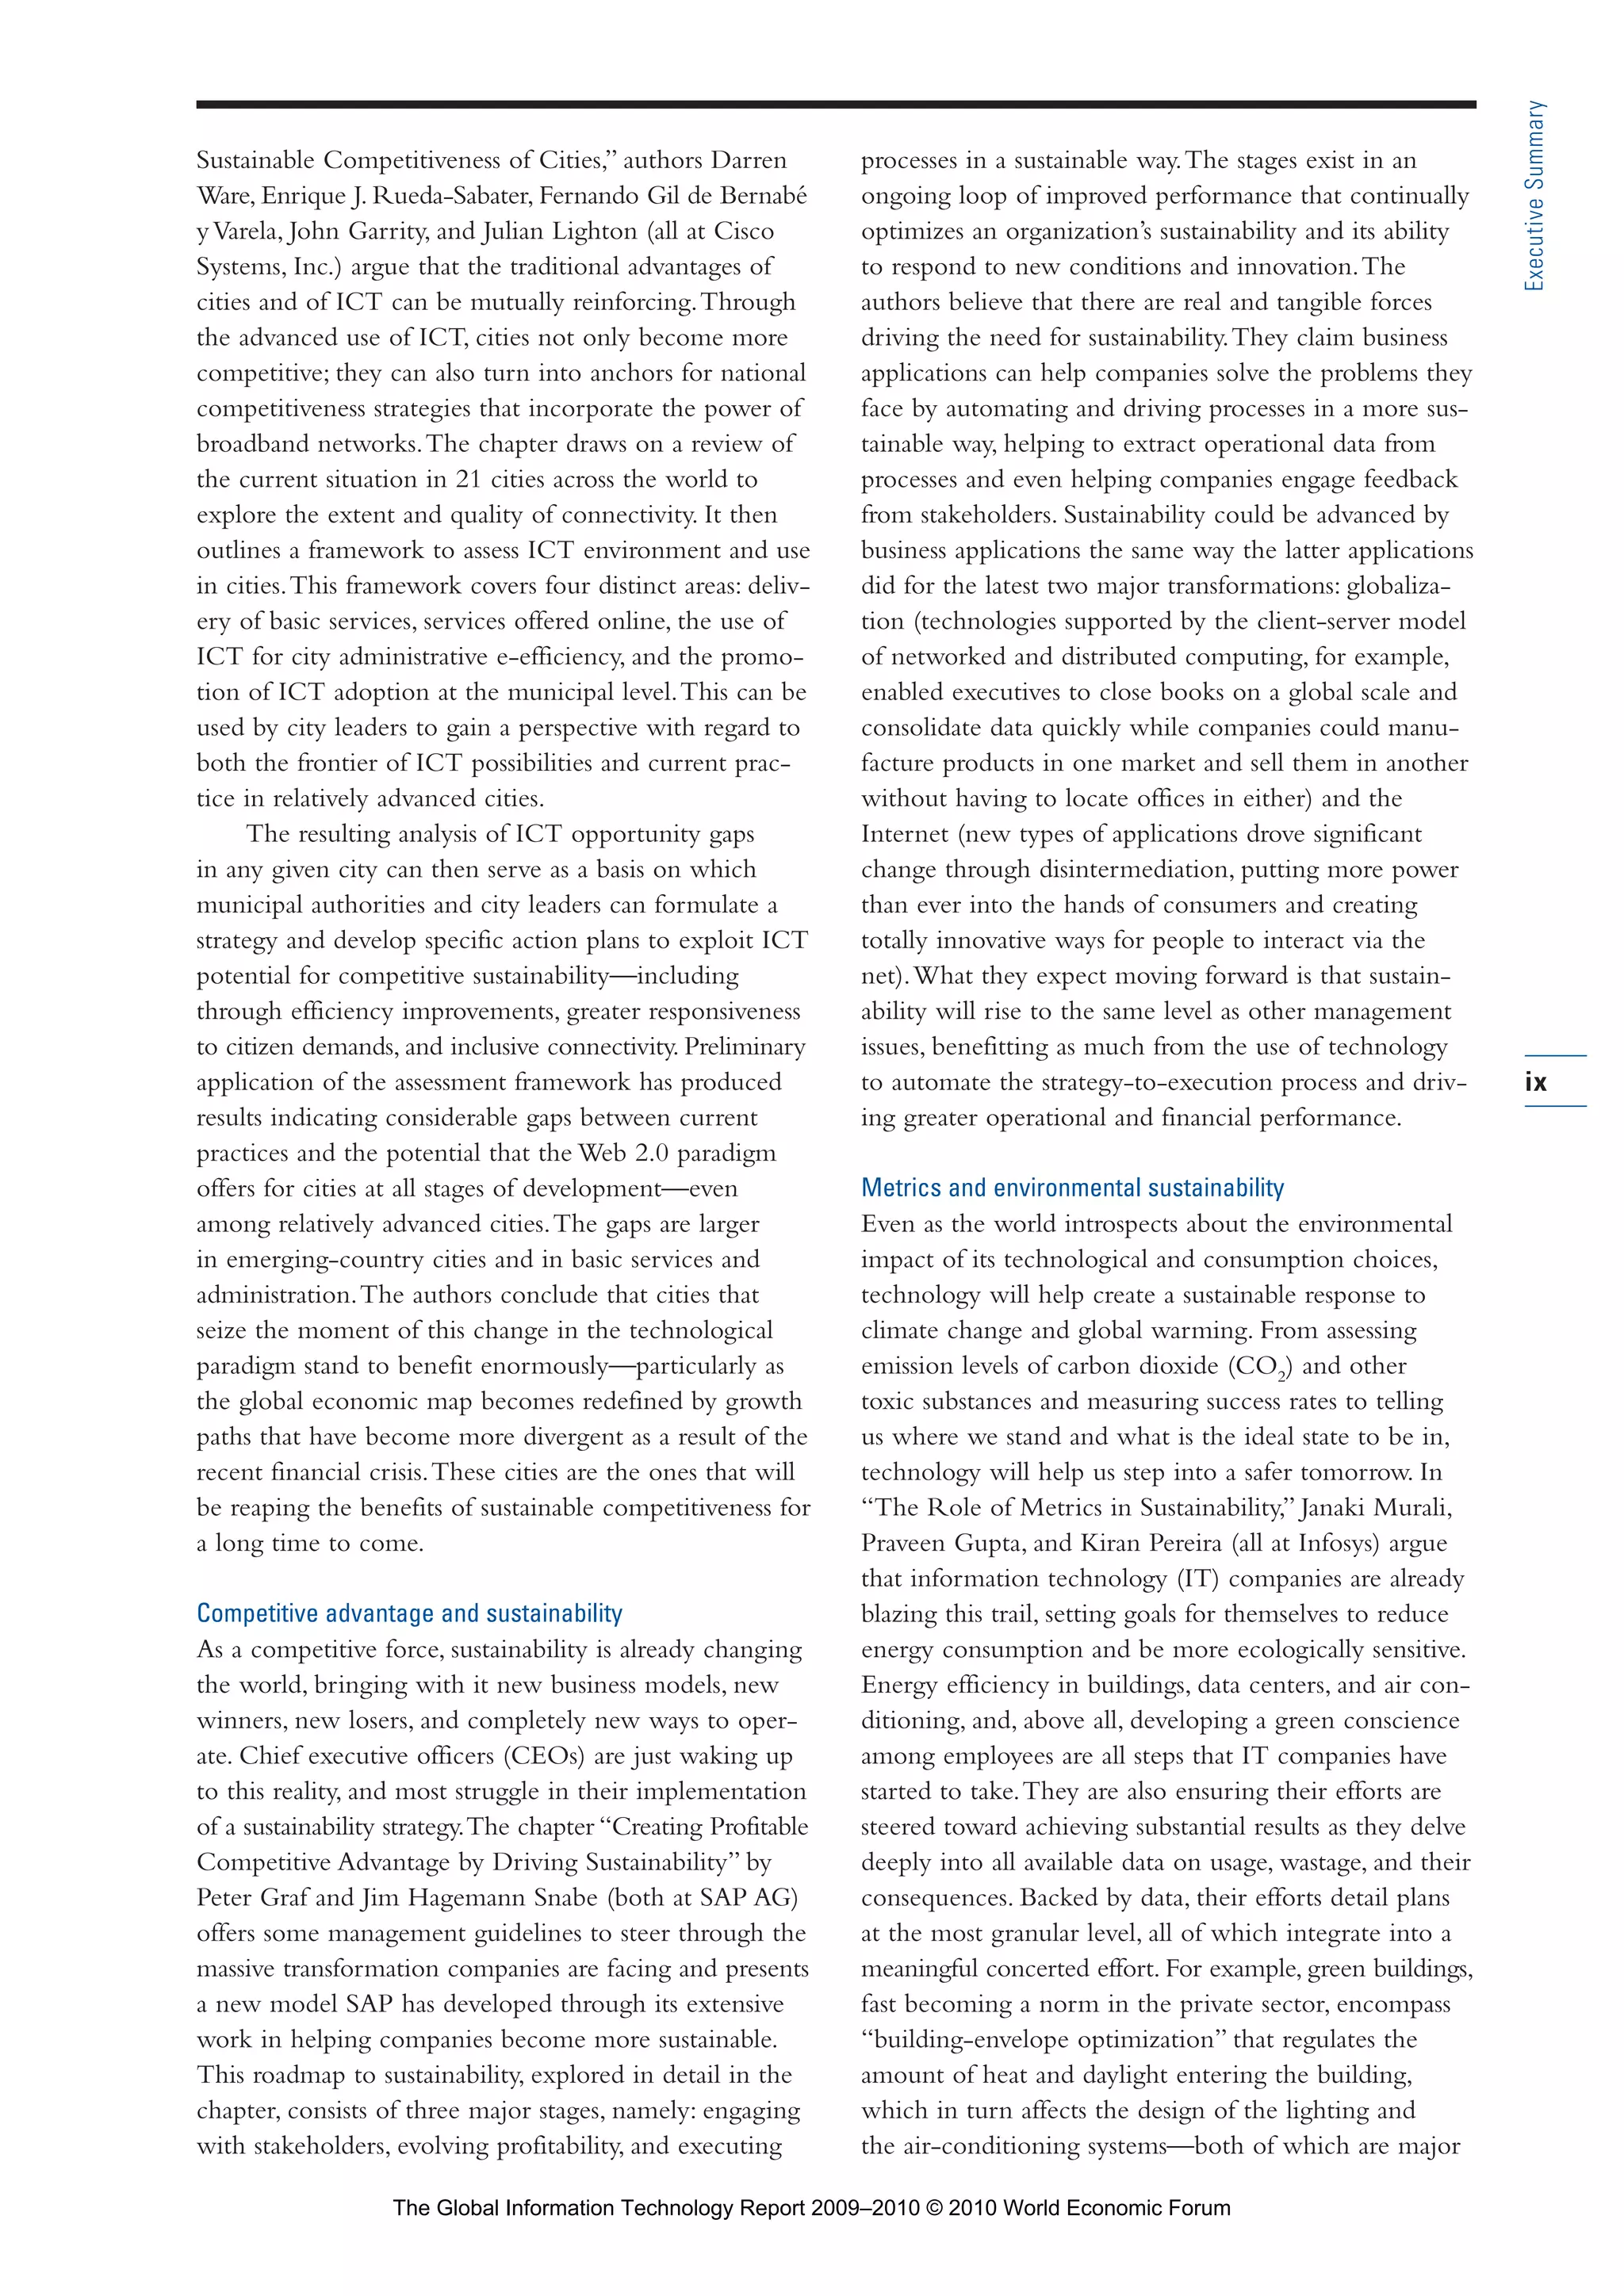
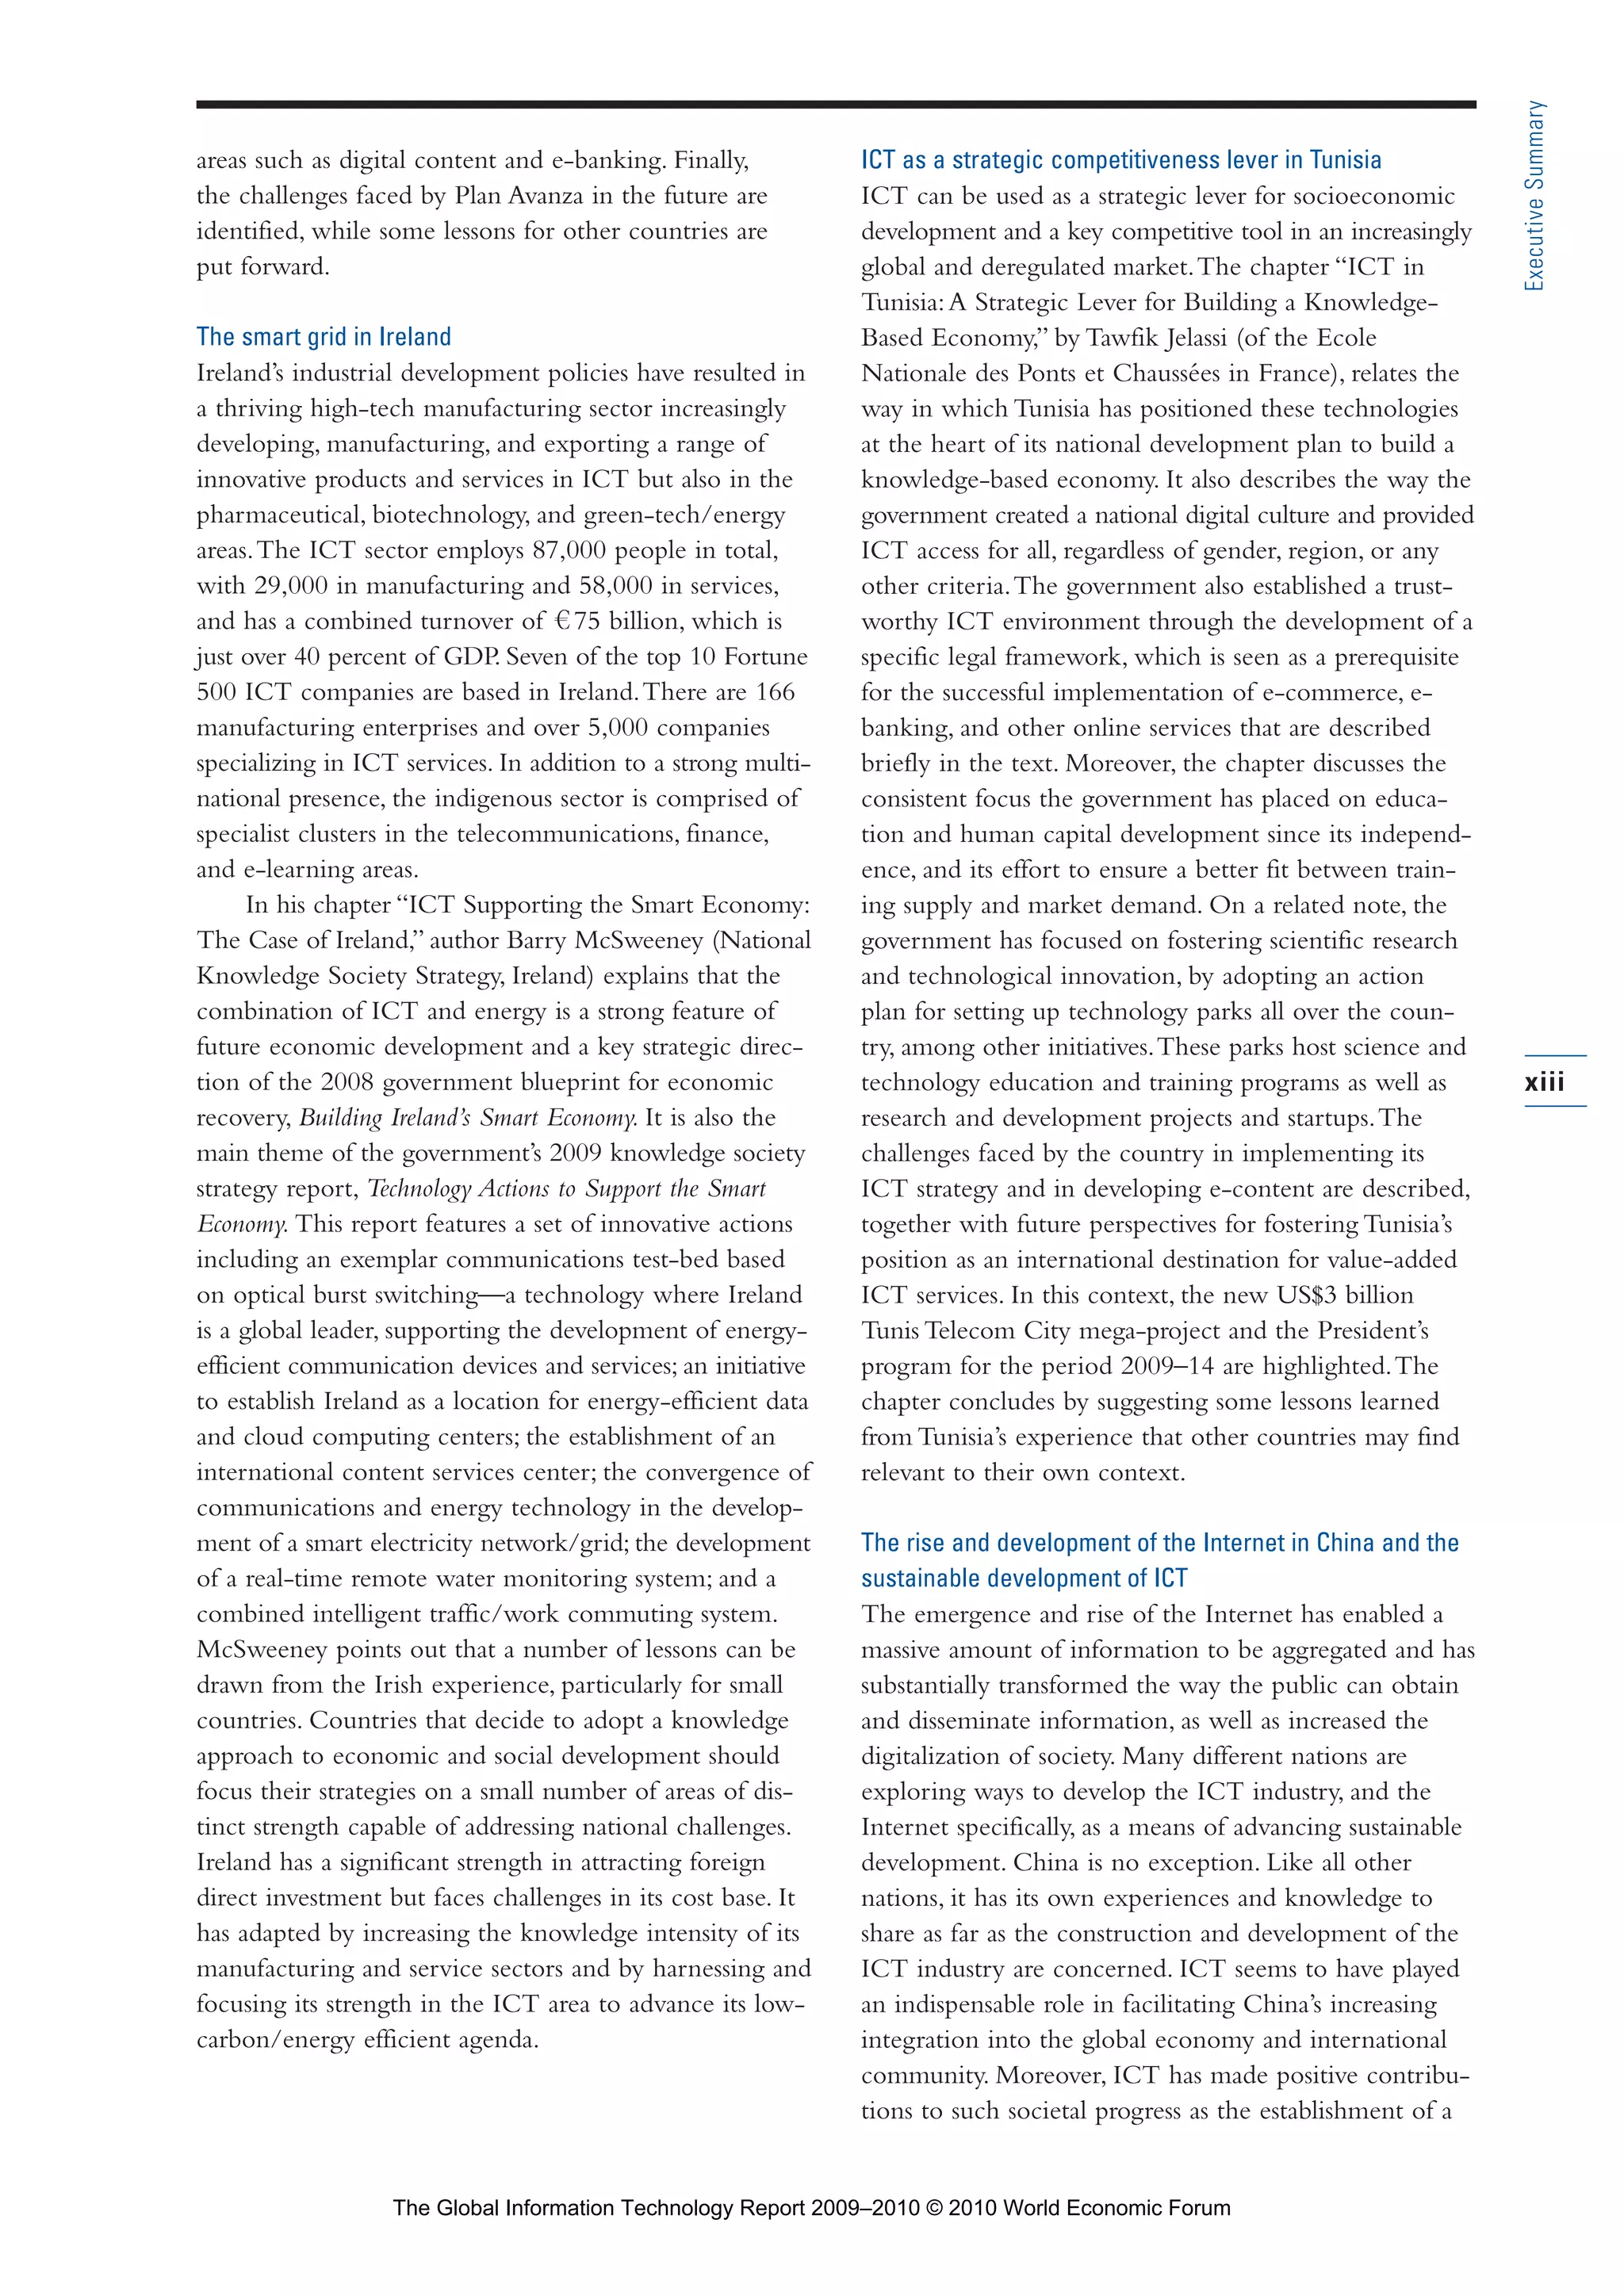
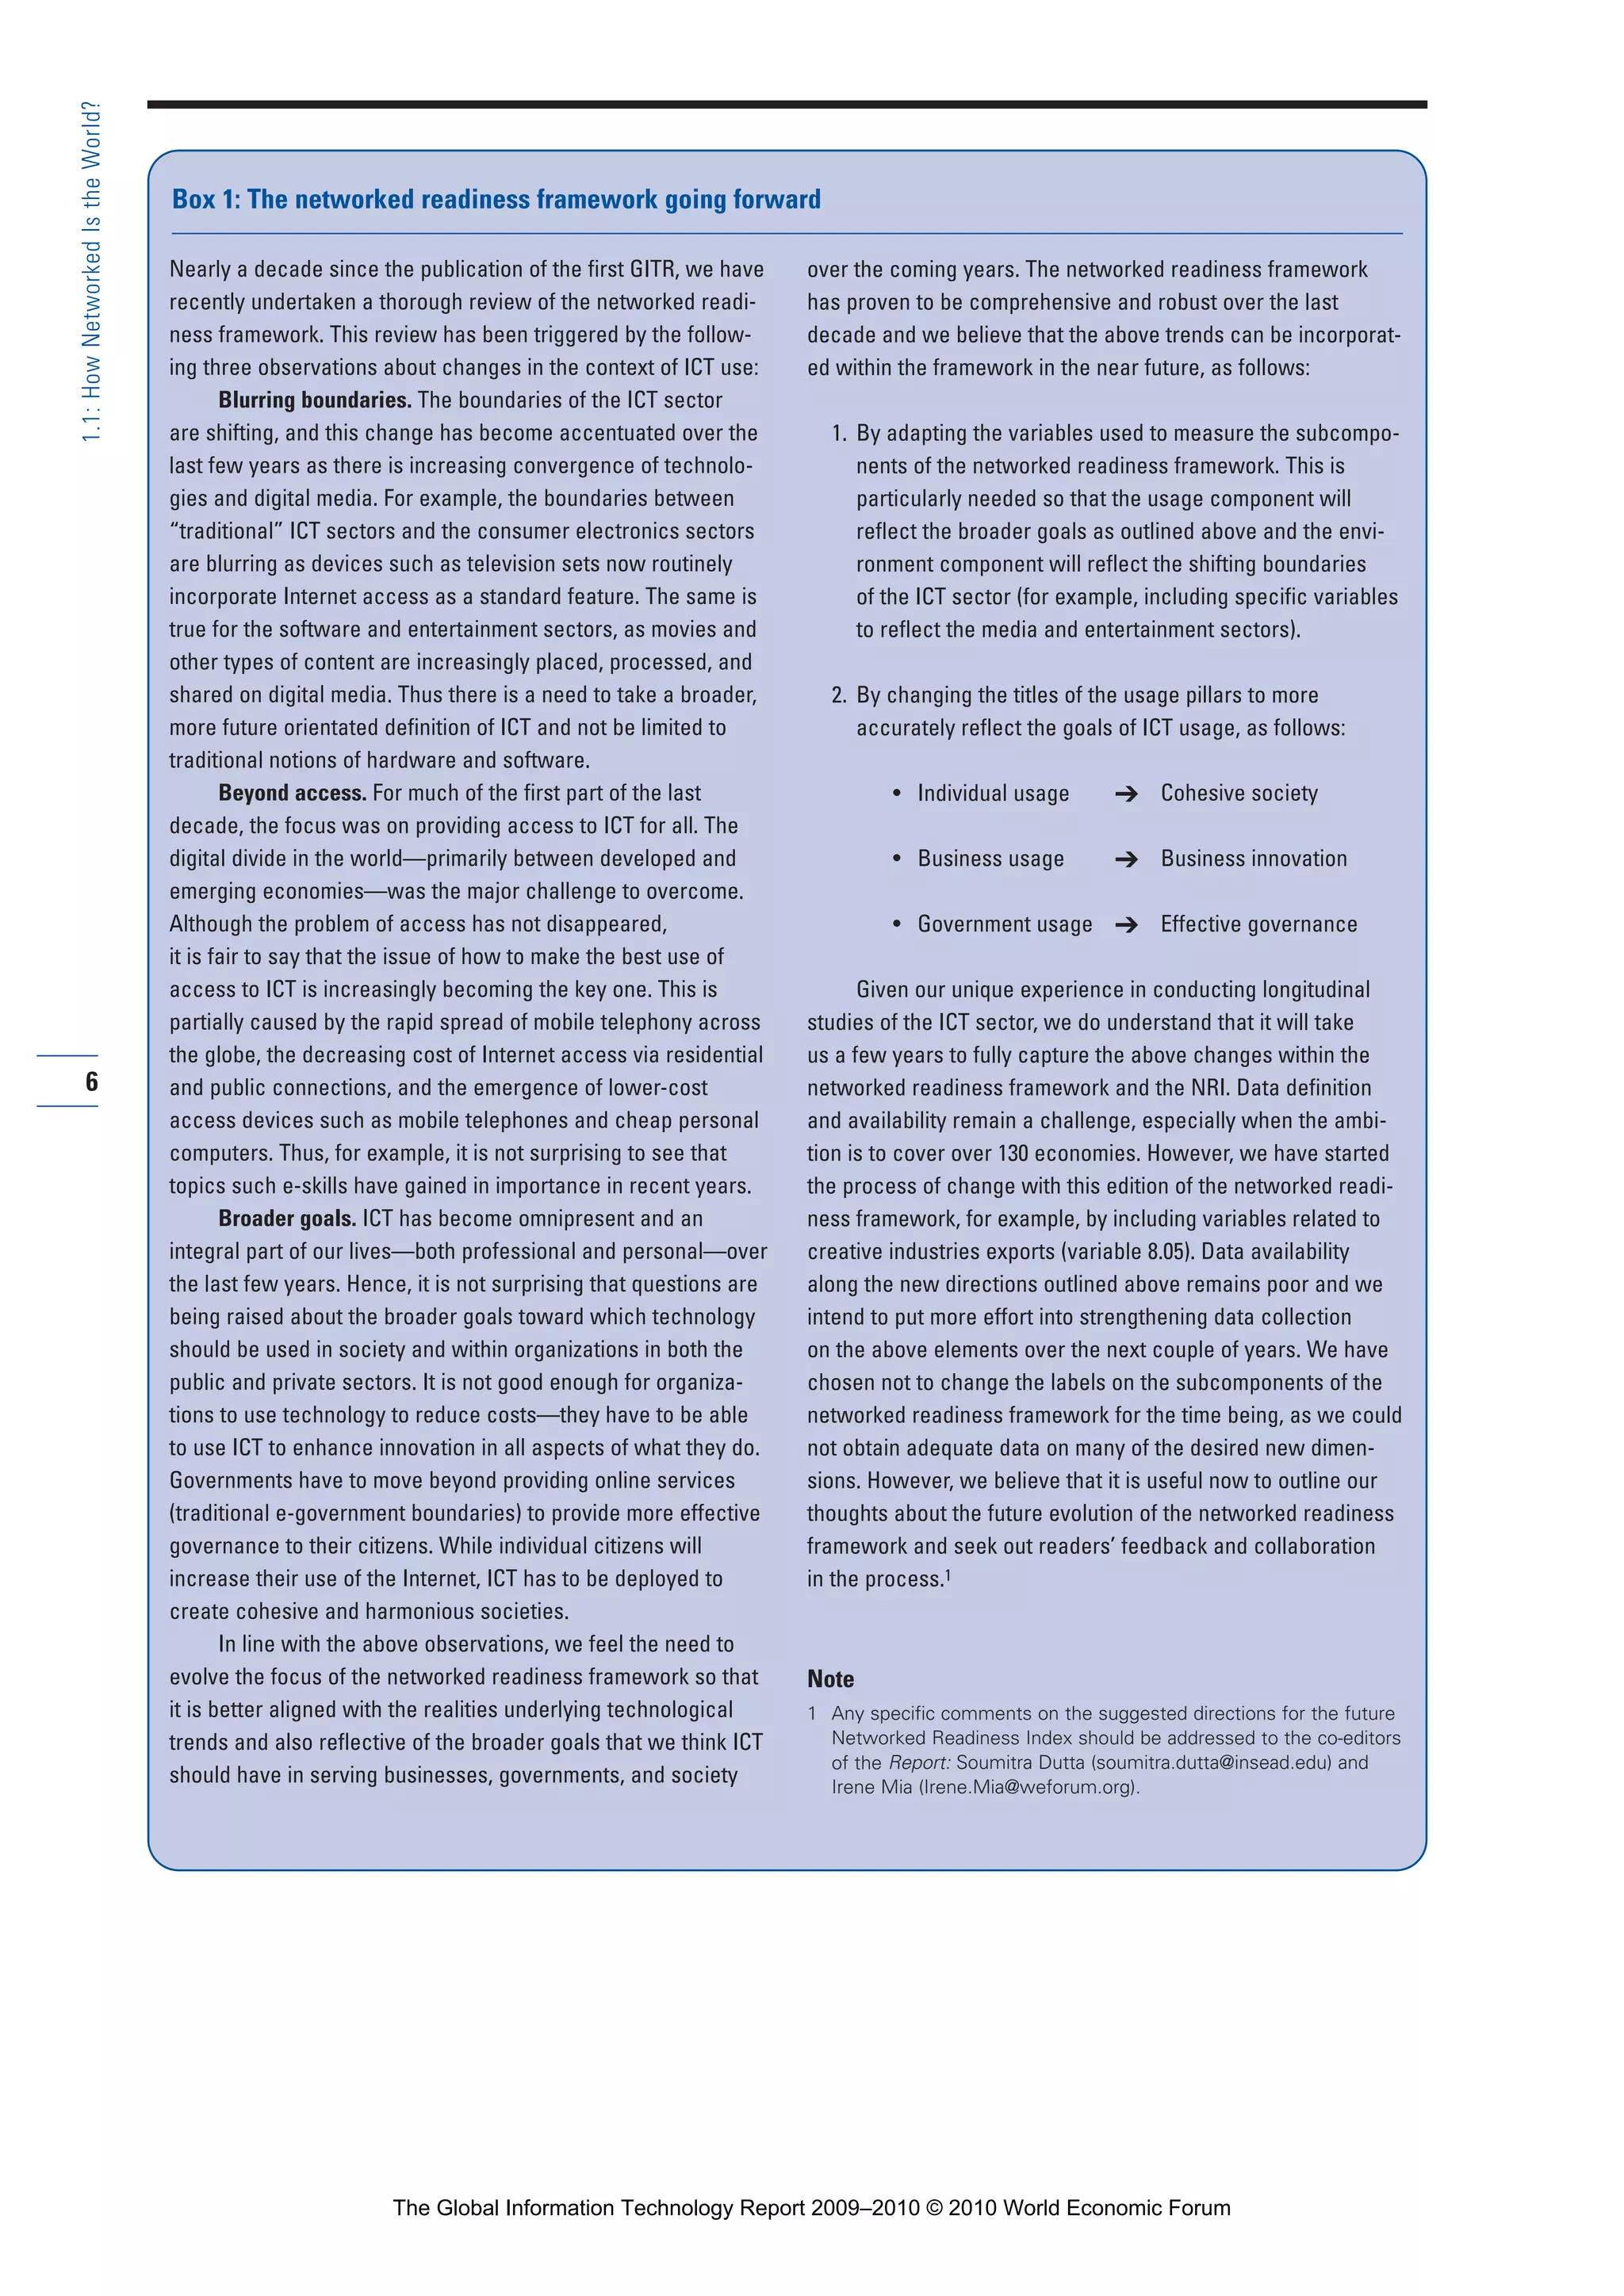
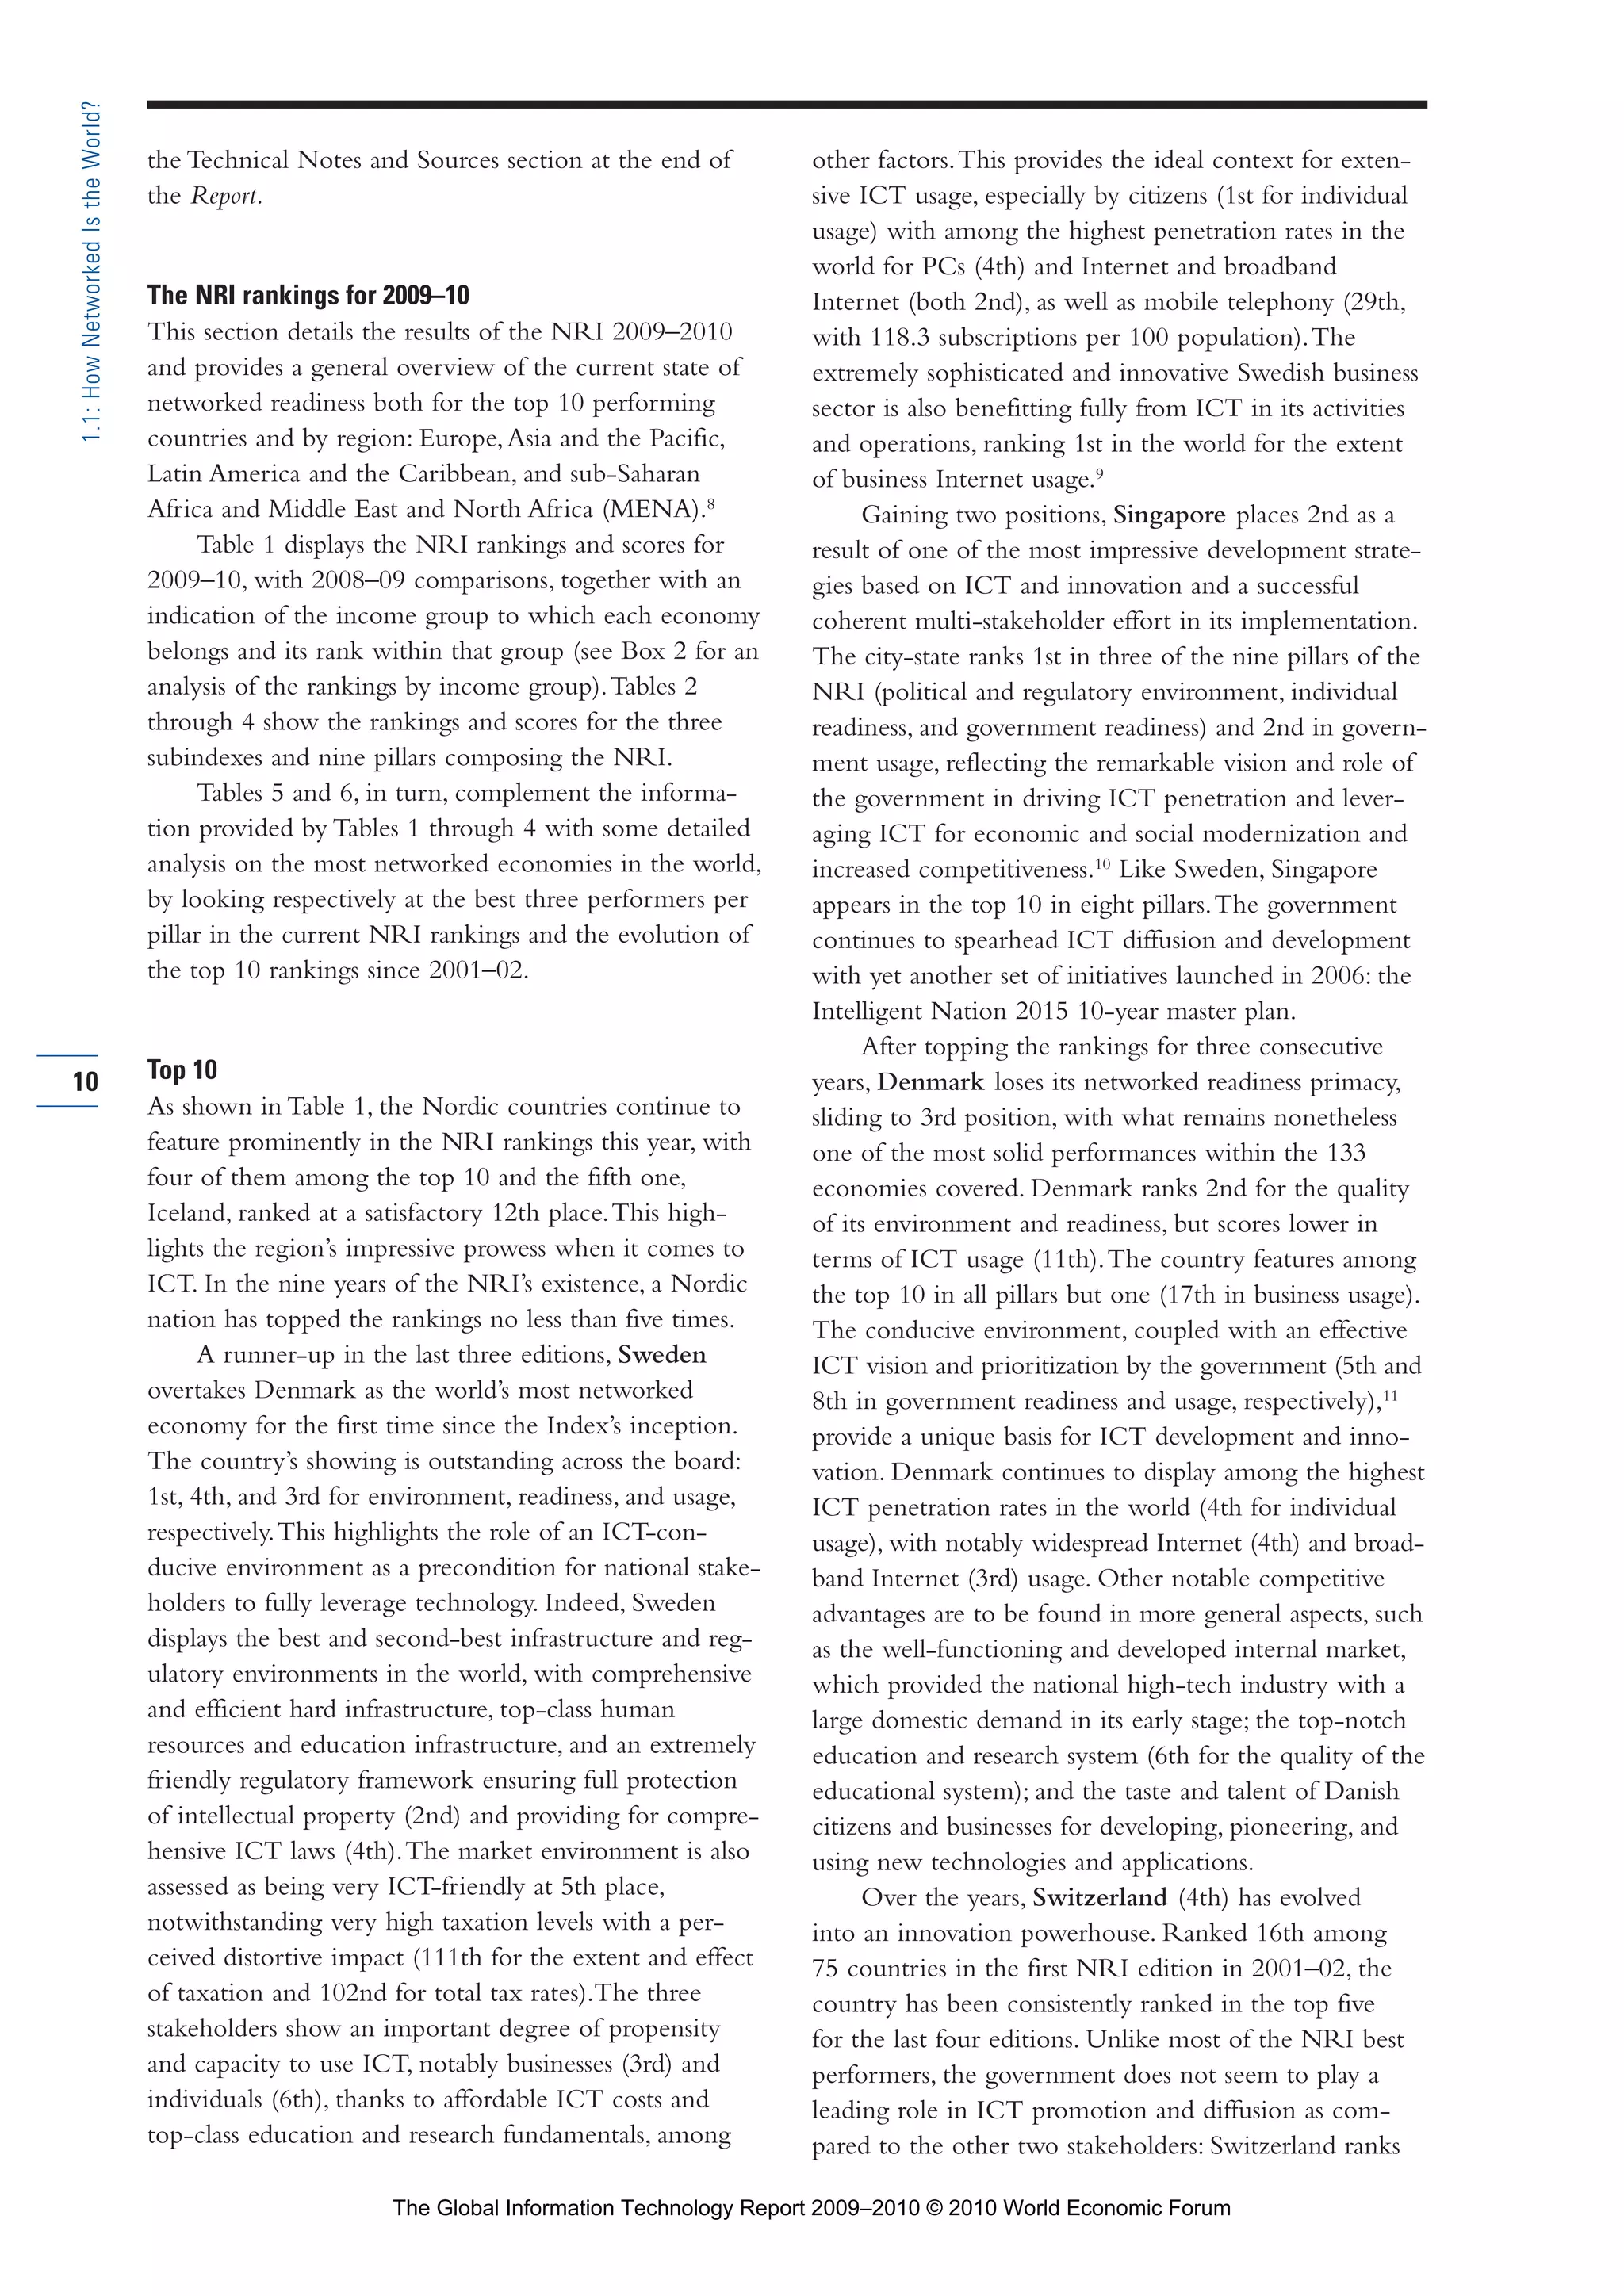
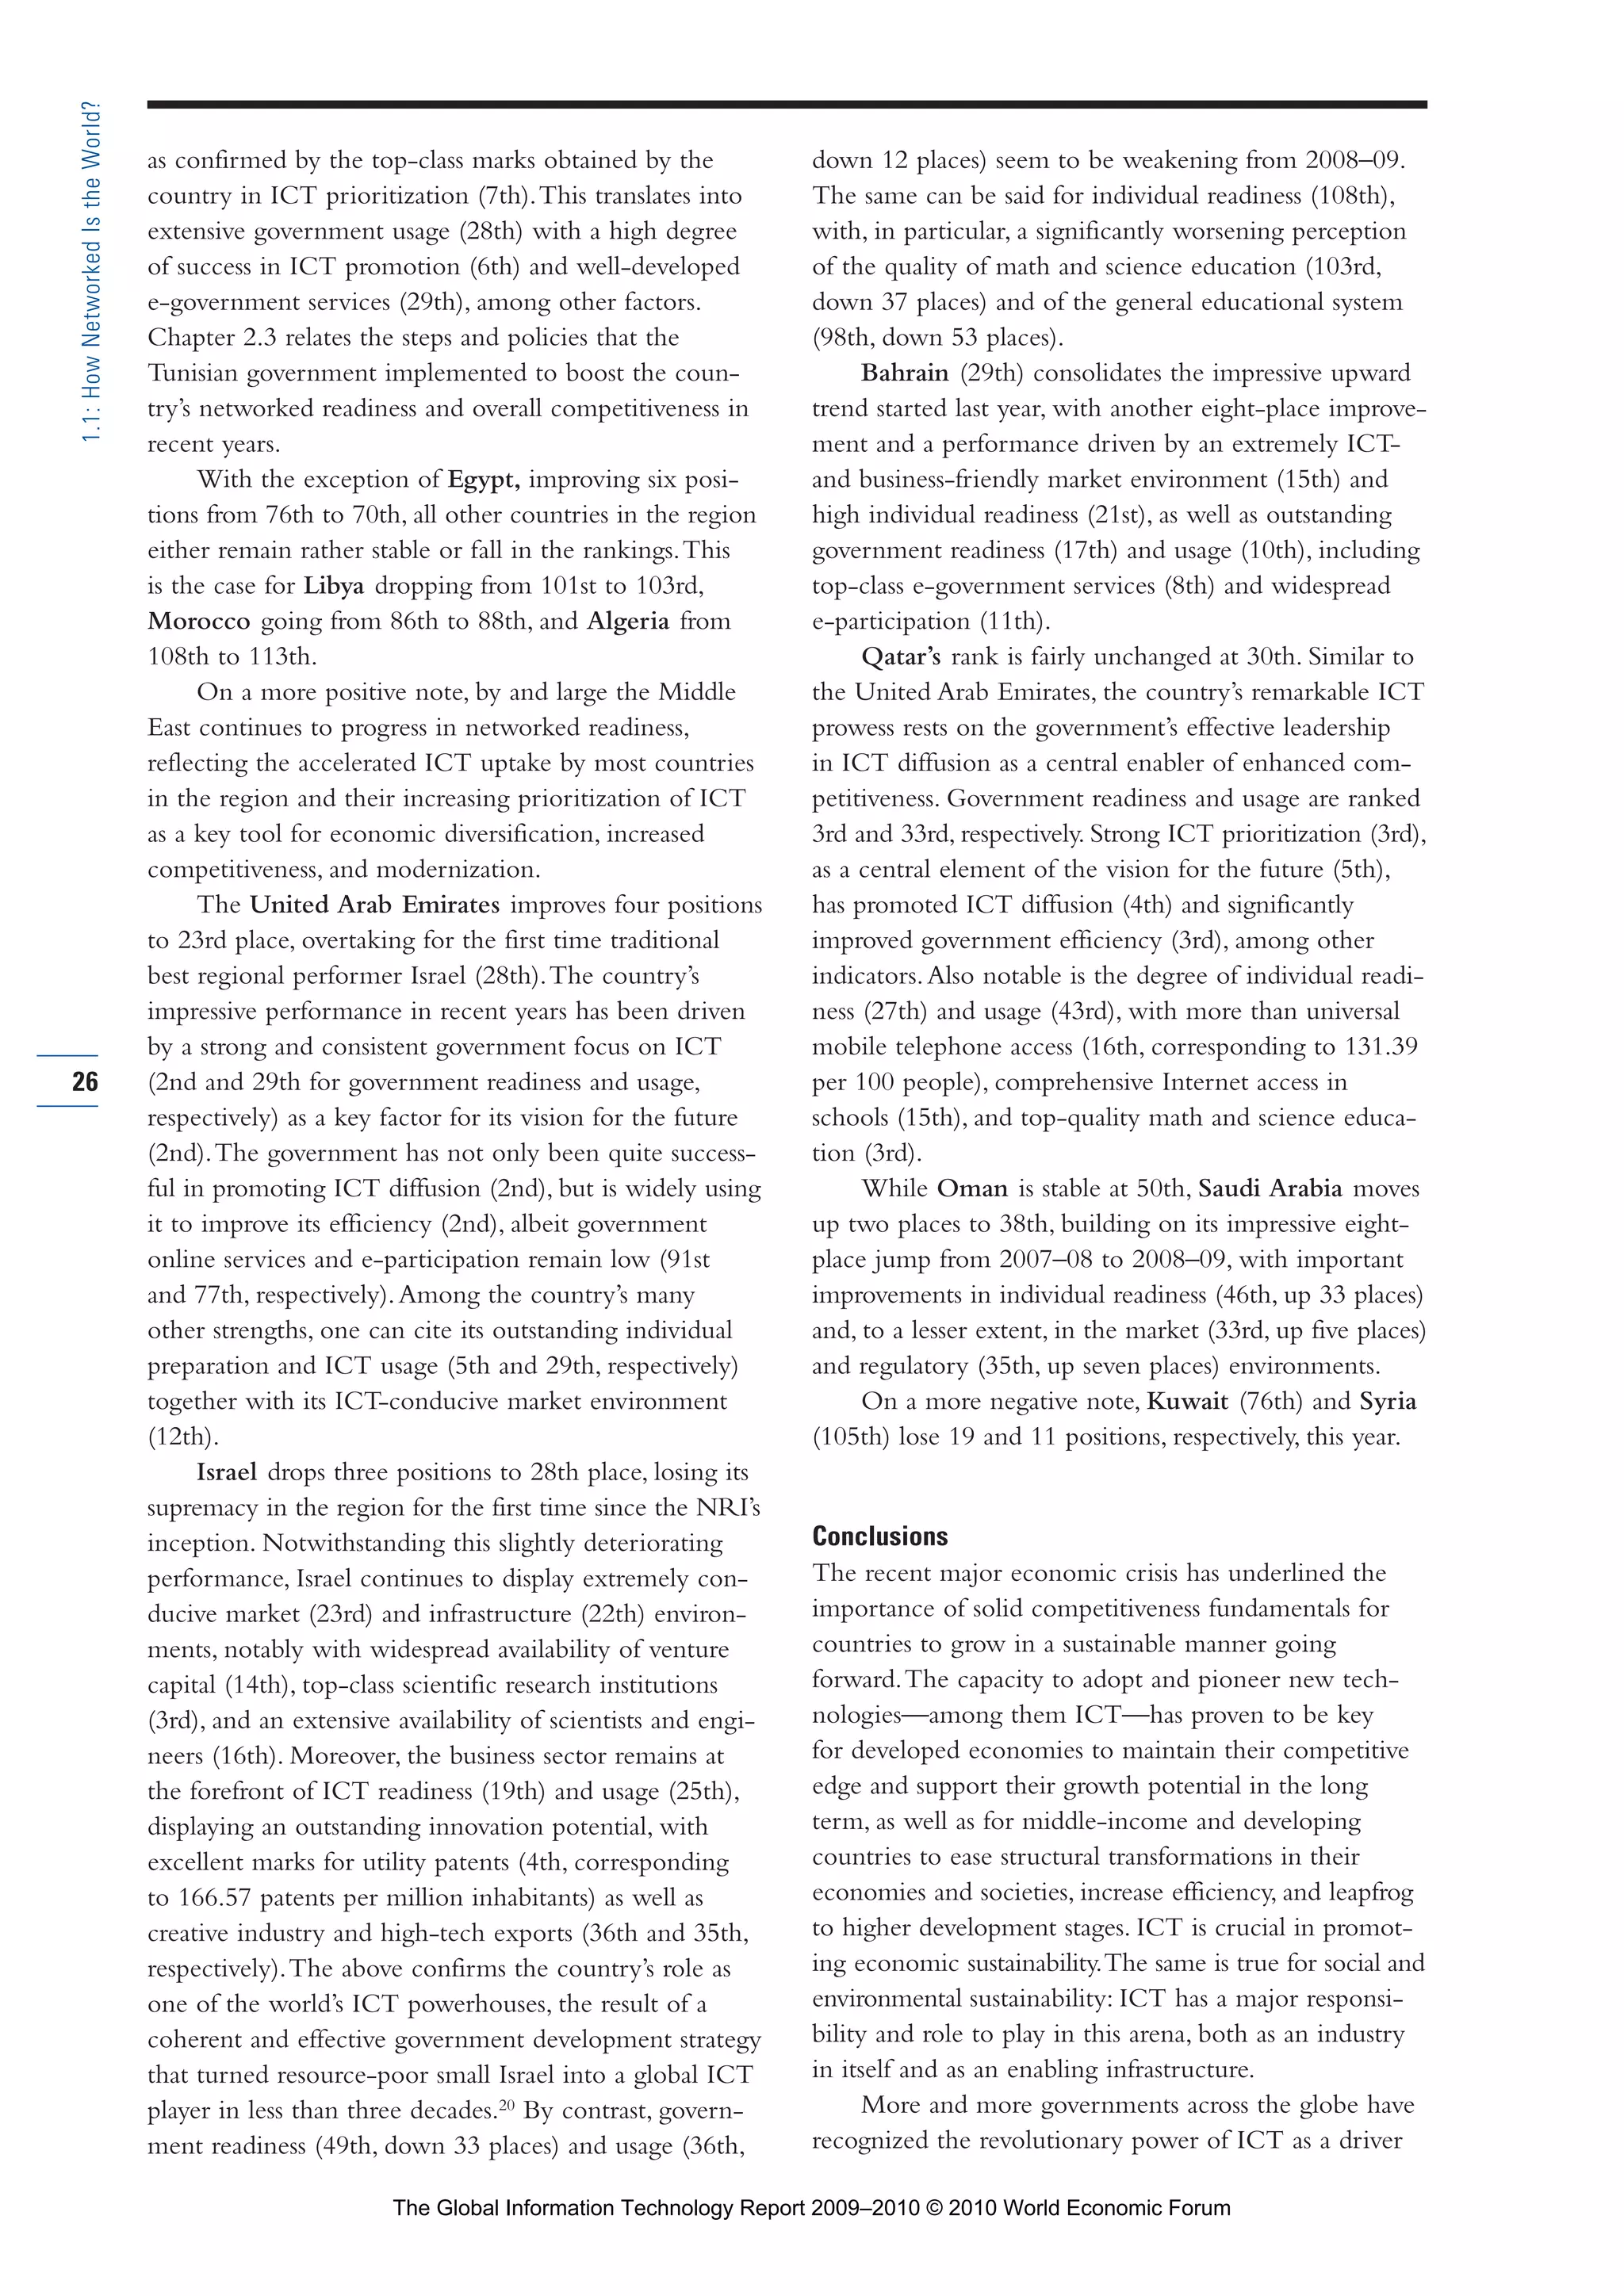
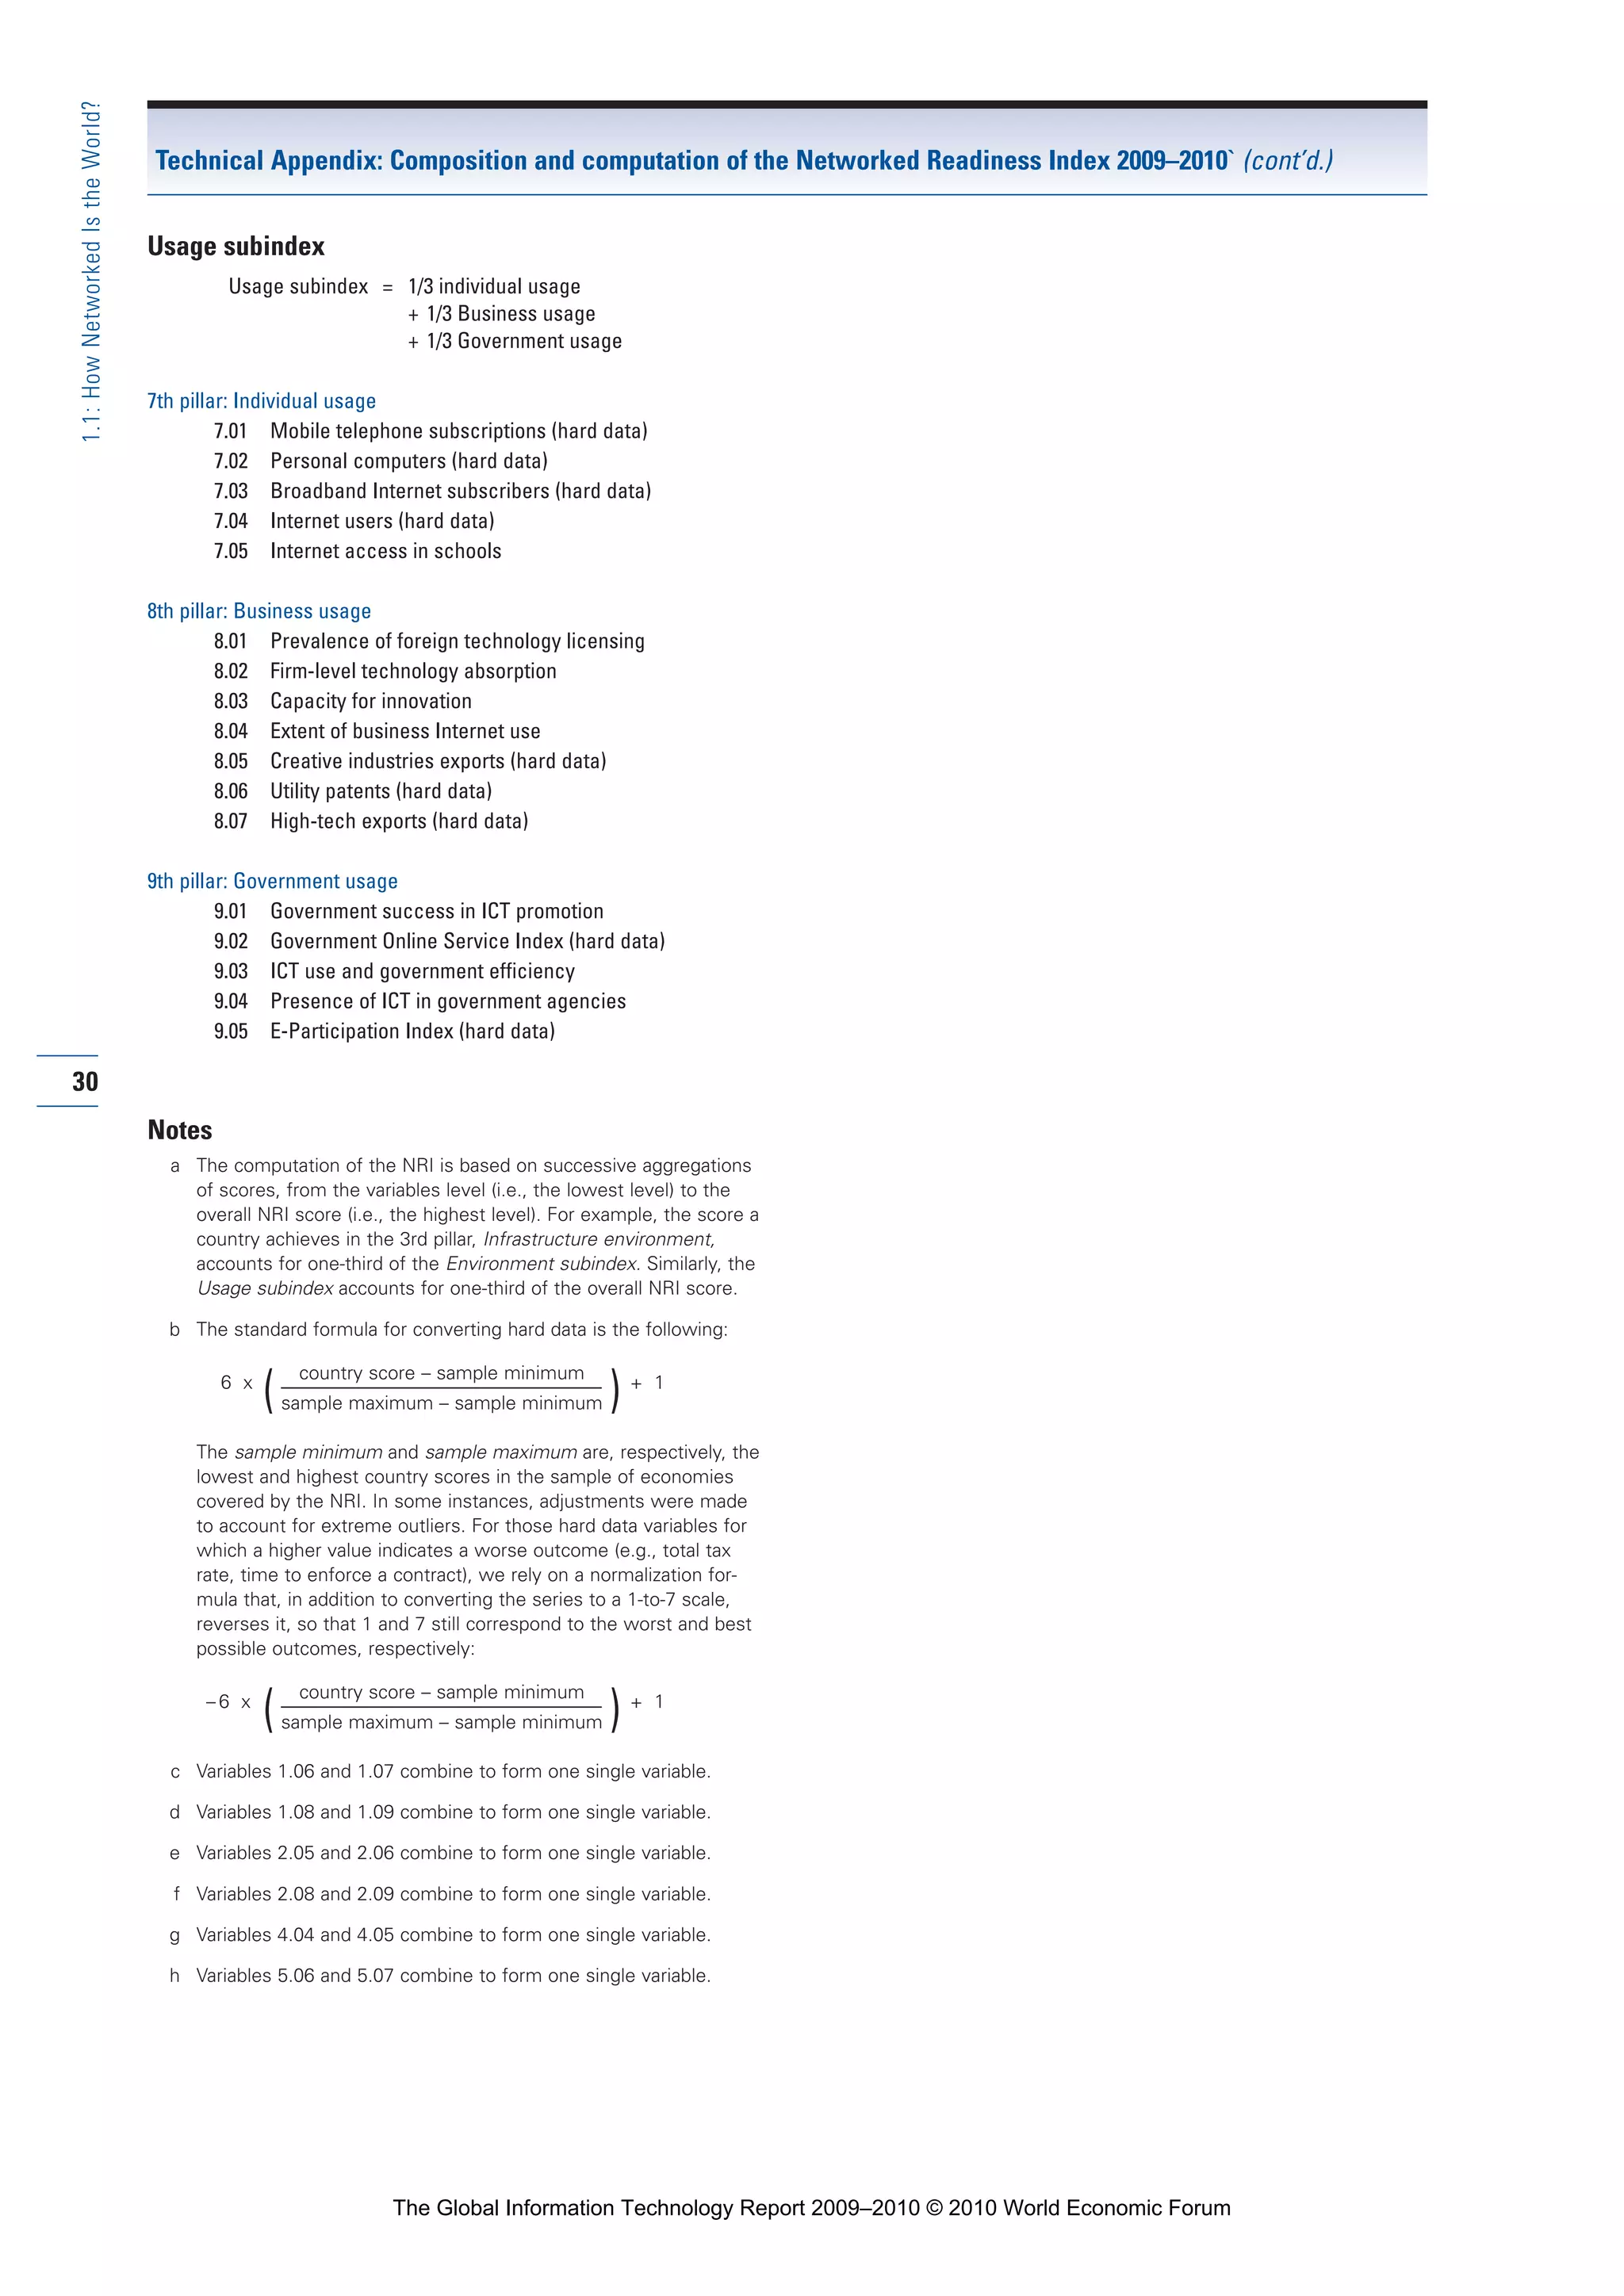
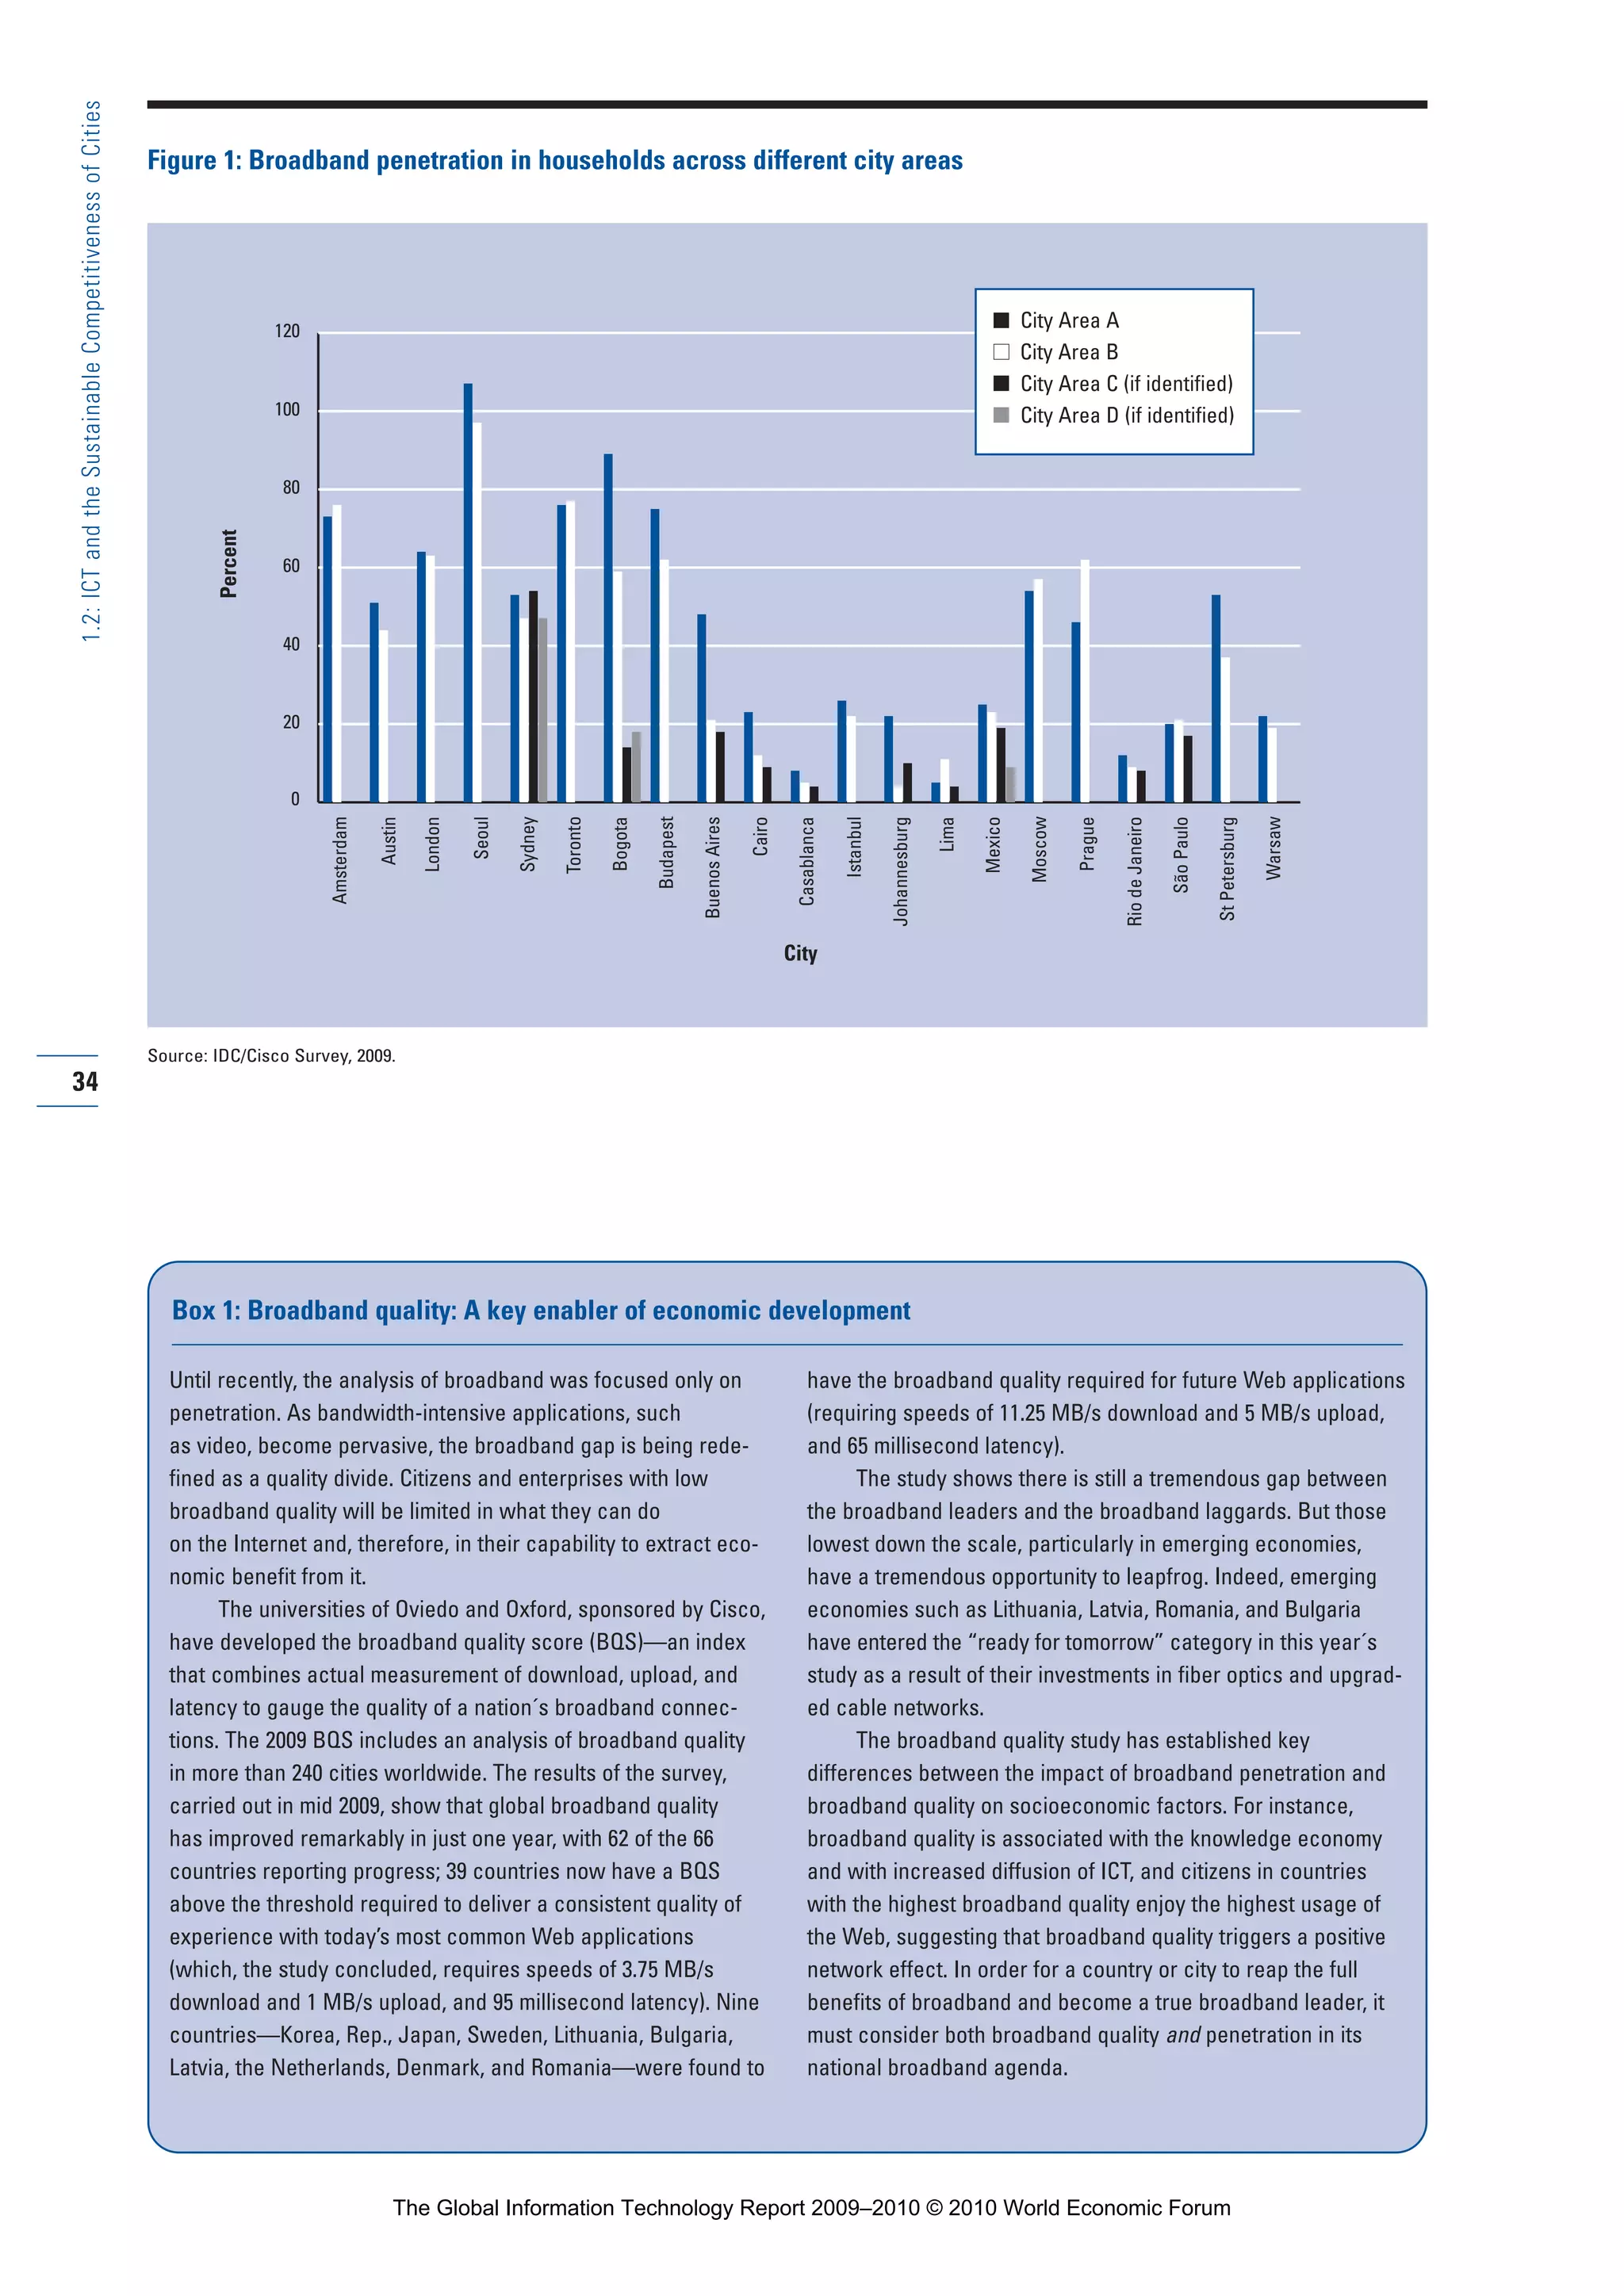
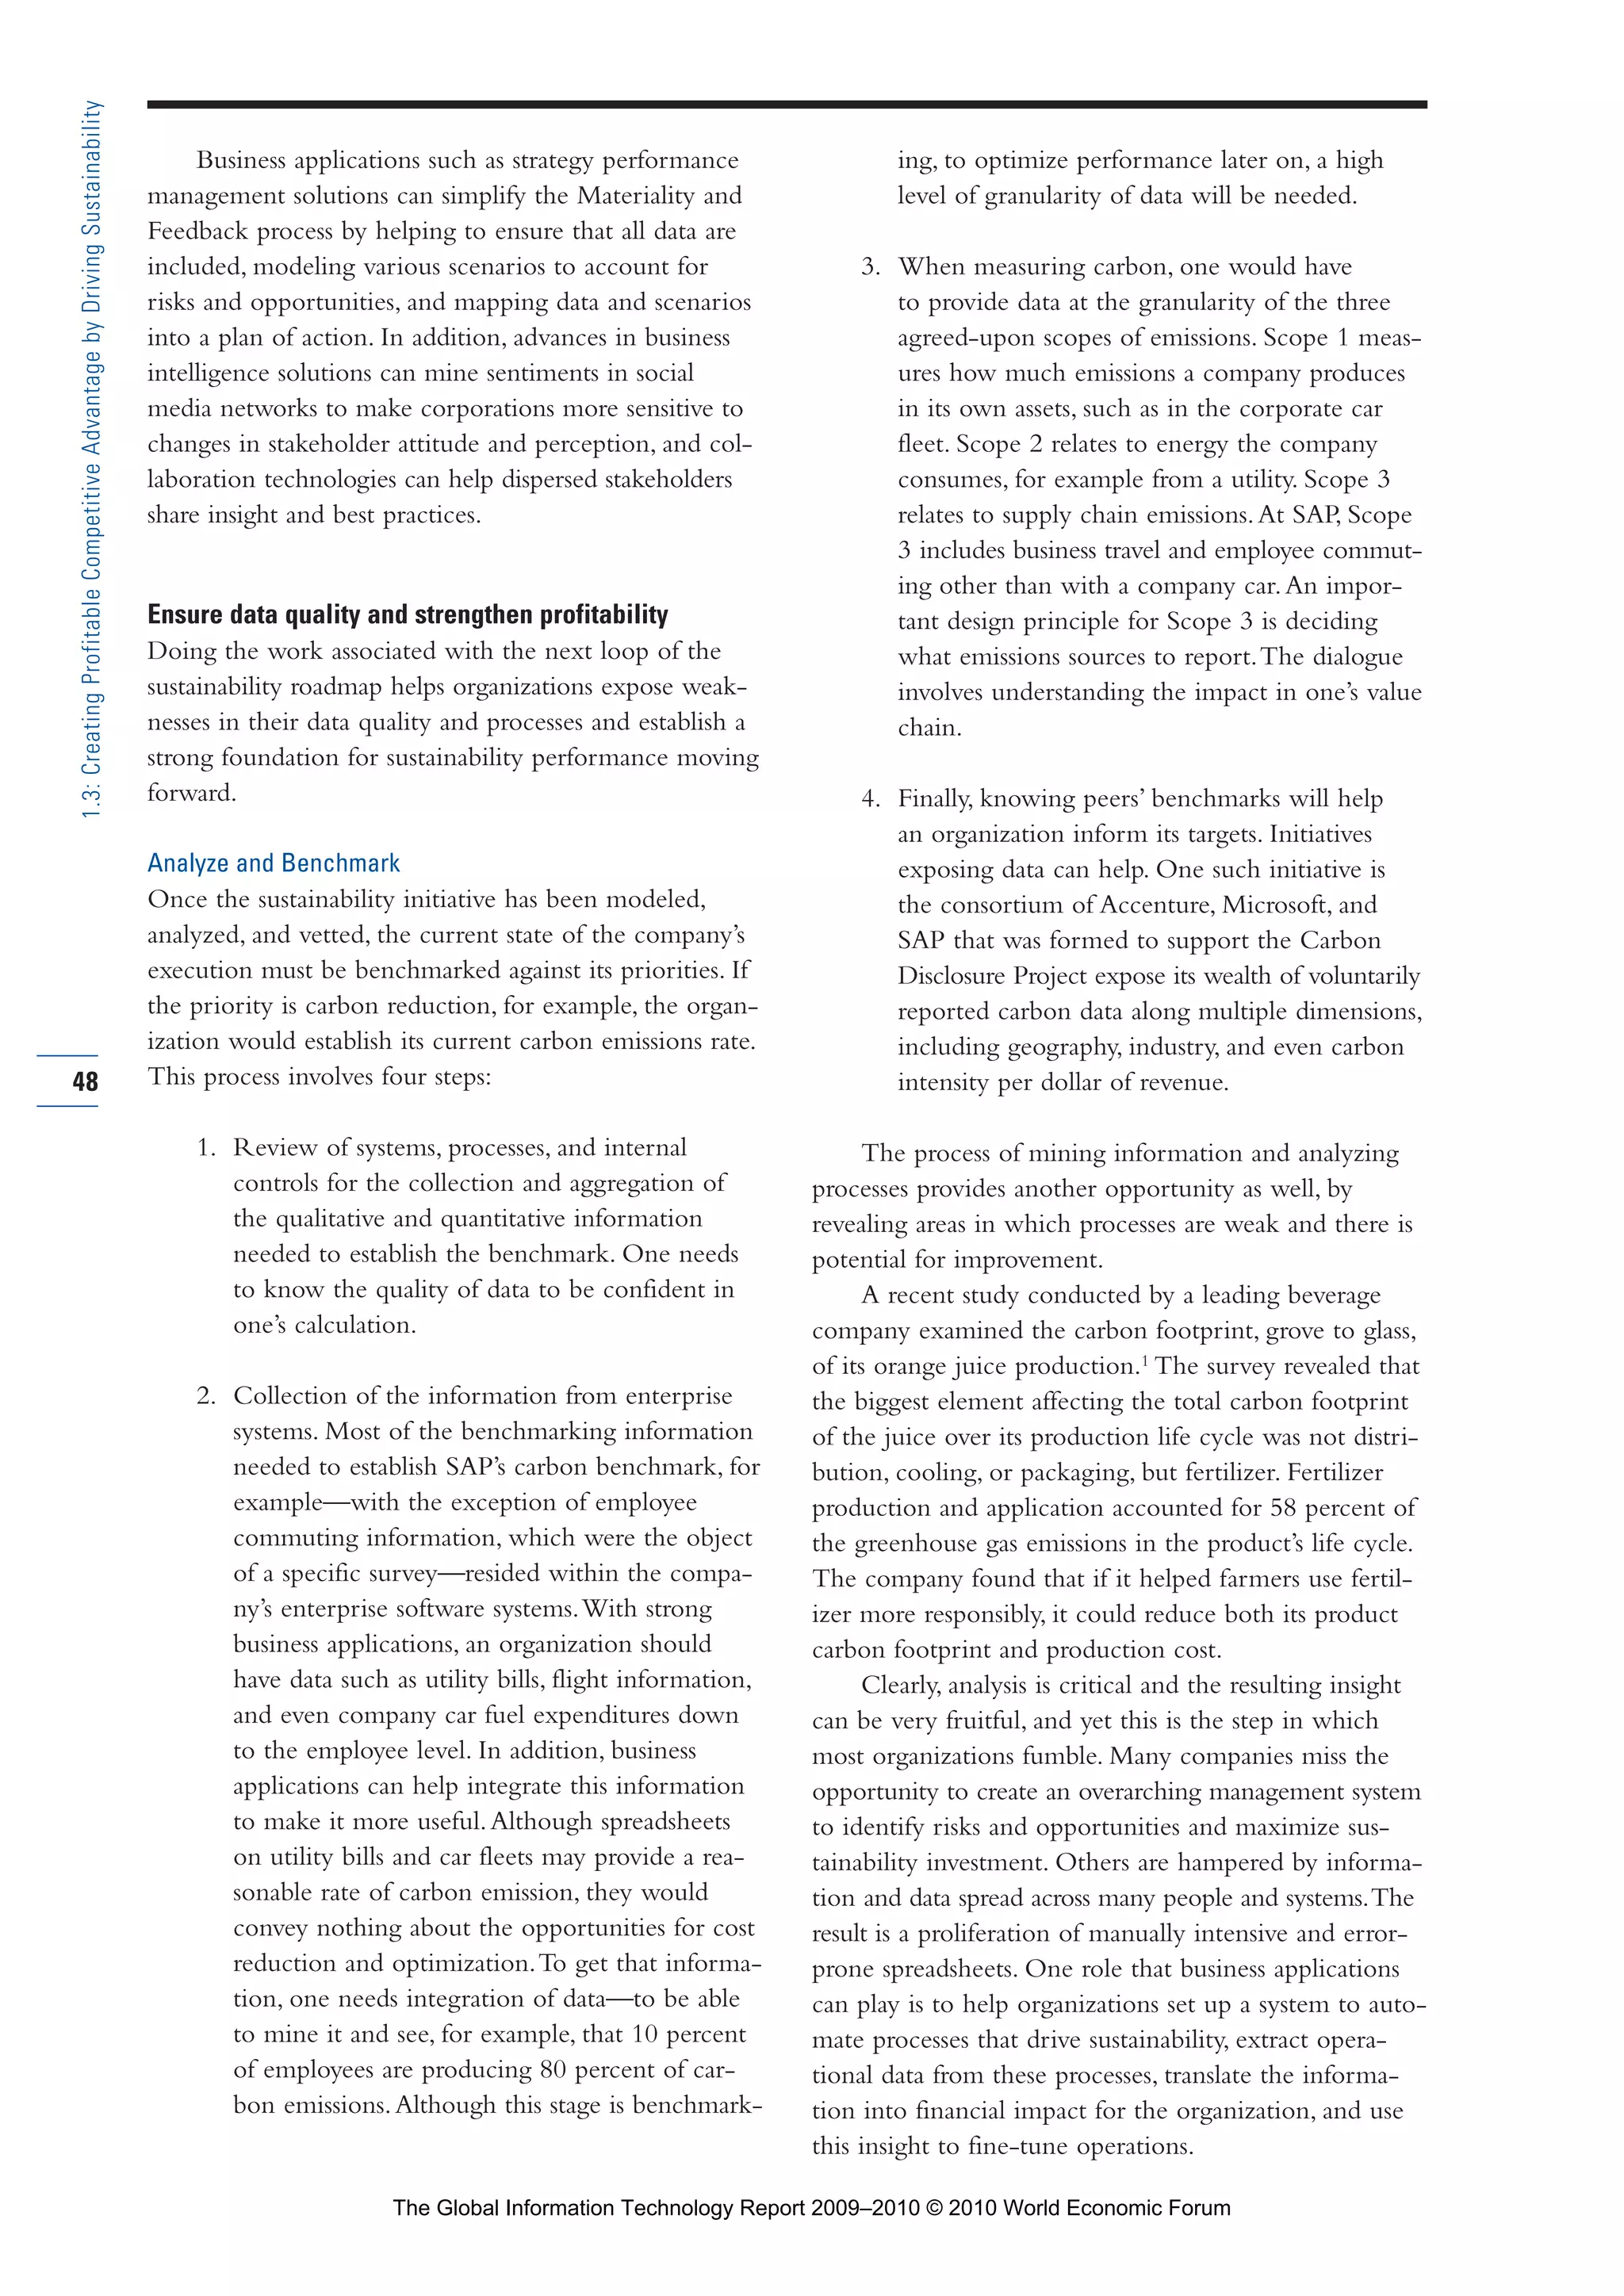
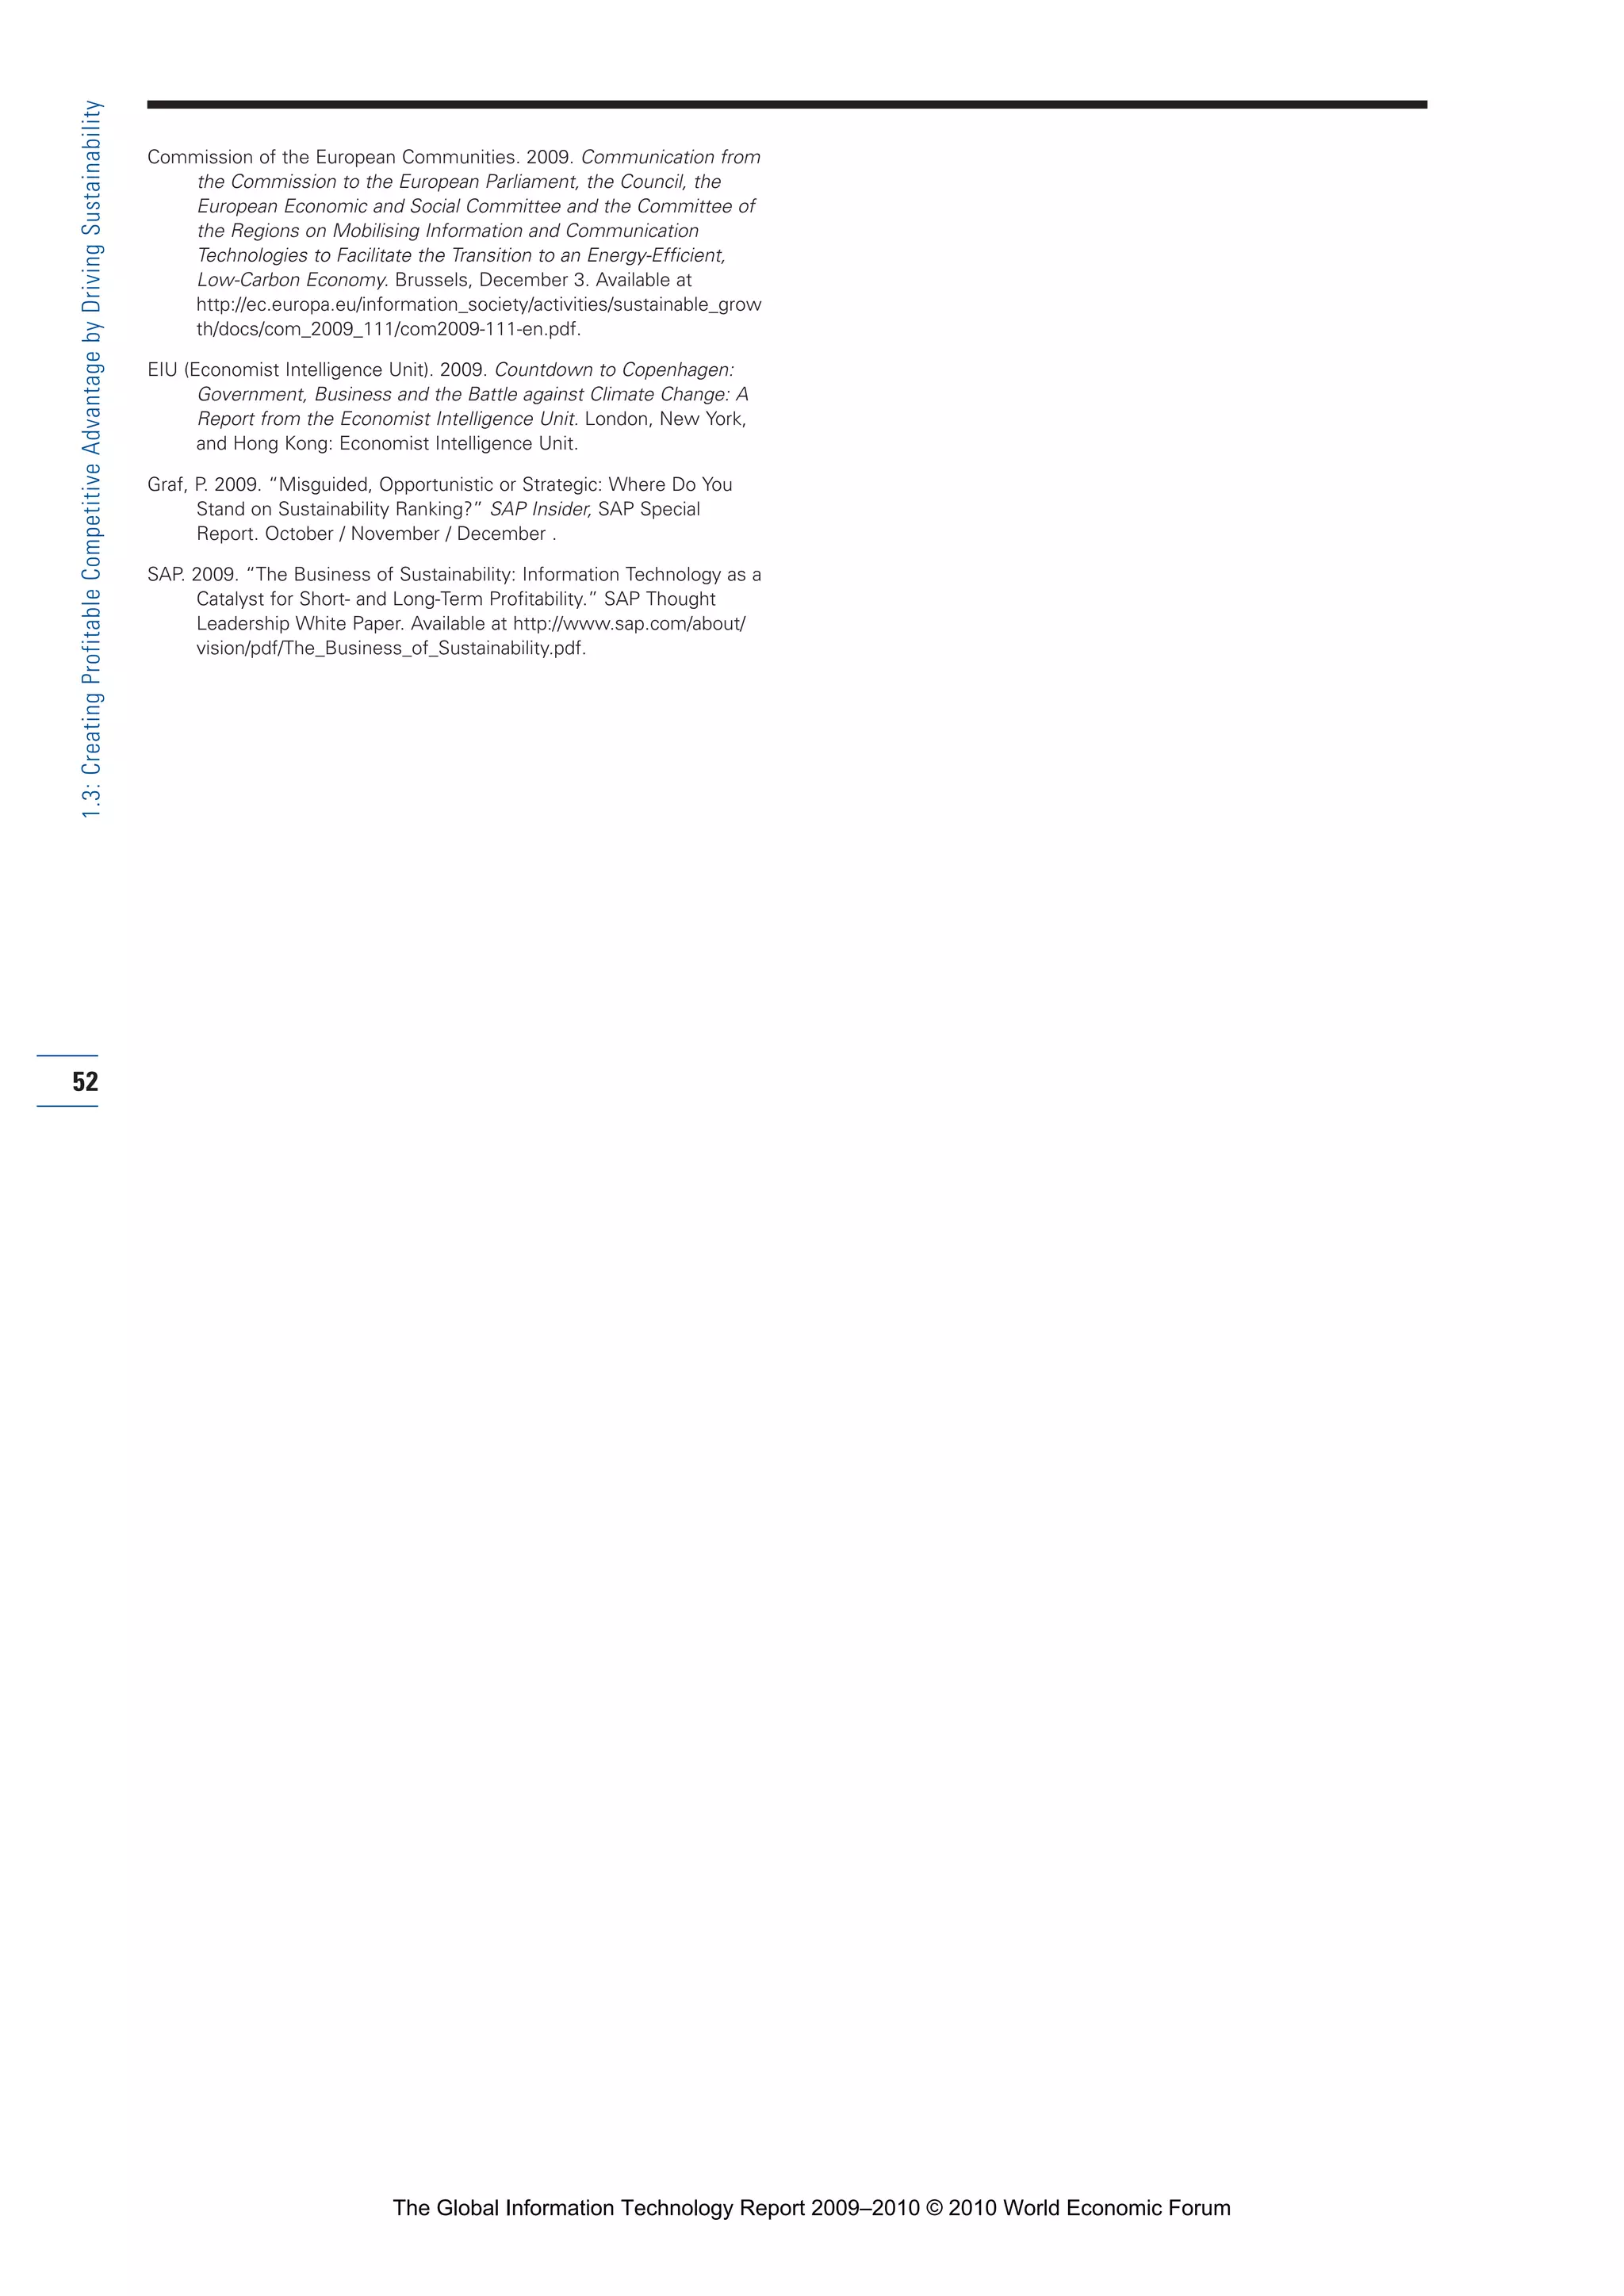
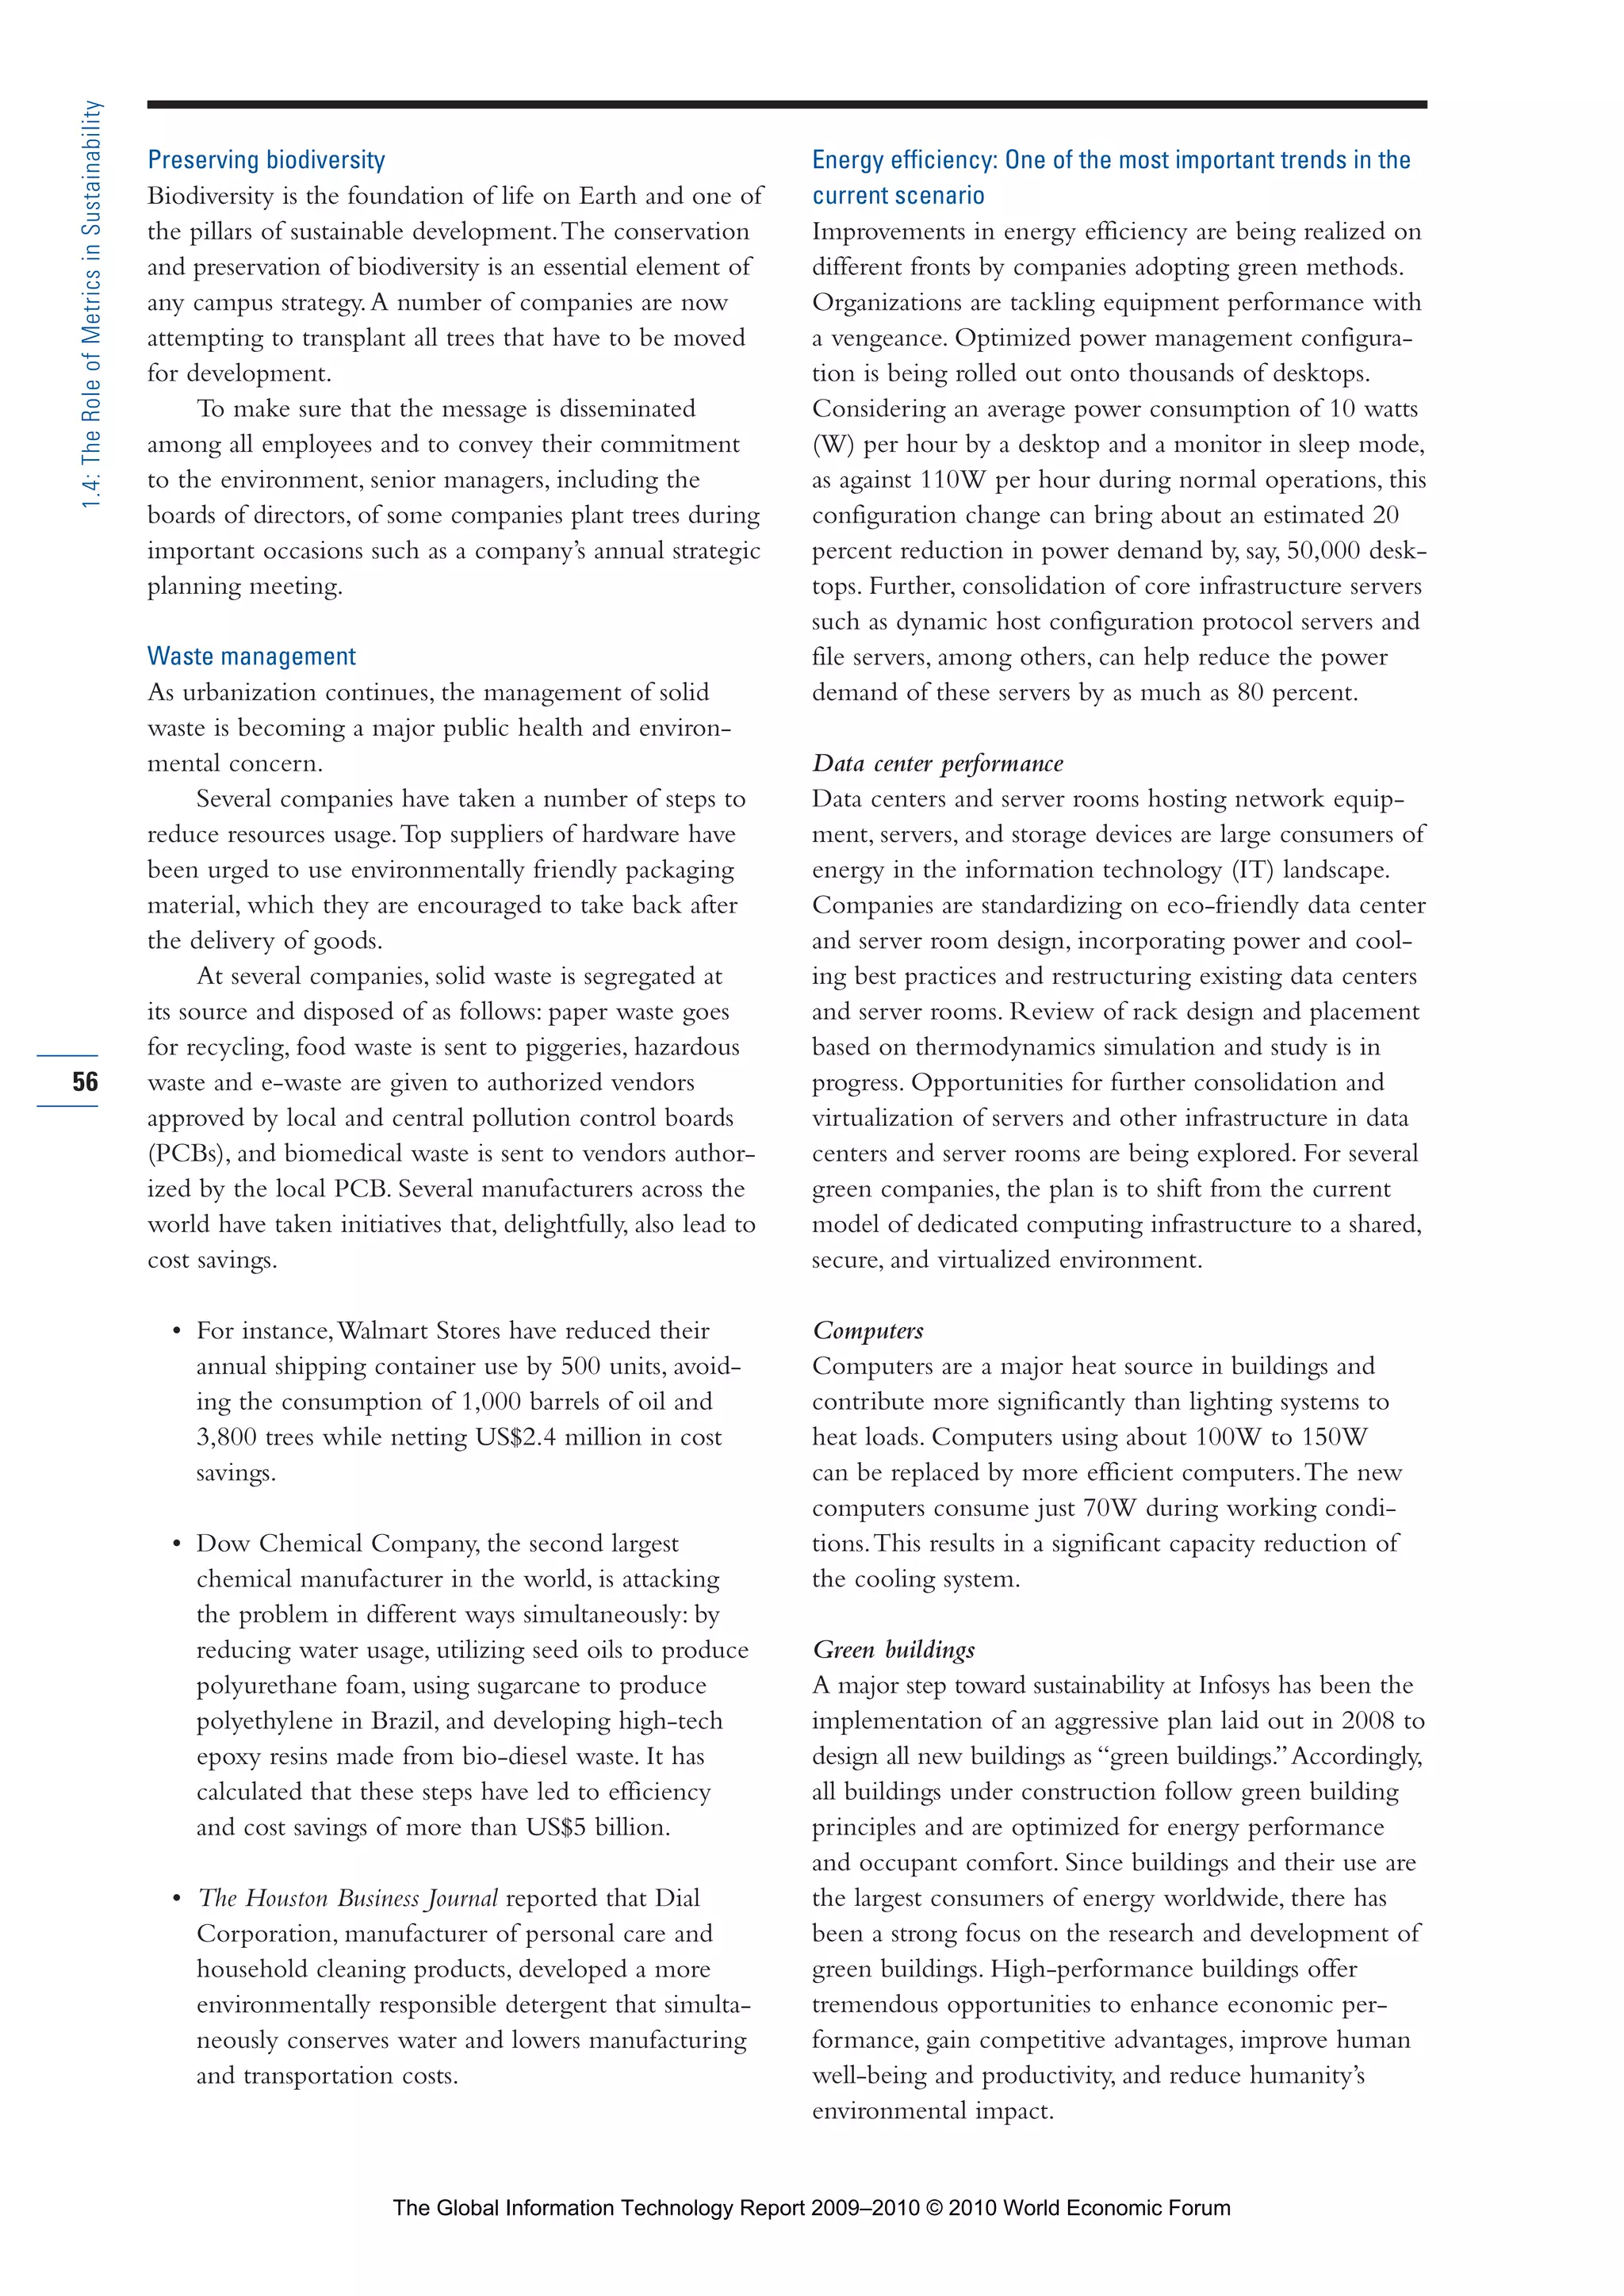
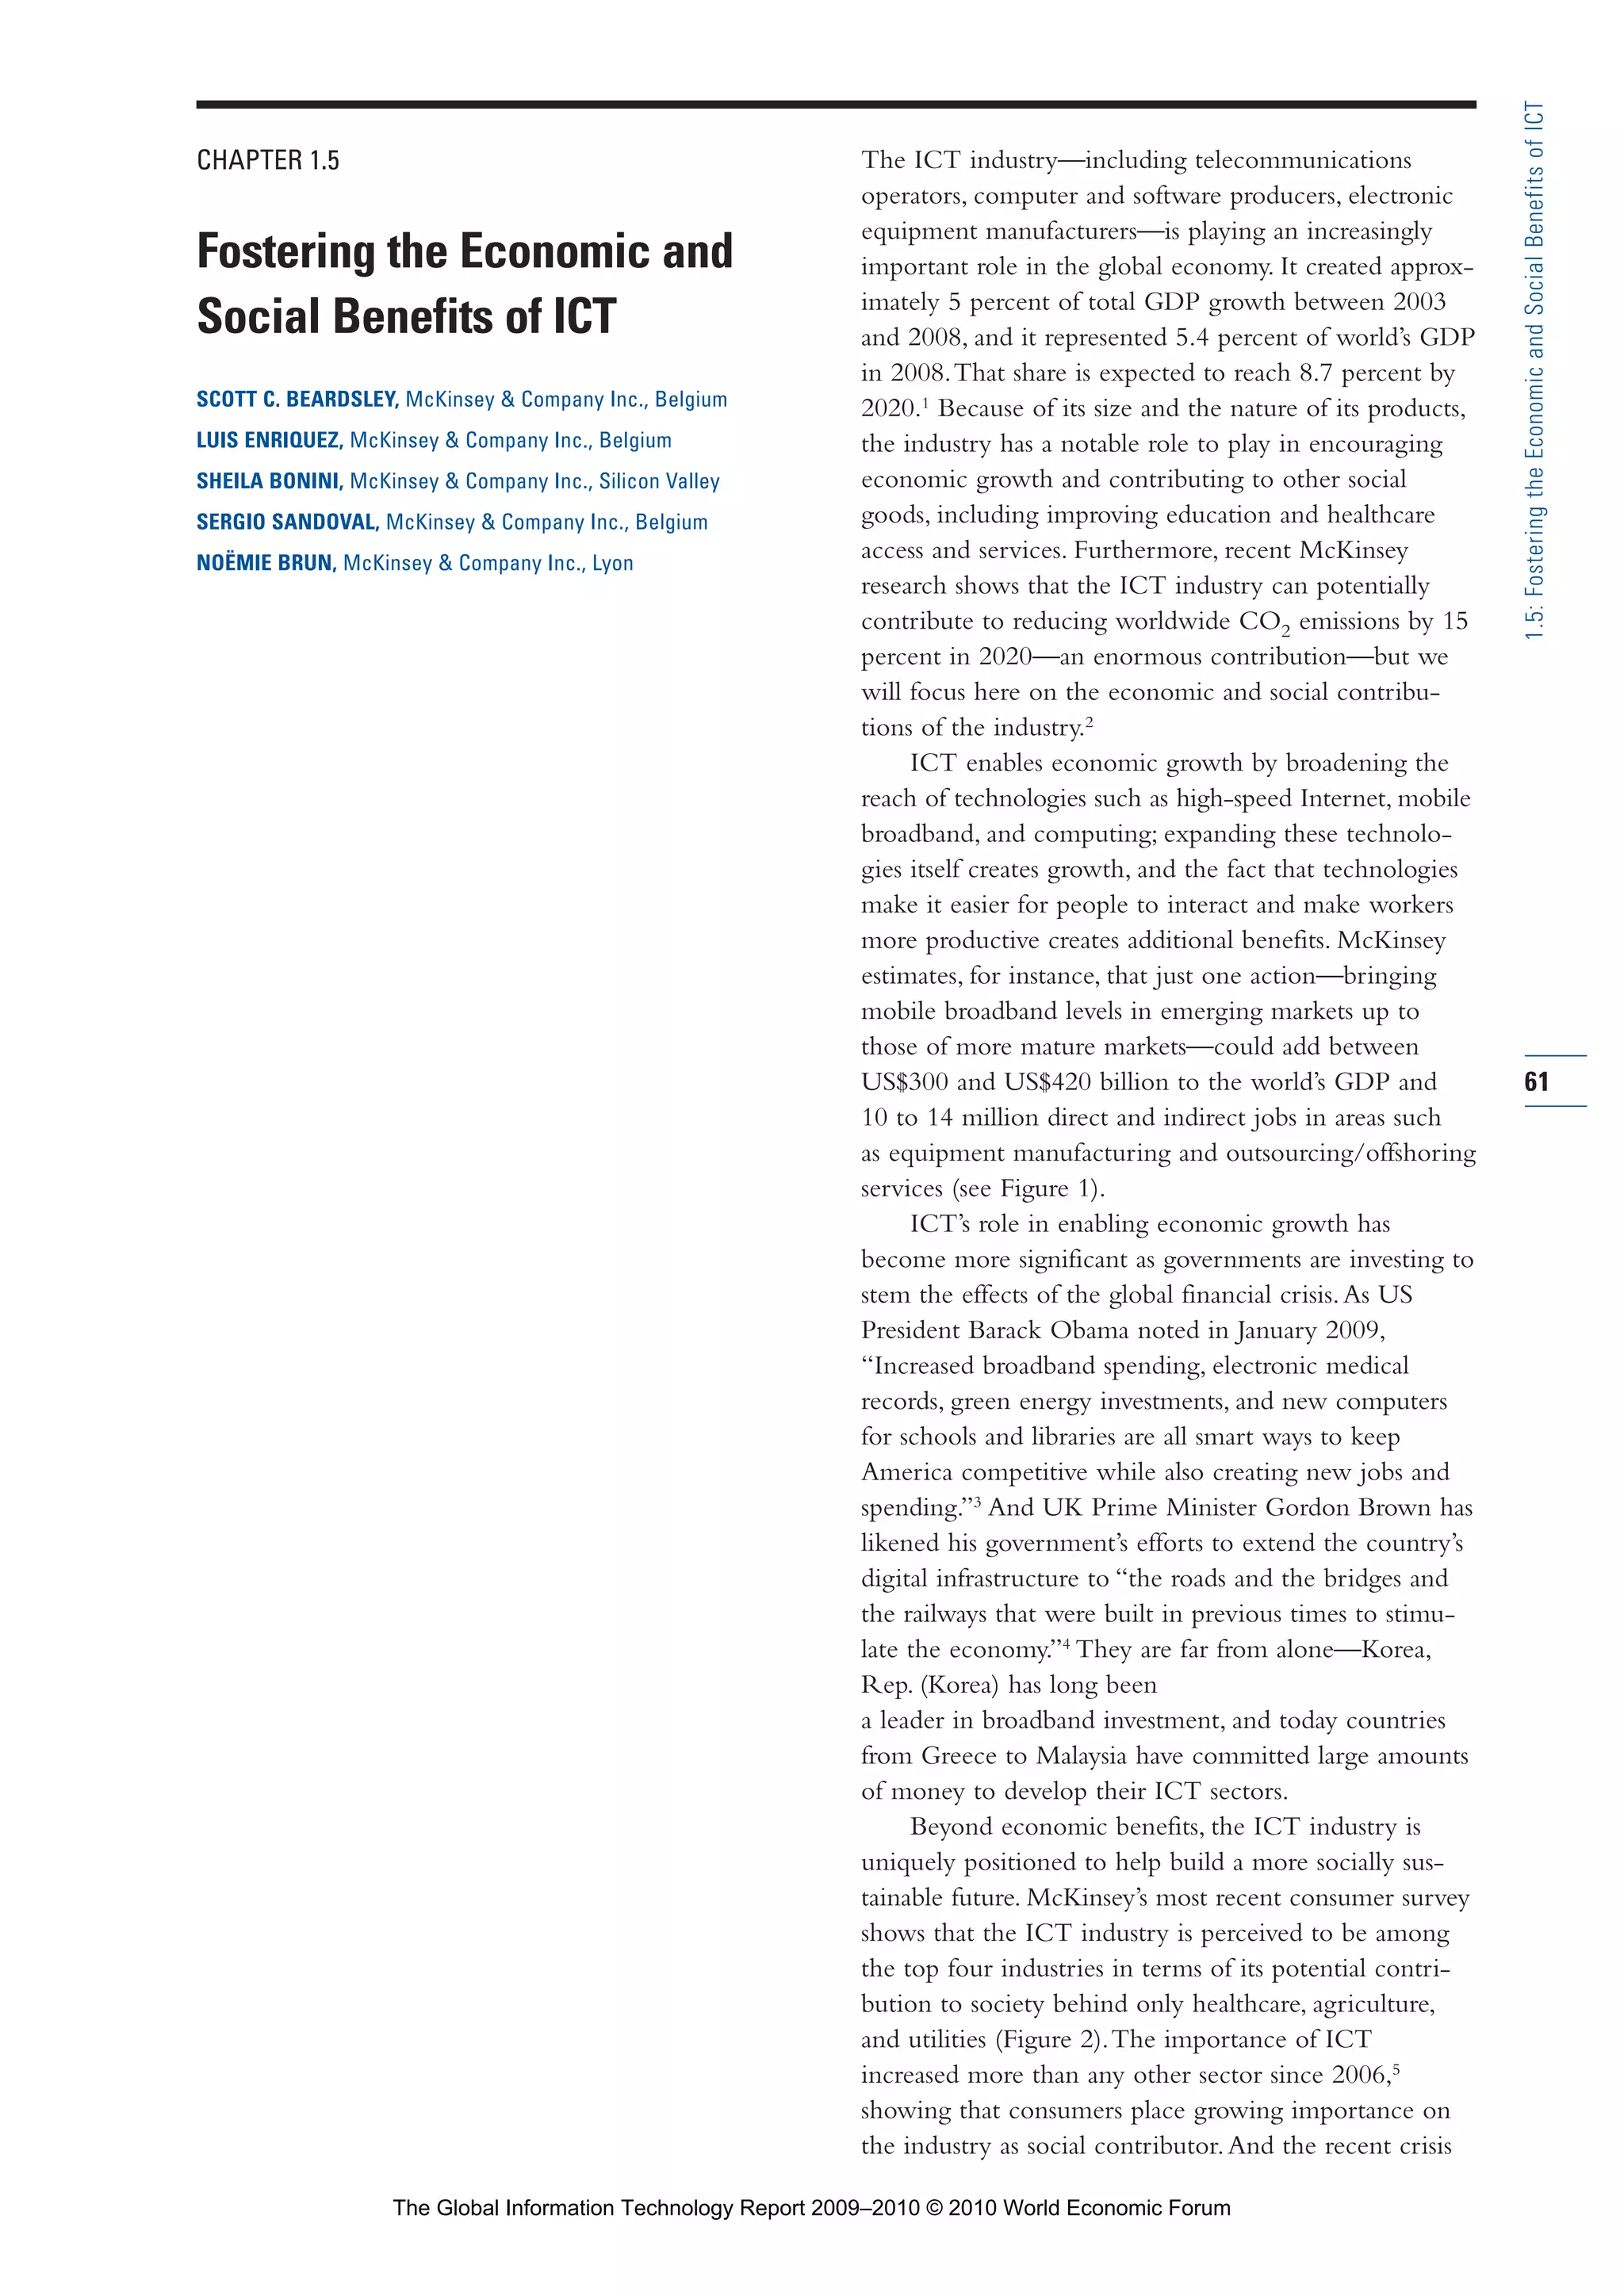
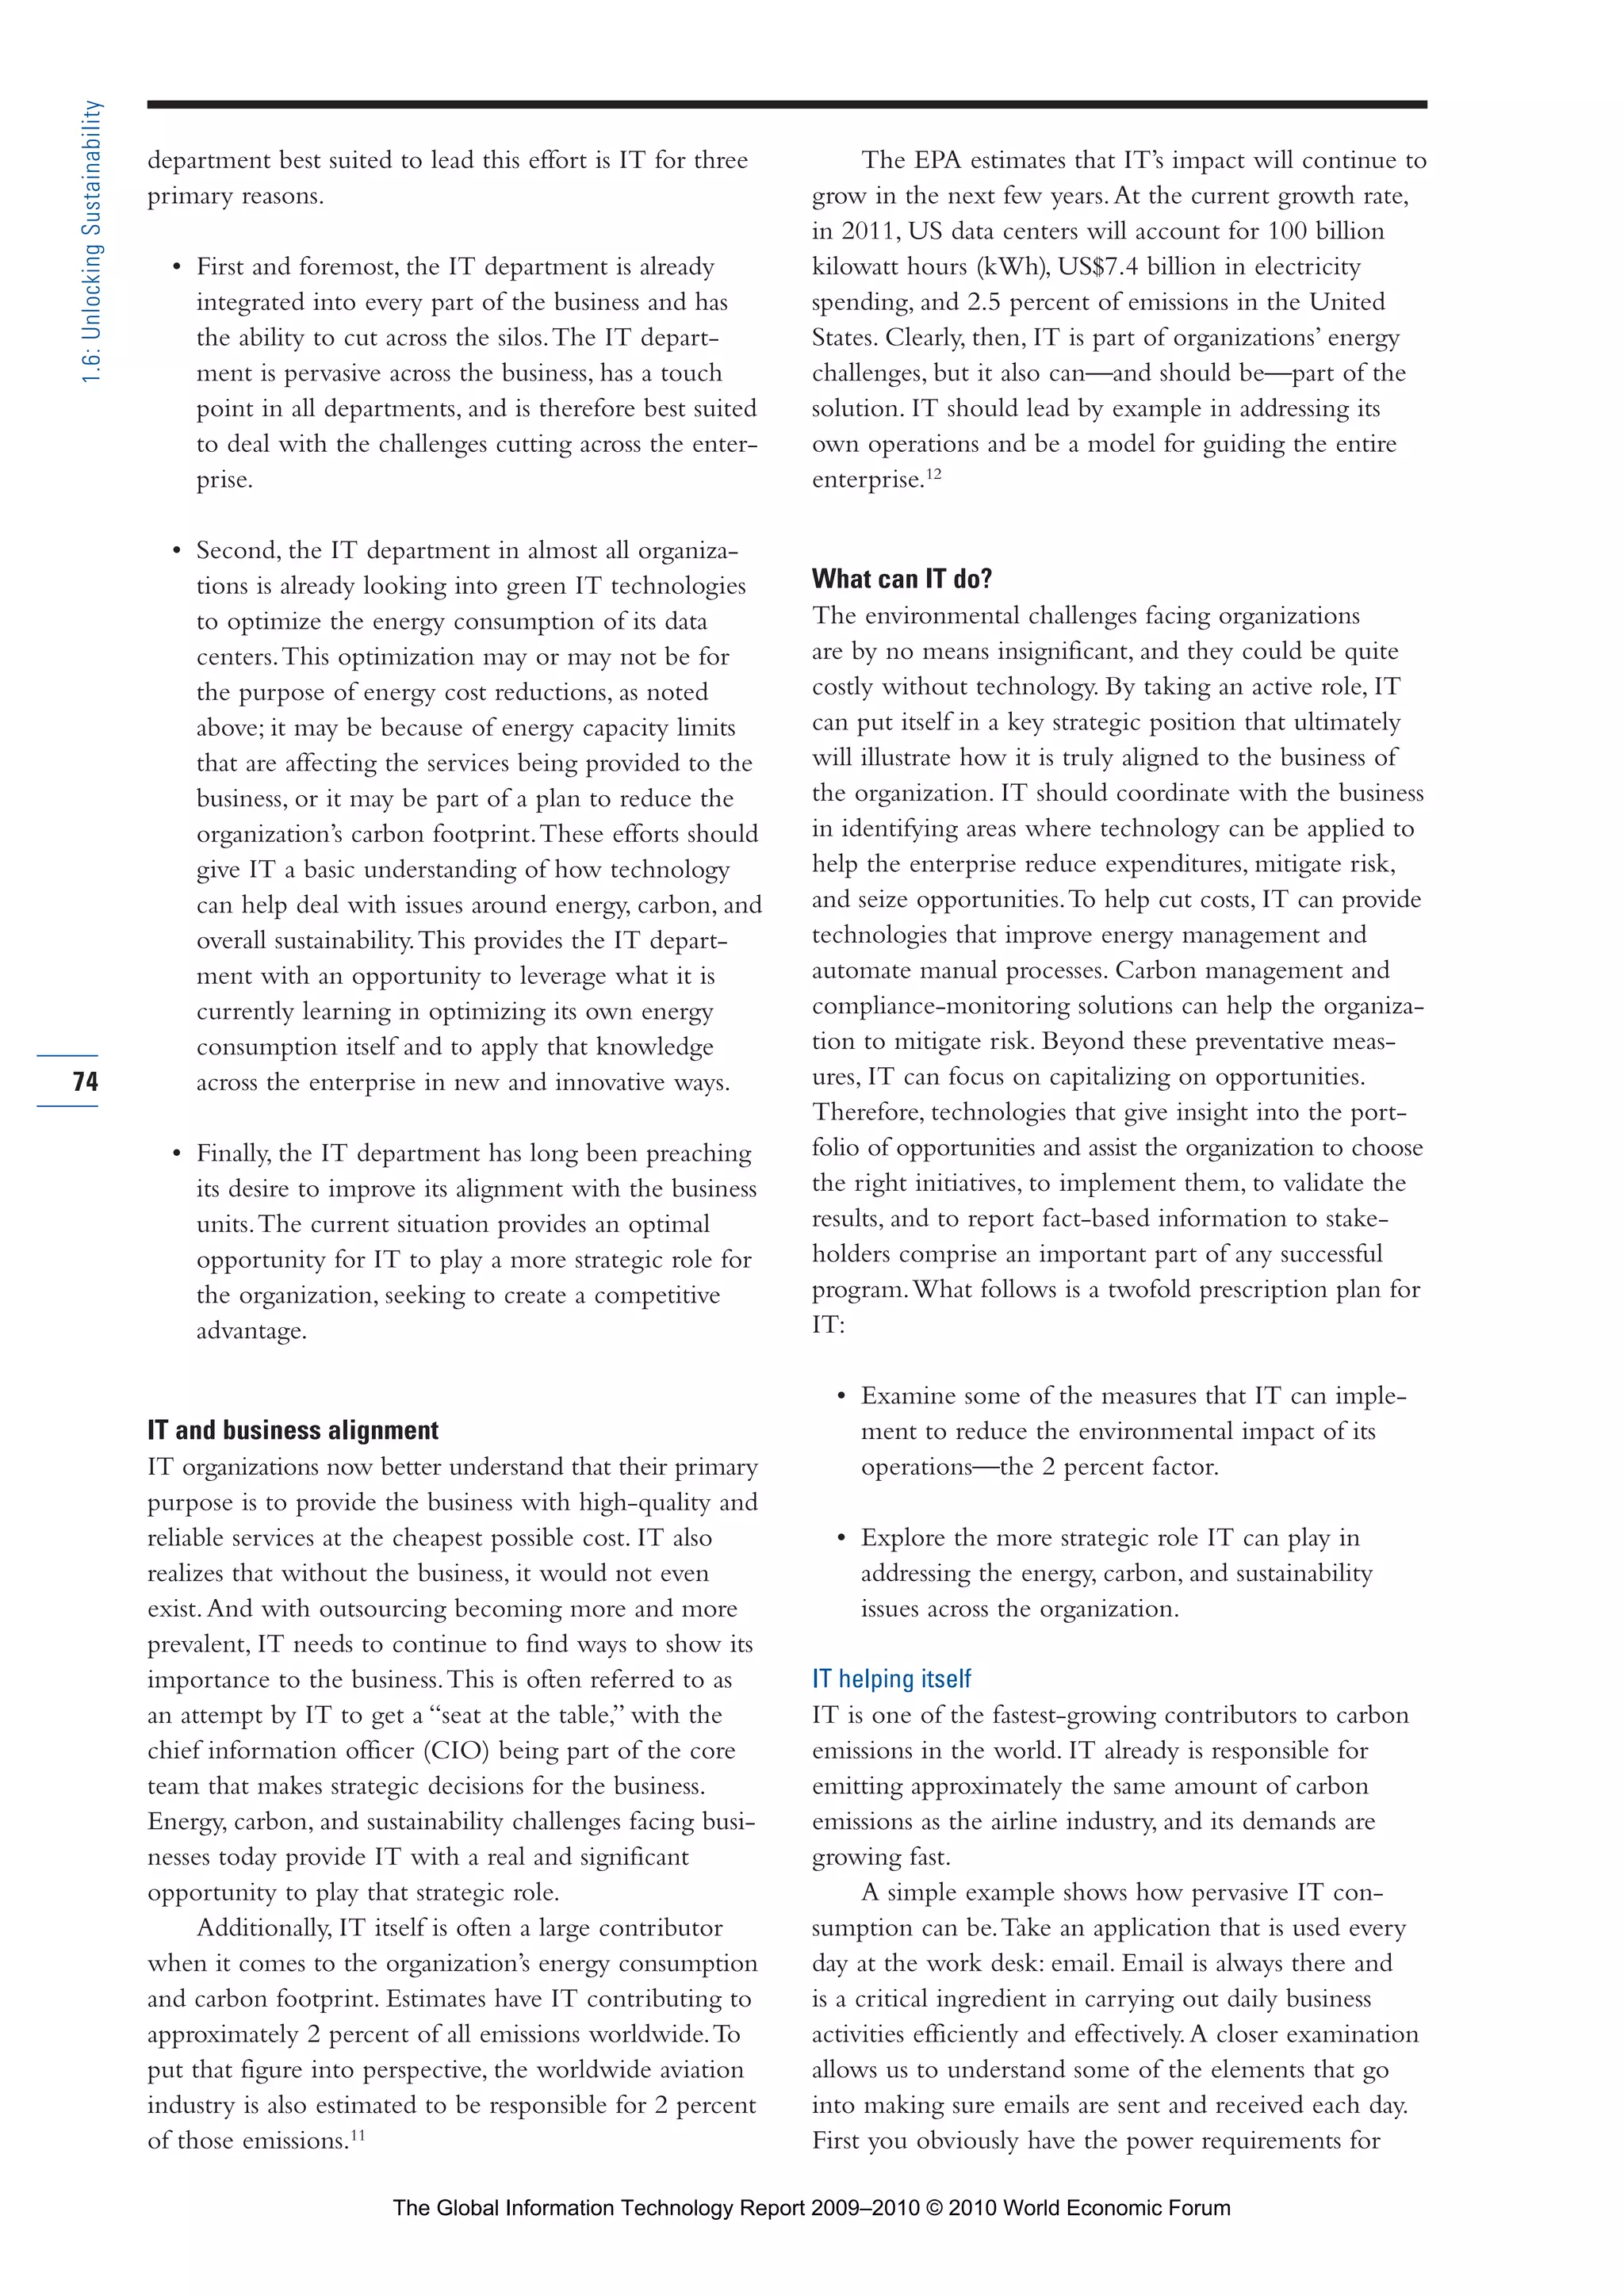
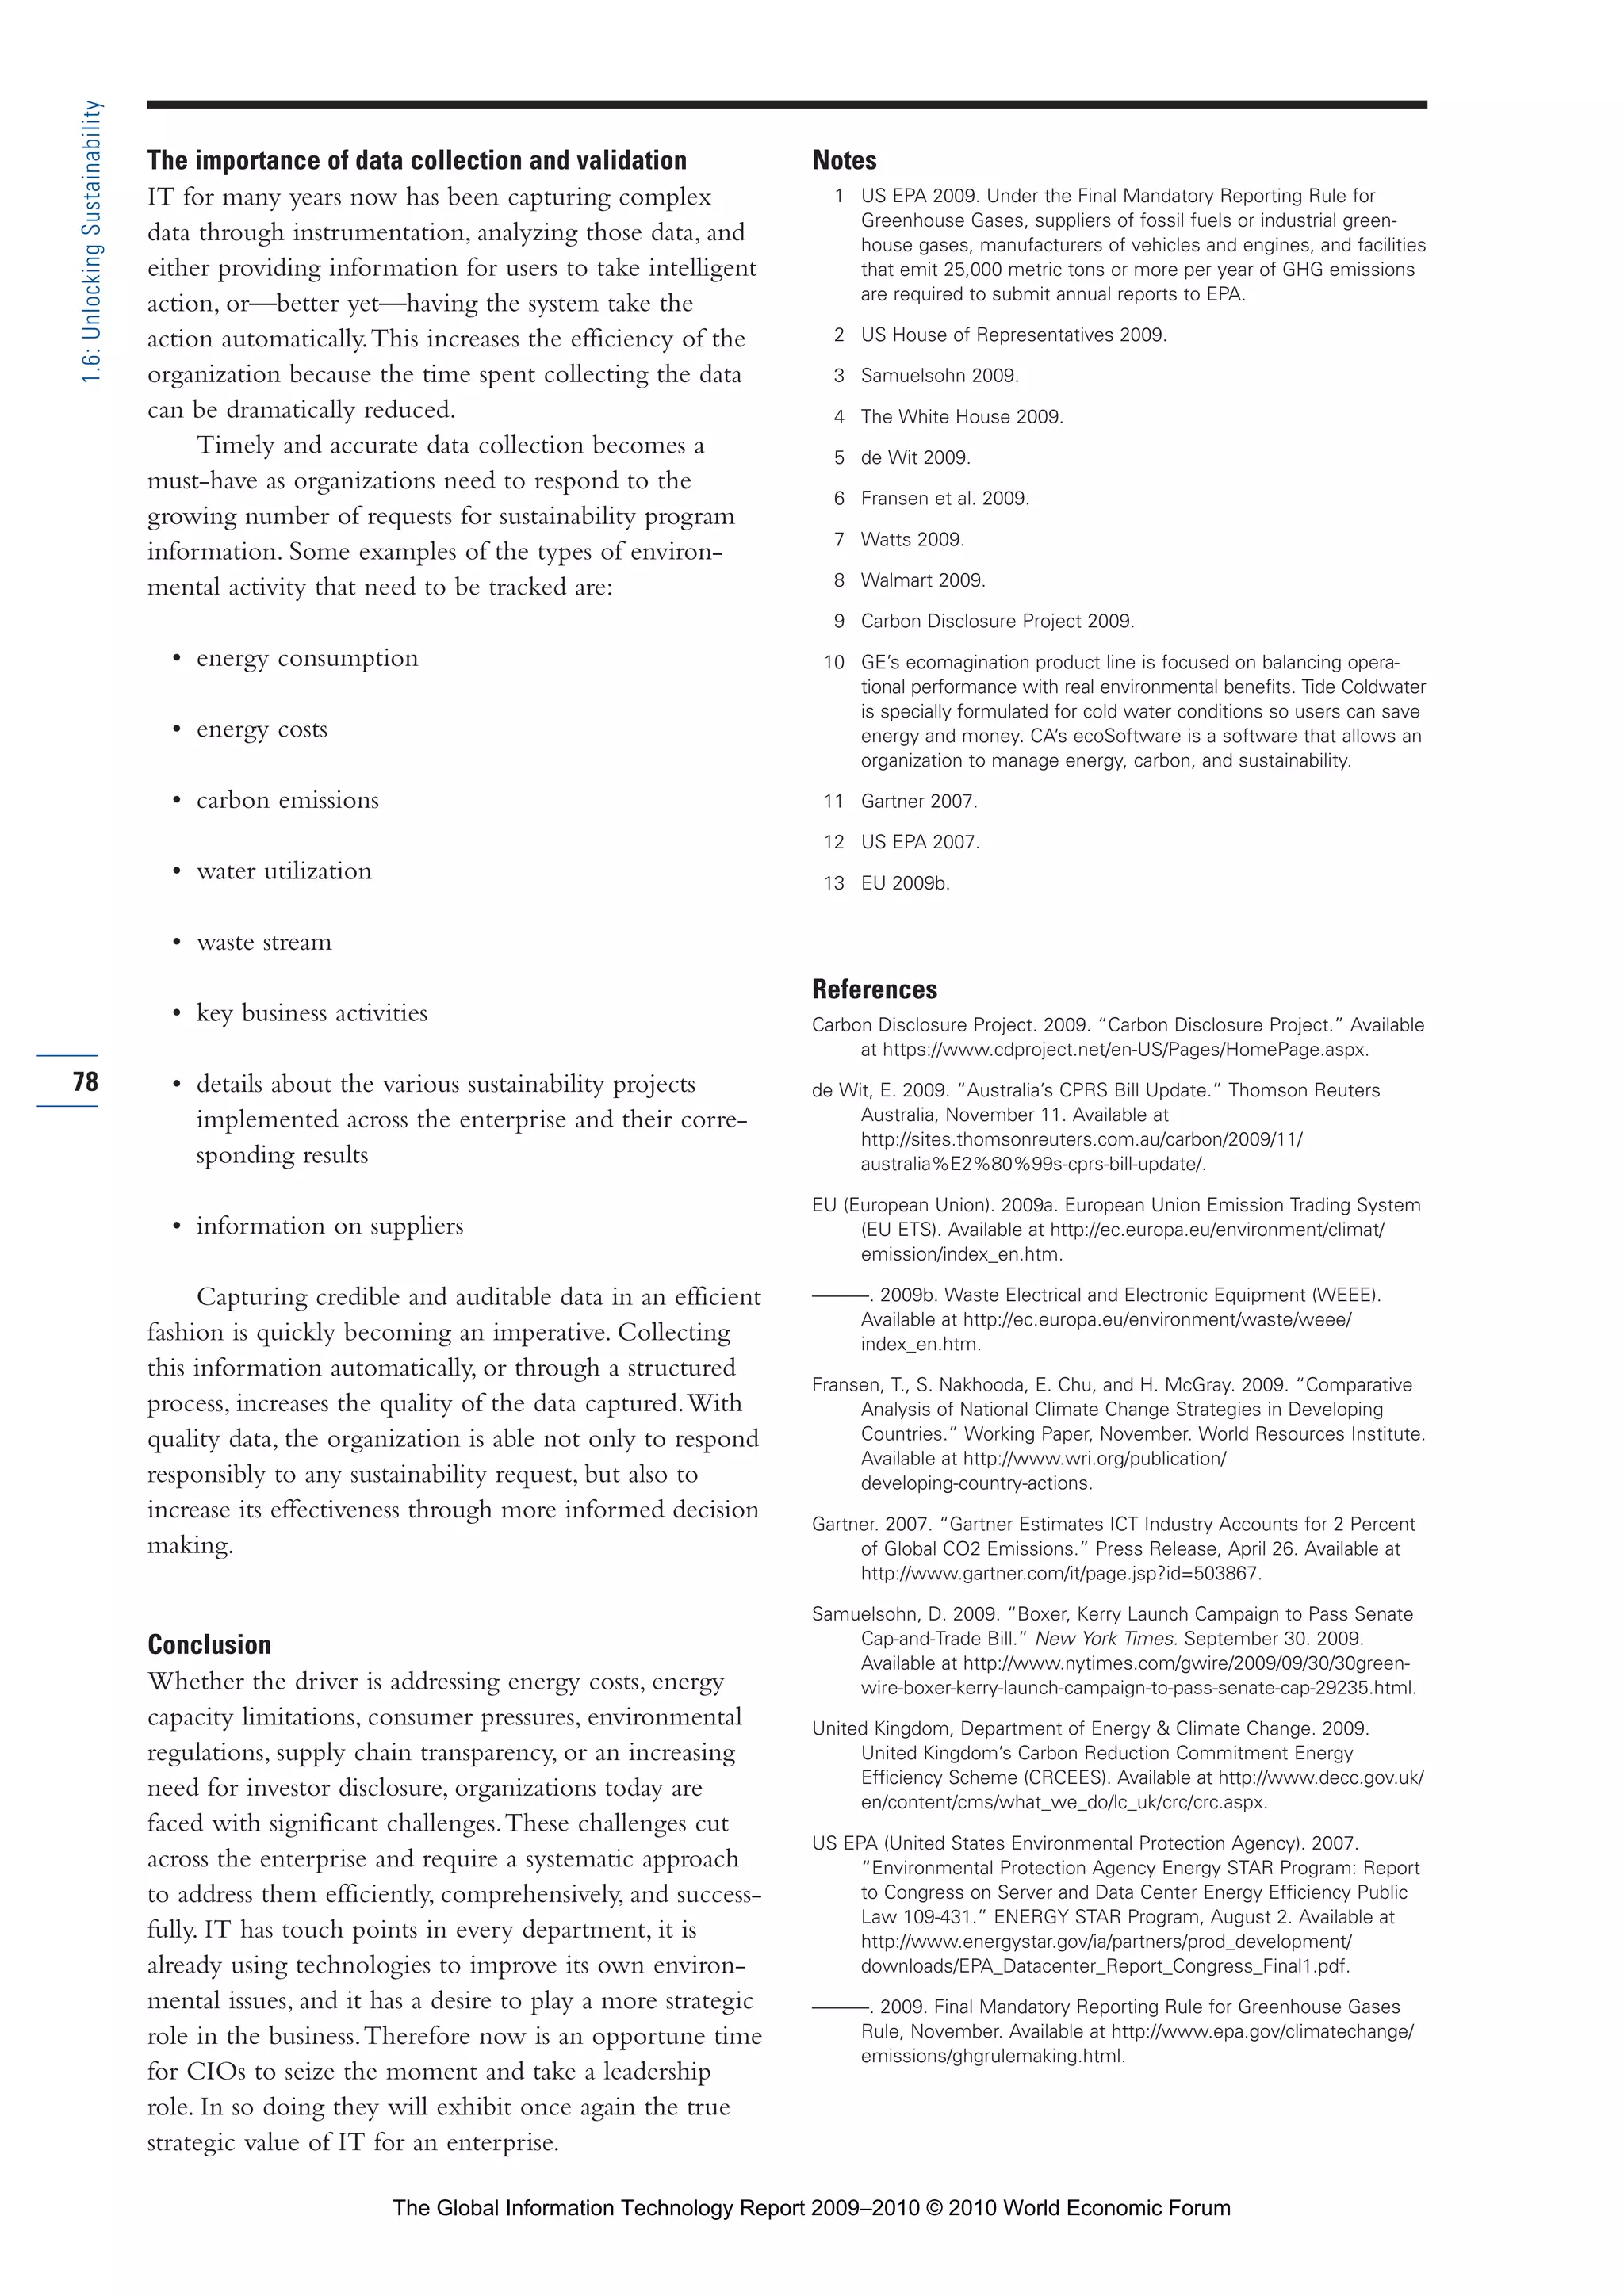
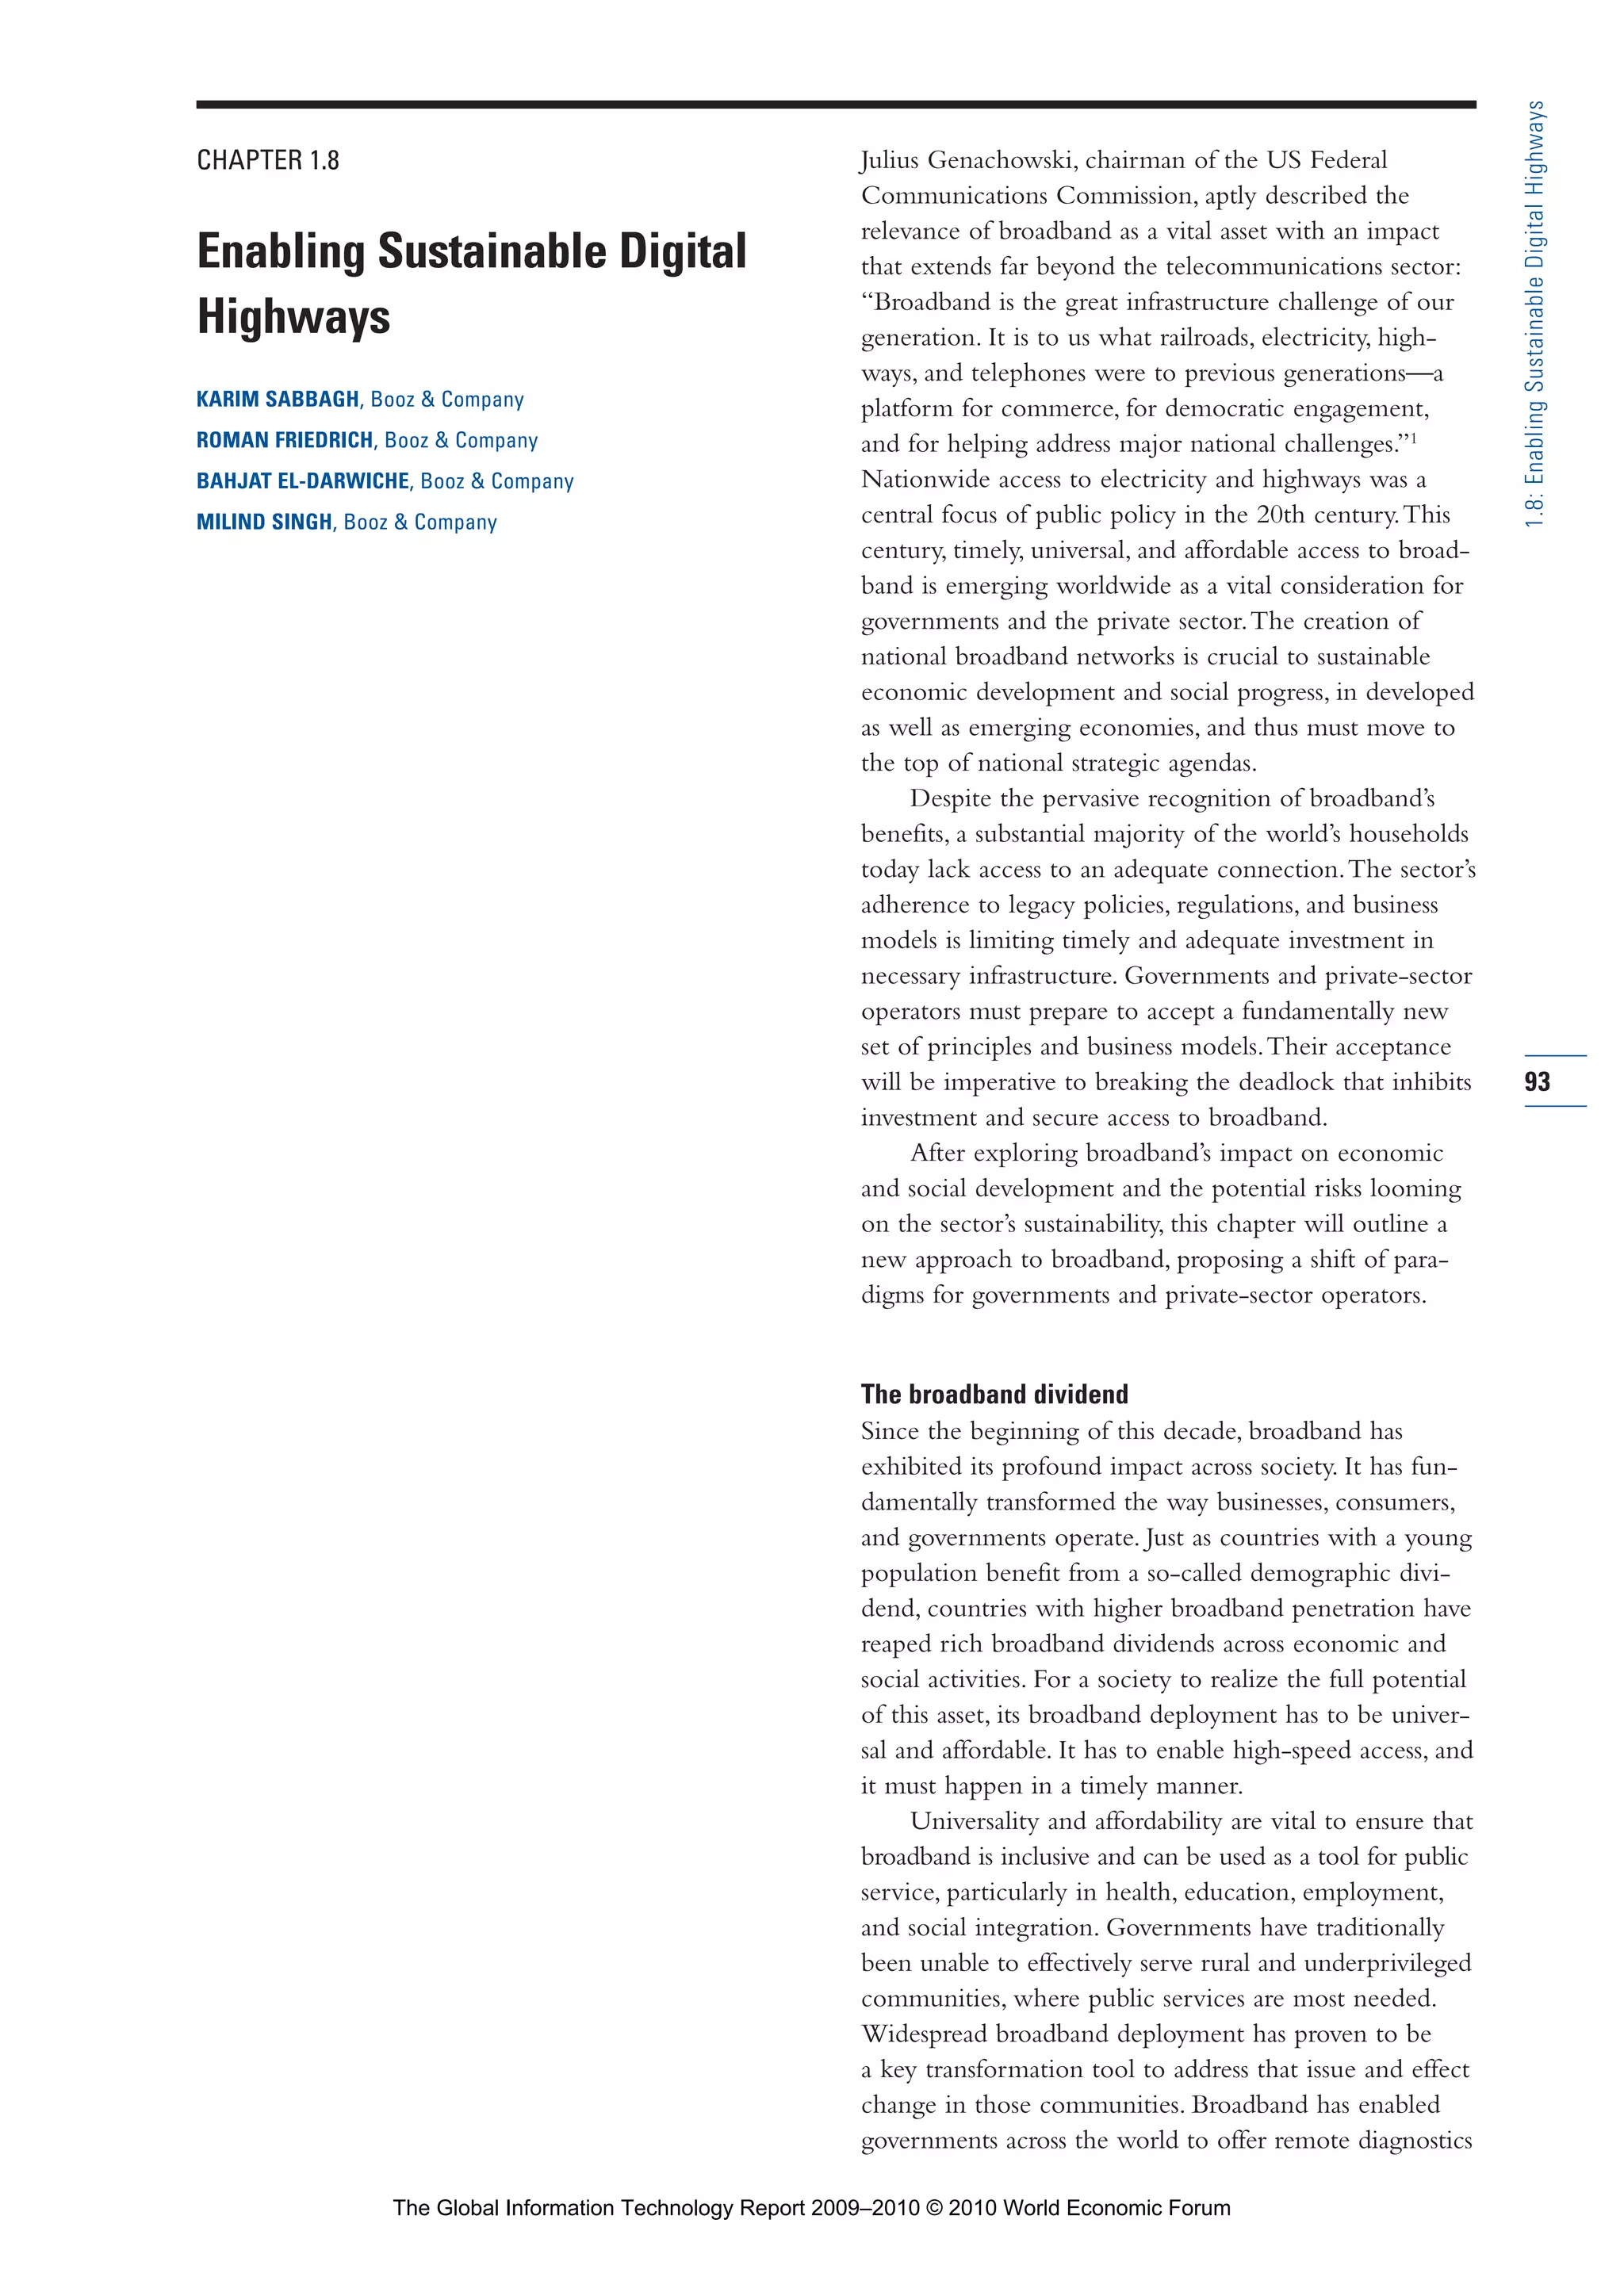
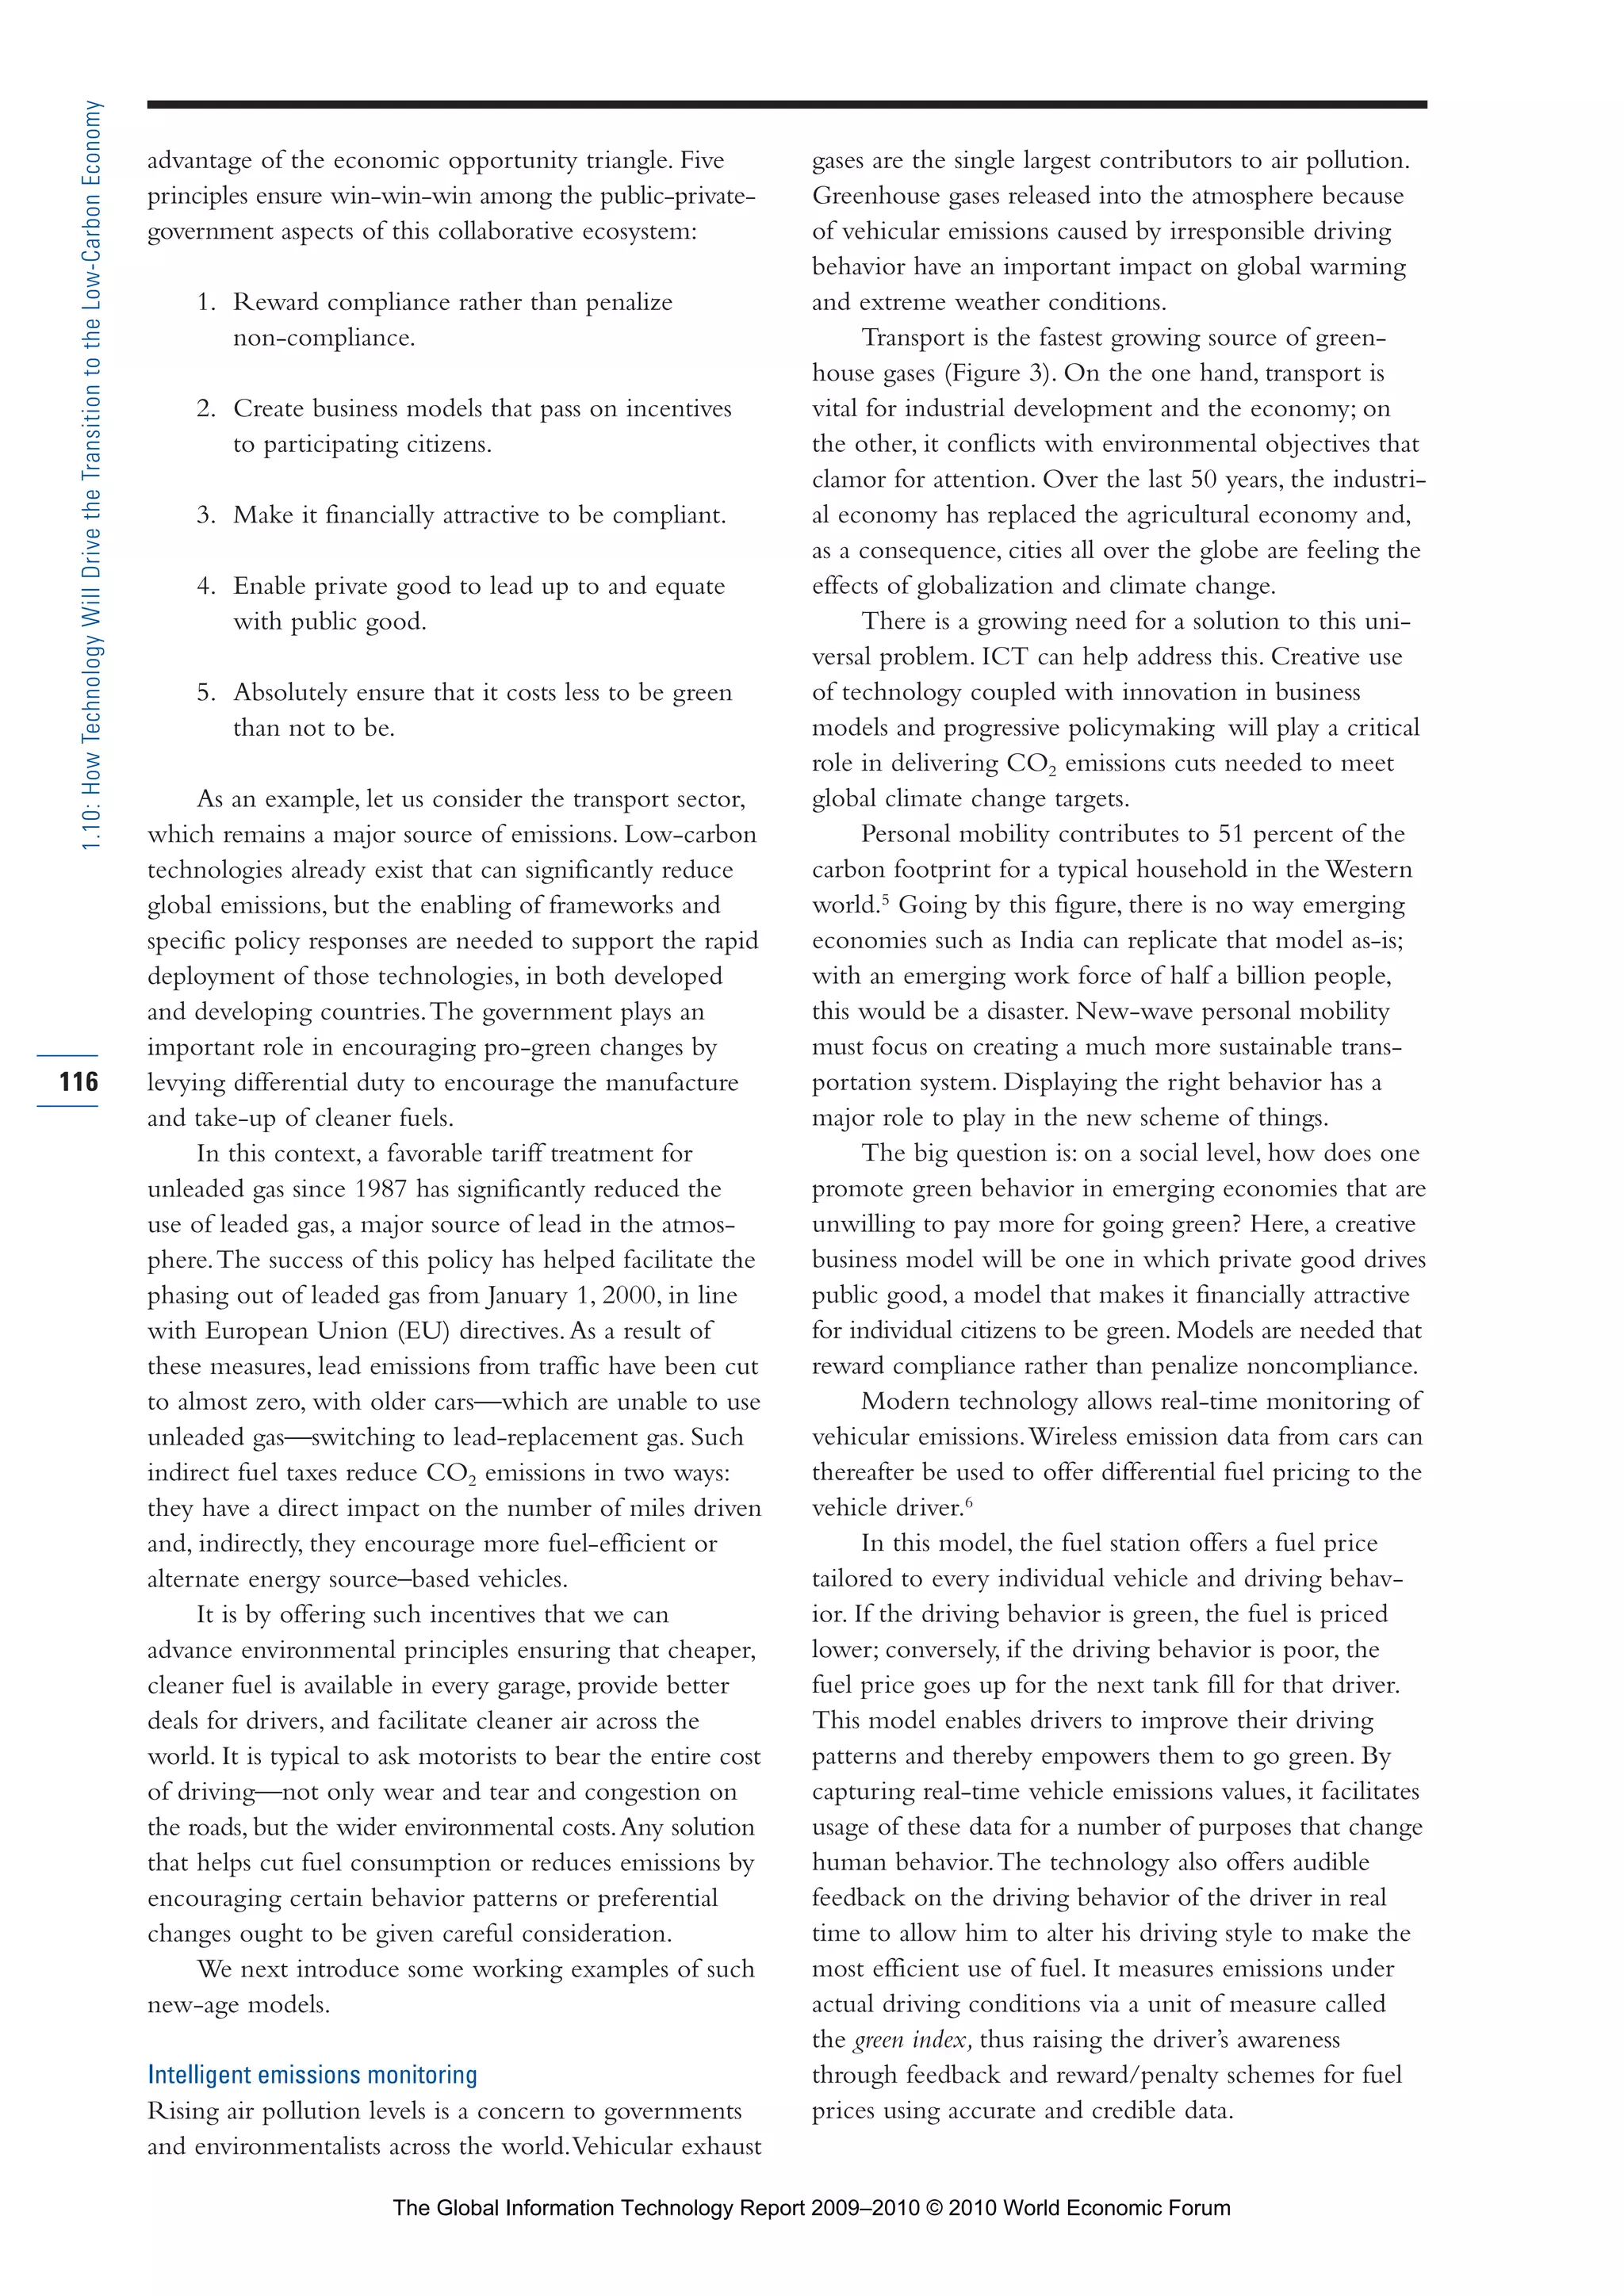
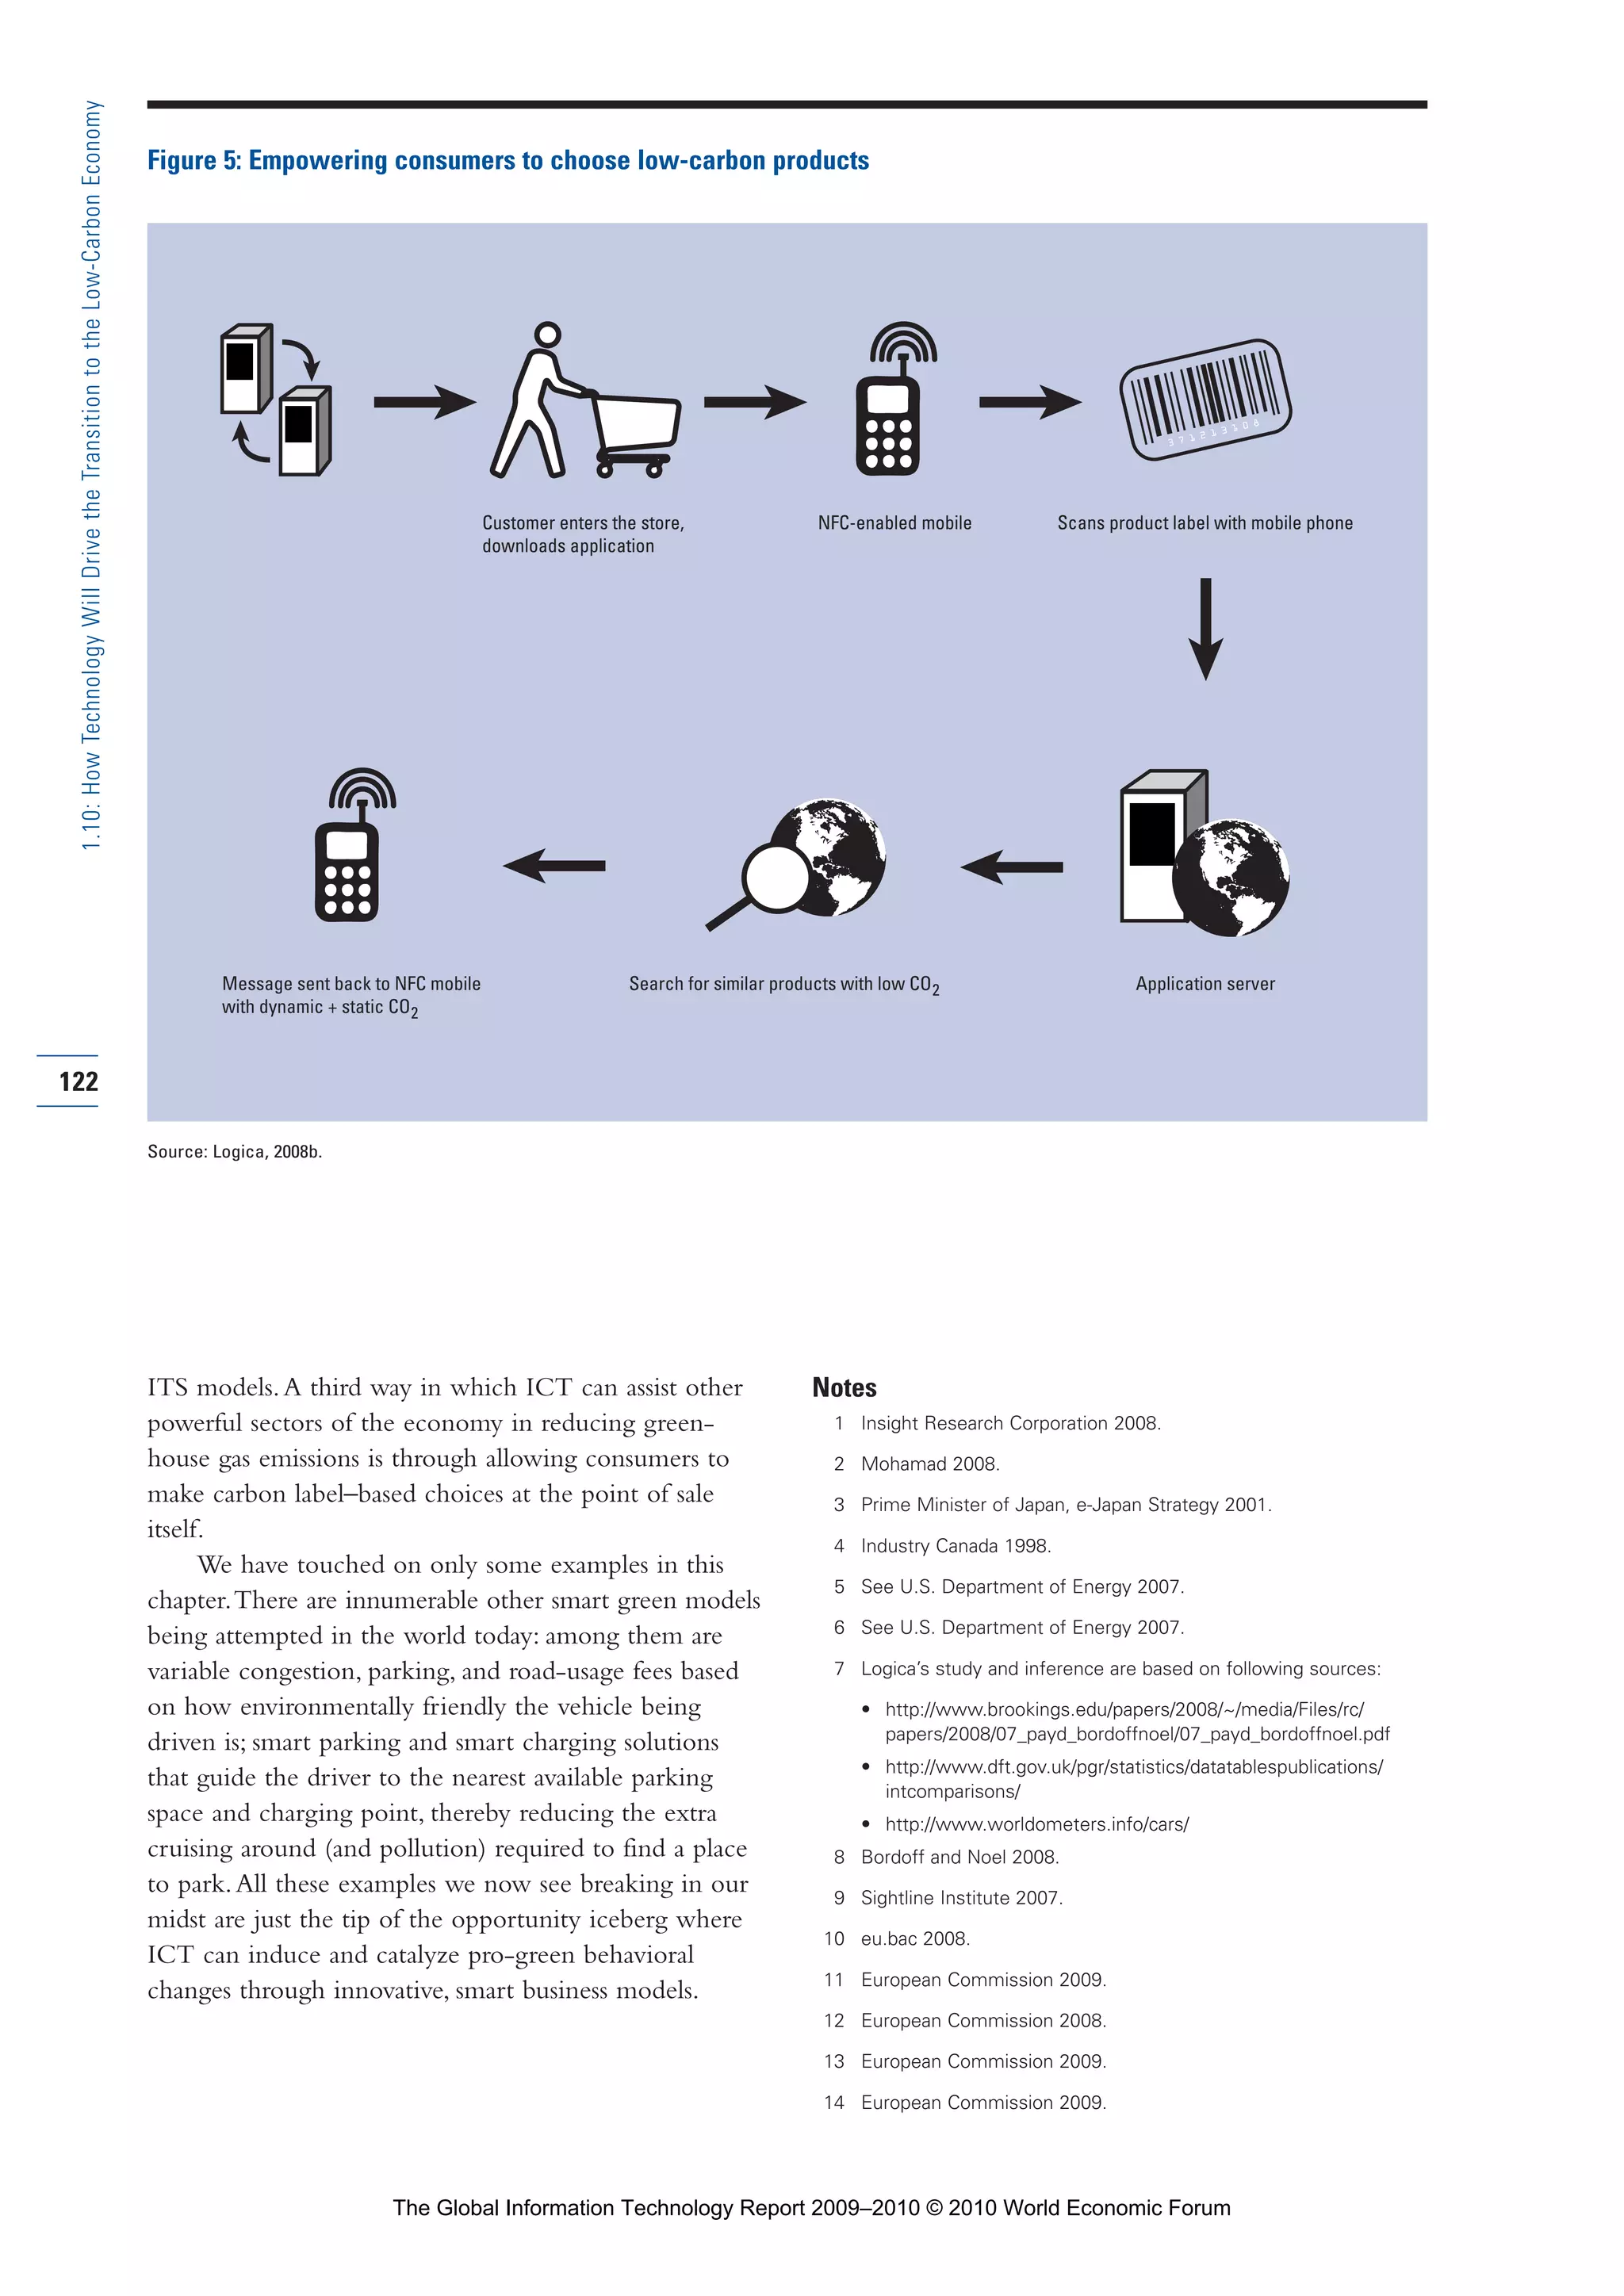
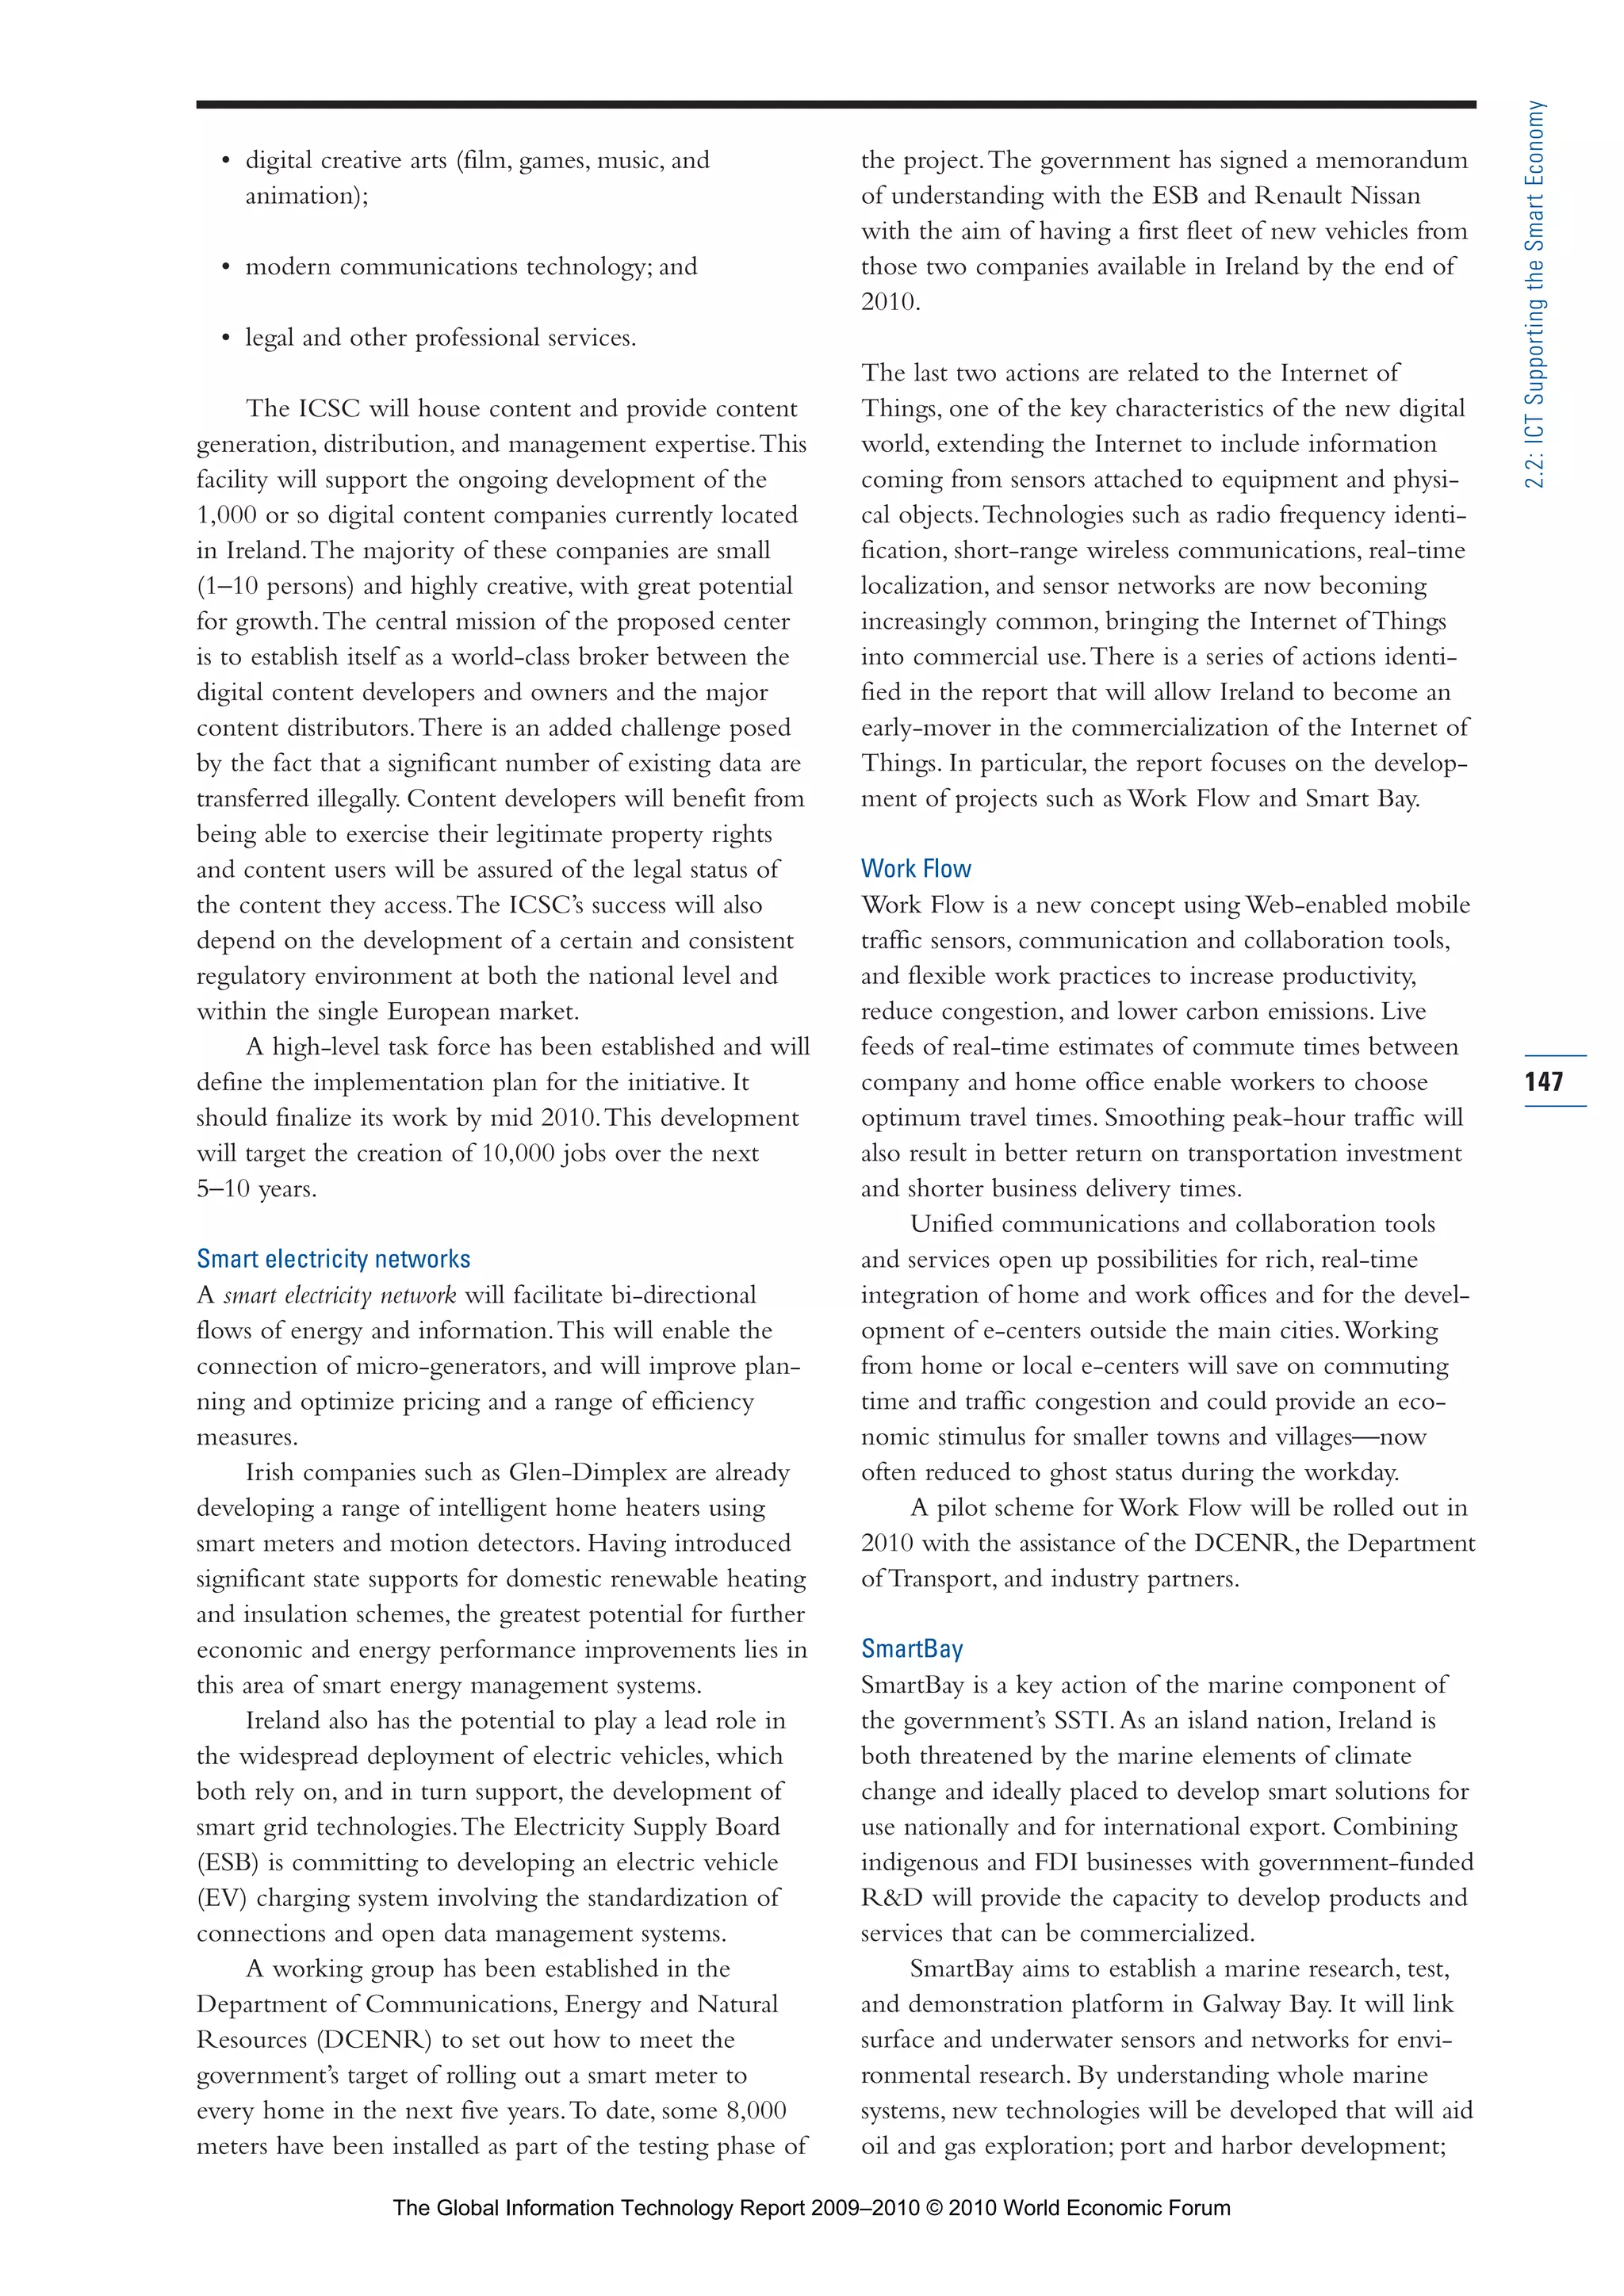
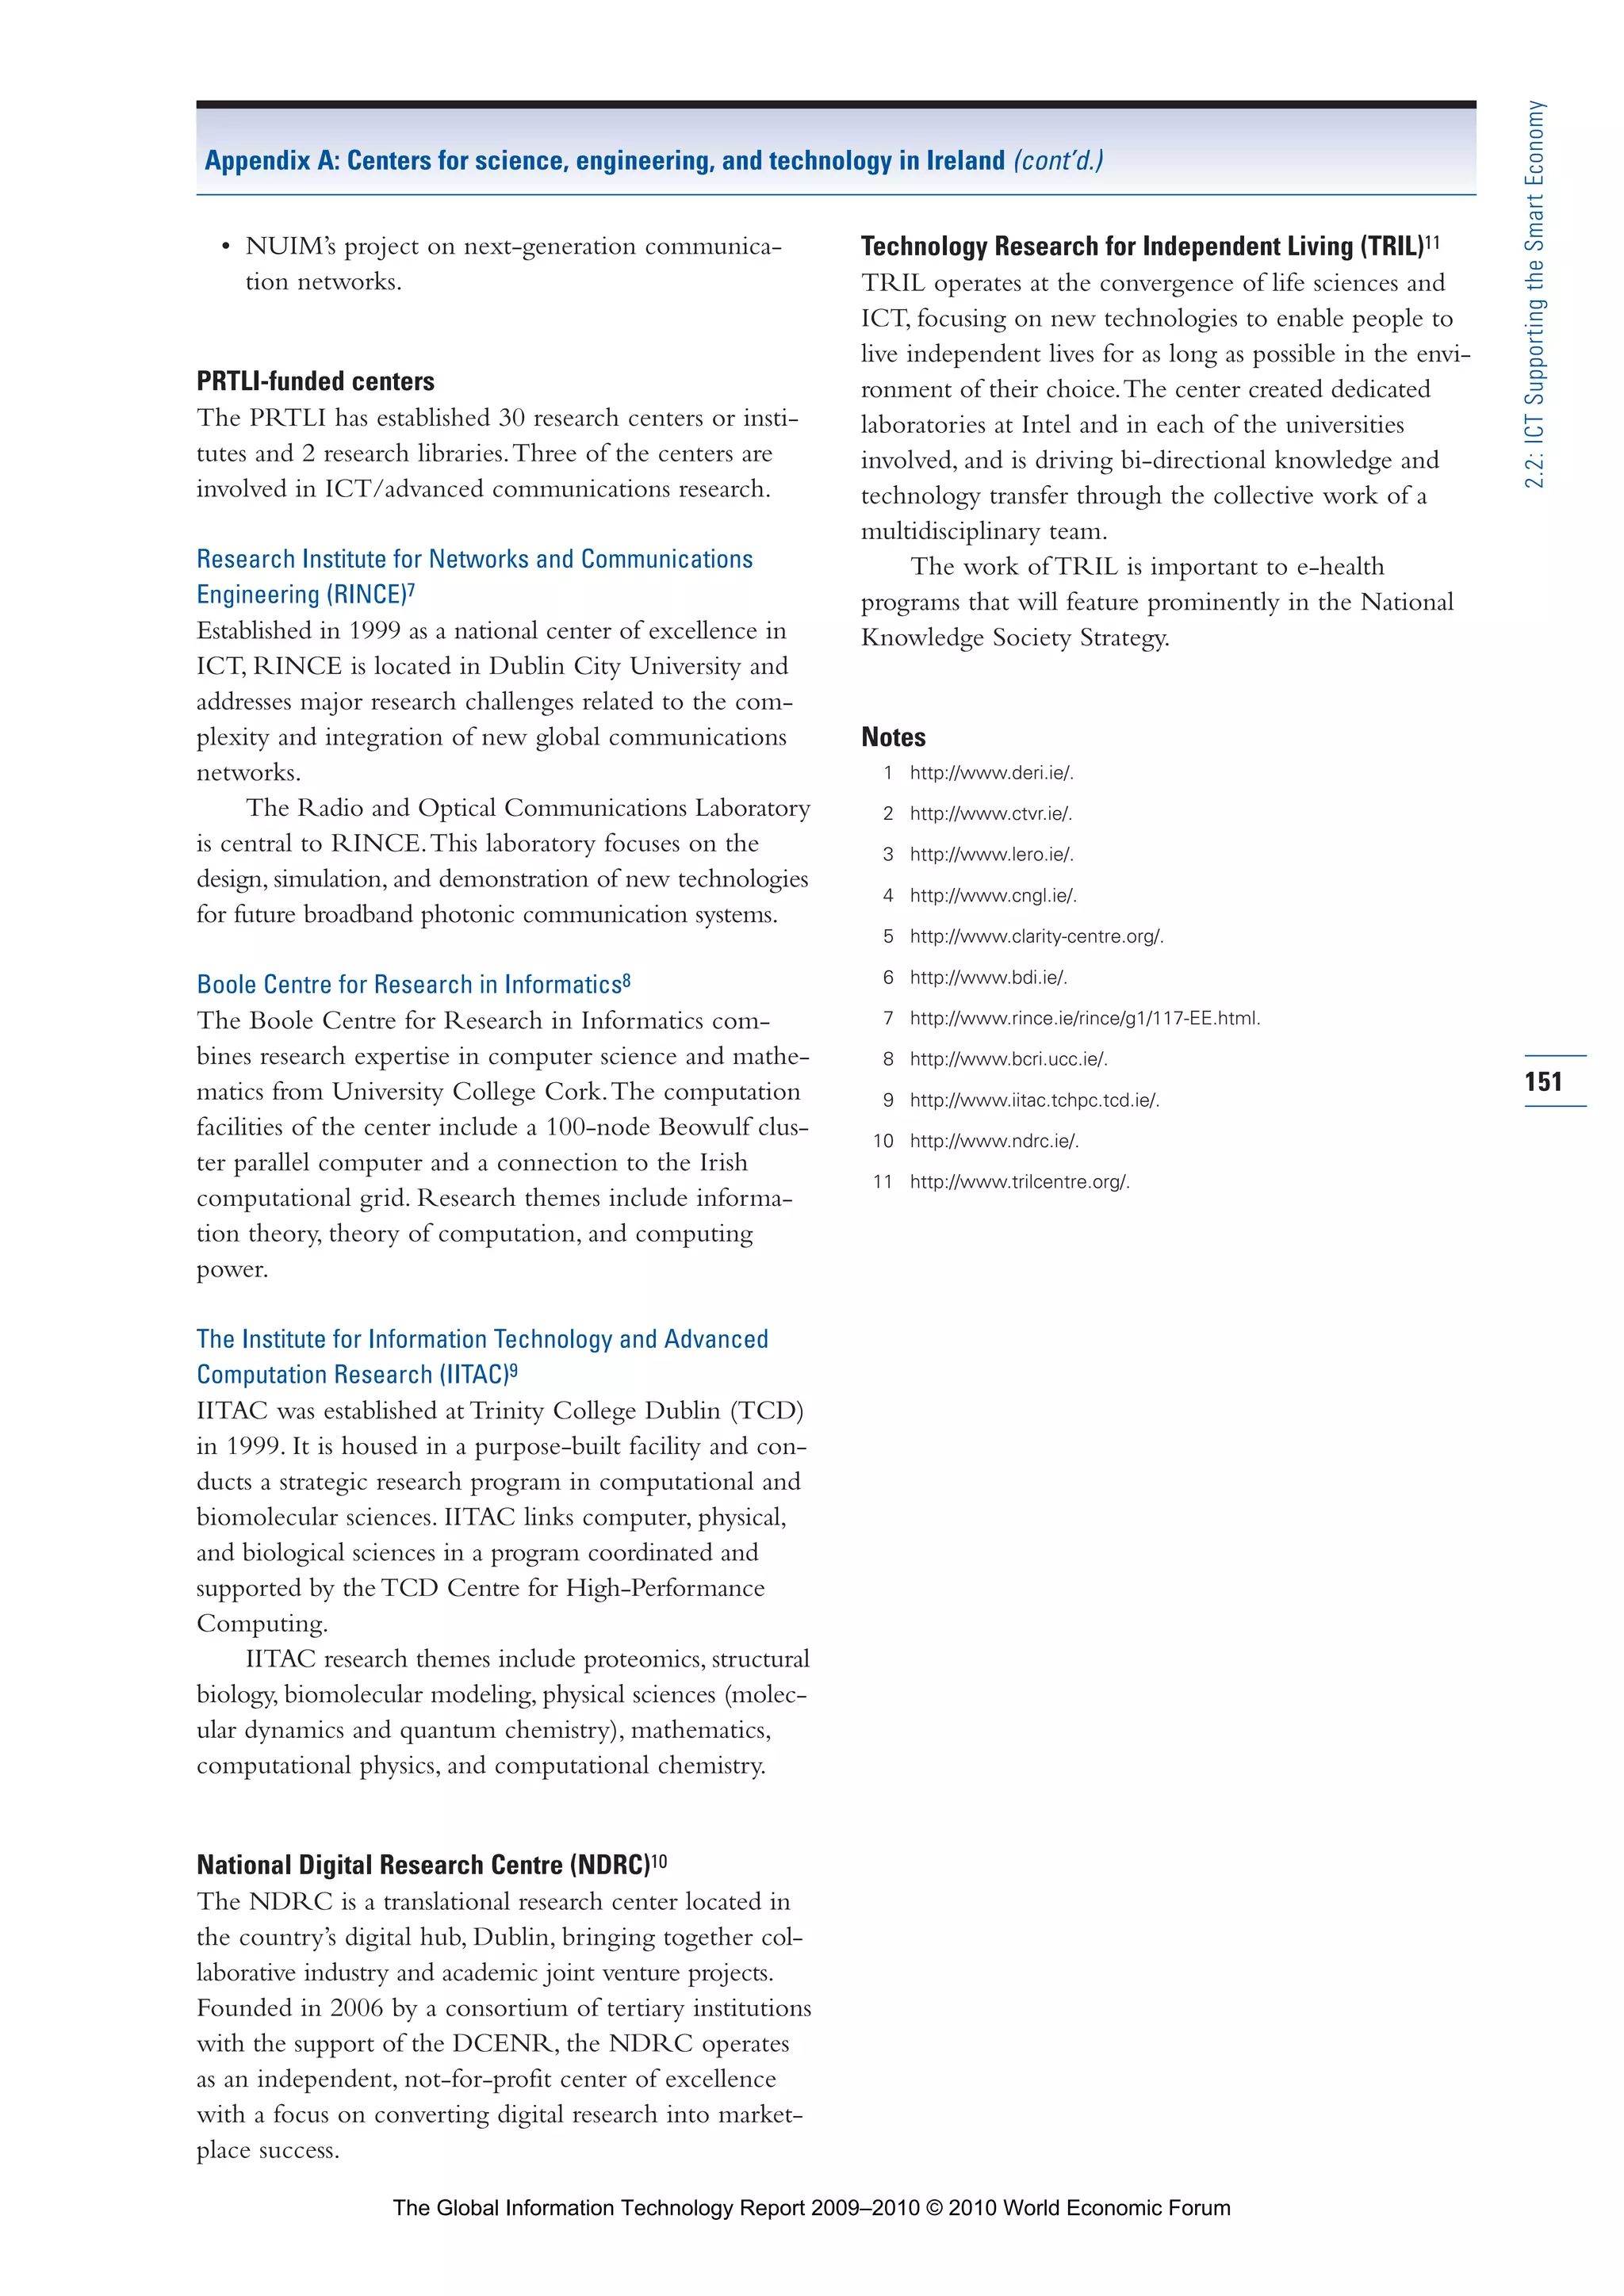
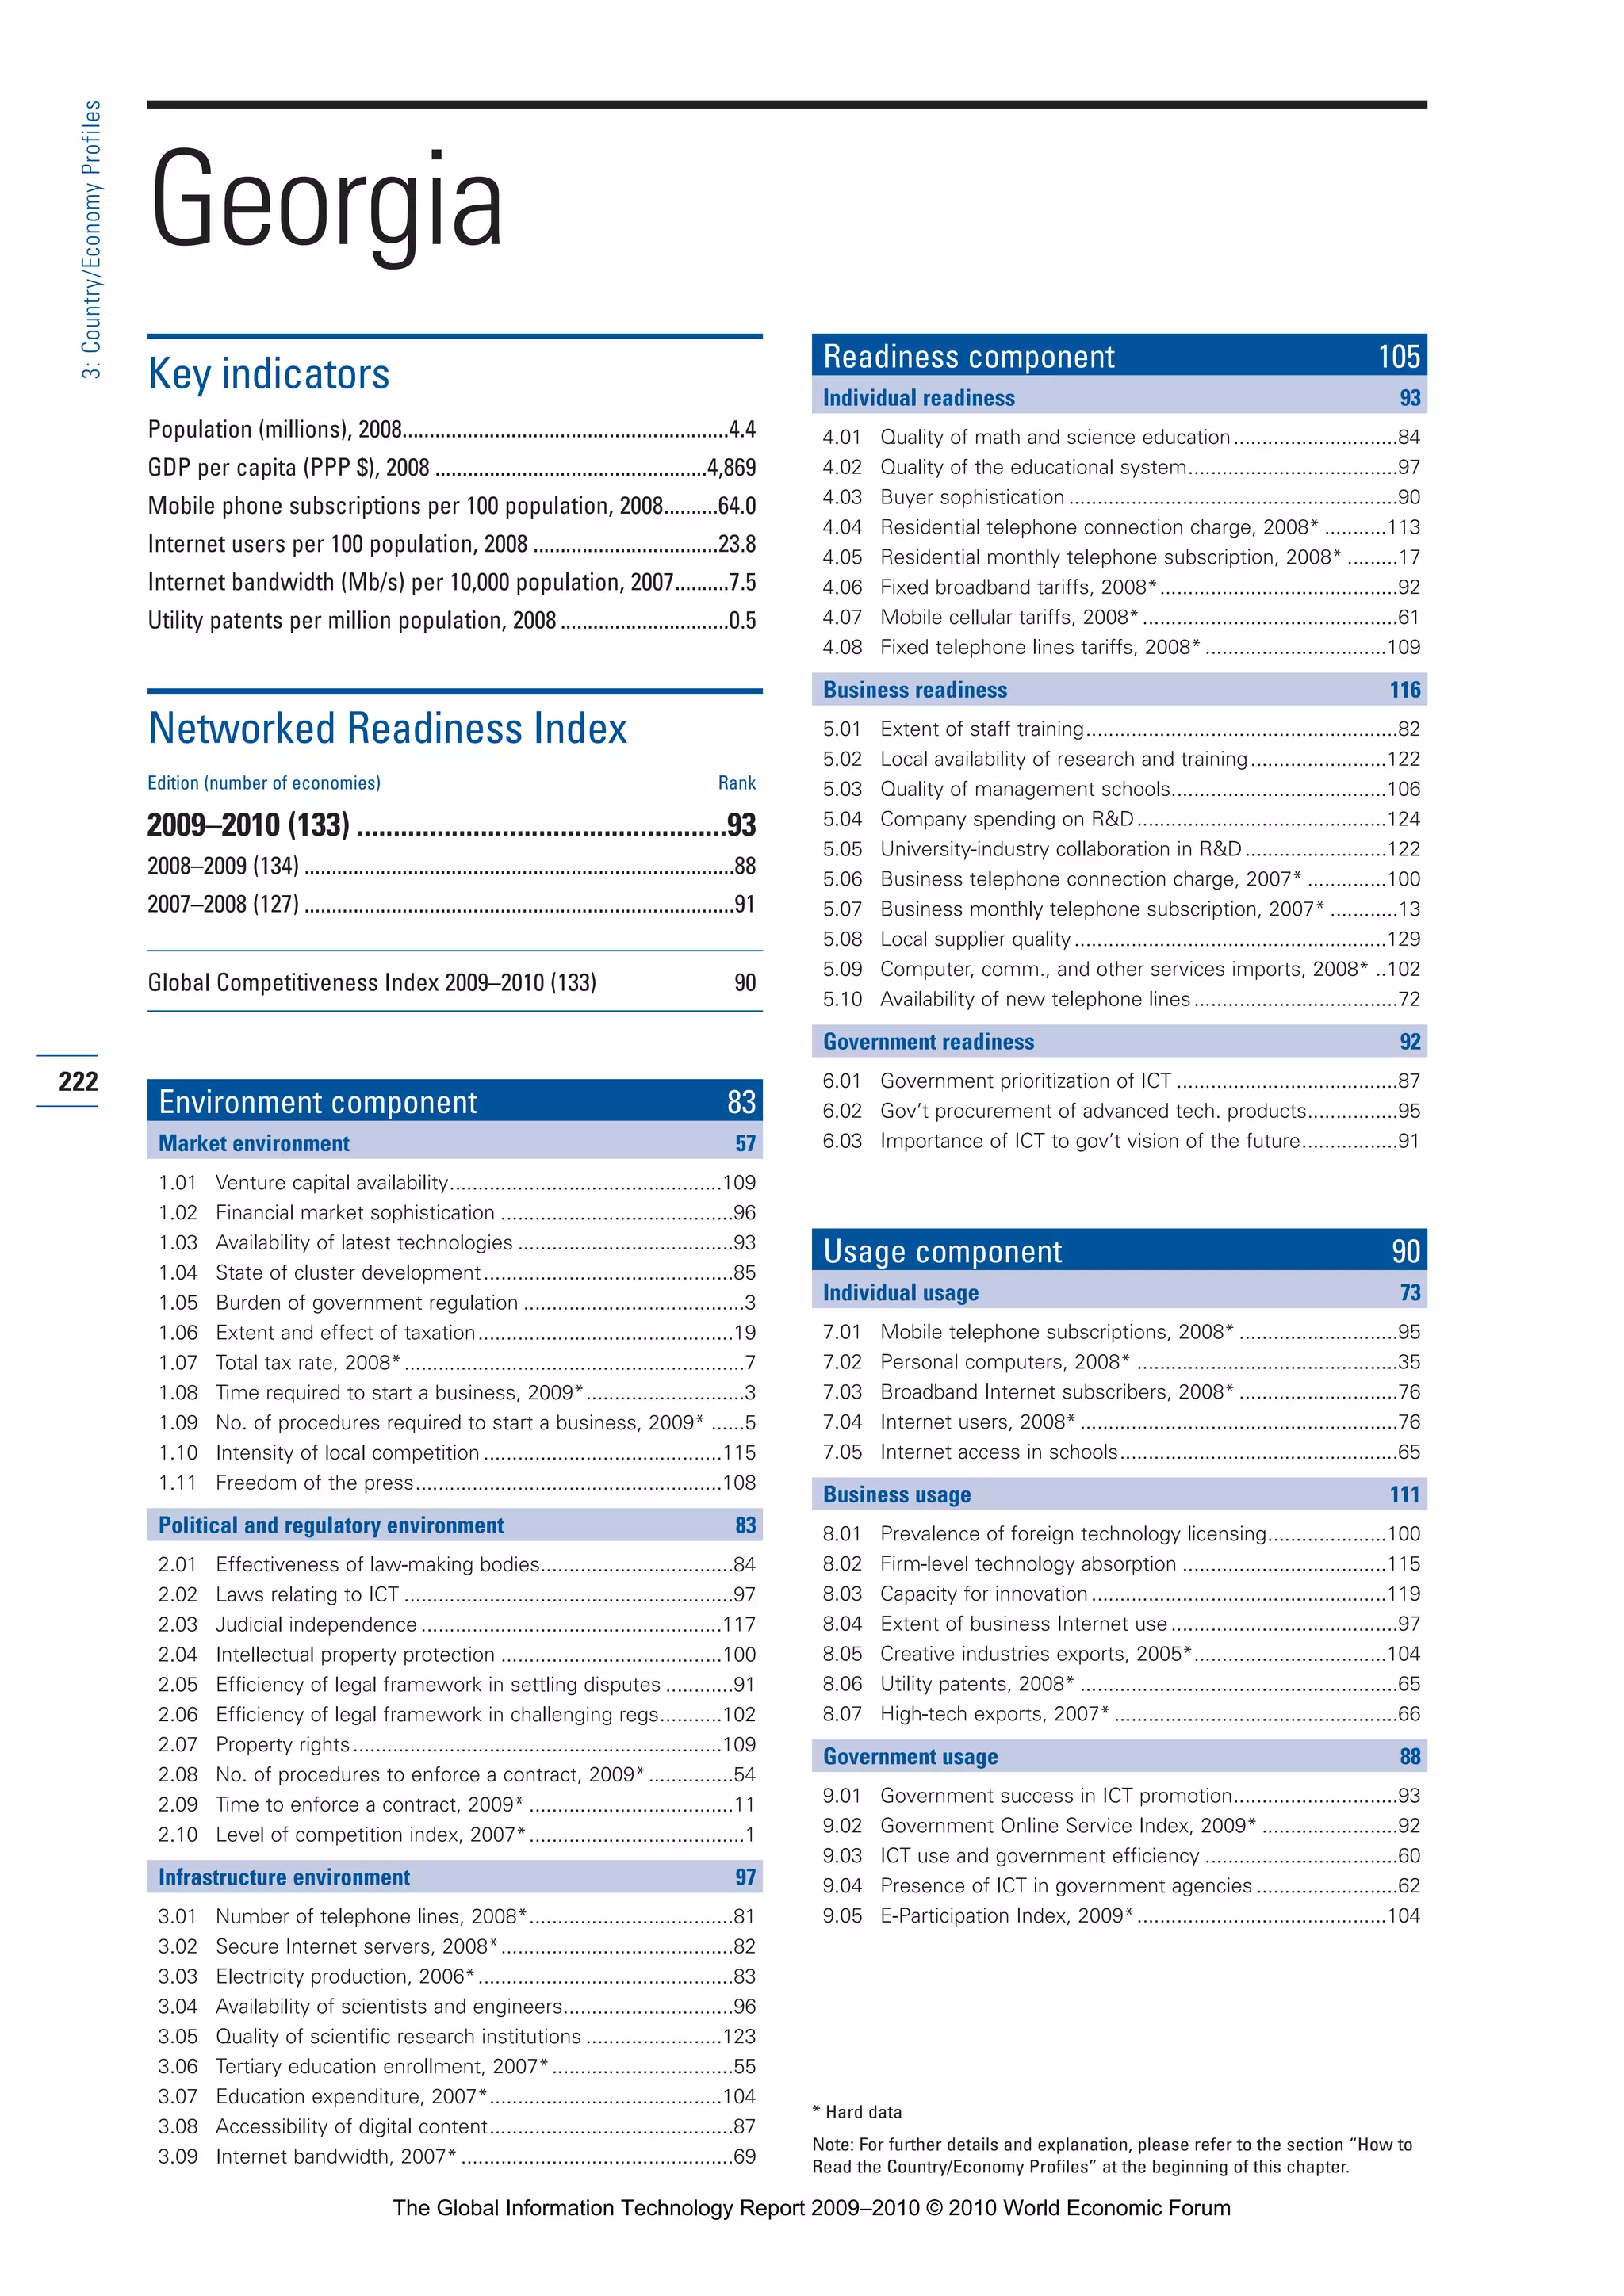
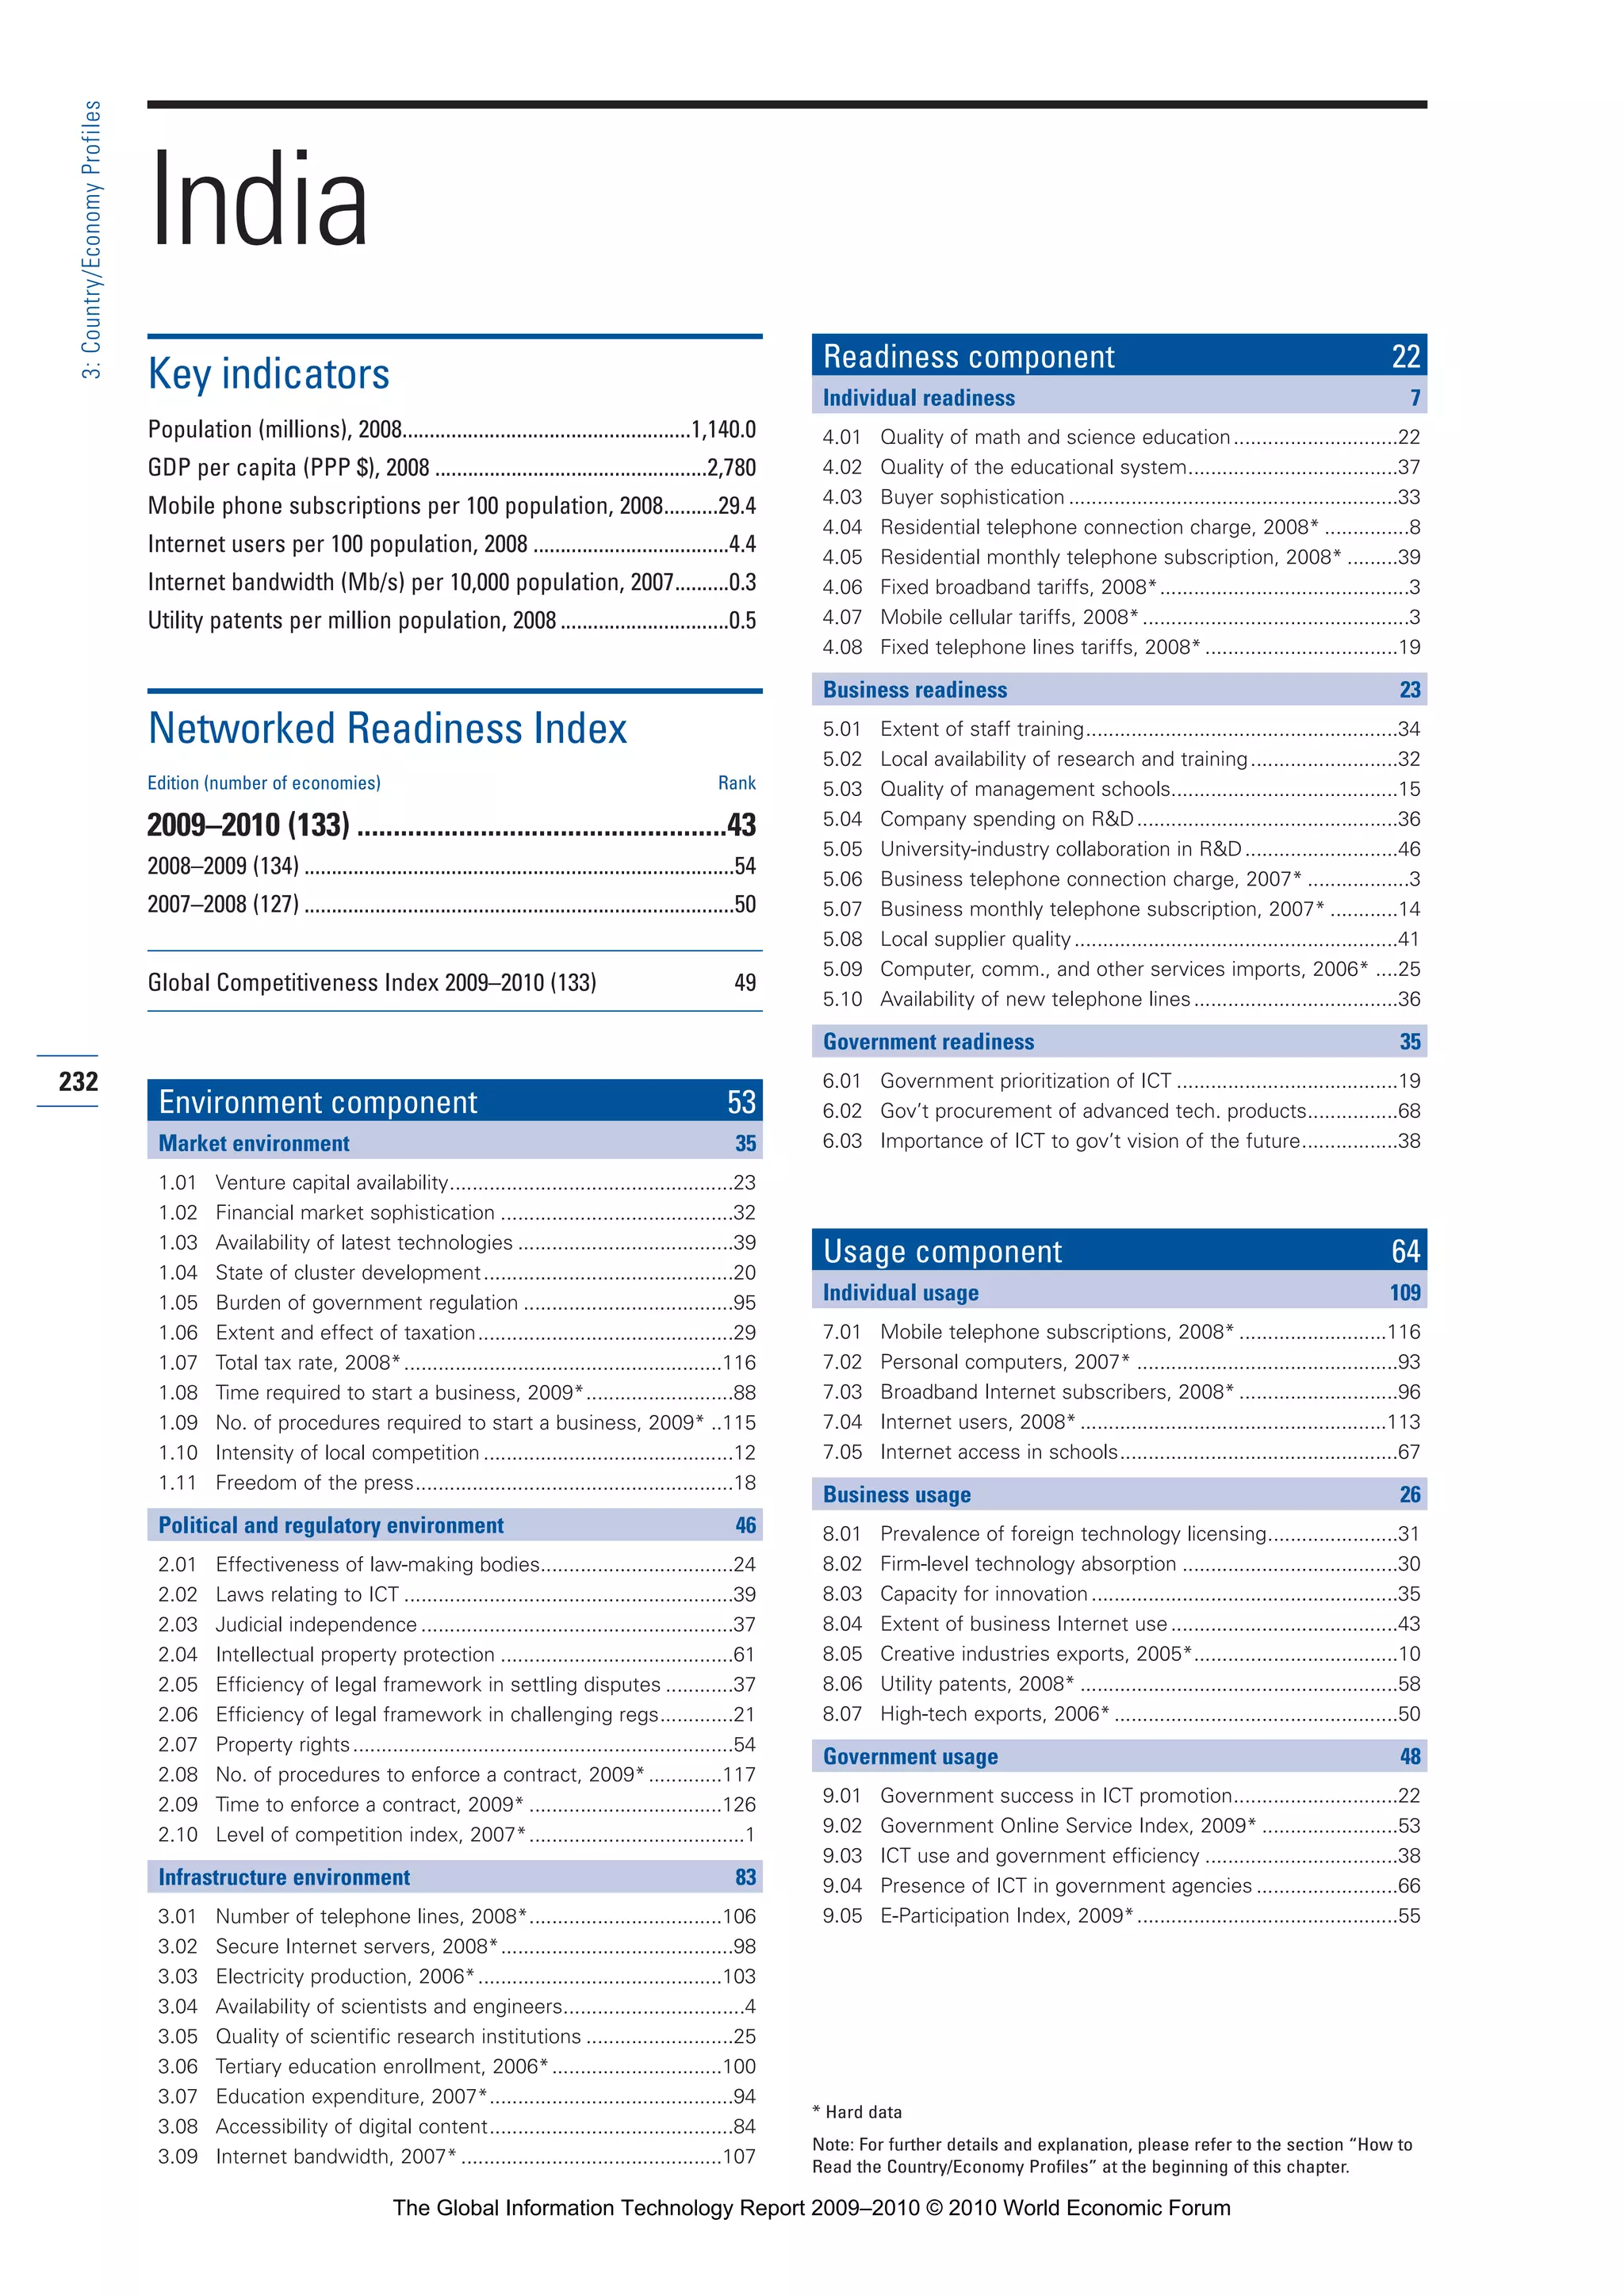
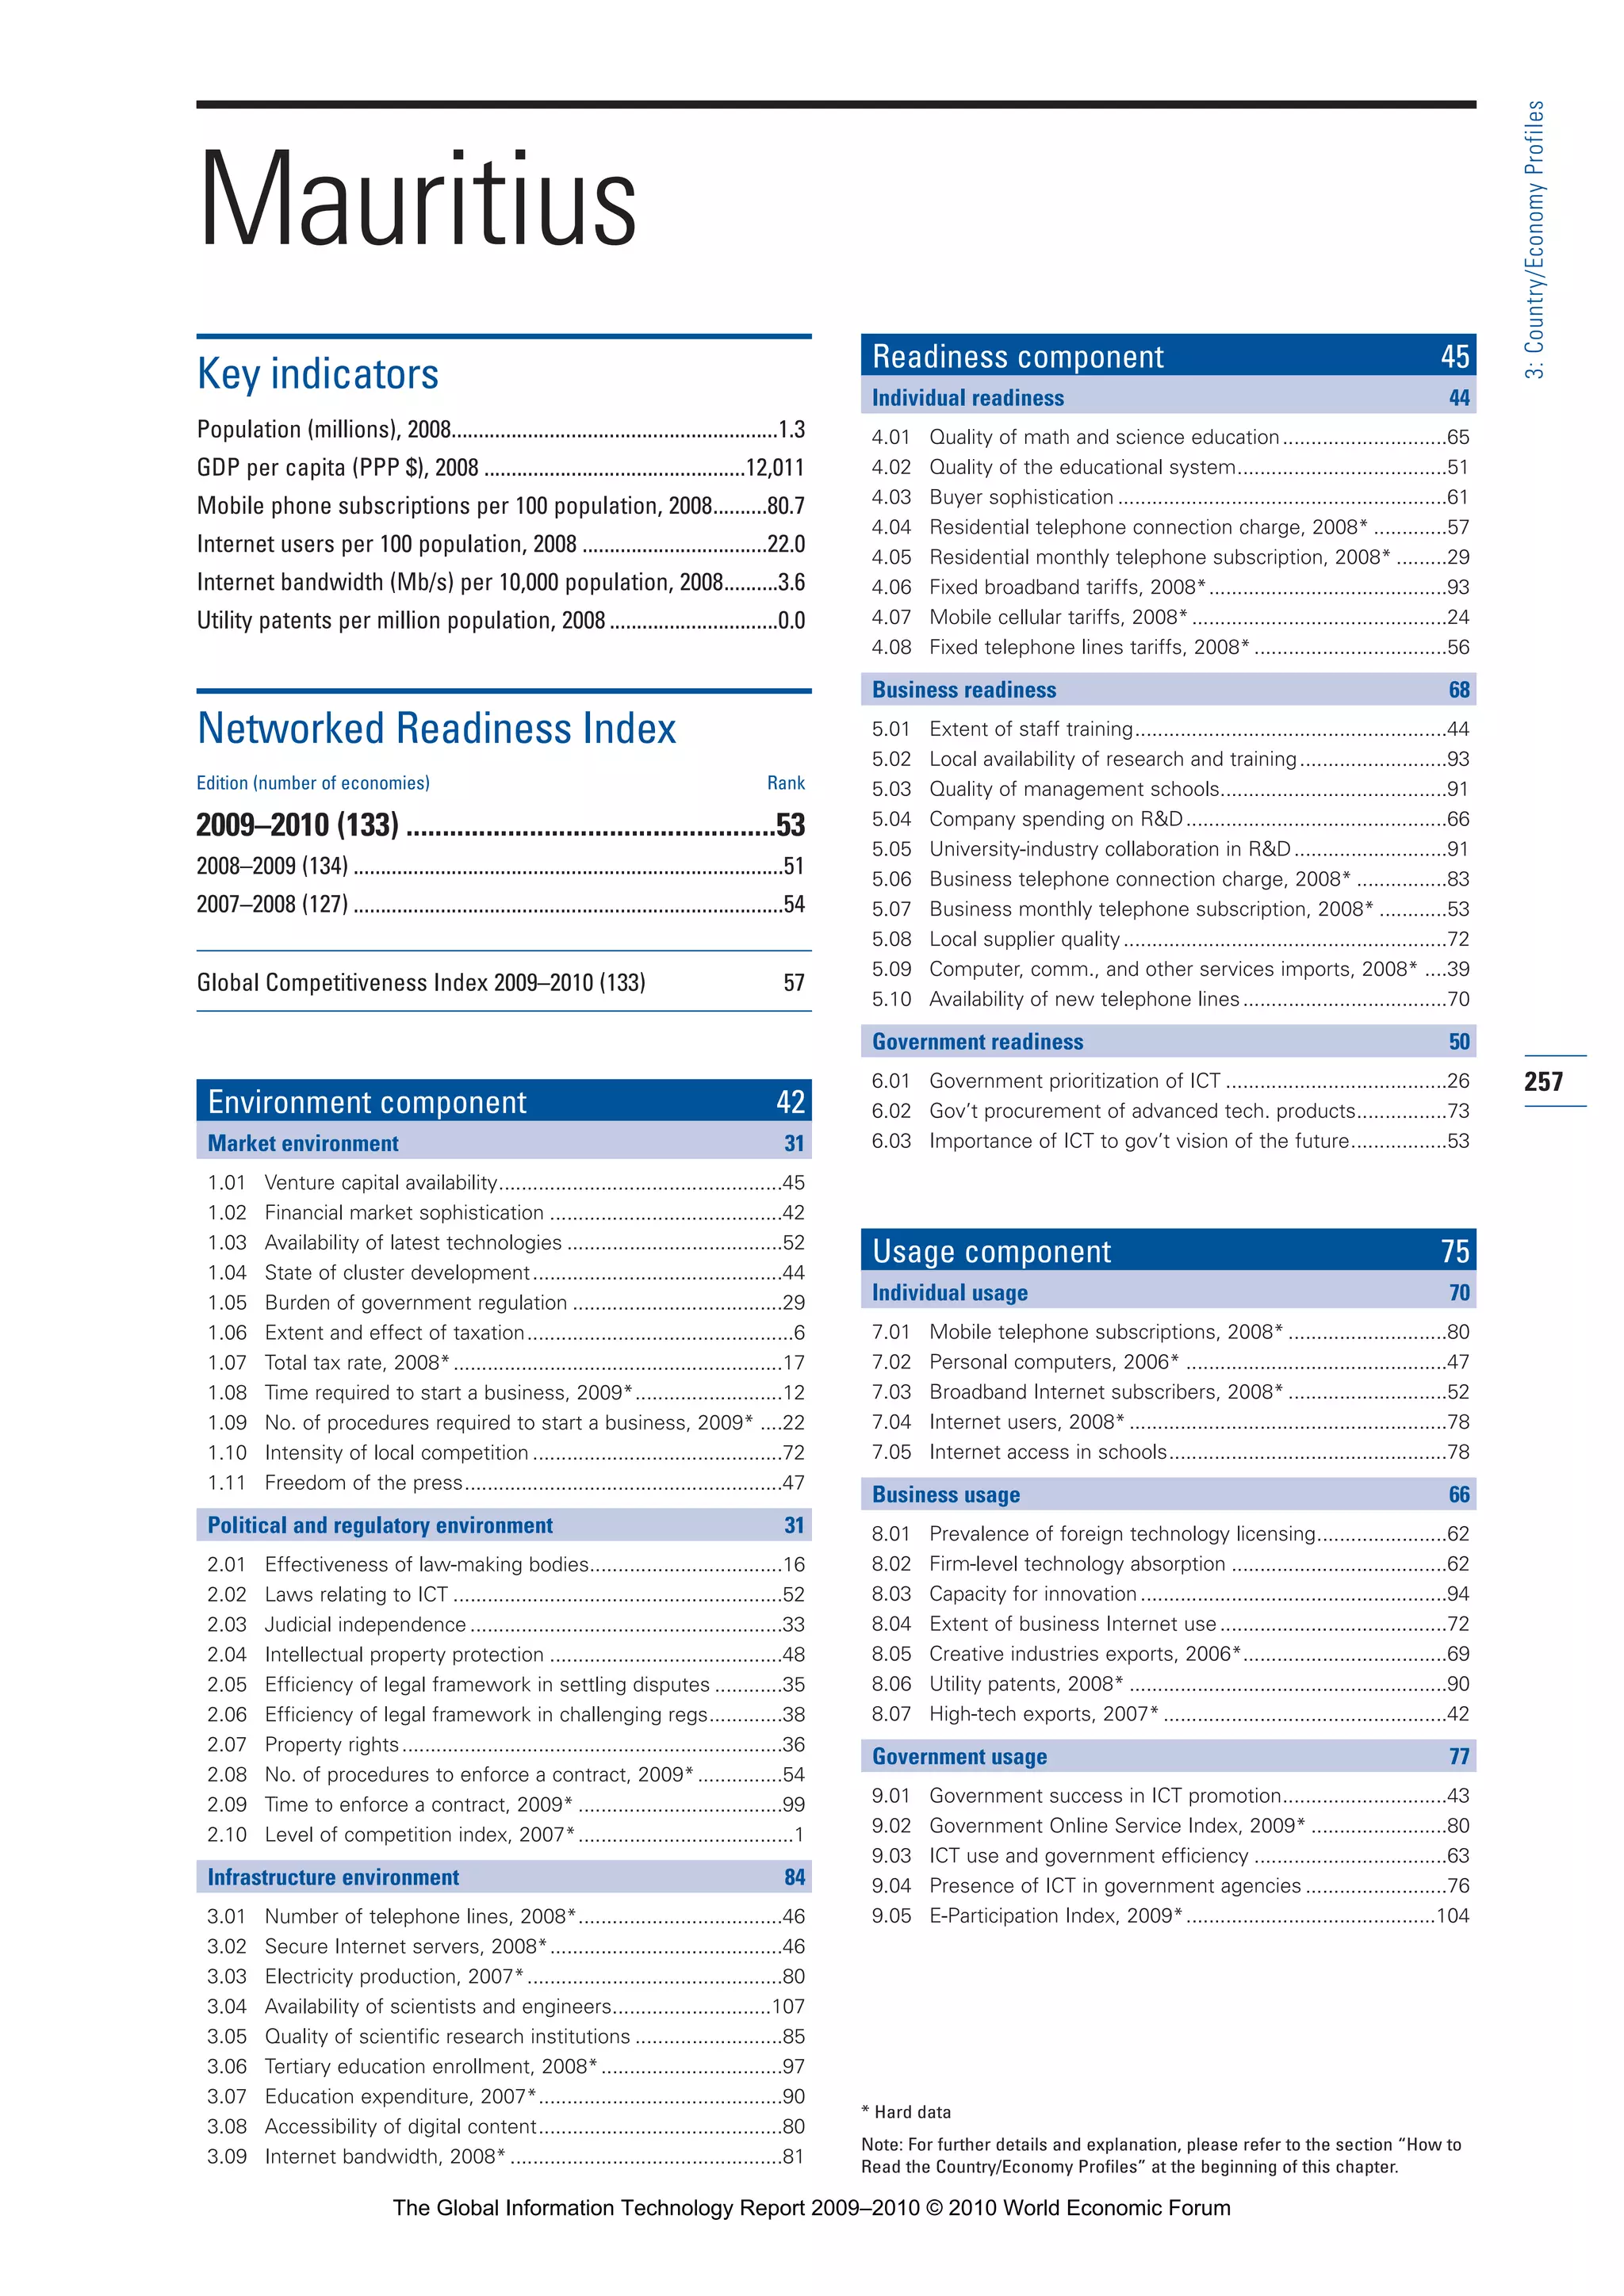
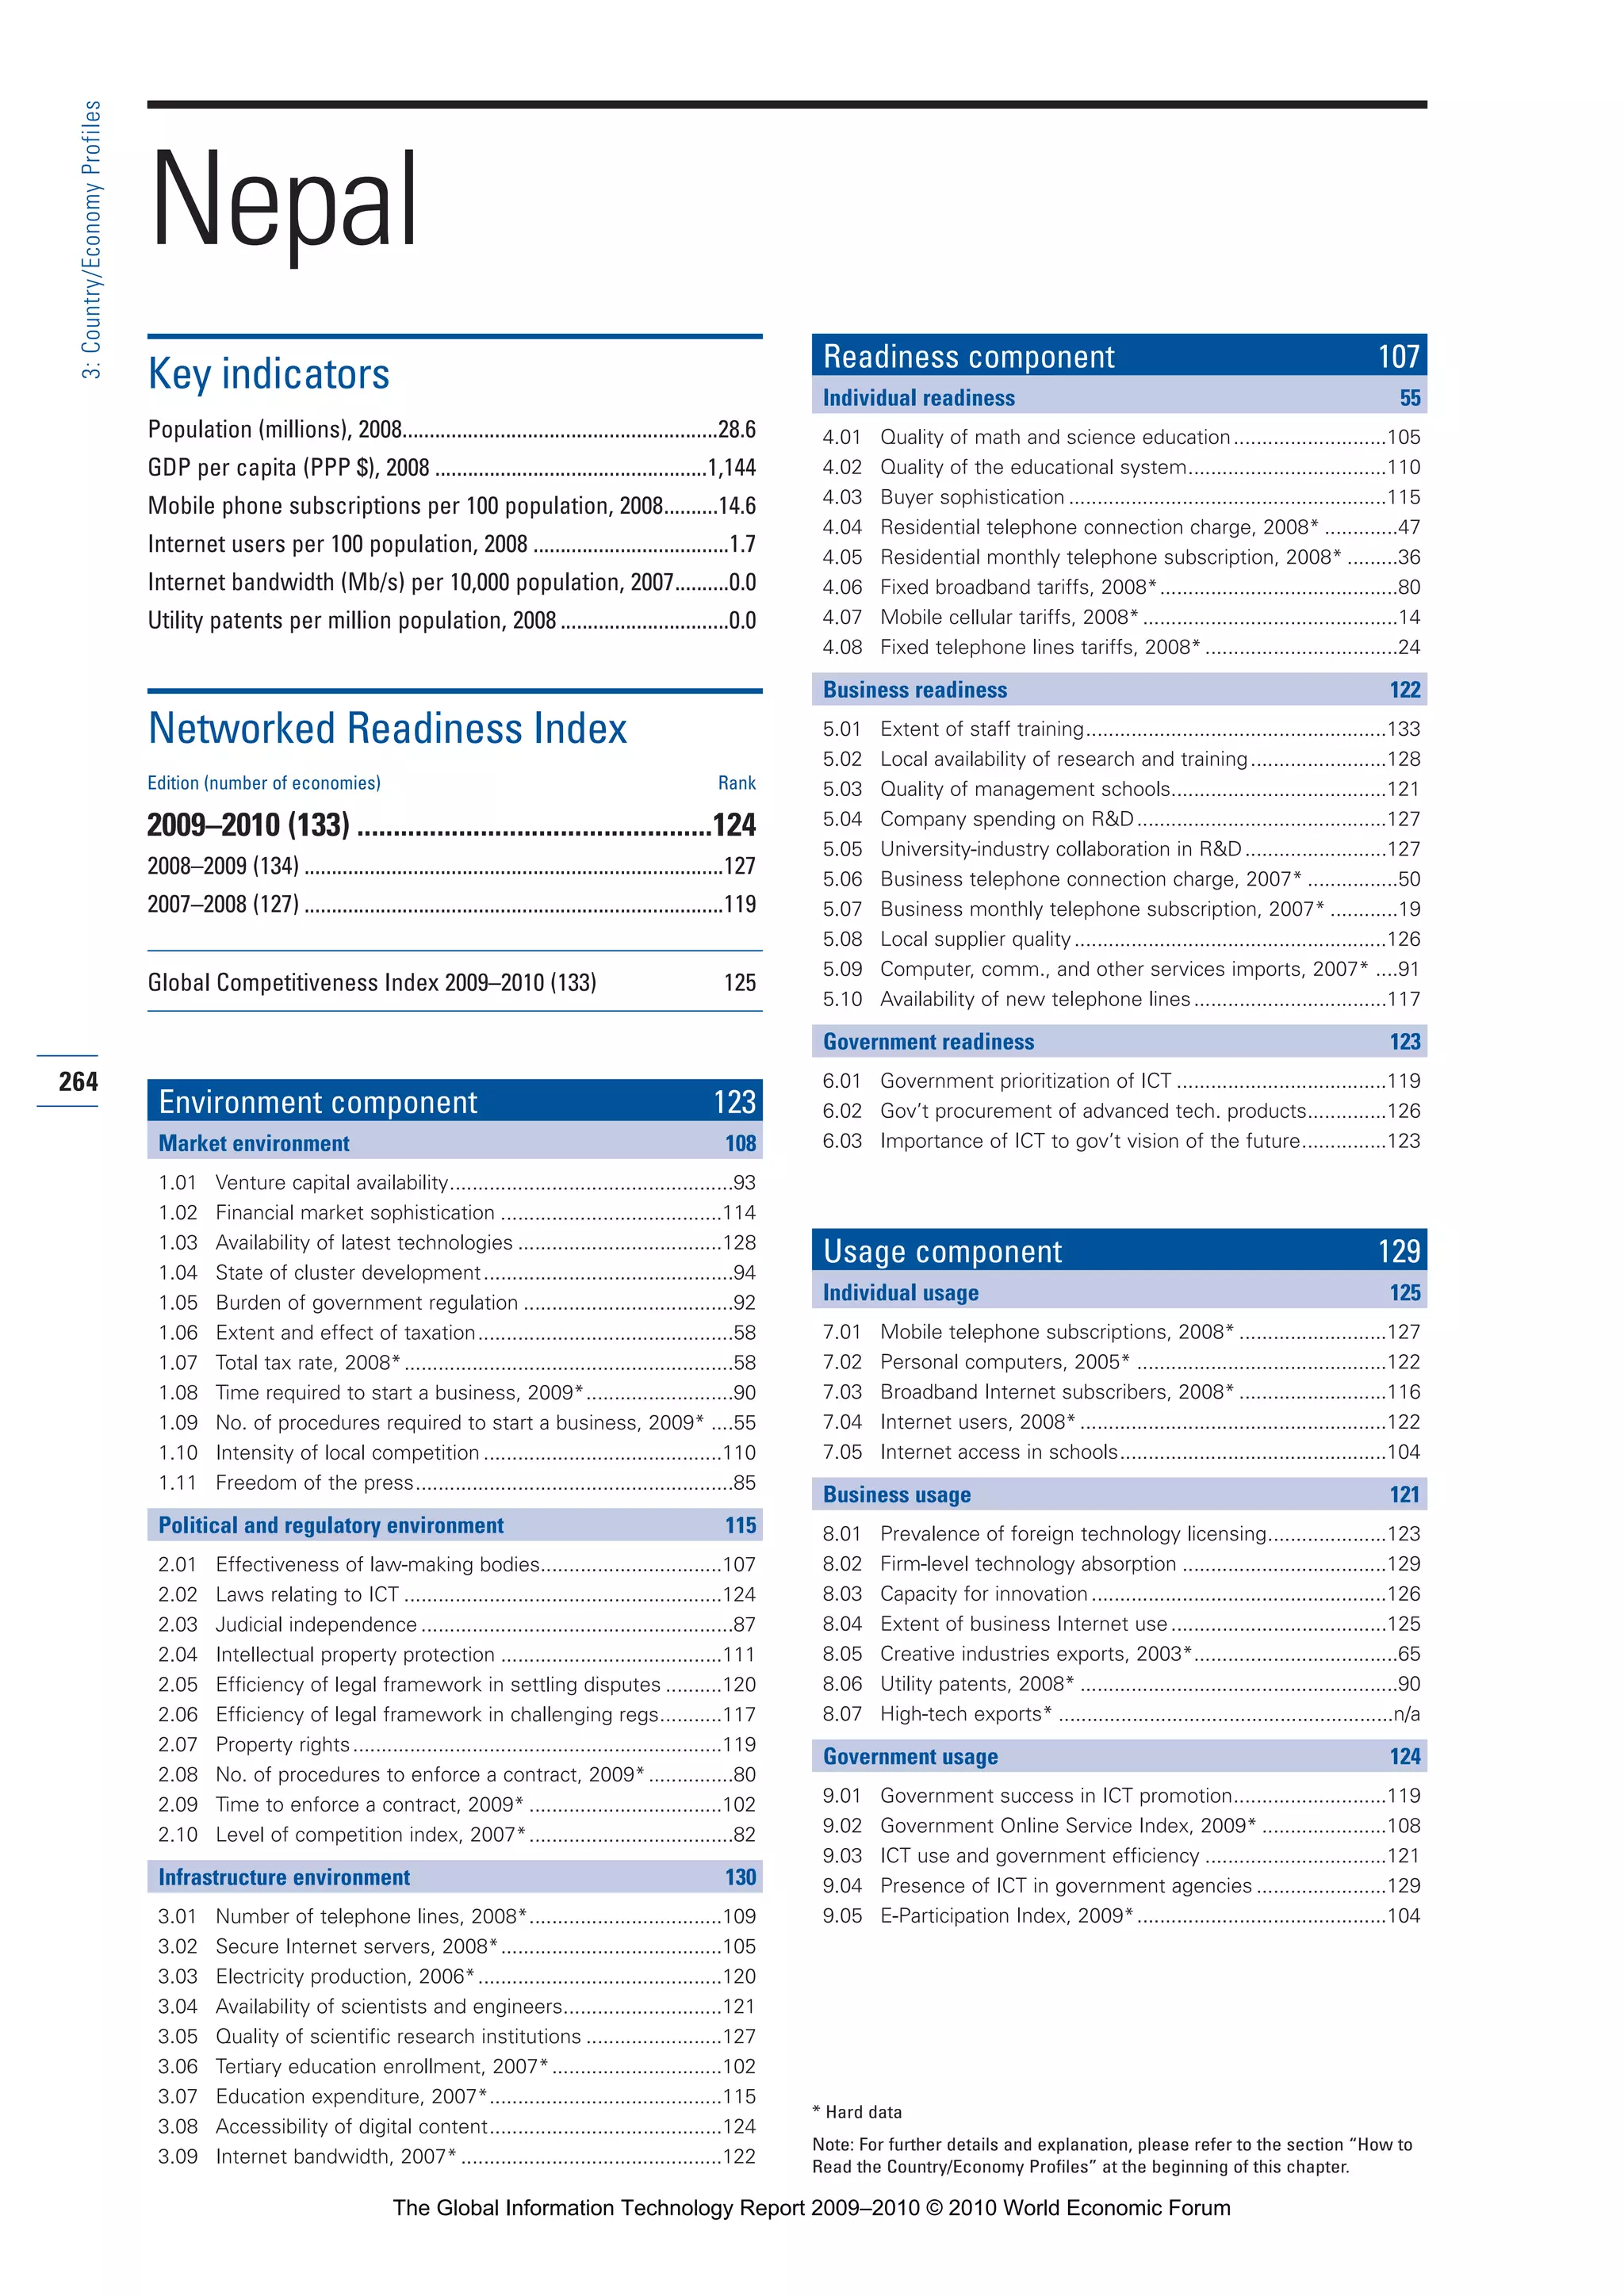
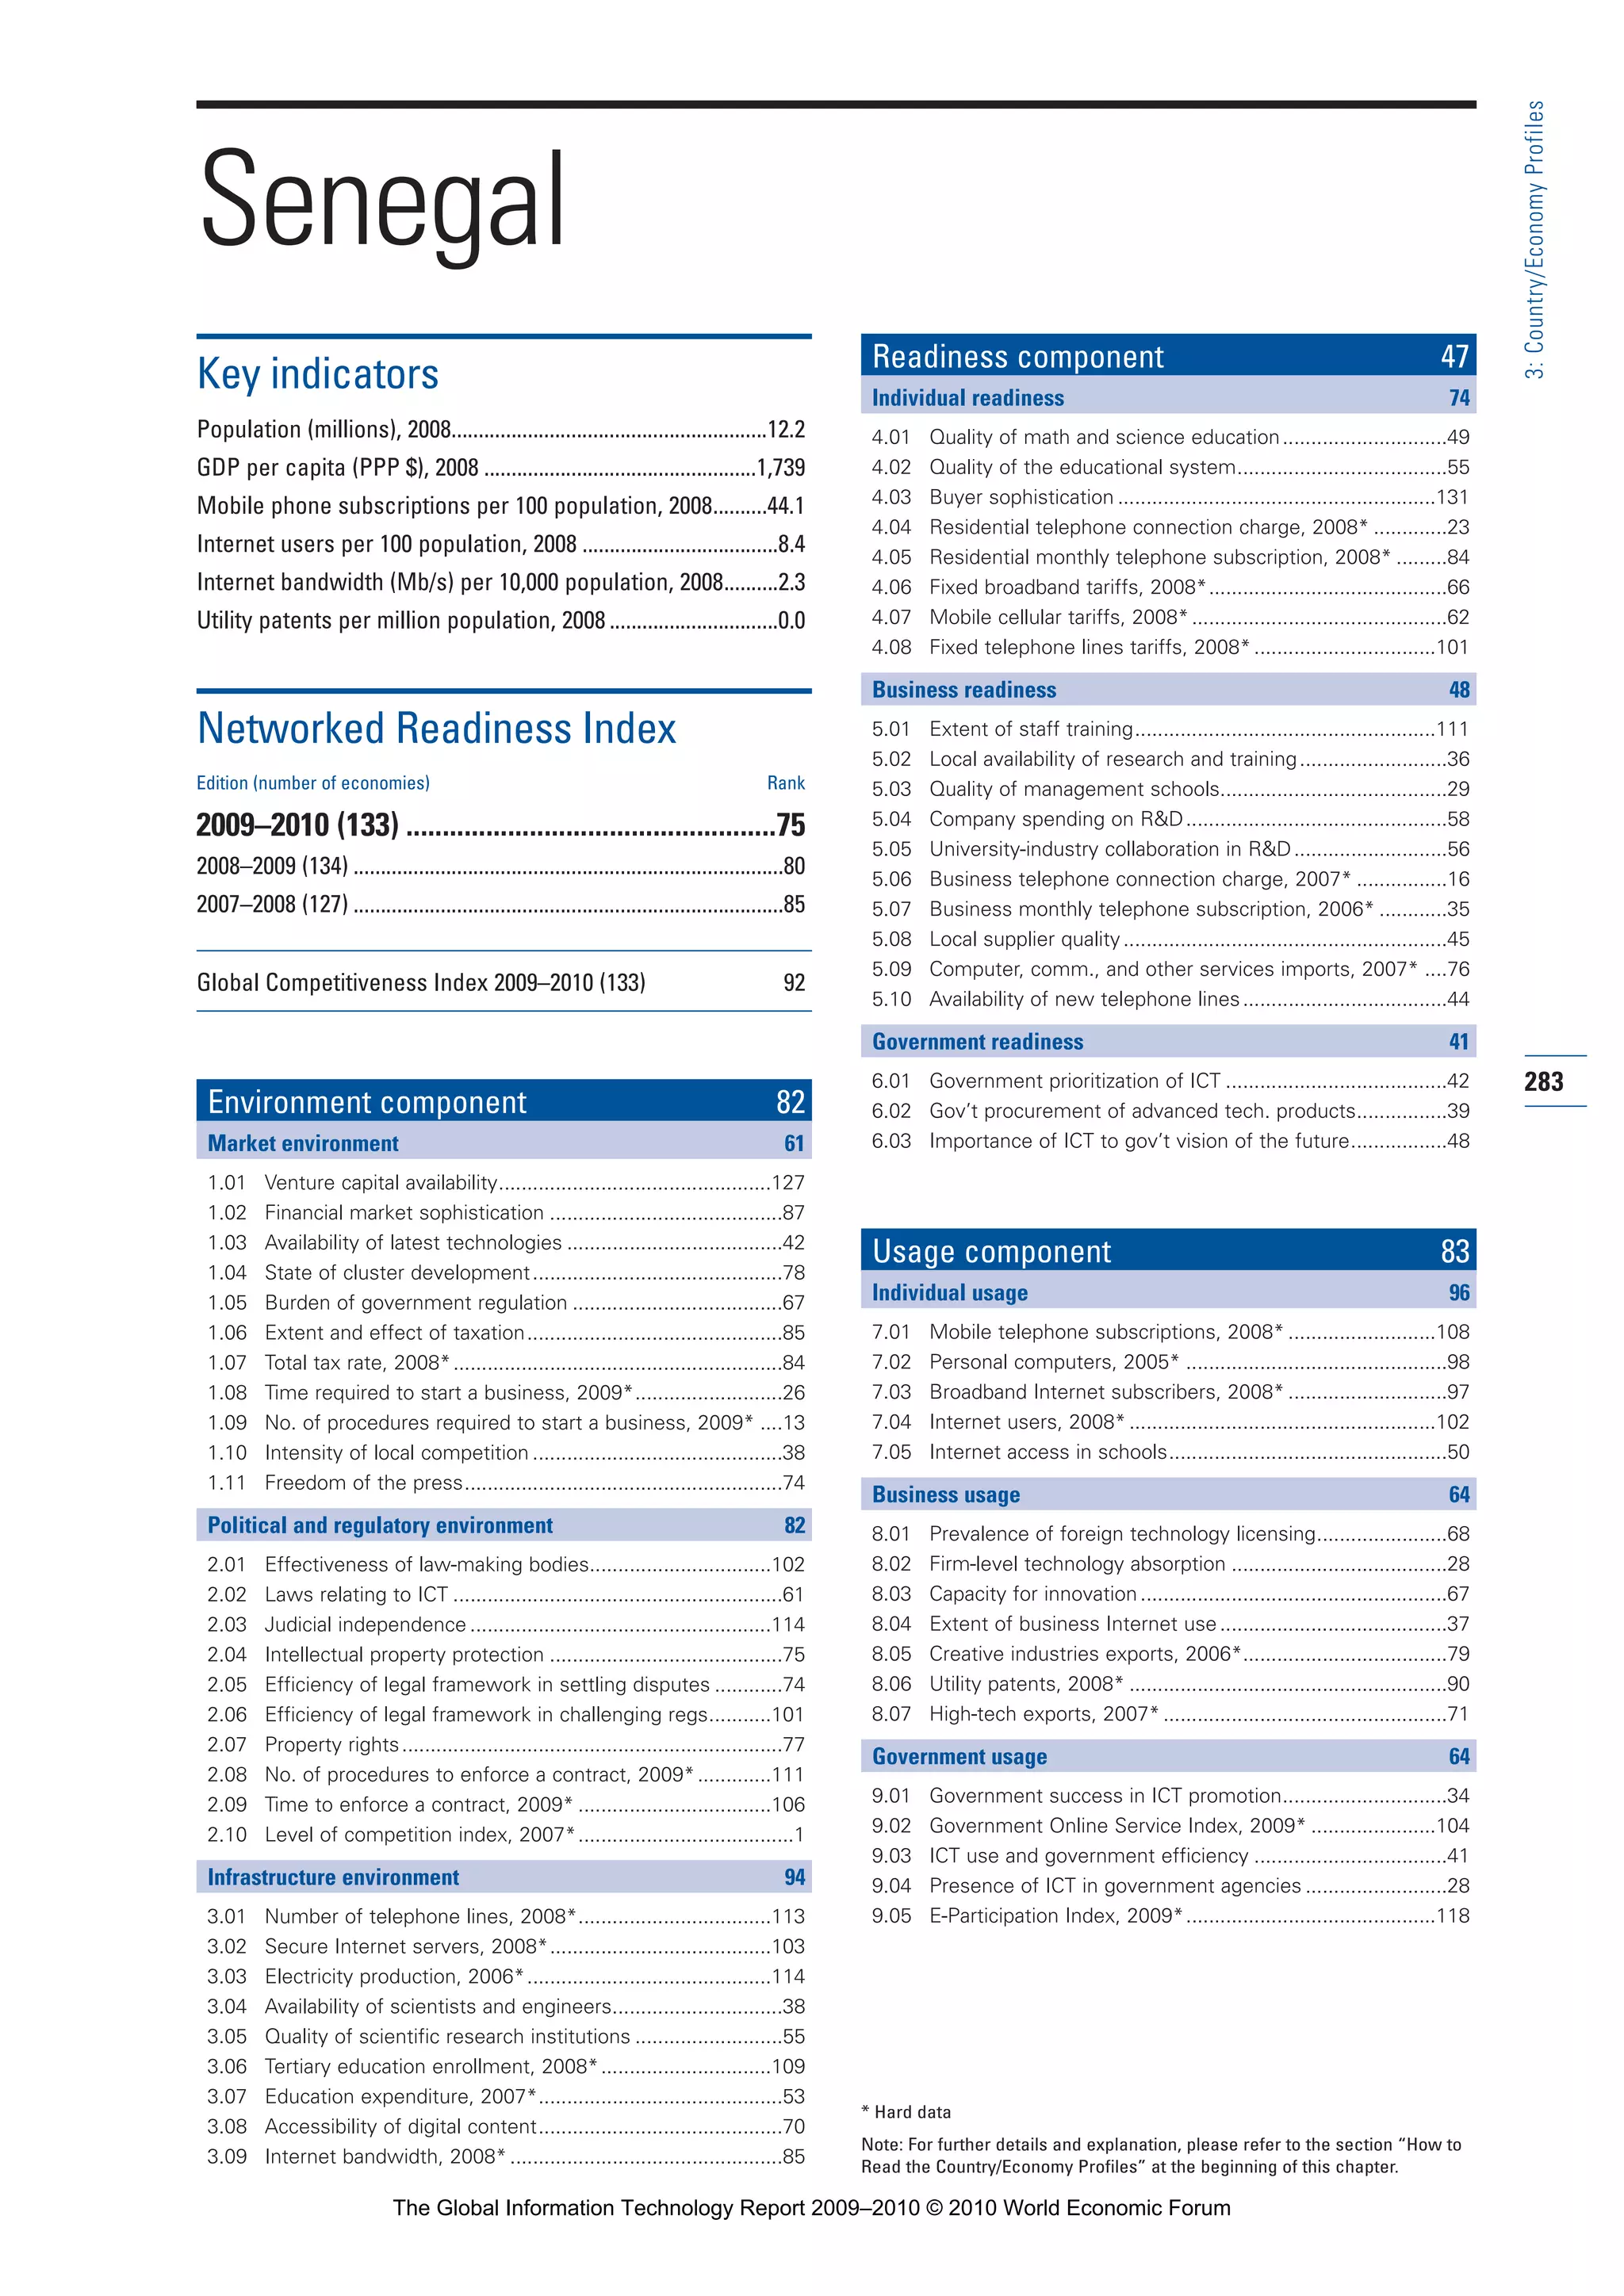
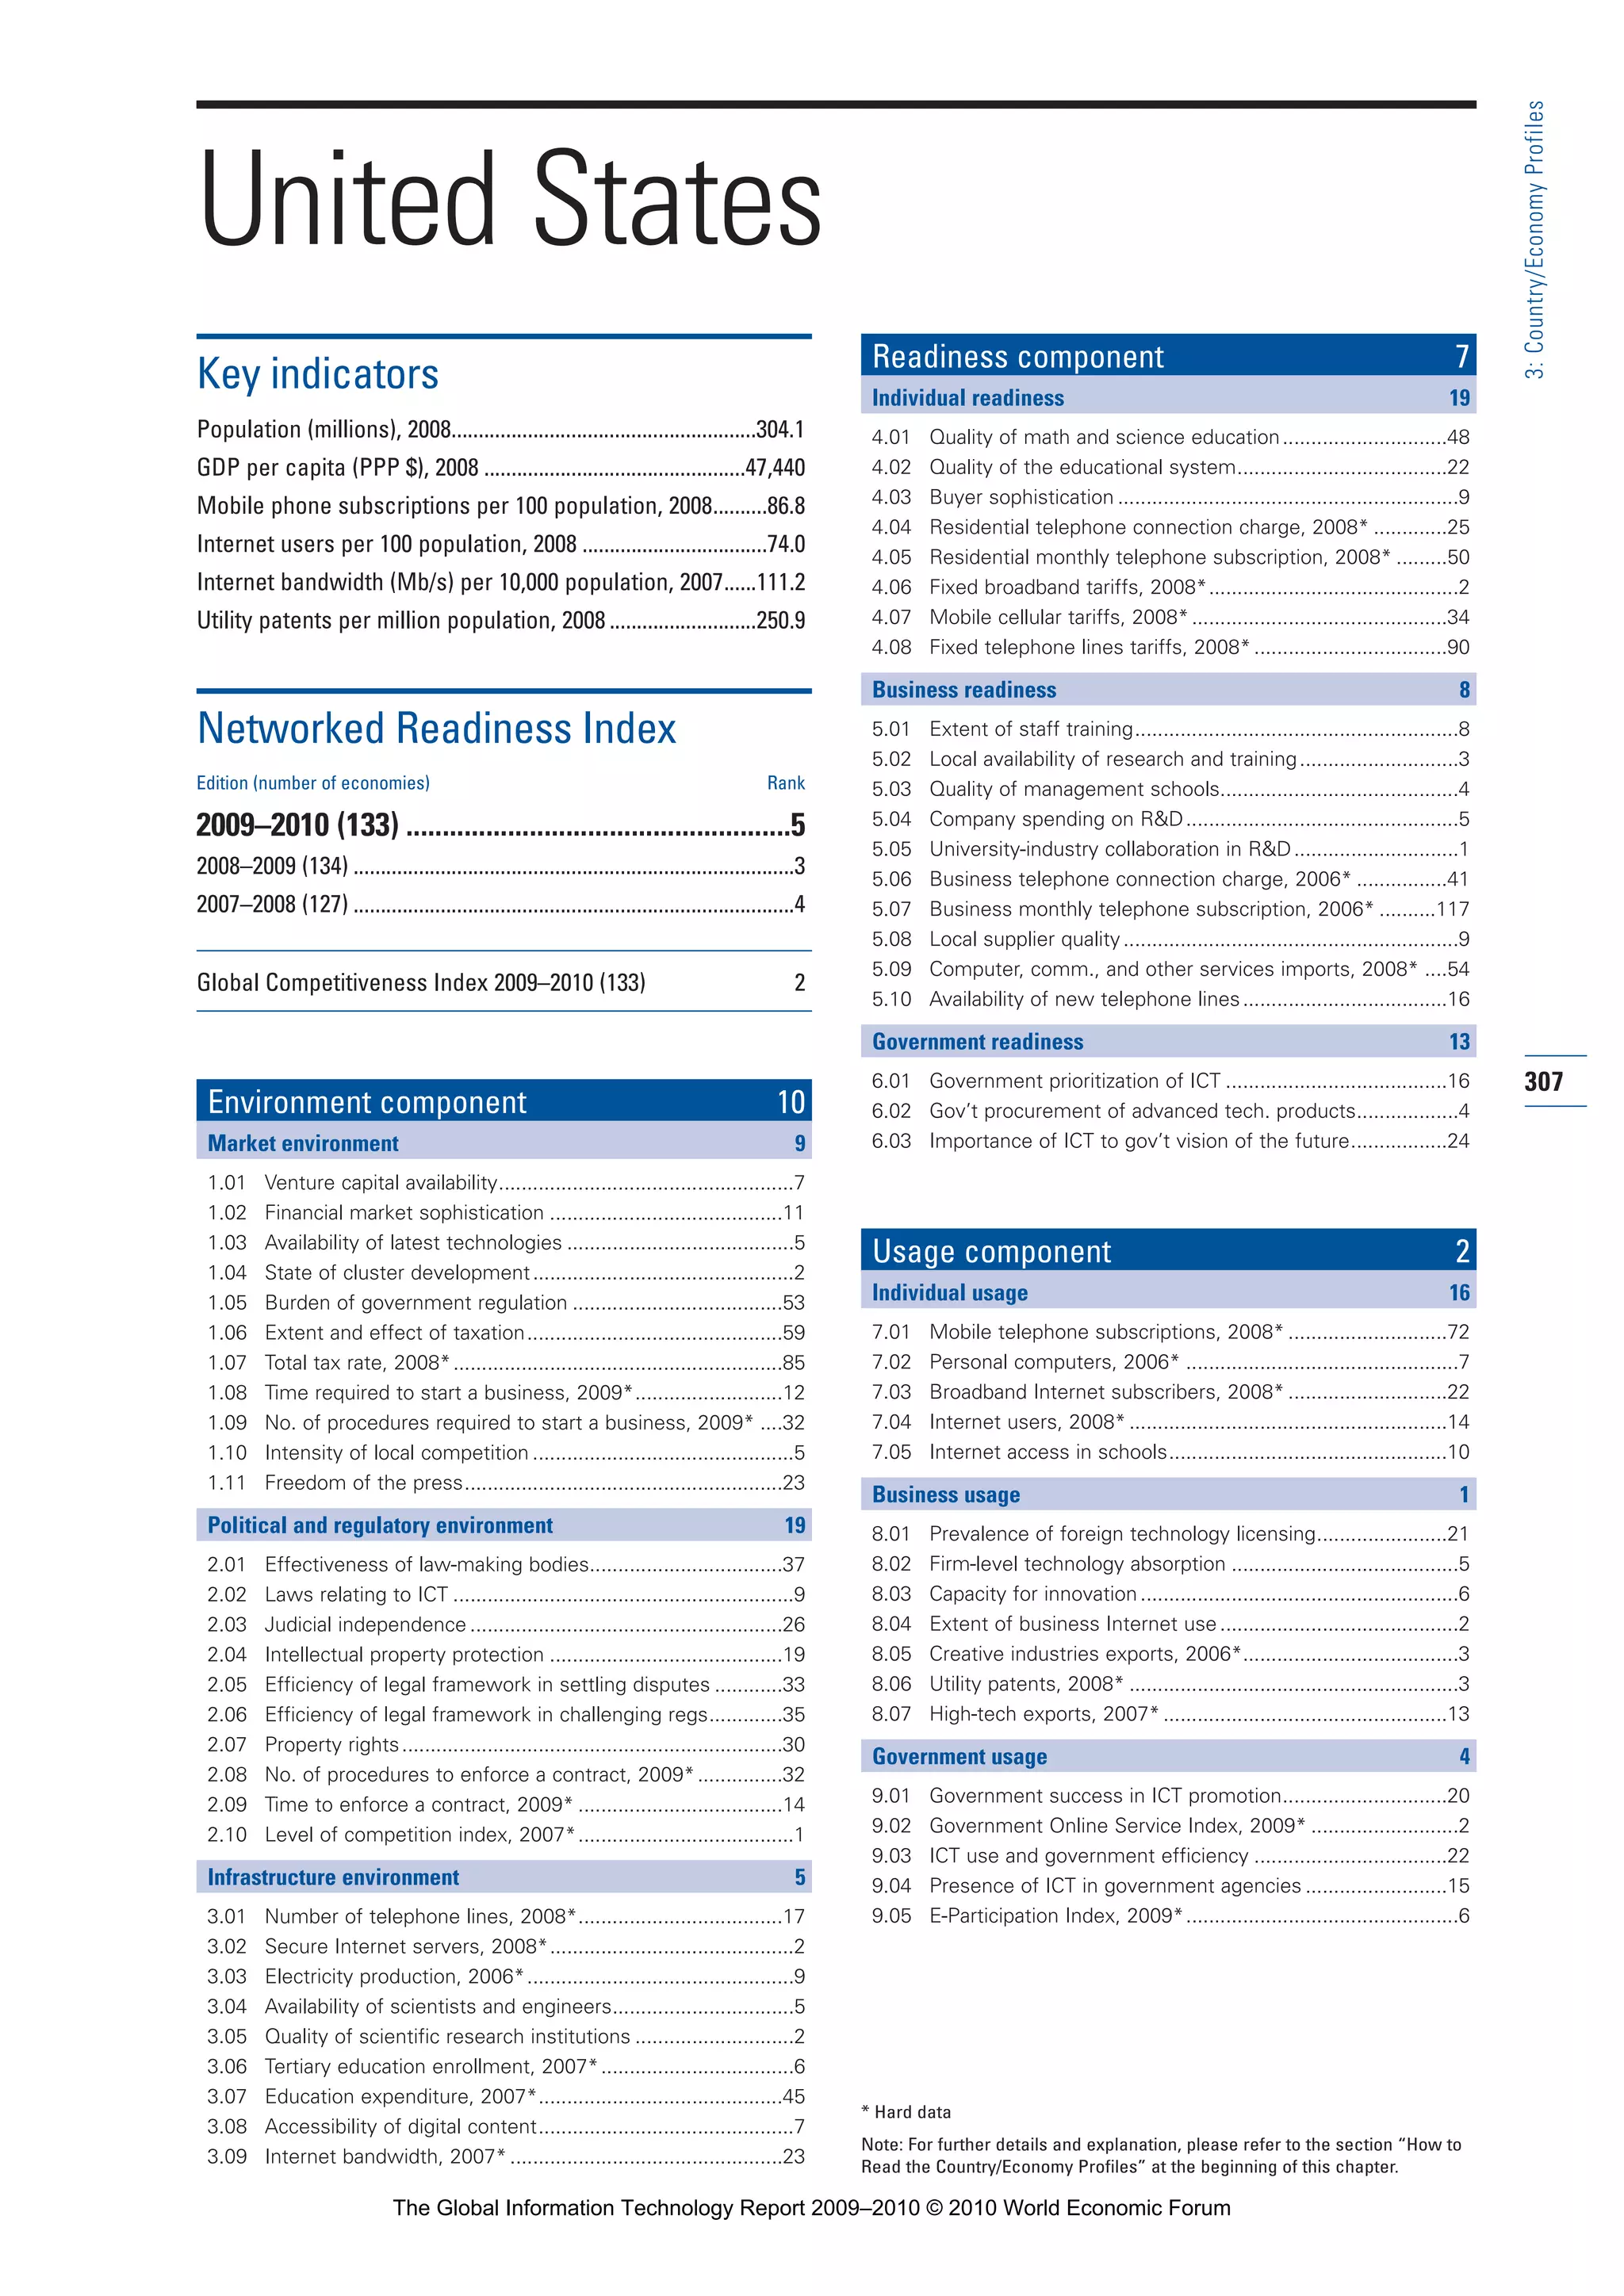
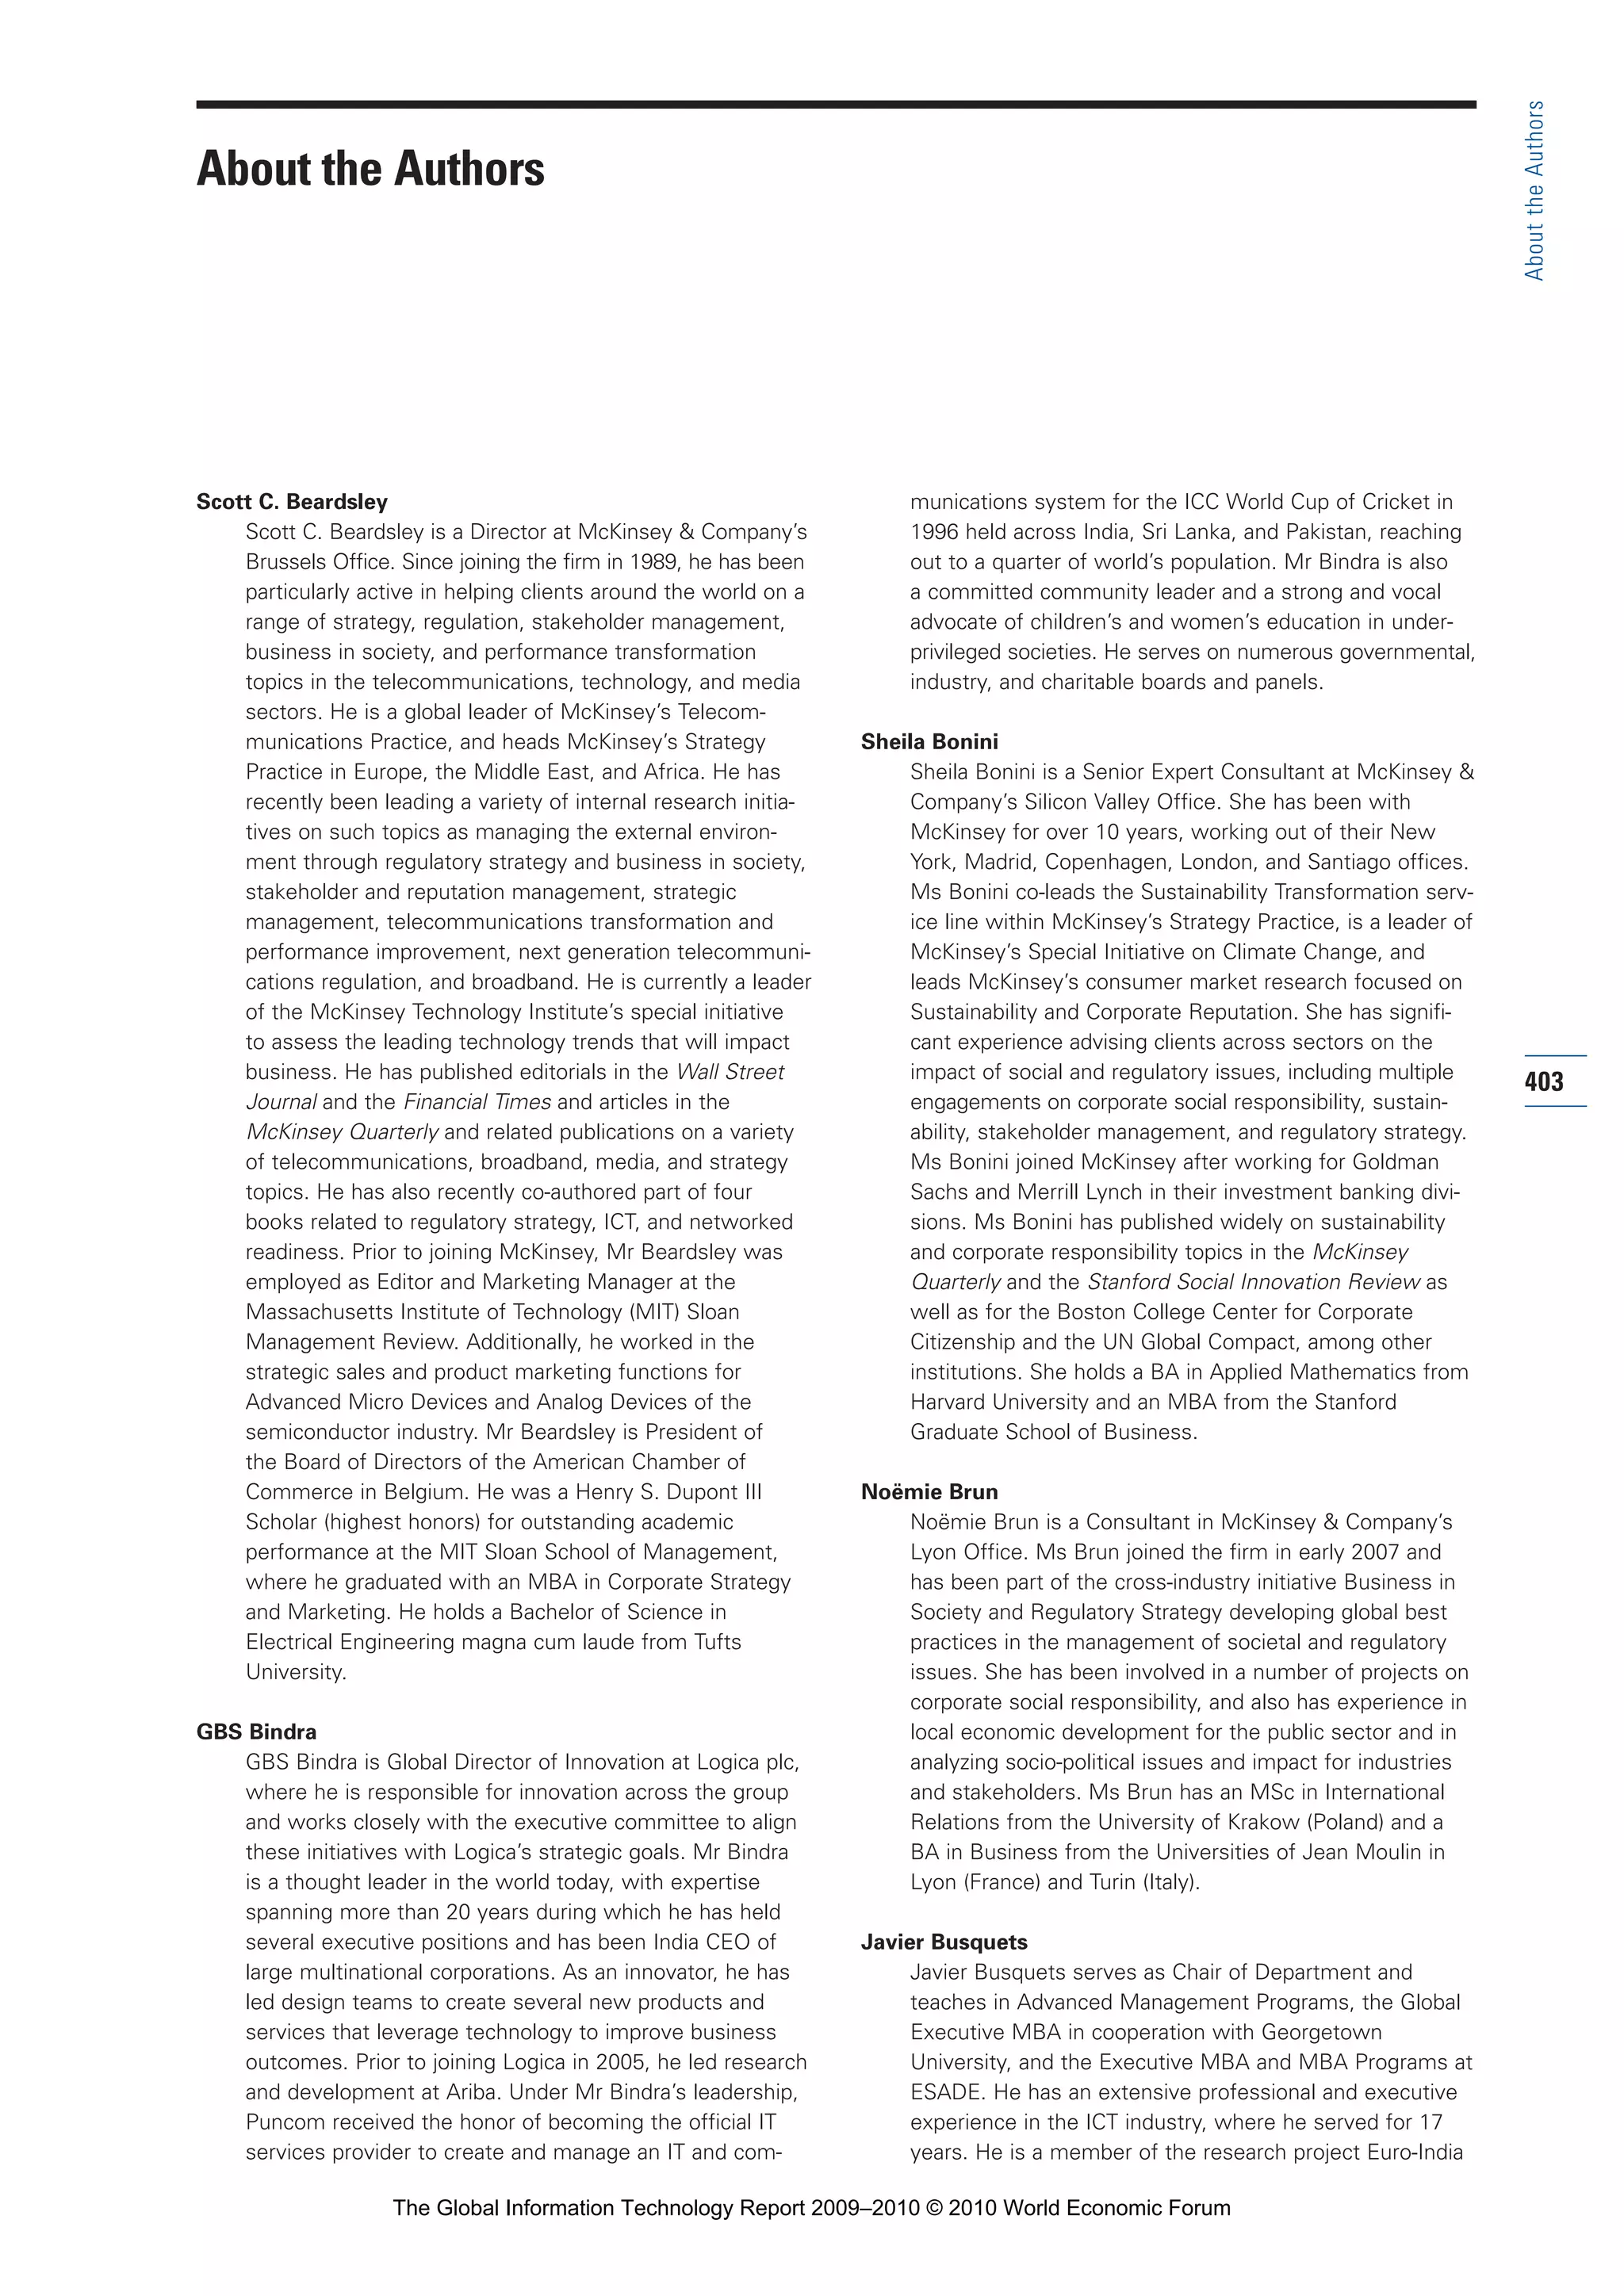
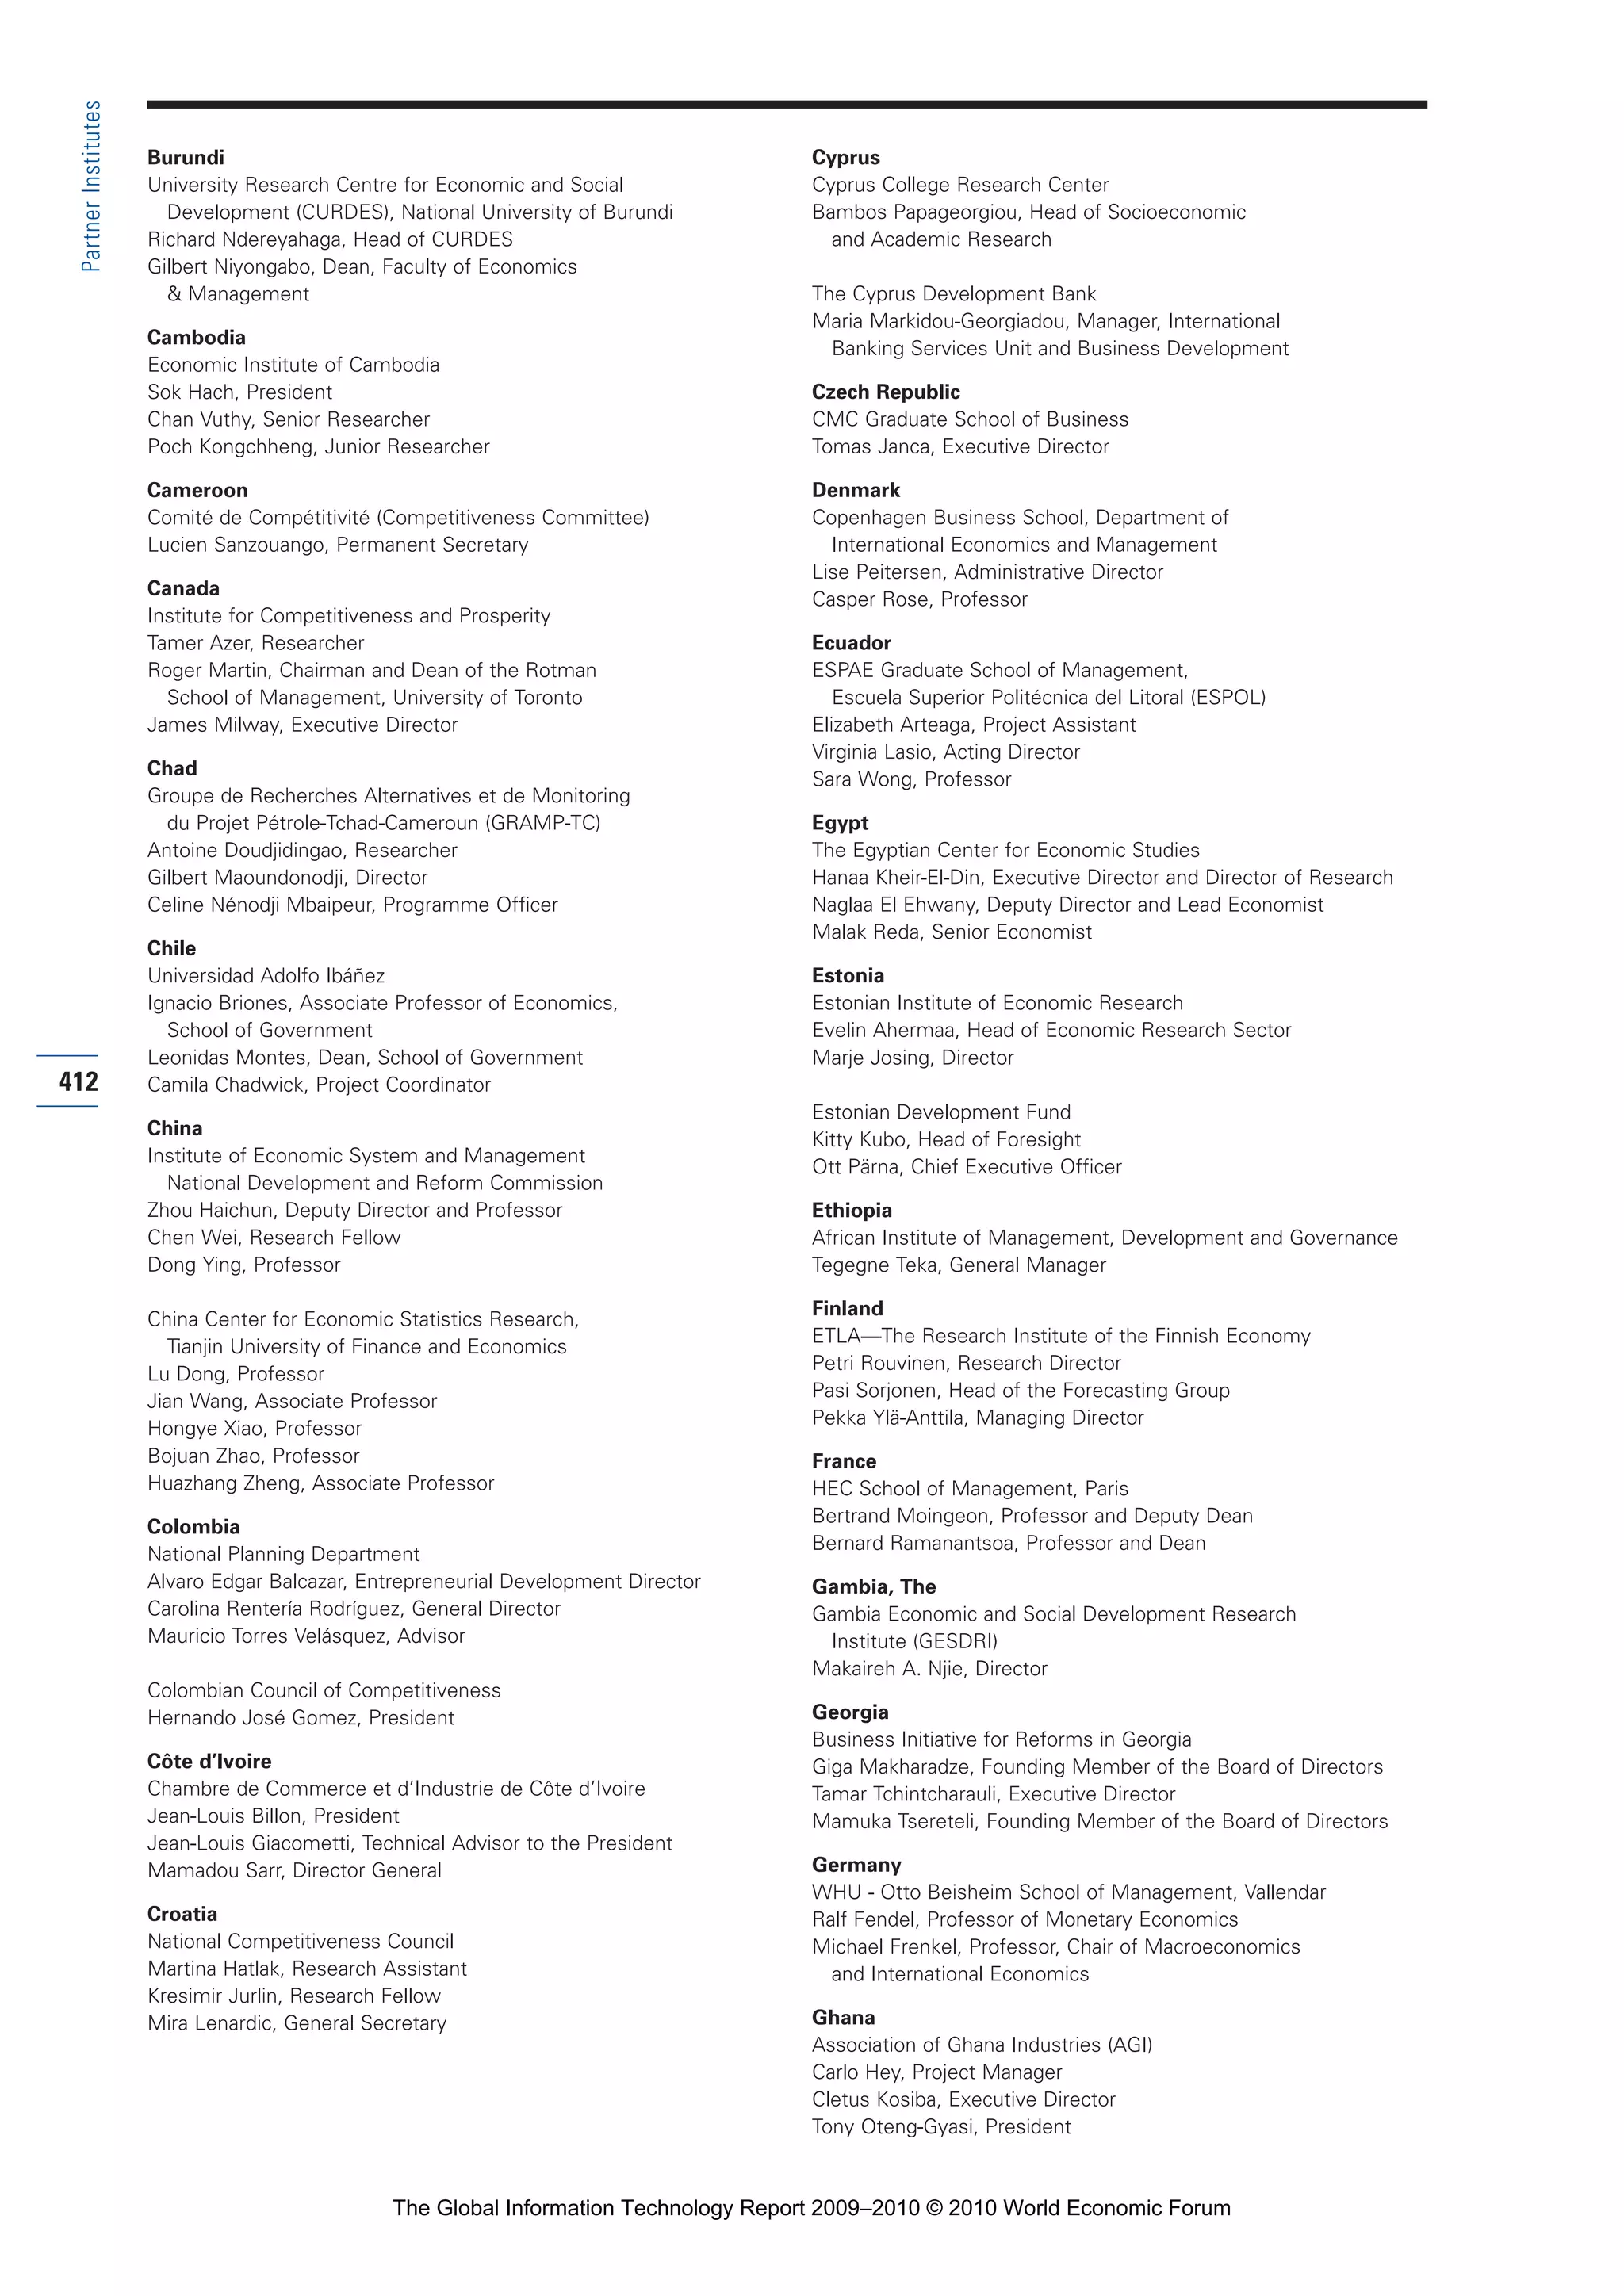
An activity-based approach to carbon management
would show the flow of emissions from assets to a given
department and then further allocated to the different
activities of that department (Figure 6).These assign-
ments are based on a variety of drivers, such as square
footage, airline miles, delivery service efficiency, and so
on. Using this approach, any number of possibilities can
be modeled according to the practical needs of the
organization.
The point is to model to the level of detail required
for management decisions and use the most practical
drivers that represent actual work (and encourage certain
performance), balanced with the level of effort required
to collect the information. If department managers need
to understand their role in the organization’s overall car-
bon reduction goals, then a perfectly exact number is not
necessary.They just need to see their proportion relative
to their peers and how what they do affects the overall
footprint. It is not enough to have just a consumption
figure. Every kilowatt hour of electricity or carload of
coal or gallon of fuel is associated with a business unit
or product line that is unique to the asset using the
energy. One has to understand the broader business
context to be able to look at process optimization and
improvements.
In short, modeling, not calculating, becomes there-
fore the new paradigm for decision making—something
spreadsheets and similar tools have a difficult time
doing.As Bras and Emblemsvåg explain in their book,
Activity-Based Cost and Environmental Management, “. . .
from an ABC [activity-based costing] method’s point of
view, [other natural resources are] simply ‘just another
currency,’ and the principles remain unchanged.”13
In the simplest terms, by replacing the “currency”
of cost with other resources, we can gain the same kinds
of insights about emissions, water, waste, or energy that
have proven so invaluable in the cost-accounting world.
Combine those resources with cost, and as one begins
to model change, one will also see the financial impact
of one’s decisions, making it easier to prioritize and cost
justify recommendations.
89
1.7:TheEvolvingScienceofManagingforSustainability
Figure 6: Example of a model of greenhouse gas values: Carbon footprint modeling methodology
∞
Facility
Scope
Geography
Activities that drive or otherwise
consume emissions
Activity module
∞
Equipment
Activity
Organization
Products and services delivered
to customers
Cost object module
∞
Customer
Channel
Product
Raw sources of
greenhouse gas and
CO2 equivalents
Contains inventory
and rates
Sources of CO2
• Electricity
• Jet fuel
• Natural gas
• Bio-fuels
• Refrigerants
Calculated CO2 of raw
materials from other
upstream suppliers
External
units module
Time
Scenario
Note: In this example, greenhouse gas values are derived from electricity consumption figures, then assigned to buildings/equipment and modeled just as in a
traditional ABM model.
Part 1.r2 3/2/10 4:40 AM Page 89
The Global Information Technology Report 2009–2010 © 2010 World Economic Forum](https://image.slidesharecdn.com/cusersdesktop2010gitr2009-2010fullreportfinal-100402152331-phpapp01/75/The-Global-Information-Technology-Report-2009-2010-109-2048.jpg)


![CHAPTER 1.9
The Economic Consequences
of the Diffusion of Cloud
Computing
FEDERICO ETRO, University of Milano-Bicocca and Intertic
Cloud computing is an emerging general purpose tech-
nology (GPT) that could provide a fundamental contri-
bution to efficiency in the private and public sectors,
as well as promote growth, competition, and business
creation. It is an Internet-based technology through
which information is stored in servers and provided as
an on-demand service to clients.The impact of cloud
computing on both households and companies will be
substantial. On one side, consumers will be able to
access all of their documents and data from any device
(the home or work personal computer [PC], the
mobile phone, or an Internet point, among others) as
they already can for email services or social networks.
On the other side, firms will be able to rent computing
power (both hardware and software in their latest ver-
sions) and storage from a service provider and pay on
demand, as they already do for other inputs such as
energy and electricity.1
The former application will
affect our lifestyles, but the latter will have a profound
impact on the cost structure of all the industries using
hardware and software,2
and therefore it will have an
indirect but crucial impact on business creation and on
the macroeconomic performance of countries.
Cloud computing can exert a number of effects
on the economy. For instance, it can enable huge cost
savings and more efficiency in large areas of the public
sector, including hospitals and healthcare (especially for
providing information and technology to remote or
poorer locations), education (especially for e-learning),
and the activities of government agencies that experi-
ence periodic peaks in usage. Moreover, substantial posi-
tive externalities are expected because of energy savings:
the improvement of energy efficiency may contribute to
the reduction of total carbon emissions in a substantial
way—information and communication technologies
(ICT) is responsible for 2 percent of carbon emissions
in Europe, of which 1.75 percent is due to the use of
ICT products and services, and 0.25 percent to their
production.The introduction of cloud computing can
provide cost savings in the private sector as well: it can
create multilateral network effects among businesses
and increase productivity within businesses, and it can
promote entry and innovation in all the sectors where
ICT costs are relevant and are drastically reduced by
the adoption of cloud computing.This last effect can
be quite large in terms of consequences for the aggre-
gate economy, and is the focus of the evaluation of the
economic impact of cloud computing on the economy
conducted in this chapter.
In a recent study, we estimated the economic
impact of the diffusion of cloud computing in Europe
through incentives to new business creation.3
Starting
from conservative assumptions about the cost-reduction
process associated with the spread of cloud computing
over five years, we obtained results showing that the
diffusion of cloud computing could provide a positive
and substantial contribution to the annual growth rate
107
1.9:TheEconomicConsequencesoftheDiffusionofCloudComputing
Part 1.r2 3/2/10 4:40 AM Page 107
The Global Information Technology Report 2009–2010 © 2010 World Economic Forum](https://image.slidesharecdn.com/cusersdesktop2010gitr2009-2010fullreportfinal-100402152331-phpapp01/75/The-Global-Information-Technology-Report-2009-2010-127-2048.jpg)


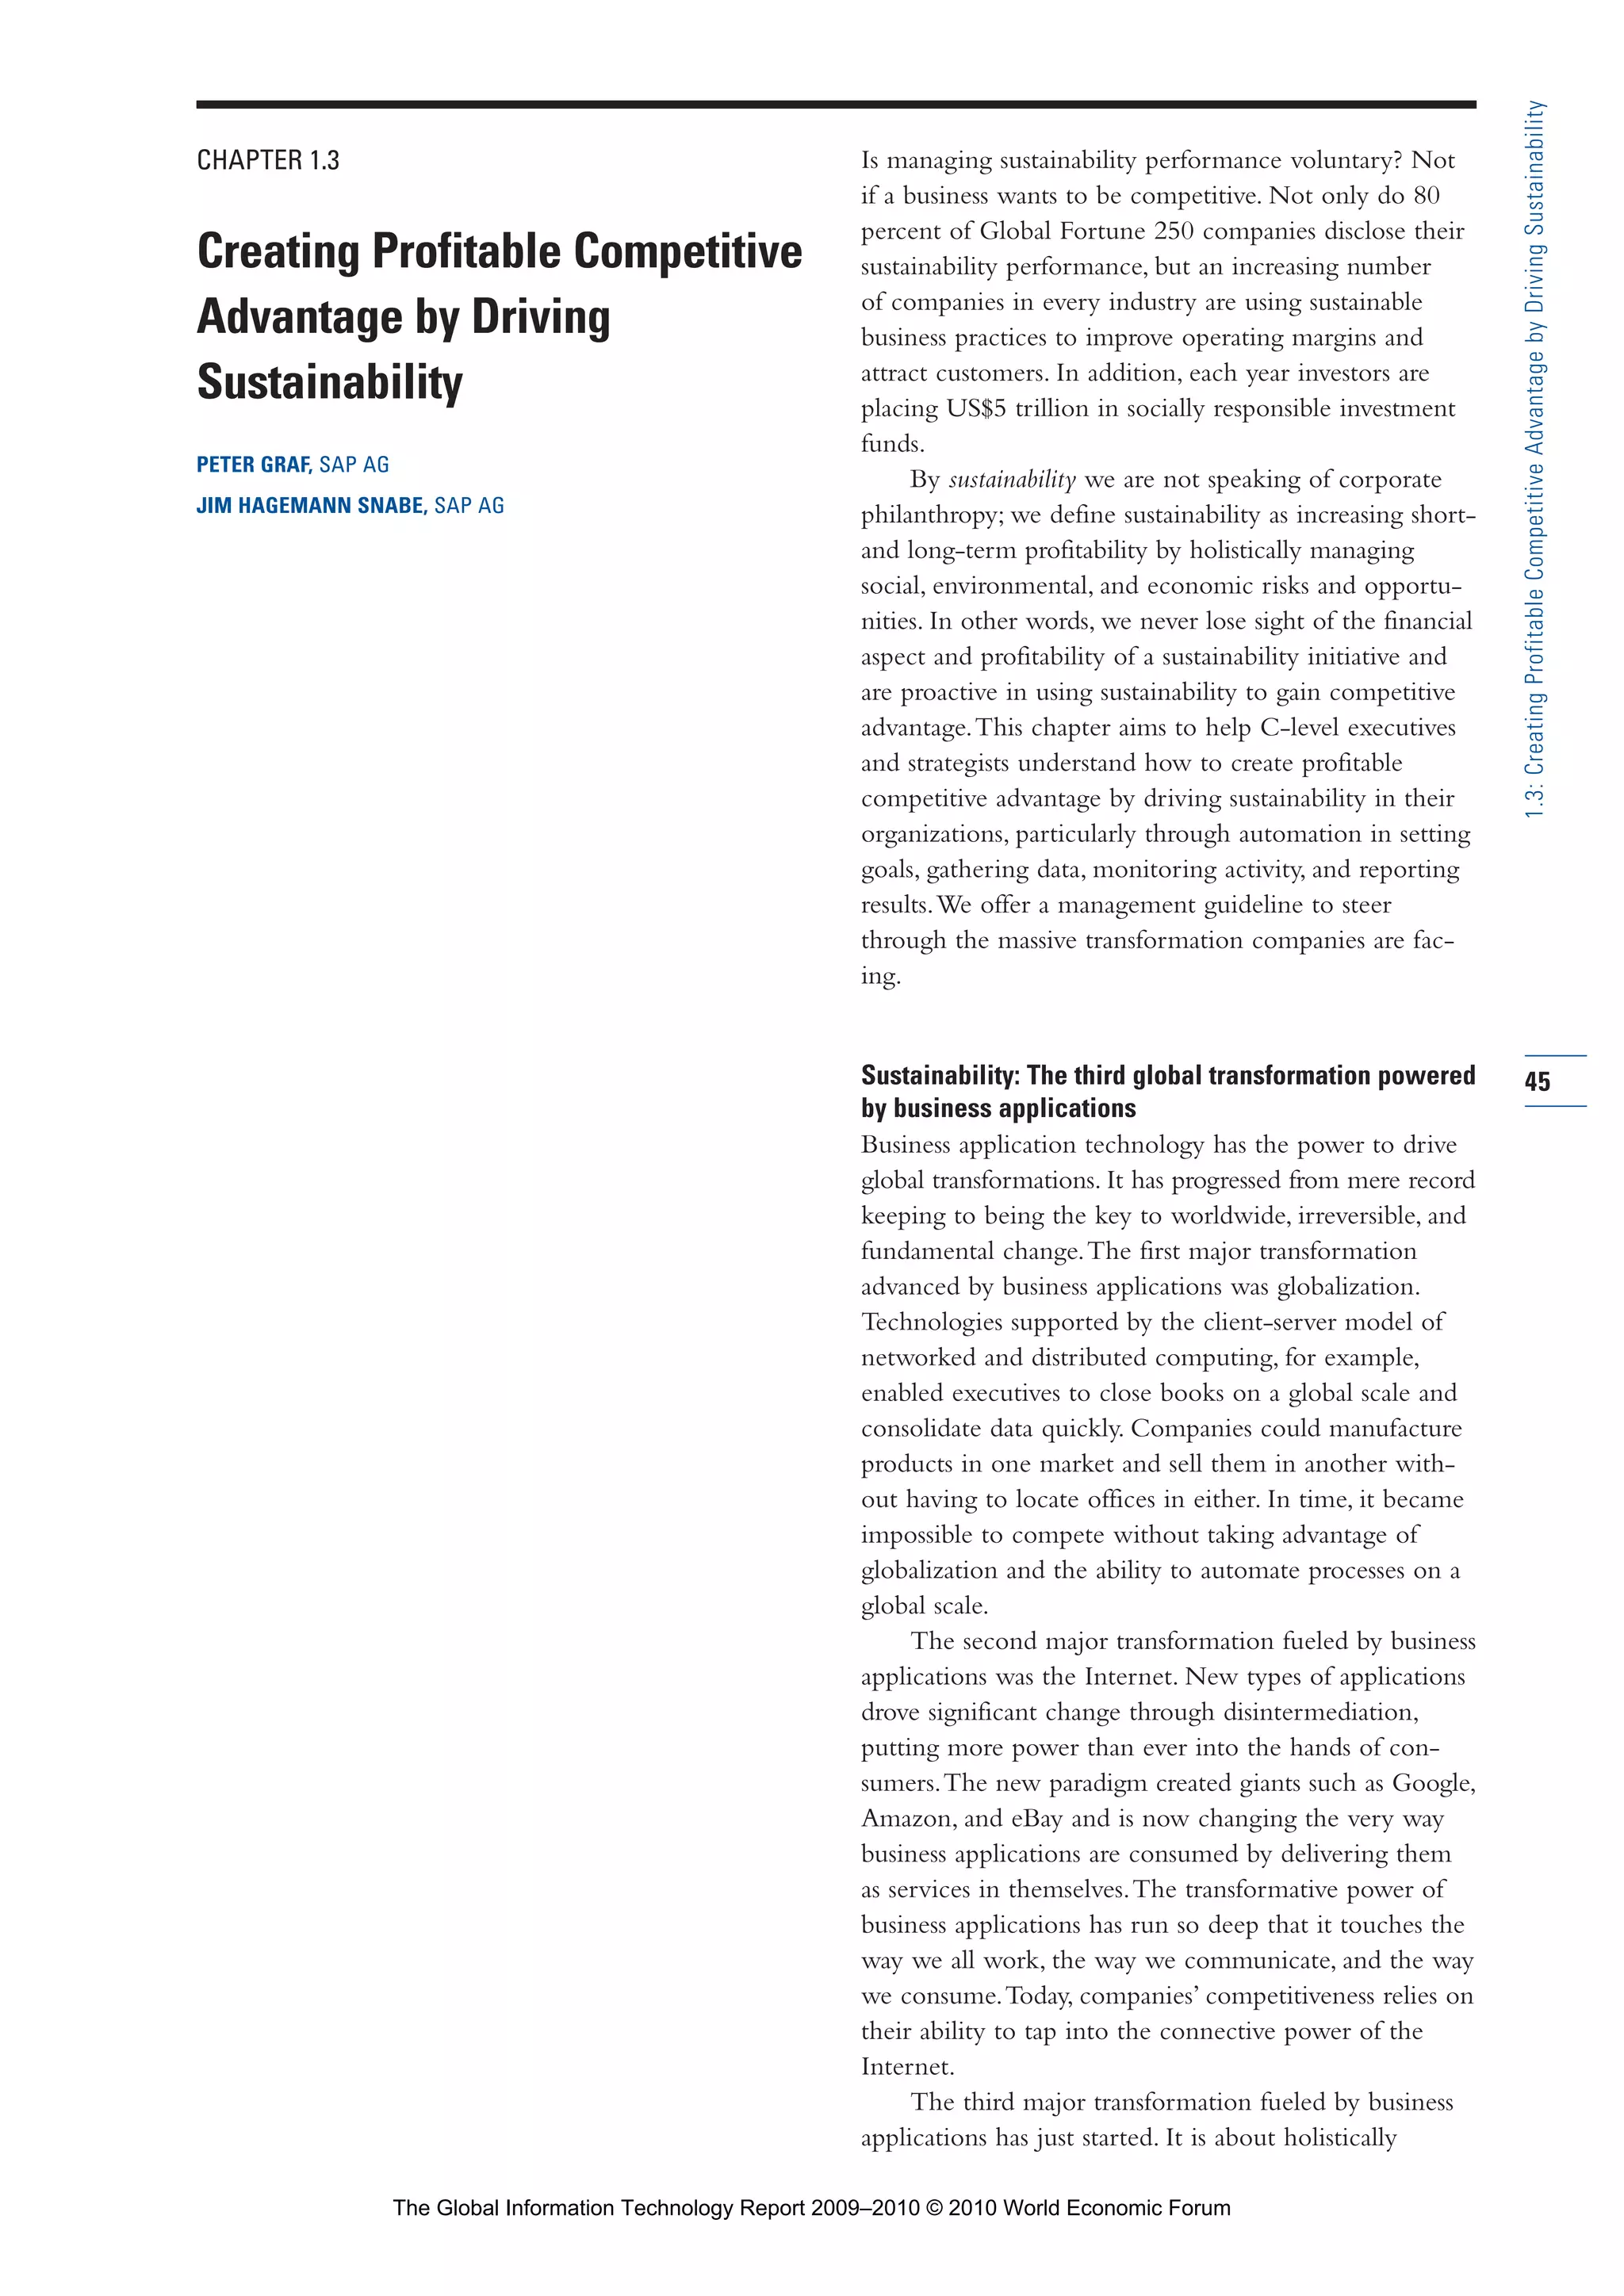
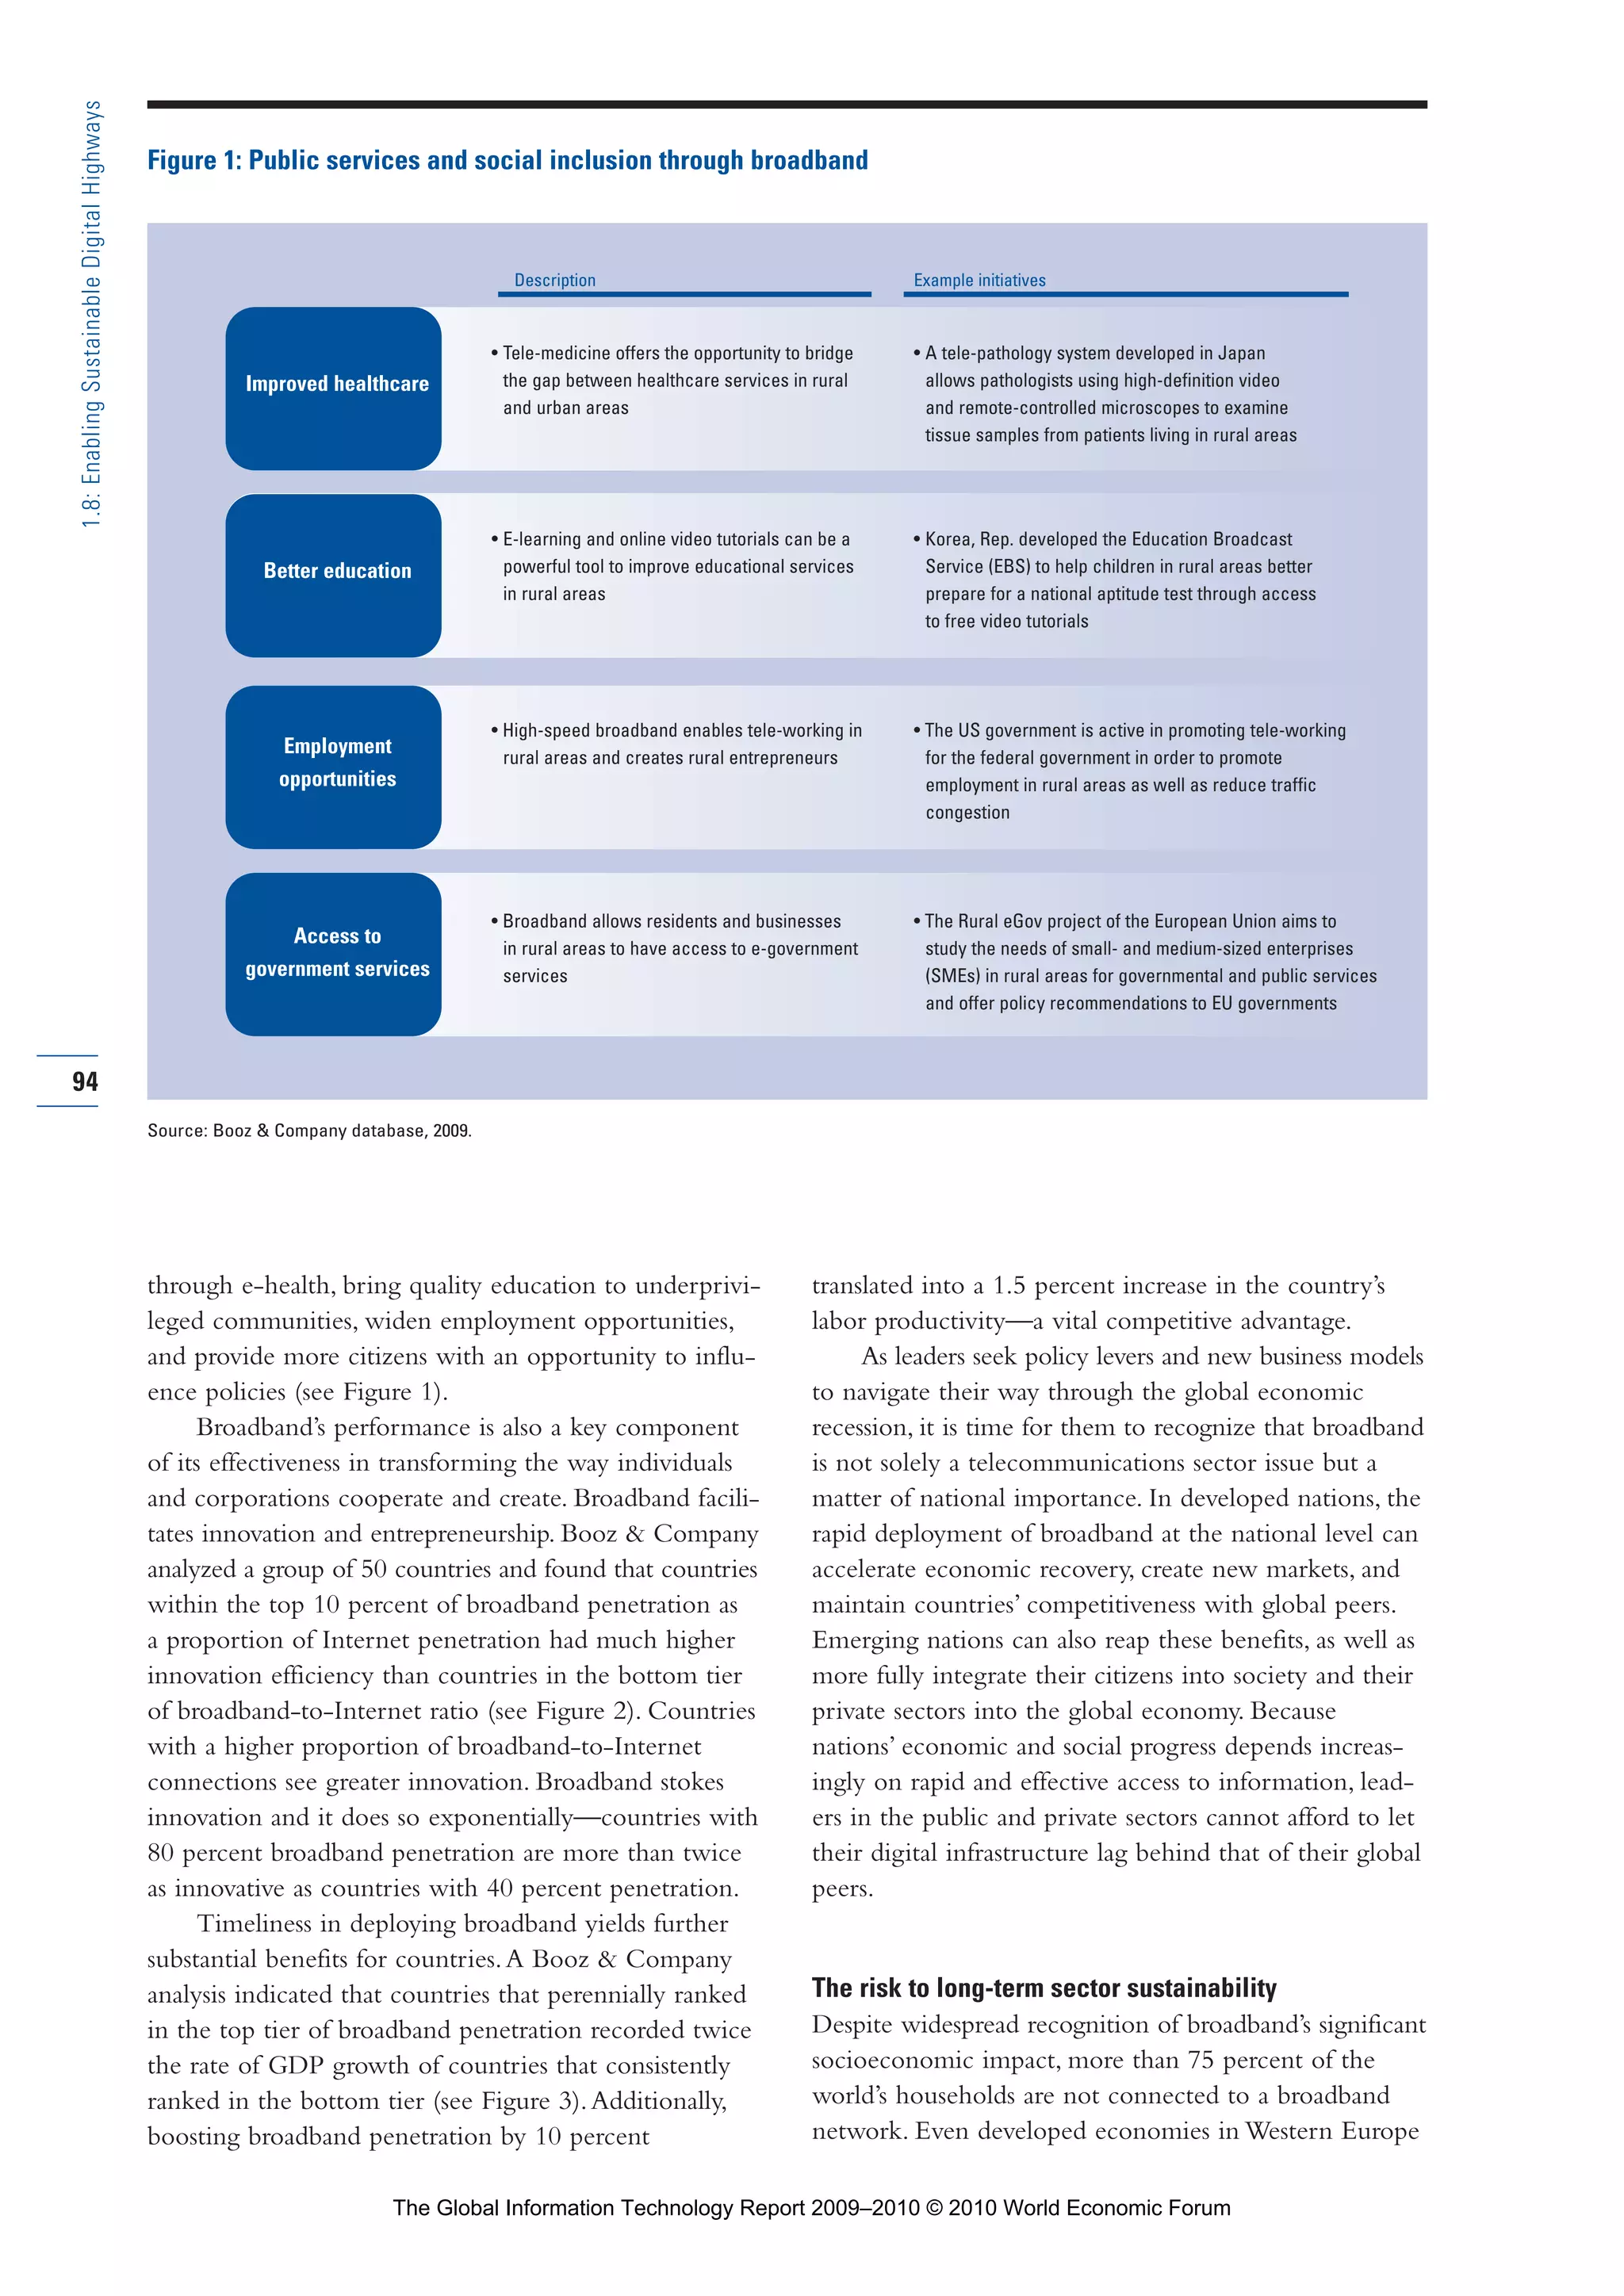
This document is the introduction to the Global Information Technology Report 2009-2010, which examines the role of information and communication technologies (ICT) in fostering sustainability. It is edited by Soumitra Dutta of INSEAD and Irene Mia of the World Economic Forum. The report features articles that discuss how ICT can support sustainable development and competitiveness. It also includes the Networked Readiness Index rankings, country case studies on ICT strategies, and data on ICT adoption and usage. The introduction emphasizes the important role ICT will play in enabling renewed economic growth and promoting environmental and social sustainability.


