Download to read offline


![As the global economy becomes increasingly
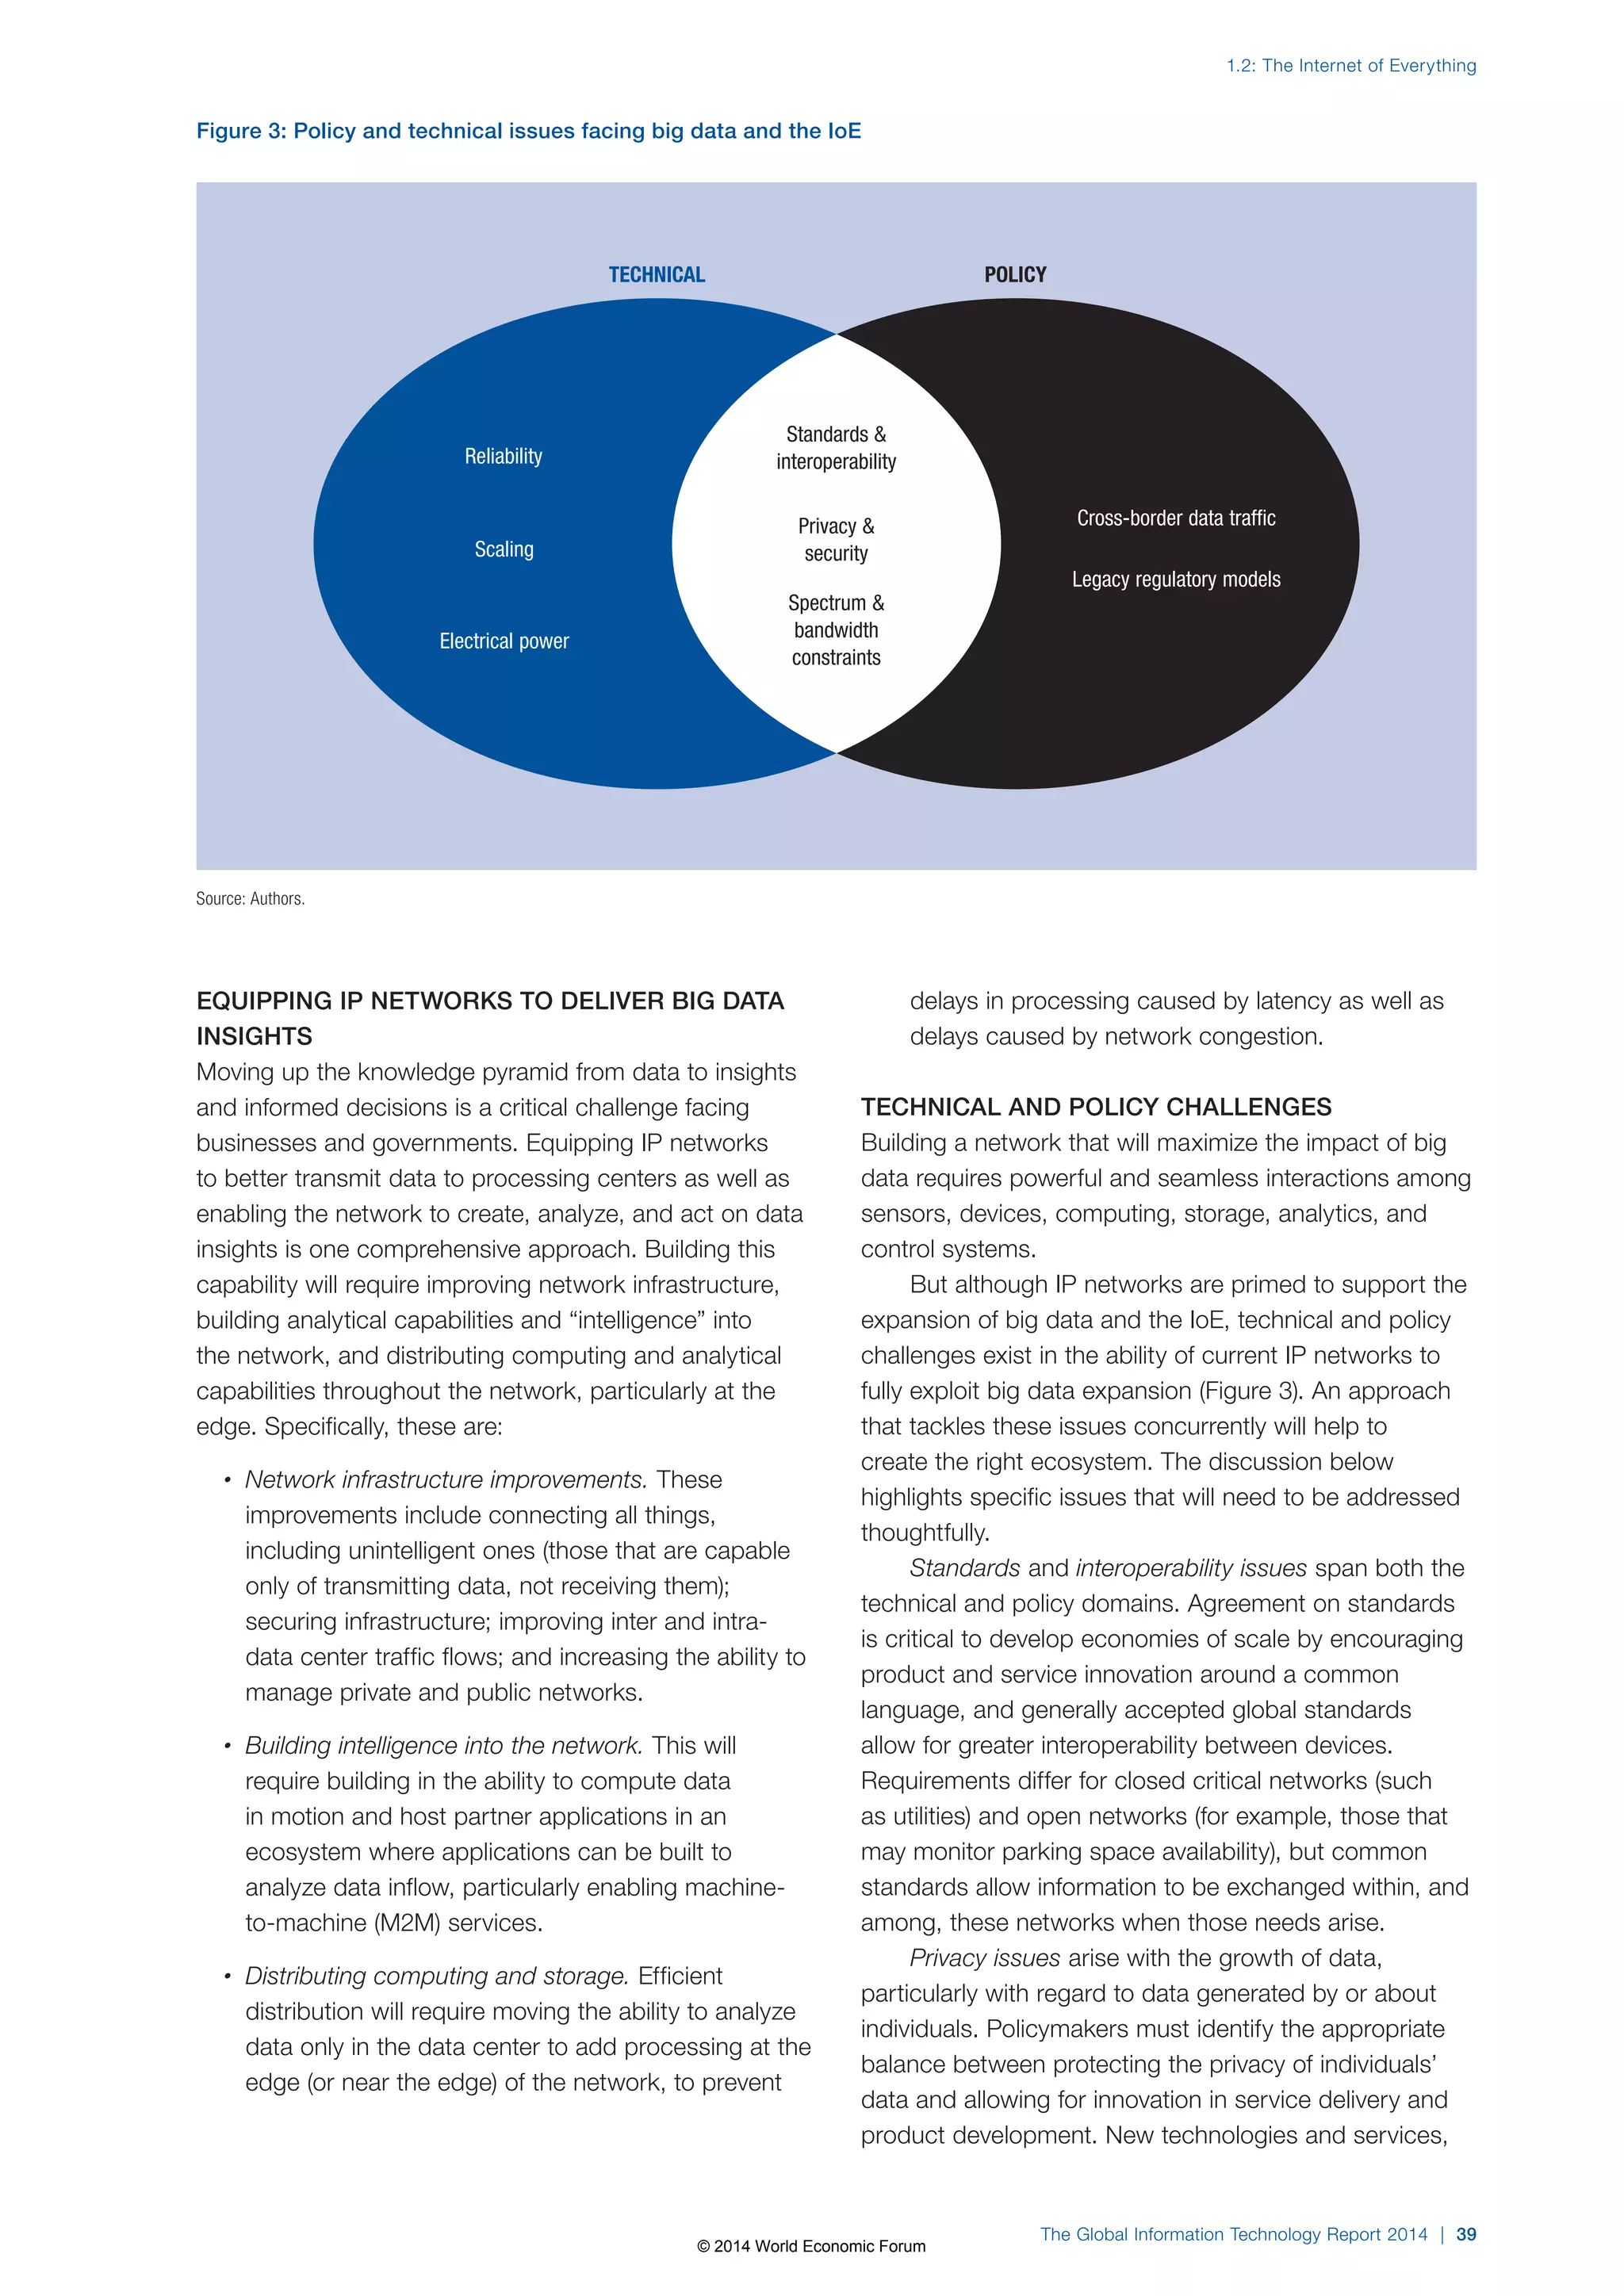
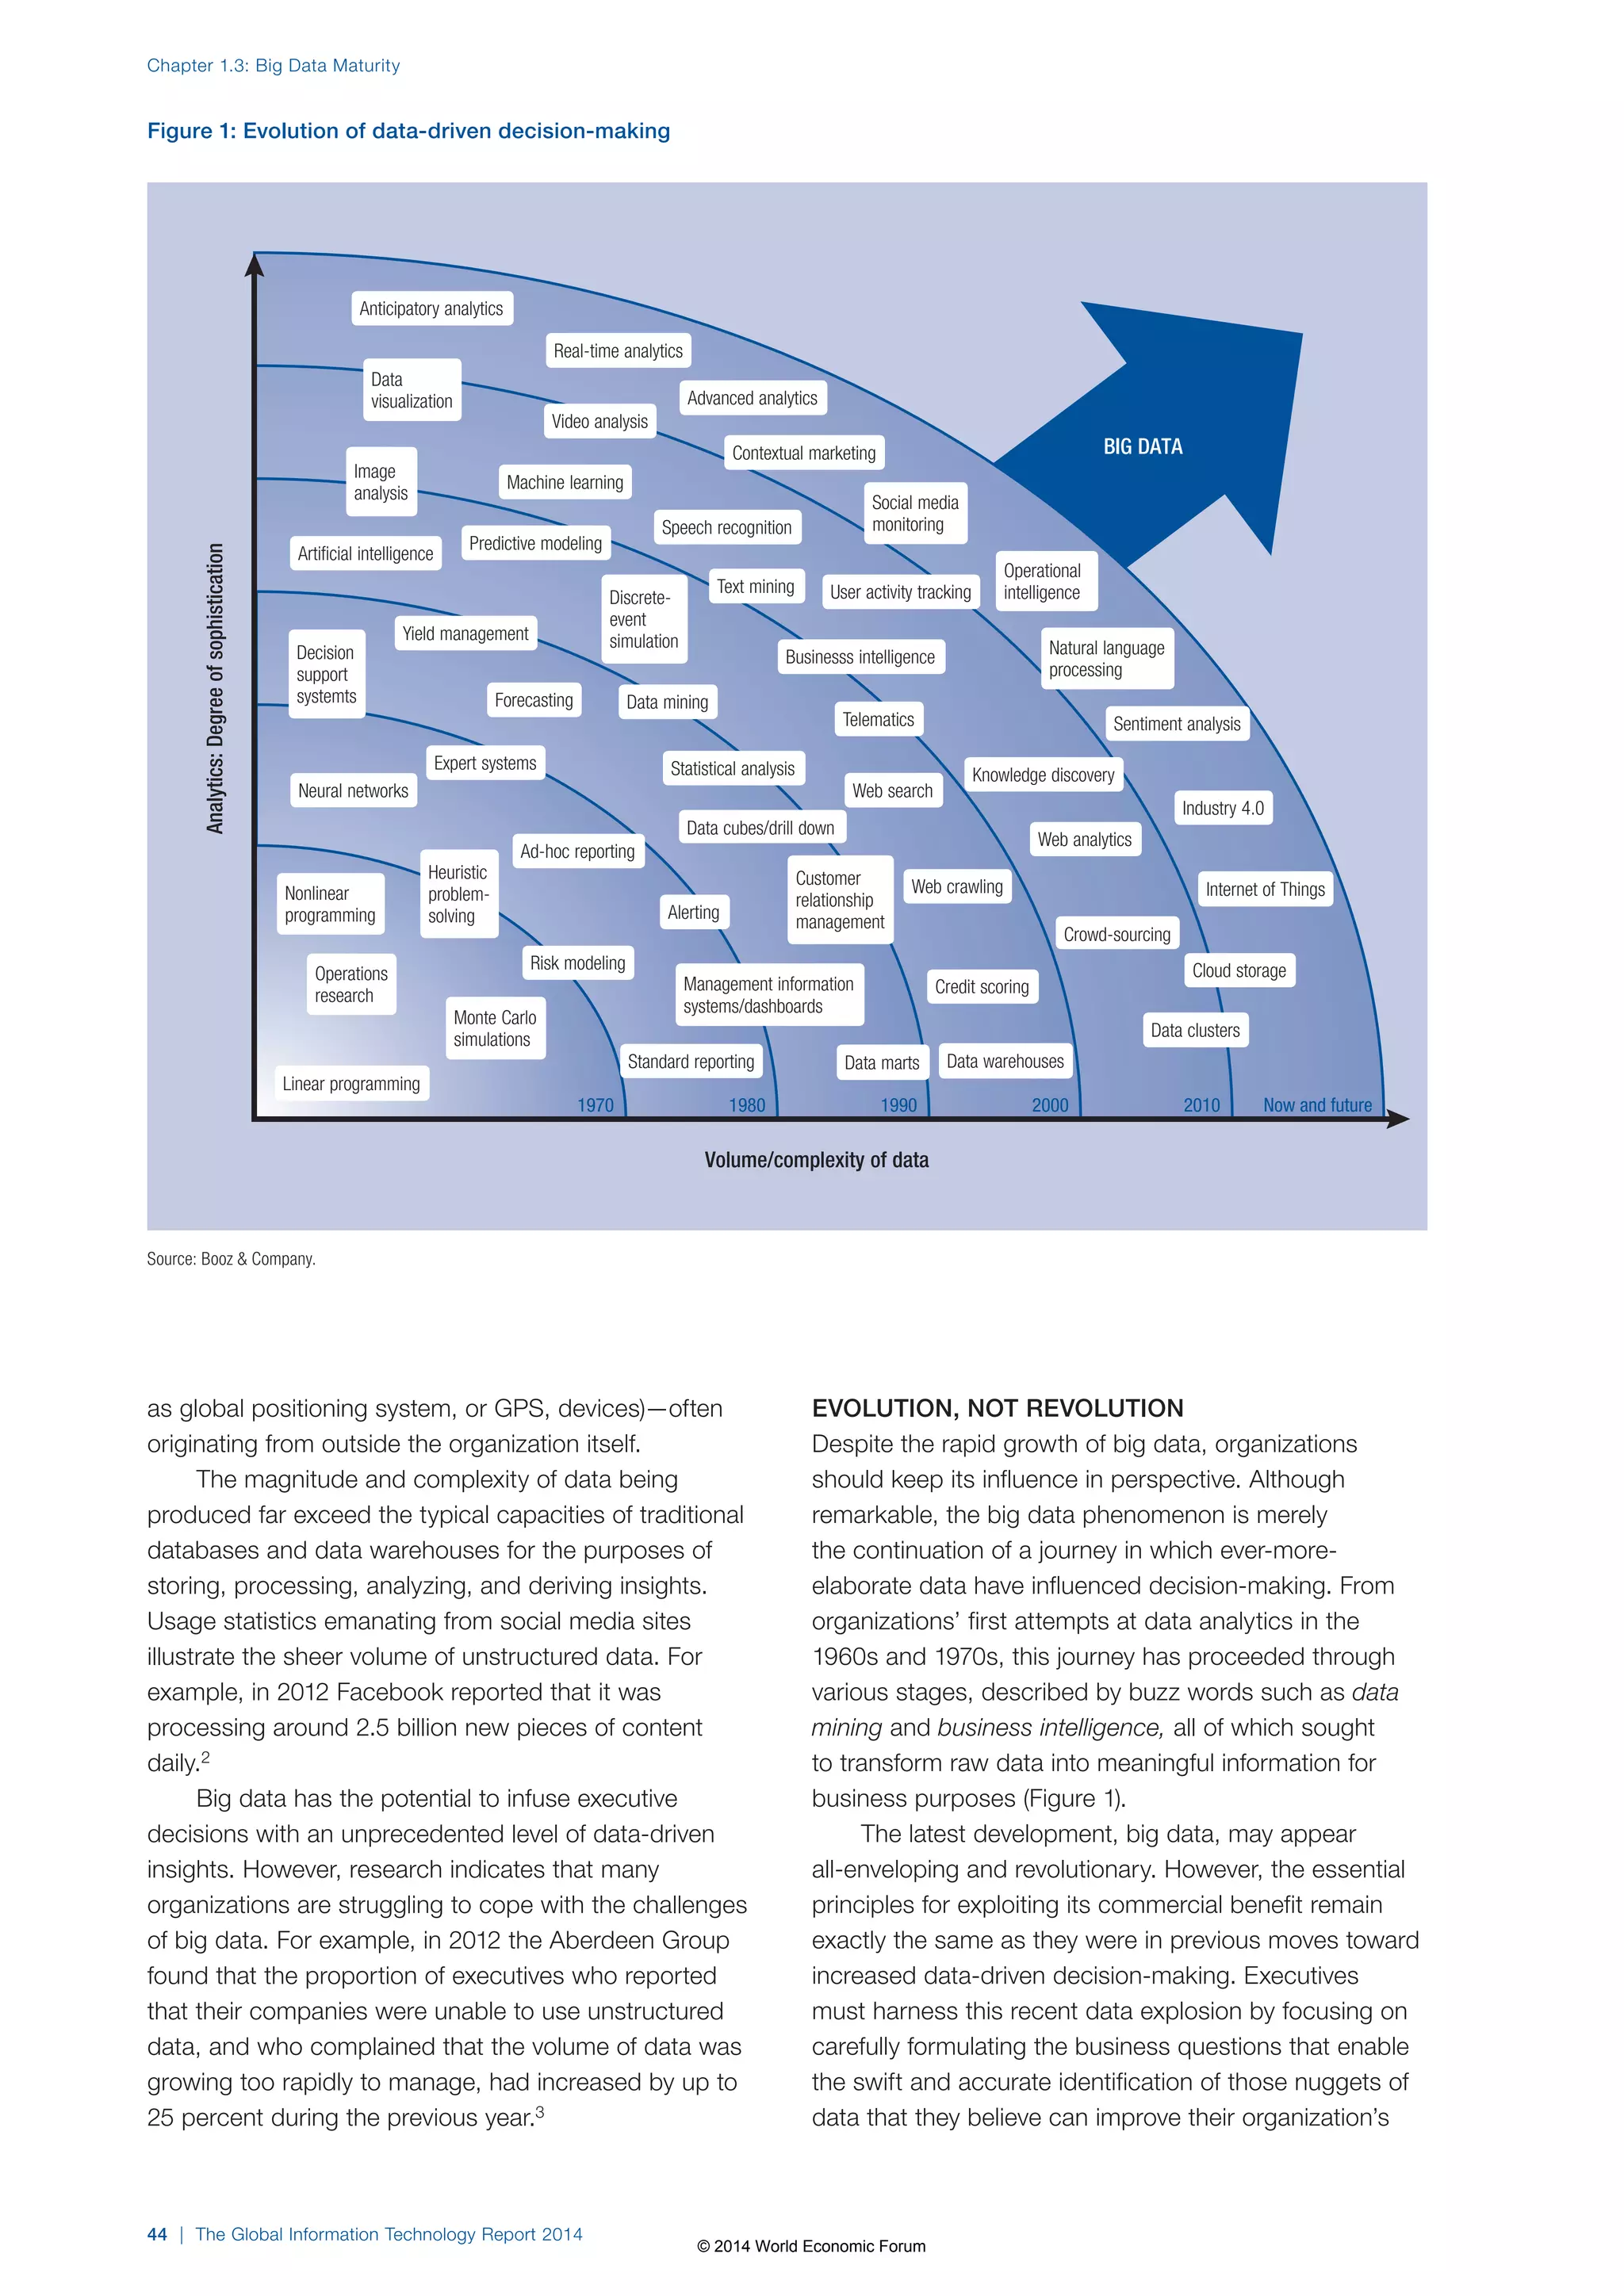
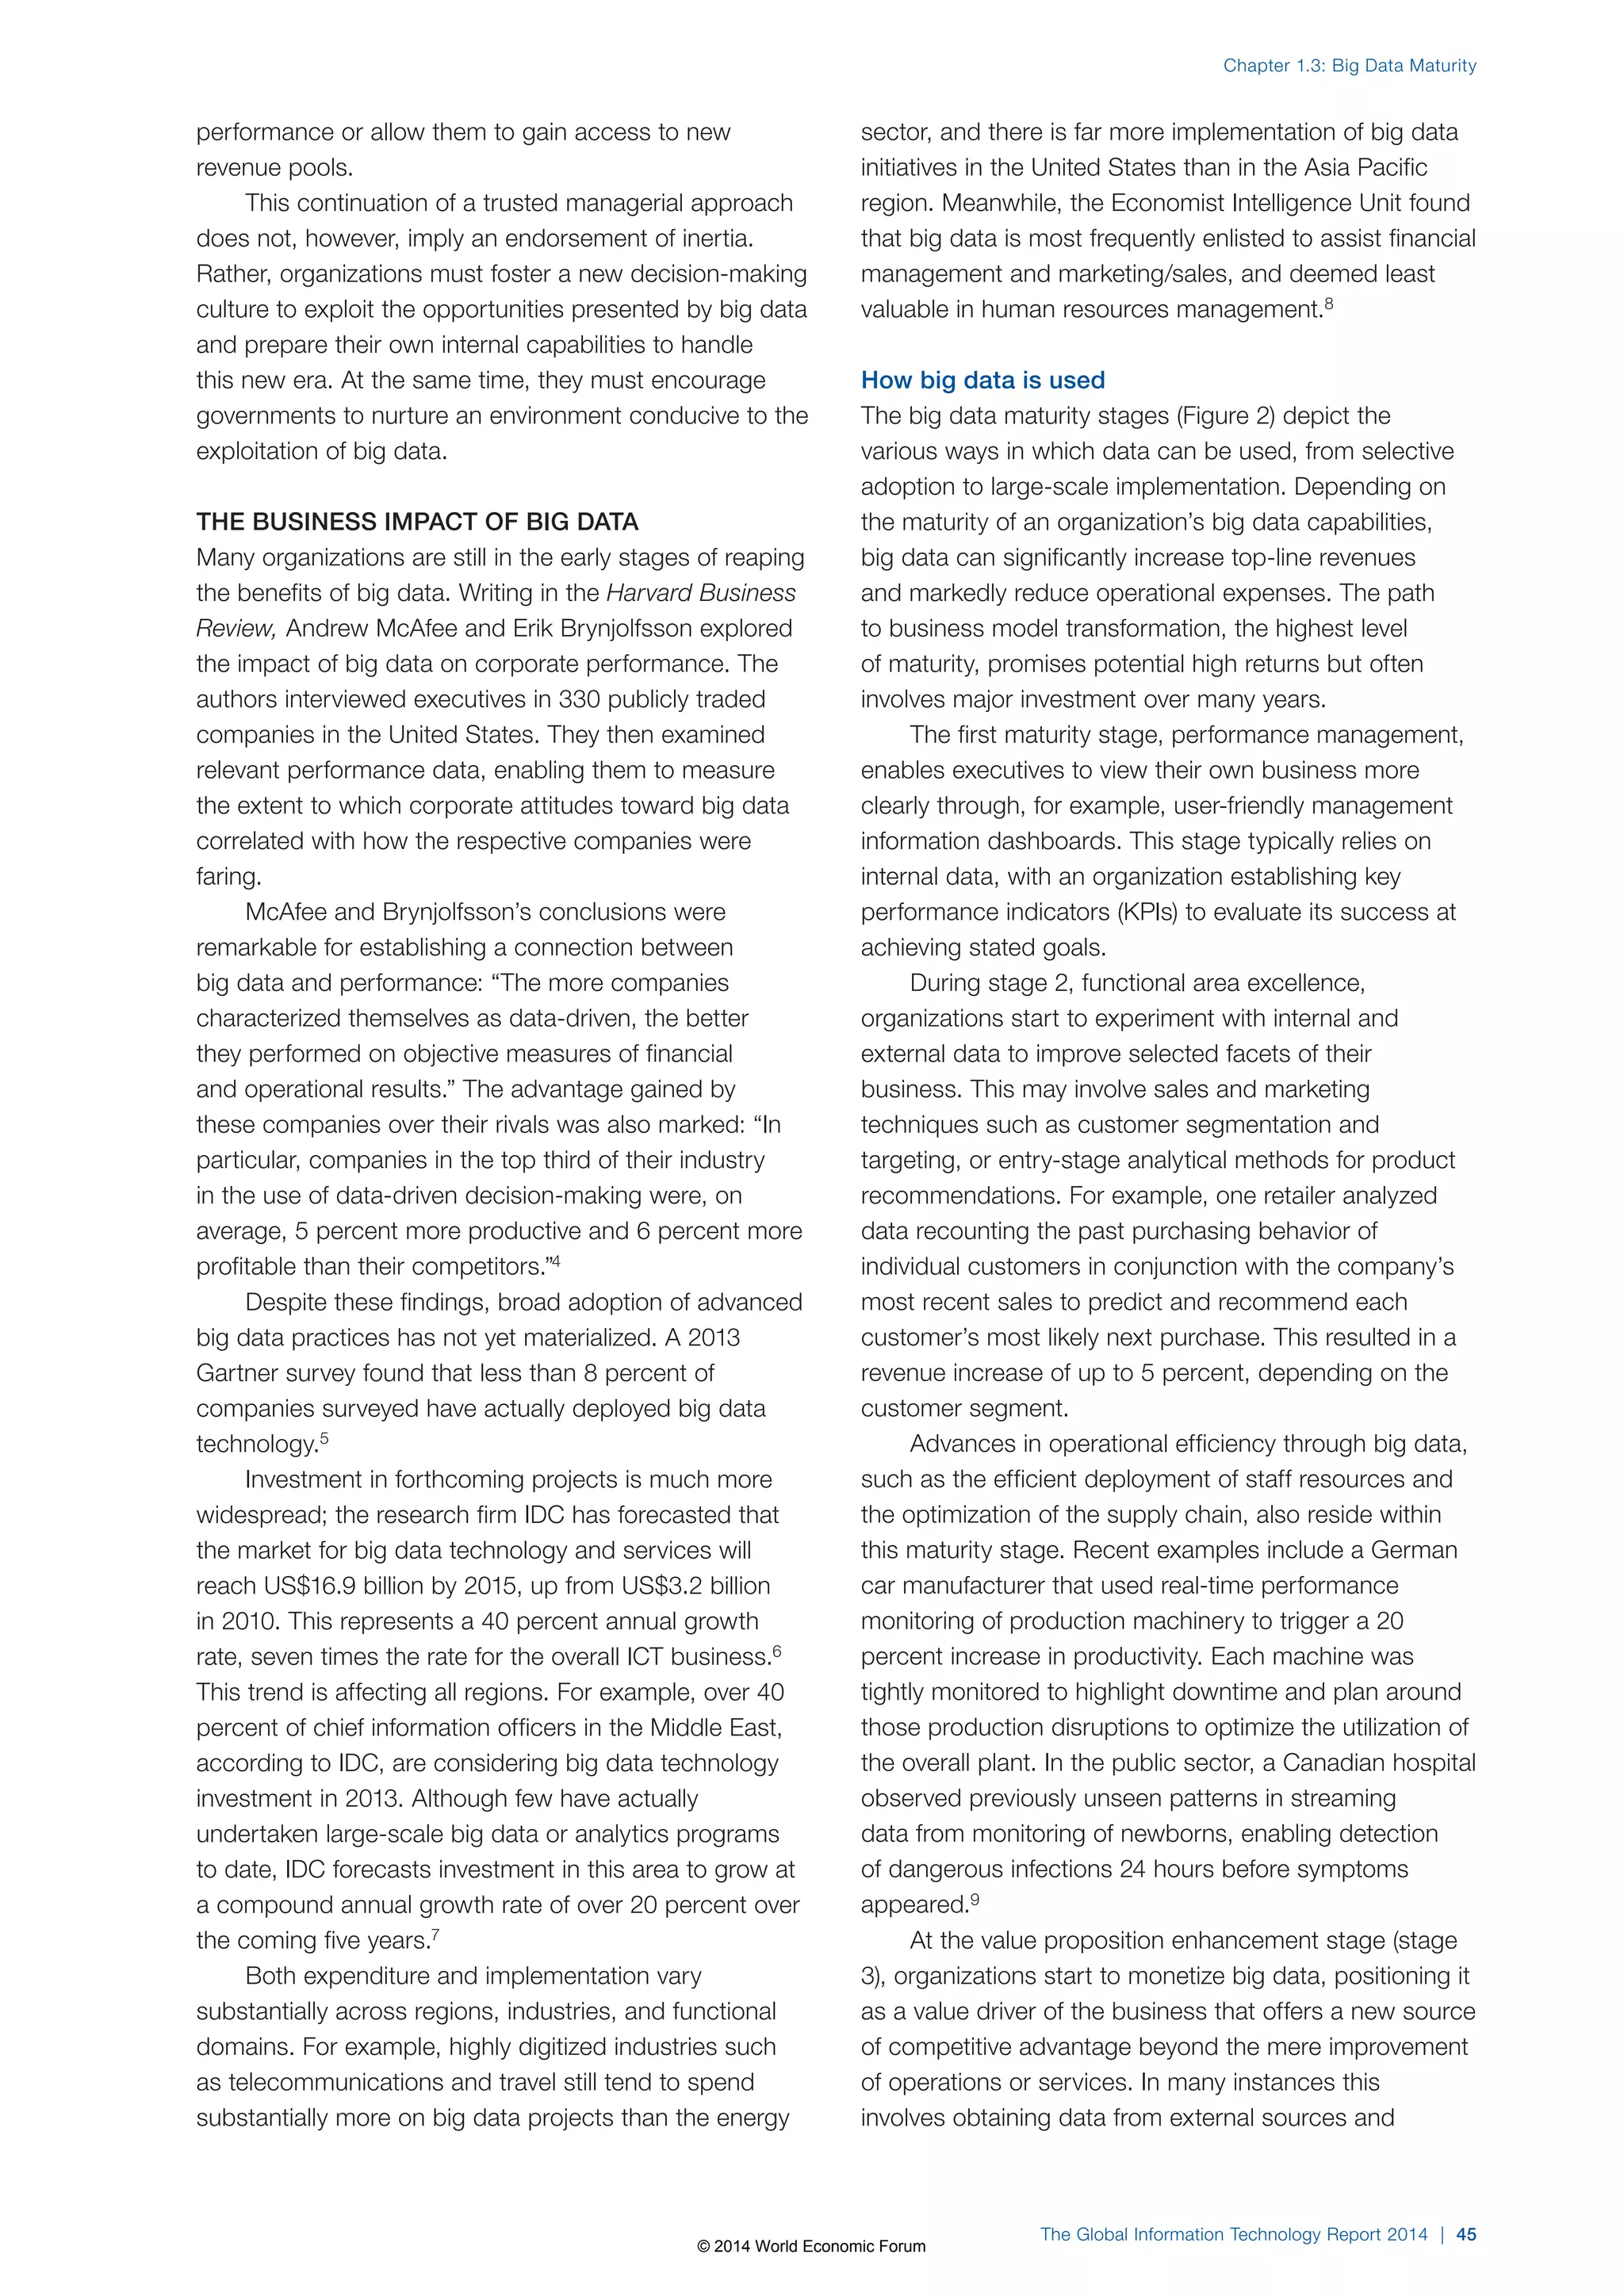
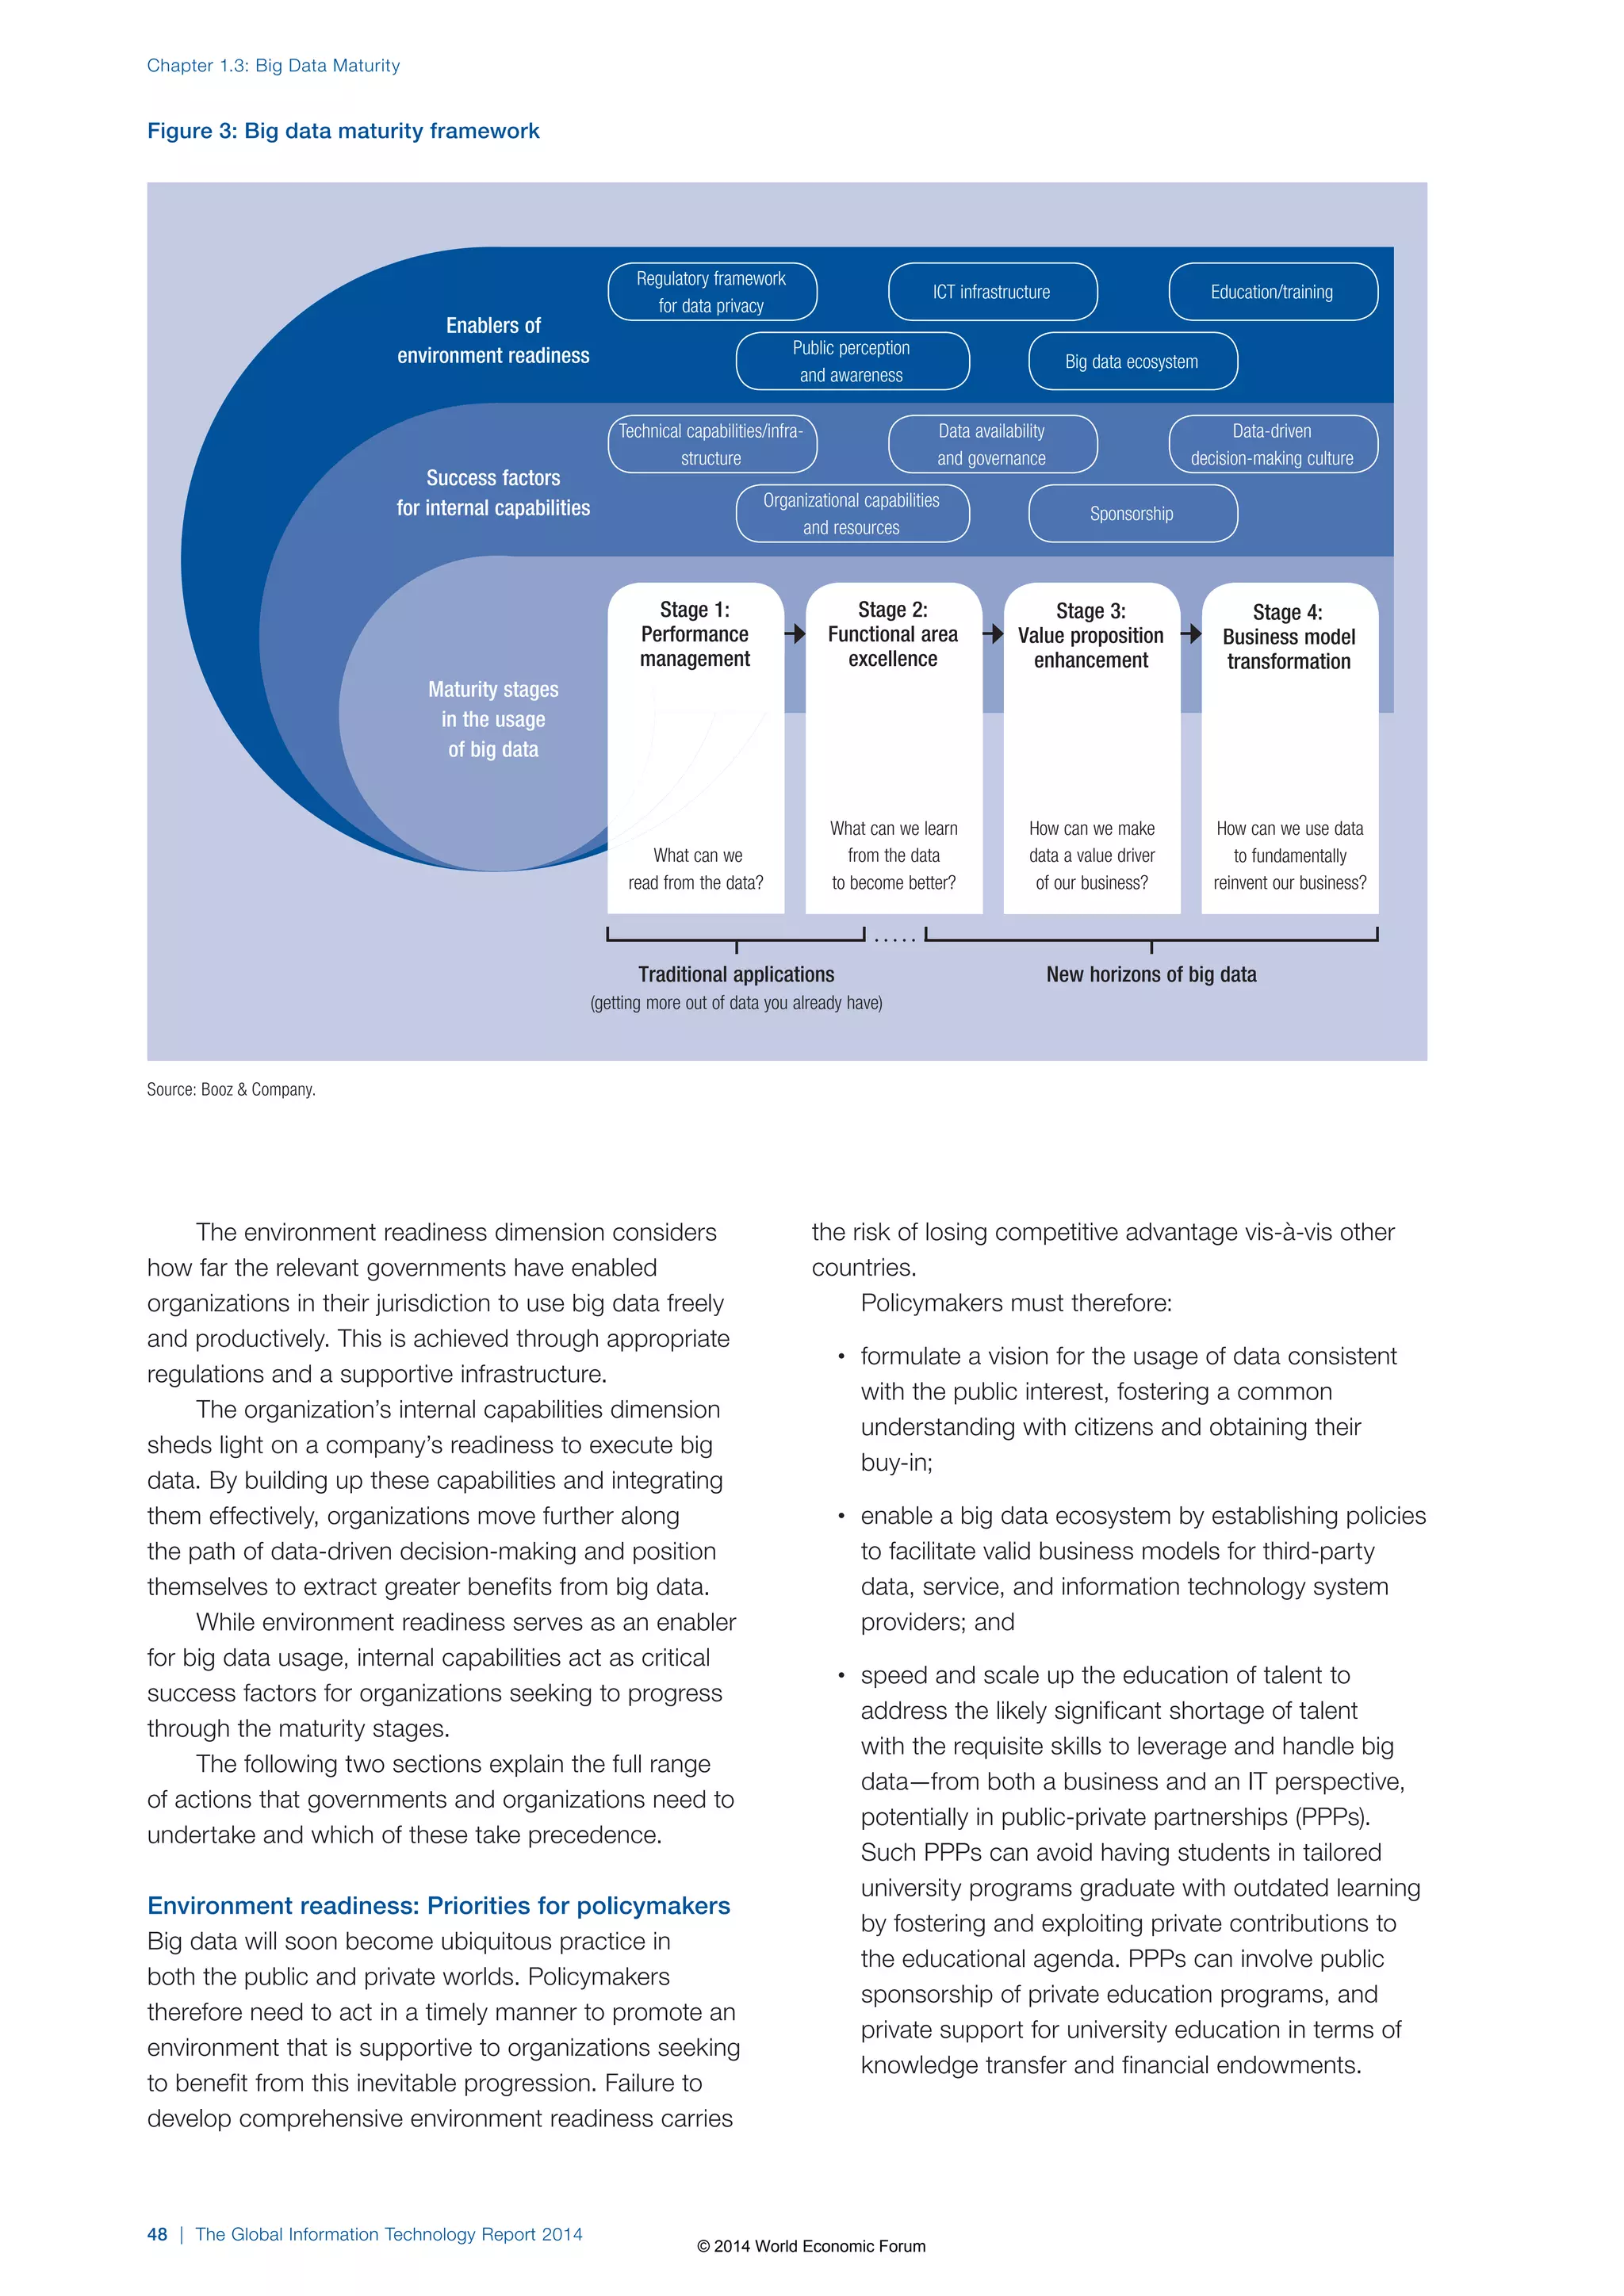
Chapter 1.6: Rebalancing Socioeconomic Asymmetry in a Data-Driven Economy
grounded in the exchange of data, the ways in which
those data are collected and analyzed will become
even more opaque to the consumer and the value
exchange even harder to discern; trust will decrease
correspondingly. An individual may have only a vague
idea of what data exist about him or her and what
is being done with these data. Some will have been
actively volunteered by the consumer; some will have
been obtained passively, with or without his or her
explicit knowledge; and yet more may have been inferred
by commingling a range of public and private, personal
and non-personal datasets in ways that might expose
new information or knowledge about each consumer’s
habits, lifestyle, health, or financial situation. Although
the individual may receive something in return for this
information, the real values of both the data provided
and the service returned (in other words, the underlying
exchange of value) may be almost impossible to
determine.
Today little agreement exists about how best to
value online data. The most comprehensive survey of
valuation methodologies was presented in a recent
OECD study (on which the authors of this chapter
consulted) that identified numerous ways in which
data might be valued in the market (refer to Box1).12
However, each of these methods has significant flaws,
and none addresses the potential social and economic
benefits of personal data. For example, corporate
revenues per record/user are problematic because
revenues contribute to economic growth only insofar
as they generate added value (or surplus). Revenue of
$4 per record/user with near-zero profitability is very
different from $4 per record/user with 40 percent net
profit. Similarly, the vast amount of personal data on
Facebook have a relatively low per-person value because
the company, while making significant profits from the
sheer scale of its data holdings, has yet to find the Holy
Grail of social-media data monetization. Amazon, by
contrast, collects far less personal information from
individuals, but its business model is predicated on
advanced purchase analytics. Thus, on a per-user level,
its inferred personal data (which are at present mostly
outside the user’s control) are more valuable than
Facebook’s volunteered personal data (which the user
has painstakingly assembled, and over which she or he
has at least nominal control).
Distinguishing personally beneficial uses of data
from socially beneficial uses is a further challenge
because each creates separate and significant value.
For example, the personal value of using an electronic
health record is improved treatment for the patient—and
this undoubtedly has direct monetary value in the form of
reduced costs, better outcomes, and so on. But socially
beneficial uses also create (or could create) value—
for example, by facilitating research into new drugs,
identifying new epidemiological trends, or improving
Box 1: Potential approaches for estimating the
value of personal data
The following methods for valuing personal data have been
identified, but each has important drawbacks. Possible
approaches include:
• determining the market capitalizations of firms with
business models predicated on personal data;
• ascertaining the revenues or net income per data
record;
• establishing the market prices at which personal data
are offered or sold;
• establishing the economic cost of a data breach;
• determining prices for personal data in illegal markets;
• reviewing economic experiments and surveys that
attempt to establish the price companies would need
to pay for individuals to give up some of their personal
information; and
• ascertaining how much individuals would be willing to
pay to protect their data.
Source: OECD 2013.
medical protocols. However, because the value created
does not involve explicit market transactions, attributing
this benefit directly to data involves some inspired
approximation. And even though one estimate puts the
savings in this case at up to US$300 billion,13 most of
the ways in which data are valued today would consider
such benefits an externality to be ignored.
For many people, however, the various ways in
which data might be valued are largely irrelevant today,
because they have already given away their digital crown
jewels for free. Individuals are passing massive amounts
of personal and other data to large corporations with
little or no thought to its potential monetary value—and
those corporations are making significant profits as a
result, because their cost of materials is essentially zero.
The concept of fair value exchange no longer exists, at
least not in any conventional sense. Facebook users, for
example, provide it with data that have the potential to
generate immense long-term value for the company; in
return they receive a “free” service, but the transaction
is wholly asymmetrical. As the computer scientist Jaron
Lanier has observed, “[T]he dominant principle of the
new economy, the information economy, has lately been
to conceal the value of information…. We’ve decided
not to pay most people for performing the new roles
that are valuable in relation to the latest technologies.
Ordinary people ‘share,’ while elite network presences
generate unprecedented fortunes.” And if an individual’s
information is not valued in economic terms, Lanier
adds, “a massive disenfranchisement will take place.”14
The Global Information Technology Report 2014 | 69
© 2014 World Economic Forum](https://image.slidesharecdn.com/wefglobalinformationtechnologyreport2014-140902215024-phpapp02/75/Wef-global-informationtechnology-report-2014-93-2048.jpg)


This document is the introduction to the 2014 Global Information Technology Report, which analyzes networked readiness and the rewards and risks of big data. It discusses how information and communication technologies are increasingly important for economic growth and competitiveness. This year's report covers 148 economies and includes chapters on harnessing the benefits of big data through networks, developing a big data maturity model, balancing the risks and rewards of data-driven policymaking, and other topics. It presents the latest Networked Readiness Index rankings and detailed country profiles and data tables.


