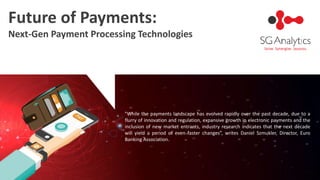
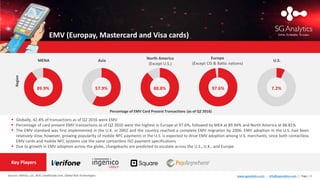
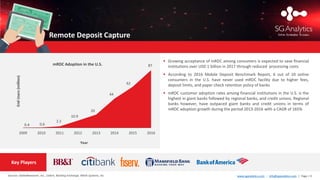
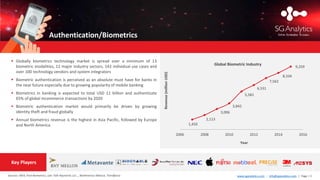
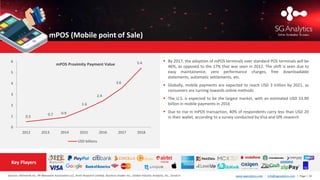
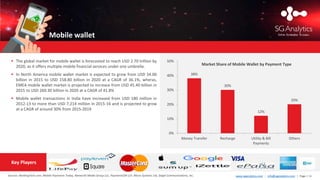
Future of Payments:
Next-Gen Payment Processing Technologies
"While the payments landscape has evolved rapidly over the past decade, due to a
flurry of innovation and regulation, expansive growth in electronic payments and the
inclusion of new market entrants, industry research indicates that the next decade
will yield a period of even faster changes”, writes Daniel Szmukler, Director, Euro
Banking Association.
www.sganalytics.com | info@sganalytics.com | Page | 2
In this presentation, SG Analytics highlights the 9
most important payment processing technologies!
www.sganalytics.com | info@sganalytics.com | Page | 3
 Globally, 42.4% of transactions as of Q2 2016 were EMV
 Percentage of card present EMV transactions as of Q2 2016 were the highest in Europe at 97.6%, followed by MEA at 89.94% and North America at 88.81%
 The EMV standard was first implemented in the U.K. in 2002 and the country reached a complete EMV migration by 2006. EMV adoption in the U.S. had been
relatively slow; however, growing popularity of mobile NFC payments in the U.S. is expected to drive EMV adoption among U.S. merchants, since both contactless
EMV cards and mobile NFC systems use the same contactless ISO payment specifications
 Due to growth in EMV adoption across the globe, chargebacks are predicted to escalate across the U.S., U.K., and Europe
EMV (Europay, Mastercard and Visa cards)
Key Players
Sources: EMVCo, LLC, NCR, CreditCards.com, Global Risk Technologies
89.9%
Region
MENA Asia
Europe
(Except CIS & Baltic nations)
57.9% 88.8% 97.6%
U.S.
7.2%
North America
(Except U.S.)
Percentage of EMV Card Present Transactions (as of Q2 2016)
www.sganalytics.com | info@sganalytics.com | Page | 4
0.4 0.6
2.2
10.9
20
44
62
87
2009 2010 2011 2012 2013 2014 2015 2016
 Growing acceptance of mRDC among consumers is expected to save financial
institutions over USD 1 billion in 2017 through reduced processing costs
 According to 2016 Mobile Deposit Benchmark Report, 6 out of 10 online
consumers in the U.S. have never used mRDC facility due to higher fees,
deposit limits, and paper check retention policy of banks
 mRDC customer adoption rates among financial institutions in the U.S. is the
highest in giant banks followed by regional banks, and credit unions. Regional
banks however, have outpaced giant banks and credit unions in terms of
mRDC adoption growth during the period 2013-2016 with a CAGR of 165%
Remote Deposit Capture
mRDC Adoption in the U.S.
Sources: GlobeNewswire, Inc., Celent, Banking Exchange, Mitek Systems, Inc.
Key Players
EndUsers(million)
Year
www.sganalytics.com | info@sganalytics.com | Page | 5
1,450
2,113
3,006
3,842
5,581
6,531
7,562
8,334
9,259
2006 2008 2010 2012 2014 2016
 Globally biometrics technology market is spread over a minimum of 13
biometric modalities, 11 major industry sectors, 142 individual use cases and
over 100 technology vendors and system integrators
 Biometric authentication is perceived as an absolute must have for banks in
the near future especially due to growing popularity of mobile banking
 Biometrics in banking is expected to total USD 11 billion and authenticate
65% of global mcommerce transactions by 2020
 Biometric authentication market would primarily be driven by growing
identity theft and fraud globally
 Annual biometrics revenue is the highest in Asia Pacific, followed by Europe
and North America
Authentication/Biometrics
Sources: WEX, Find Biometrics, Lets Talk Payments LLC ., NetAmerica Alliance, Trendforce
Key Players
Revenue(millionUSD)
Year
Global Biometric Industry
www.sganalytics.com | info@sganalytics.com | Page | 6
 In 2015, European countries were leading the contactless adoption wave
globally, with an increase of 150% contactless transactions over 2014. A
mandate directing compulsory contactless enablement of newly deployed
and upgraded POS terminals, applicable from January 2016, is expected to
drive its adoption up further
 Based on in-store transactions processed by MasterCard in 2015, Czech
Republic led with 77% contactless transactions, followed by Poland with 55%,
Hungary with 40% and Slovakia with 38%
 Based on in-store transactions processed by MasterCard in 2015, Czech
Republic led with 77% contactless transactions, followed by Poland with 55%,
Hungary with 40% and Slovakia with 38%
NFC/Contactless Payments
Sources: Ovum, Smartpaymentassociation.com, Pymnts.com, Globalretailbanker.com, Smartpaymentassociation.com, Theukcardsassociation.org.uk
Key Players
0
200
400
600
800
1000
1200
2014 2015 2016 2017 2018 2019
ActiveUsers(million)
Global Mobile Proximity Payment Users
www.sganalytics.com | info@sganalytics.com | Page | 7
 The ACH Network handles more than USD 40 trillion and nearly 23
billion electronic financial transactions annually, and in 2015 it
supported more than 90% of the total value of all electronic payments
in the U.S.
 ACH Network transaction volumes in the U.S. increased to 5.11 billion
in 3Q 2016, witnessing growth of 8.14% from 4.72 billion in 3Q 2014
 Regulatory reform is a key factor impacting the market adoption of
real-time payments. In addition, growing customer expectations and
competition from fintech have driven adoption of real-time retail
payment settlement systems by banks
Faster/Real-Time Payments
Sources: Nacha.org, Chapsco.co.uk, Swift.com
Key Players
18 countries ‘live’ 12 countries ‘exploring’
planning/building
17 additional Eurozone
countries ‘exploring’
The Real-Time Retail Payment Settlement System Landscape
www.sganalytics.com | info@sganalytics.com | Page | 8
 From 50 bitcoins in January 2009, the number of bitcoins in circulation
has grown to 15,742,950, as of 7 July 2016
 Of this, the highest number of bitcoin transactions conducted till 7 July
2016 stood at 281,849, recorded on 16 June 2016 and its peak market
price was recorded at USD 1,151 on 4 December 2013
 Growth in digital payments, and the perception of bitcoin being an
anonymous payment network, play a key role in bitcoin adoption;
leading to a 34% increase in number of venture capital backed bitcoin
and blockchain companies from 103 in 1Q 2015 to 138 in 1Q 2016
Blockchain/Bitcoin
Sources: Datamarket.com, Coindesk.com, Coinatmradar.com, Bit-media.org
Key Players
4.4
9.5
9.7
5.6
2.6
11.4
0
2
4
6
8
10
12
0
50
100
150
200
250
4Q 2014 1Q 2015 2Q 2015 3Q 2015 4Q 2015 1Q 2016
Quarterly Total VC Investment (USD million)
Quarterly Average VC Investment Deal Size (USD Million)
Global Investment in Bitcoin/Blockchain Industry
www.sganalytics.com | info@sganalytics.com | Page | 9
 Retail ecommerce sales worldwide is expected to reach USD 4.06 trillion in
2020, due to changing consumer behavior and buying patterns
 In APAC, retail ecommerce sales is expected to reach USD 1 trillion in 2016,
where the bulk of ecommerce will come from China, representing almost half
of retail sales worldwide
 Whereas in the U.K., the online sales growth rate of 16.2% was seen in 2015,
which is expected to grow further by 14.9% in 2016
 Mobile commerce has also seen progress with growing ecommerce.
According to BI Intelligence, m-commerce will reach $284 billion, i.e. 45% of
the total U.S. e-commerce industry, by 2020
E-commerce and M-commerce
Sources: Business Insider Inc., Twenga, eMarketer Inc., Smart Insights
Key Players
7.4% 8.7% 10.0% 11.5% 13.0% 14.6%
0%
25%
50%
75%
100%
1
2
3
4
5
2015 2016 2017 2018 2019 2020
Retail ecommerce sales % of total retail sales
Retail Ecommerce Sales Worldwide, 2015-2020
www.sganalytics.com | info@sganalytics.com | Page | 10
 By 2017, the adoption of mPOS terminals over standard POS terminals will be
46%, as opposed to the 17% that was seen in 2012. The shift is seen due to
easy maintainence, zero performance charges, free downloadable
statements, automatic settlements, etc.
 Globally, mobile payments are expected to reach USD 3 trillion by 2021, as
consumers are turning towards online methods
 The U.S. is expected to be the largest market, with an estimated USD 33.90
billion in mobile payments in 2016
 Due to rise in mPOS transaction, 40% of respondents carry less than USD 20
in their wallet, according to a survey conducted by Visa and GfK research
mPOS (Mobile point of Sale)
Sources: Altimetrik.inc, PR Newswire Association LLC, Inniti Research Limited, Business Insider Inc., Global Industry Analysts, Inc., Scroll.in
Key Players
0.5
0.7 0.9
1.6
2.4
3.6
5.4
0
1
2
3
4
5
6
2012 2013 2014 2015 2016 2017 2018
USD billions
mPOS Proximity Payment Value
www.sganalytics.com | info@sganalytics.com | Page | 11
 The global market for mobile wallet is forecasted to reach USD 2.70 trillion by
2020, as it offers multiple mobile financial services under one umbrella.
 In North America mobile wallet market is expected to grow from USD 34.00
billion in 2015 to USD 158.80 billion in 2020 at a CAGR of 36.1%, wheras,
EMEA mobile wallet market is projected to increase from USD 45.40 billion in
2015 to USD 260.30 billion in 2020 at a CAGR of 41.8%
 Mobile wallet transactions in India have increased from USD 180 million in
2012-13 to more than USD 7,214 million in 2015-16 and is projected to grow
at a CAGR of around 30% from 2015-2019
Mobile wallet
Sources: BankingTech.com, Mobile Payments Today, Networld Media Group LLC, PaymentsCM LLP, Miura Systems Ltd, Siegel Communications, Inc.
Key Players
38%
30%
12%
20%
0%
10%
20%
30%
40%
50%
Money Transfer Recharge Utility & Bill
Payments
Others
Market Share of Mobile Wallet by Payment Type

The Future of Payments: Next-Gen Payment Processing Technologies

  • 1.
    Future of Payments: Next-GenPayment Processing Technologies "While the payments landscape has evolved rapidly over the past decade, due to a flurry of innovation and regulation, expansive growth in electronic payments and the inclusion of new market entrants, industry research indicates that the next decade will yield a period of even faster changes”, writes Daniel Szmukler, Director, Euro Banking Association.
  • 2.
    www.sganalytics.com | info@sganalytics.com| Page | 2 In this presentation, SG Analytics highlights the 9 most important payment processing technologies!
  • 3.
    www.sganalytics.com | info@sganalytics.com| Page | 3  Globally, 42.4% of transactions as of Q2 2016 were EMV  Percentage of card present EMV transactions as of Q2 2016 were the highest in Europe at 97.6%, followed by MEA at 89.94% and North America at 88.81%  The EMV standard was first implemented in the U.K. in 2002 and the country reached a complete EMV migration by 2006. EMV adoption in the U.S. had been relatively slow; however, growing popularity of mobile NFC payments in the U.S. is expected to drive EMV adoption among U.S. merchants, since both contactless EMV cards and mobile NFC systems use the same contactless ISO payment specifications  Due to growth in EMV adoption across the globe, chargebacks are predicted to escalate across the U.S., U.K., and Europe EMV (Europay, Mastercard and Visa cards) Key Players Sources: EMVCo, LLC, NCR, CreditCards.com, Global Risk Technologies 89.9% Region MENA Asia Europe (Except CIS & Baltic nations) 57.9% 88.8% 97.6% U.S. 7.2% North America (Except U.S.) Percentage of EMV Card Present Transactions (as of Q2 2016)
  • 4.
    www.sganalytics.com | info@sganalytics.com| Page | 4 0.4 0.6 2.2 10.9 20 44 62 87 2009 2010 2011 2012 2013 2014 2015 2016  Growing acceptance of mRDC among consumers is expected to save financial institutions over USD 1 billion in 2017 through reduced processing costs  According to 2016 Mobile Deposit Benchmark Report, 6 out of 10 online consumers in the U.S. have never used mRDC facility due to higher fees, deposit limits, and paper check retention policy of banks  mRDC customer adoption rates among financial institutions in the U.S. is the highest in giant banks followed by regional banks, and credit unions. Regional banks however, have outpaced giant banks and credit unions in terms of mRDC adoption growth during the period 2013-2016 with a CAGR of 165% Remote Deposit Capture mRDC Adoption in the U.S. Sources: GlobeNewswire, Inc., Celent, Banking Exchange, Mitek Systems, Inc. Key Players EndUsers(million) Year
  • 5.
    www.sganalytics.com | info@sganalytics.com| Page | 5 1,450 2,113 3,006 3,842 5,581 6,531 7,562 8,334 9,259 2006 2008 2010 2012 2014 2016  Globally biometrics technology market is spread over a minimum of 13 biometric modalities, 11 major industry sectors, 142 individual use cases and over 100 technology vendors and system integrators  Biometric authentication is perceived as an absolute must have for banks in the near future especially due to growing popularity of mobile banking  Biometrics in banking is expected to total USD 11 billion and authenticate 65% of global mcommerce transactions by 2020  Biometric authentication market would primarily be driven by growing identity theft and fraud globally  Annual biometrics revenue is the highest in Asia Pacific, followed by Europe and North America Authentication/Biometrics Sources: WEX, Find Biometrics, Lets Talk Payments LLC ., NetAmerica Alliance, Trendforce Key Players Revenue(millionUSD) Year Global Biometric Industry
  • 6.
    www.sganalytics.com | info@sganalytics.com| Page | 6  In 2015, European countries were leading the contactless adoption wave globally, with an increase of 150% contactless transactions over 2014. A mandate directing compulsory contactless enablement of newly deployed and upgraded POS terminals, applicable from January 2016, is expected to drive its adoption up further  Based on in-store transactions processed by MasterCard in 2015, Czech Republic led with 77% contactless transactions, followed by Poland with 55%, Hungary with 40% and Slovakia with 38%  Based on in-store transactions processed by MasterCard in 2015, Czech Republic led with 77% contactless transactions, followed by Poland with 55%, Hungary with 40% and Slovakia with 38% NFC/Contactless Payments Sources: Ovum, Smartpaymentassociation.com, Pymnts.com, Globalretailbanker.com, Smartpaymentassociation.com, Theukcardsassociation.org.uk Key Players 0 200 400 600 800 1000 1200 2014 2015 2016 2017 2018 2019 ActiveUsers(million) Global Mobile Proximity Payment Users
  • 7.
    www.sganalytics.com | info@sganalytics.com| Page | 7  The ACH Network handles more than USD 40 trillion and nearly 23 billion electronic financial transactions annually, and in 2015 it supported more than 90% of the total value of all electronic payments in the U.S.  ACH Network transaction volumes in the U.S. increased to 5.11 billion in 3Q 2016, witnessing growth of 8.14% from 4.72 billion in 3Q 2014  Regulatory reform is a key factor impacting the market adoption of real-time payments. In addition, growing customer expectations and competition from fintech have driven adoption of real-time retail payment settlement systems by banks Faster/Real-Time Payments Sources: Nacha.org, Chapsco.co.uk, Swift.com Key Players 18 countries ‘live’ 12 countries ‘exploring’ planning/building 17 additional Eurozone countries ‘exploring’ The Real-Time Retail Payment Settlement System Landscape
  • 8.
    www.sganalytics.com | info@sganalytics.com| Page | 8  From 50 bitcoins in January 2009, the number of bitcoins in circulation has grown to 15,742,950, as of 7 July 2016  Of this, the highest number of bitcoin transactions conducted till 7 July 2016 stood at 281,849, recorded on 16 June 2016 and its peak market price was recorded at USD 1,151 on 4 December 2013  Growth in digital payments, and the perception of bitcoin being an anonymous payment network, play a key role in bitcoin adoption; leading to a 34% increase in number of venture capital backed bitcoin and blockchain companies from 103 in 1Q 2015 to 138 in 1Q 2016 Blockchain/Bitcoin Sources: Datamarket.com, Coindesk.com, Coinatmradar.com, Bit-media.org Key Players 4.4 9.5 9.7 5.6 2.6 11.4 0 2 4 6 8 10 12 0 50 100 150 200 250 4Q 2014 1Q 2015 2Q 2015 3Q 2015 4Q 2015 1Q 2016 Quarterly Total VC Investment (USD million) Quarterly Average VC Investment Deal Size (USD Million) Global Investment in Bitcoin/Blockchain Industry
  • 9.
    www.sganalytics.com | info@sganalytics.com| Page | 9  Retail ecommerce sales worldwide is expected to reach USD 4.06 trillion in 2020, due to changing consumer behavior and buying patterns  In APAC, retail ecommerce sales is expected to reach USD 1 trillion in 2016, where the bulk of ecommerce will come from China, representing almost half of retail sales worldwide  Whereas in the U.K., the online sales growth rate of 16.2% was seen in 2015, which is expected to grow further by 14.9% in 2016  Mobile commerce has also seen progress with growing ecommerce. According to BI Intelligence, m-commerce will reach $284 billion, i.e. 45% of the total U.S. e-commerce industry, by 2020 E-commerce and M-commerce Sources: Business Insider Inc., Twenga, eMarketer Inc., Smart Insights Key Players 7.4% 8.7% 10.0% 11.5% 13.0% 14.6% 0% 25% 50% 75% 100% 1 2 3 4 5 2015 2016 2017 2018 2019 2020 Retail ecommerce sales % of total retail sales Retail Ecommerce Sales Worldwide, 2015-2020
  • 10.
    www.sganalytics.com | info@sganalytics.com| Page | 10  By 2017, the adoption of mPOS terminals over standard POS terminals will be 46%, as opposed to the 17% that was seen in 2012. The shift is seen due to easy maintainence, zero performance charges, free downloadable statements, automatic settlements, etc.  Globally, mobile payments are expected to reach USD 3 trillion by 2021, as consumers are turning towards online methods  The U.S. is expected to be the largest market, with an estimated USD 33.90 billion in mobile payments in 2016  Due to rise in mPOS transaction, 40% of respondents carry less than USD 20 in their wallet, according to a survey conducted by Visa and GfK research mPOS (Mobile point of Sale) Sources: Altimetrik.inc, PR Newswire Association LLC, Inniti Research Limited, Business Insider Inc., Global Industry Analysts, Inc., Scroll.in Key Players 0.5 0.7 0.9 1.6 2.4 3.6 5.4 0 1 2 3 4 5 6 2012 2013 2014 2015 2016 2017 2018 USD billions mPOS Proximity Payment Value
  • 11.
    www.sganalytics.com | info@sganalytics.com| Page | 11  The global market for mobile wallet is forecasted to reach USD 2.70 trillion by 2020, as it offers multiple mobile financial services under one umbrella.  In North America mobile wallet market is expected to grow from USD 34.00 billion in 2015 to USD 158.80 billion in 2020 at a CAGR of 36.1%, wheras, EMEA mobile wallet market is projected to increase from USD 45.40 billion in 2015 to USD 260.30 billion in 2020 at a CAGR of 41.8%  Mobile wallet transactions in India have increased from USD 180 million in 2012-13 to more than USD 7,214 million in 2015-16 and is projected to grow at a CAGR of around 30% from 2015-2019 Mobile wallet Sources: BankingTech.com, Mobile Payments Today, Networld Media Group LLC, PaymentsCM LLP, Miura Systems Ltd, Siegel Communications, Inc. Key Players 38% 30% 12% 20% 0% 10% 20% 30% 40% 50% Money Transfer Recharge Utility & Bill Payments Others Market Share of Mobile Wallet by Payment Type