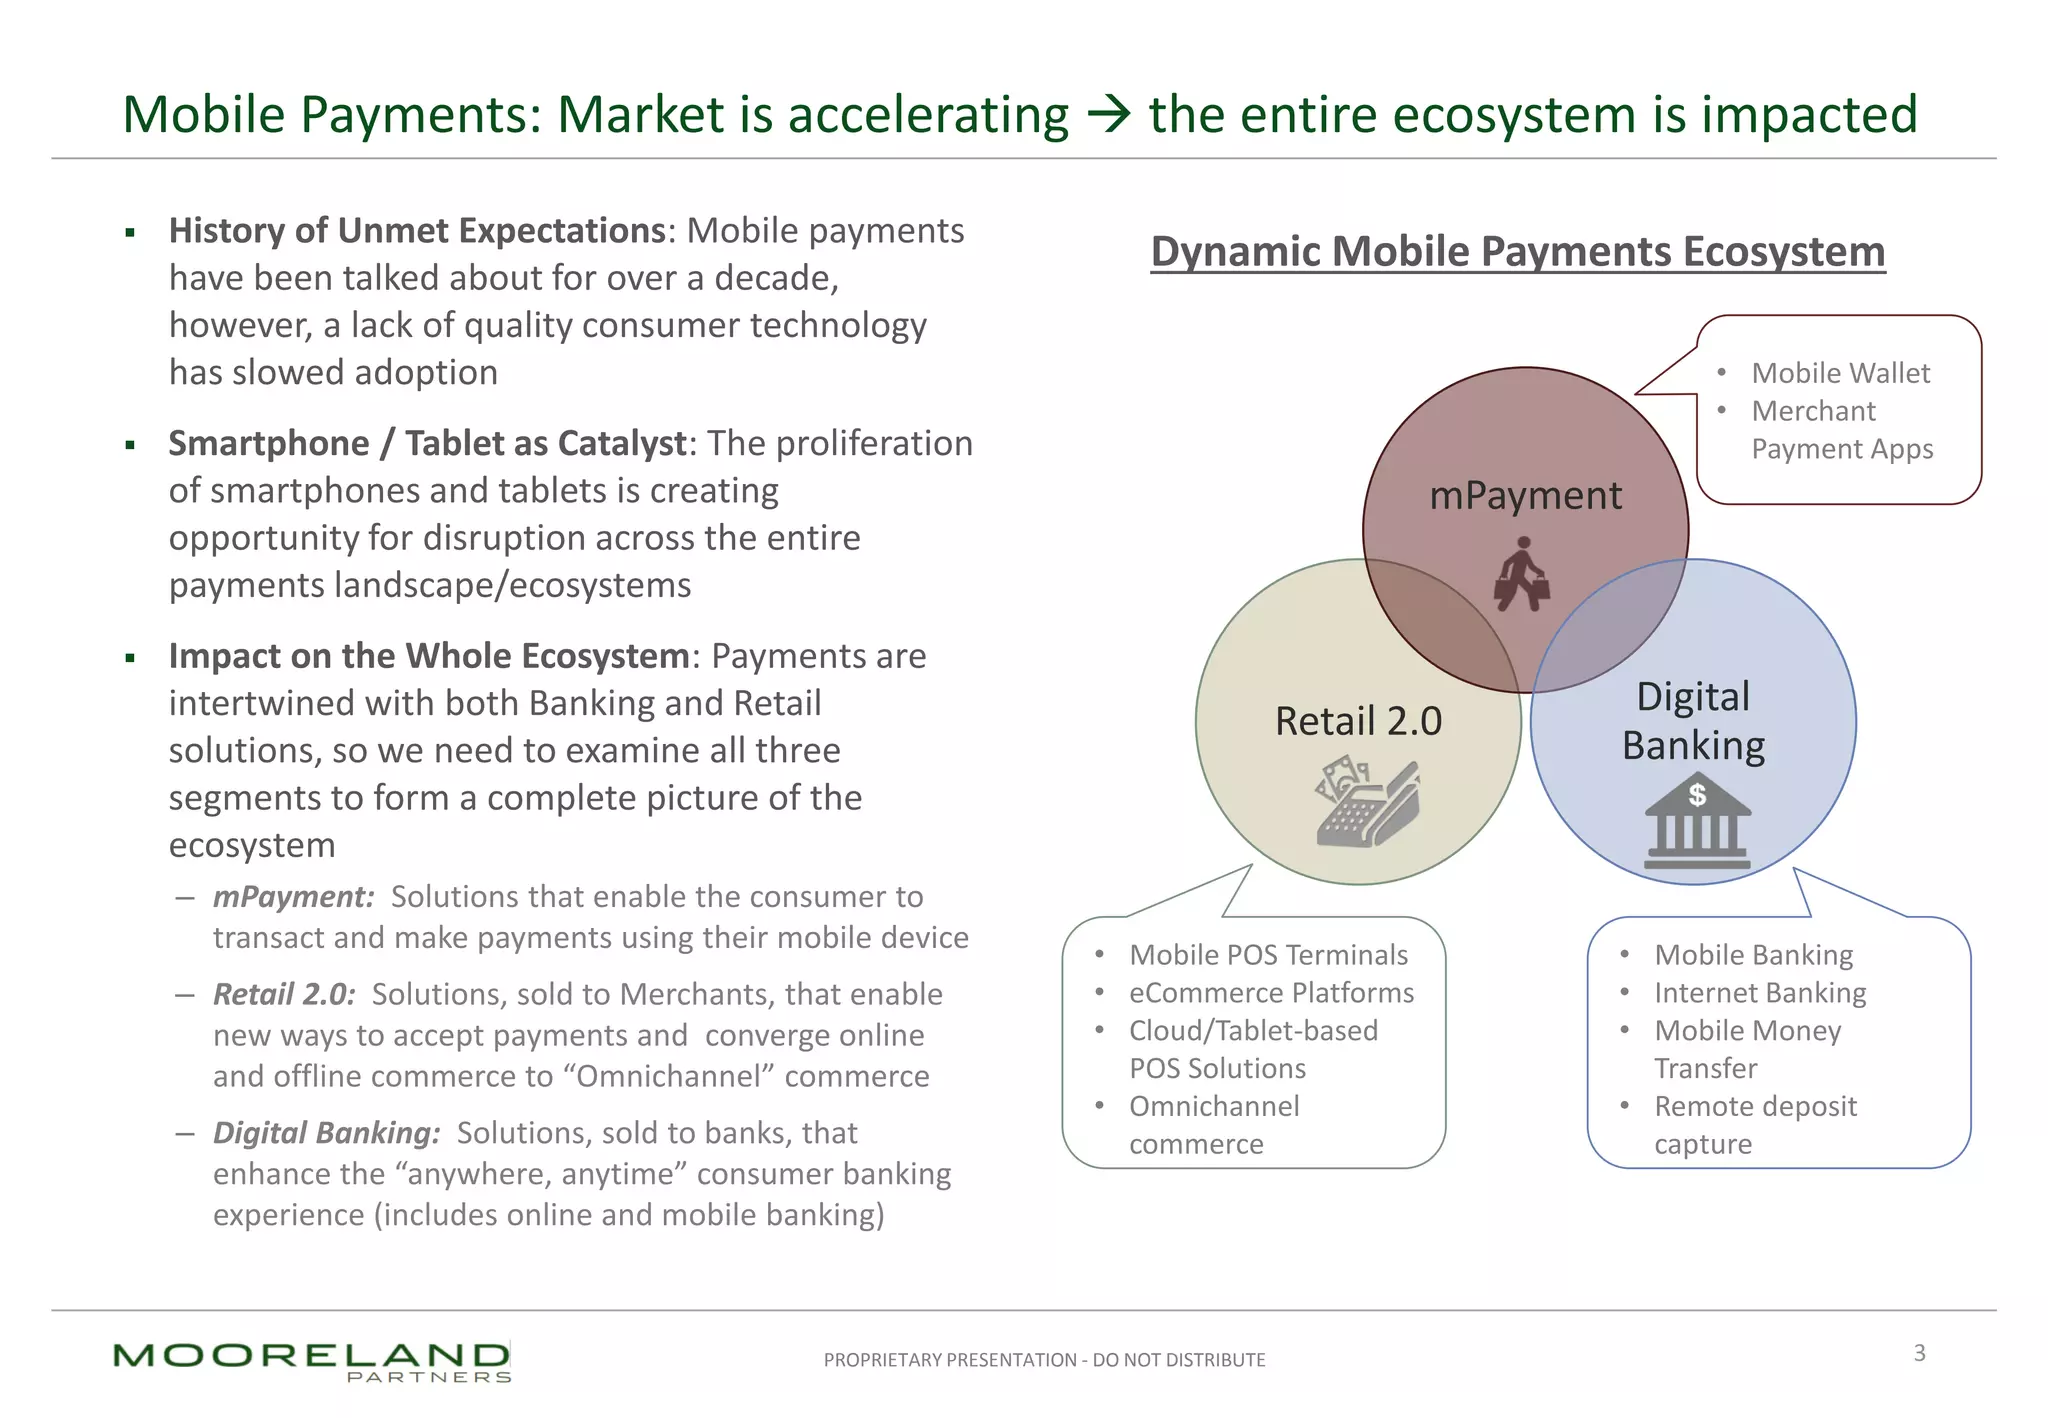
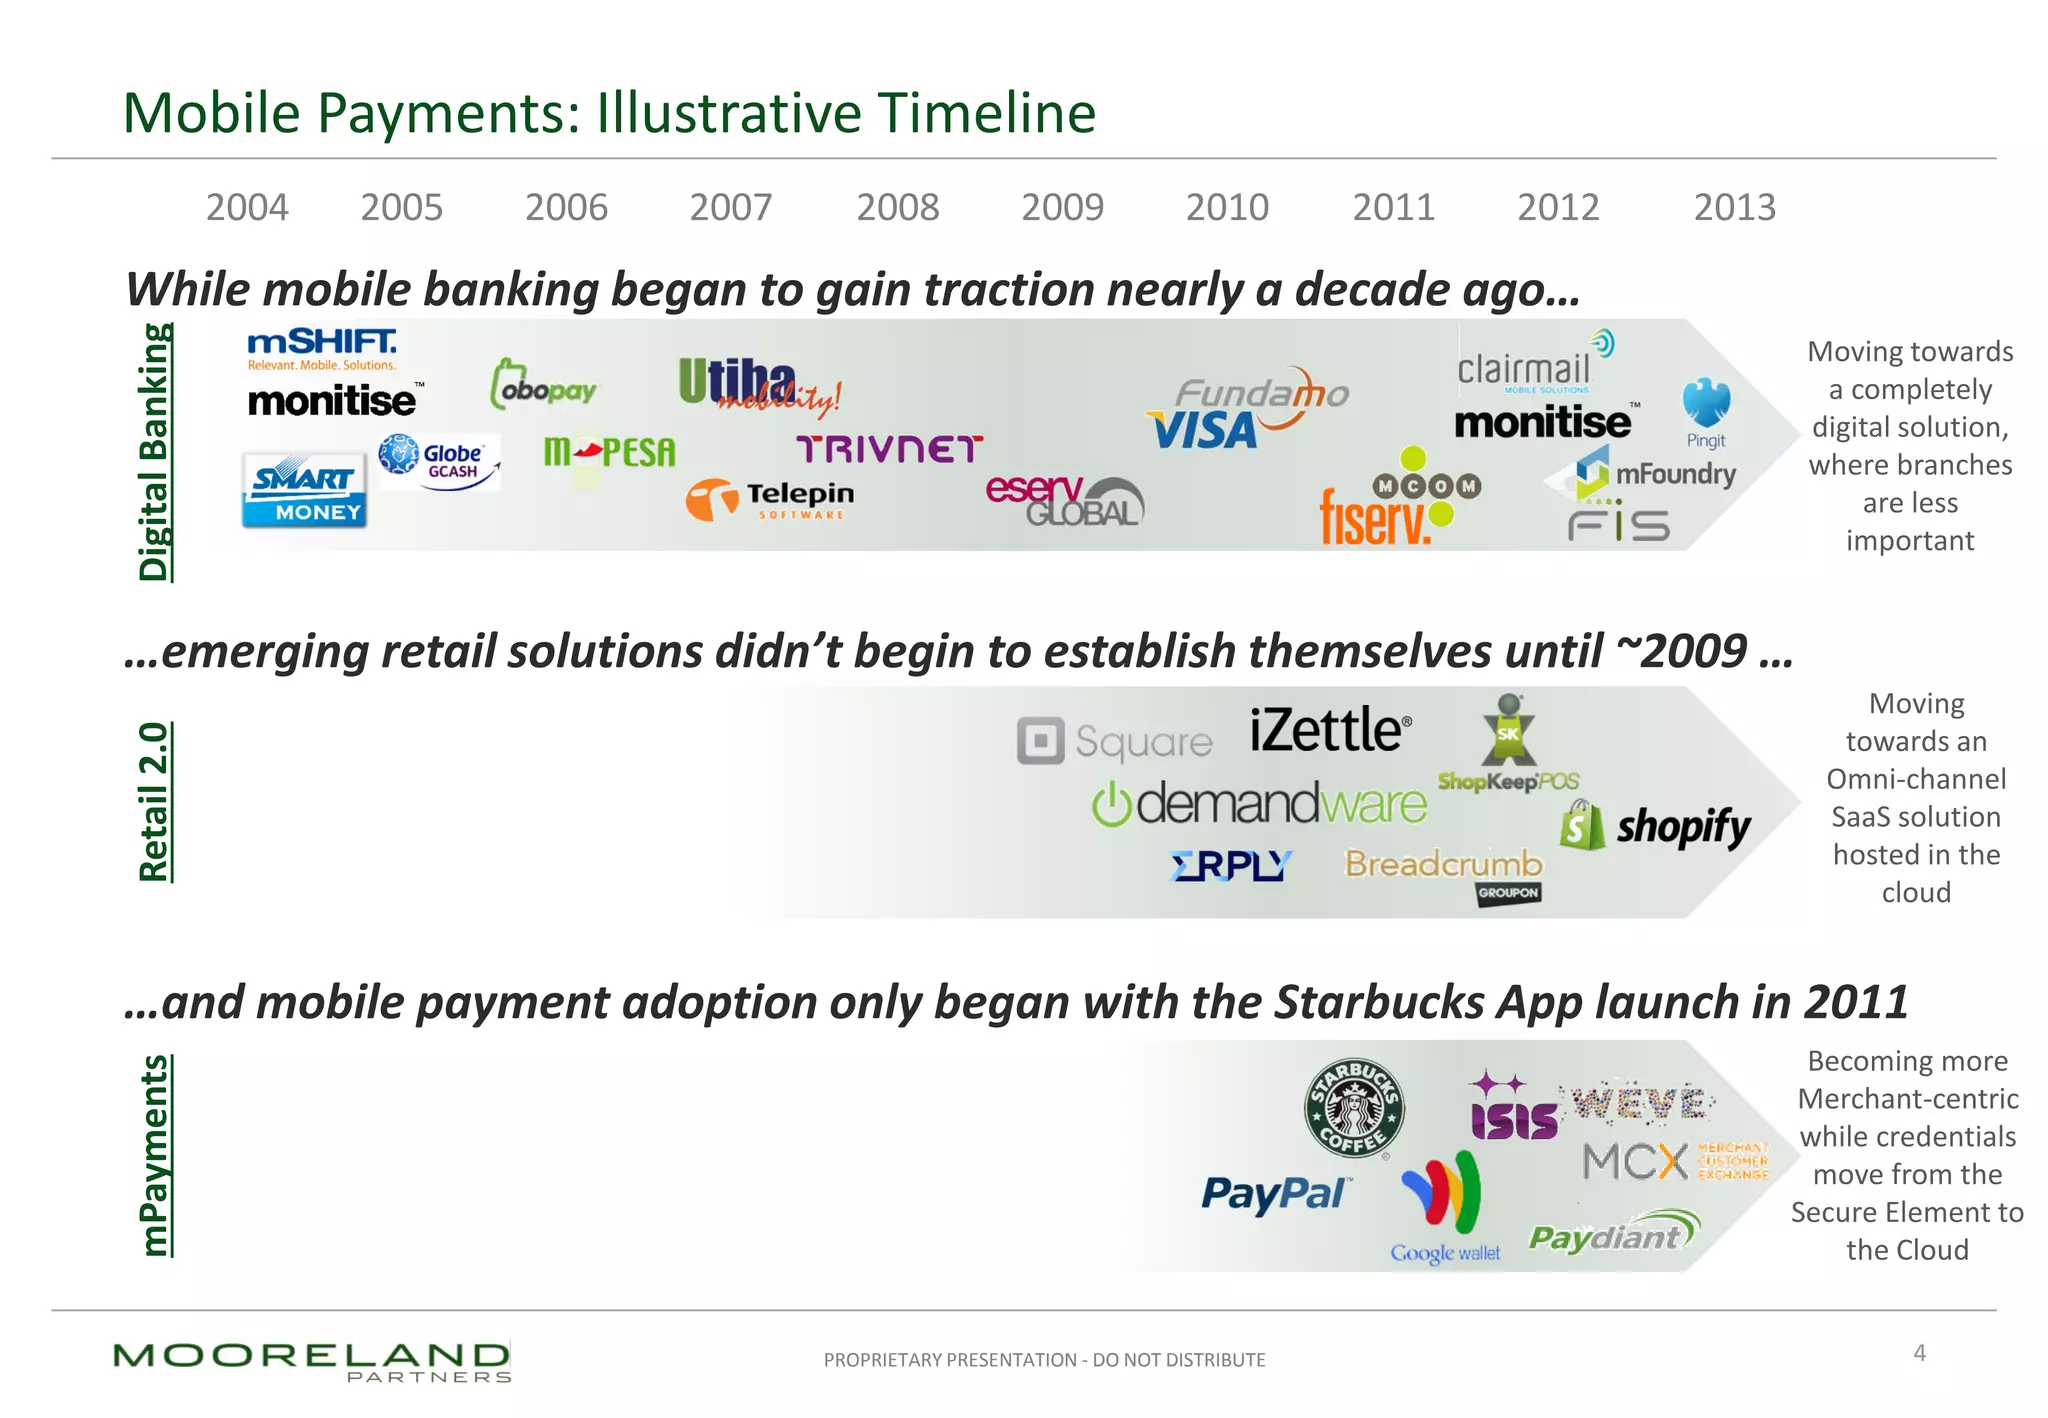
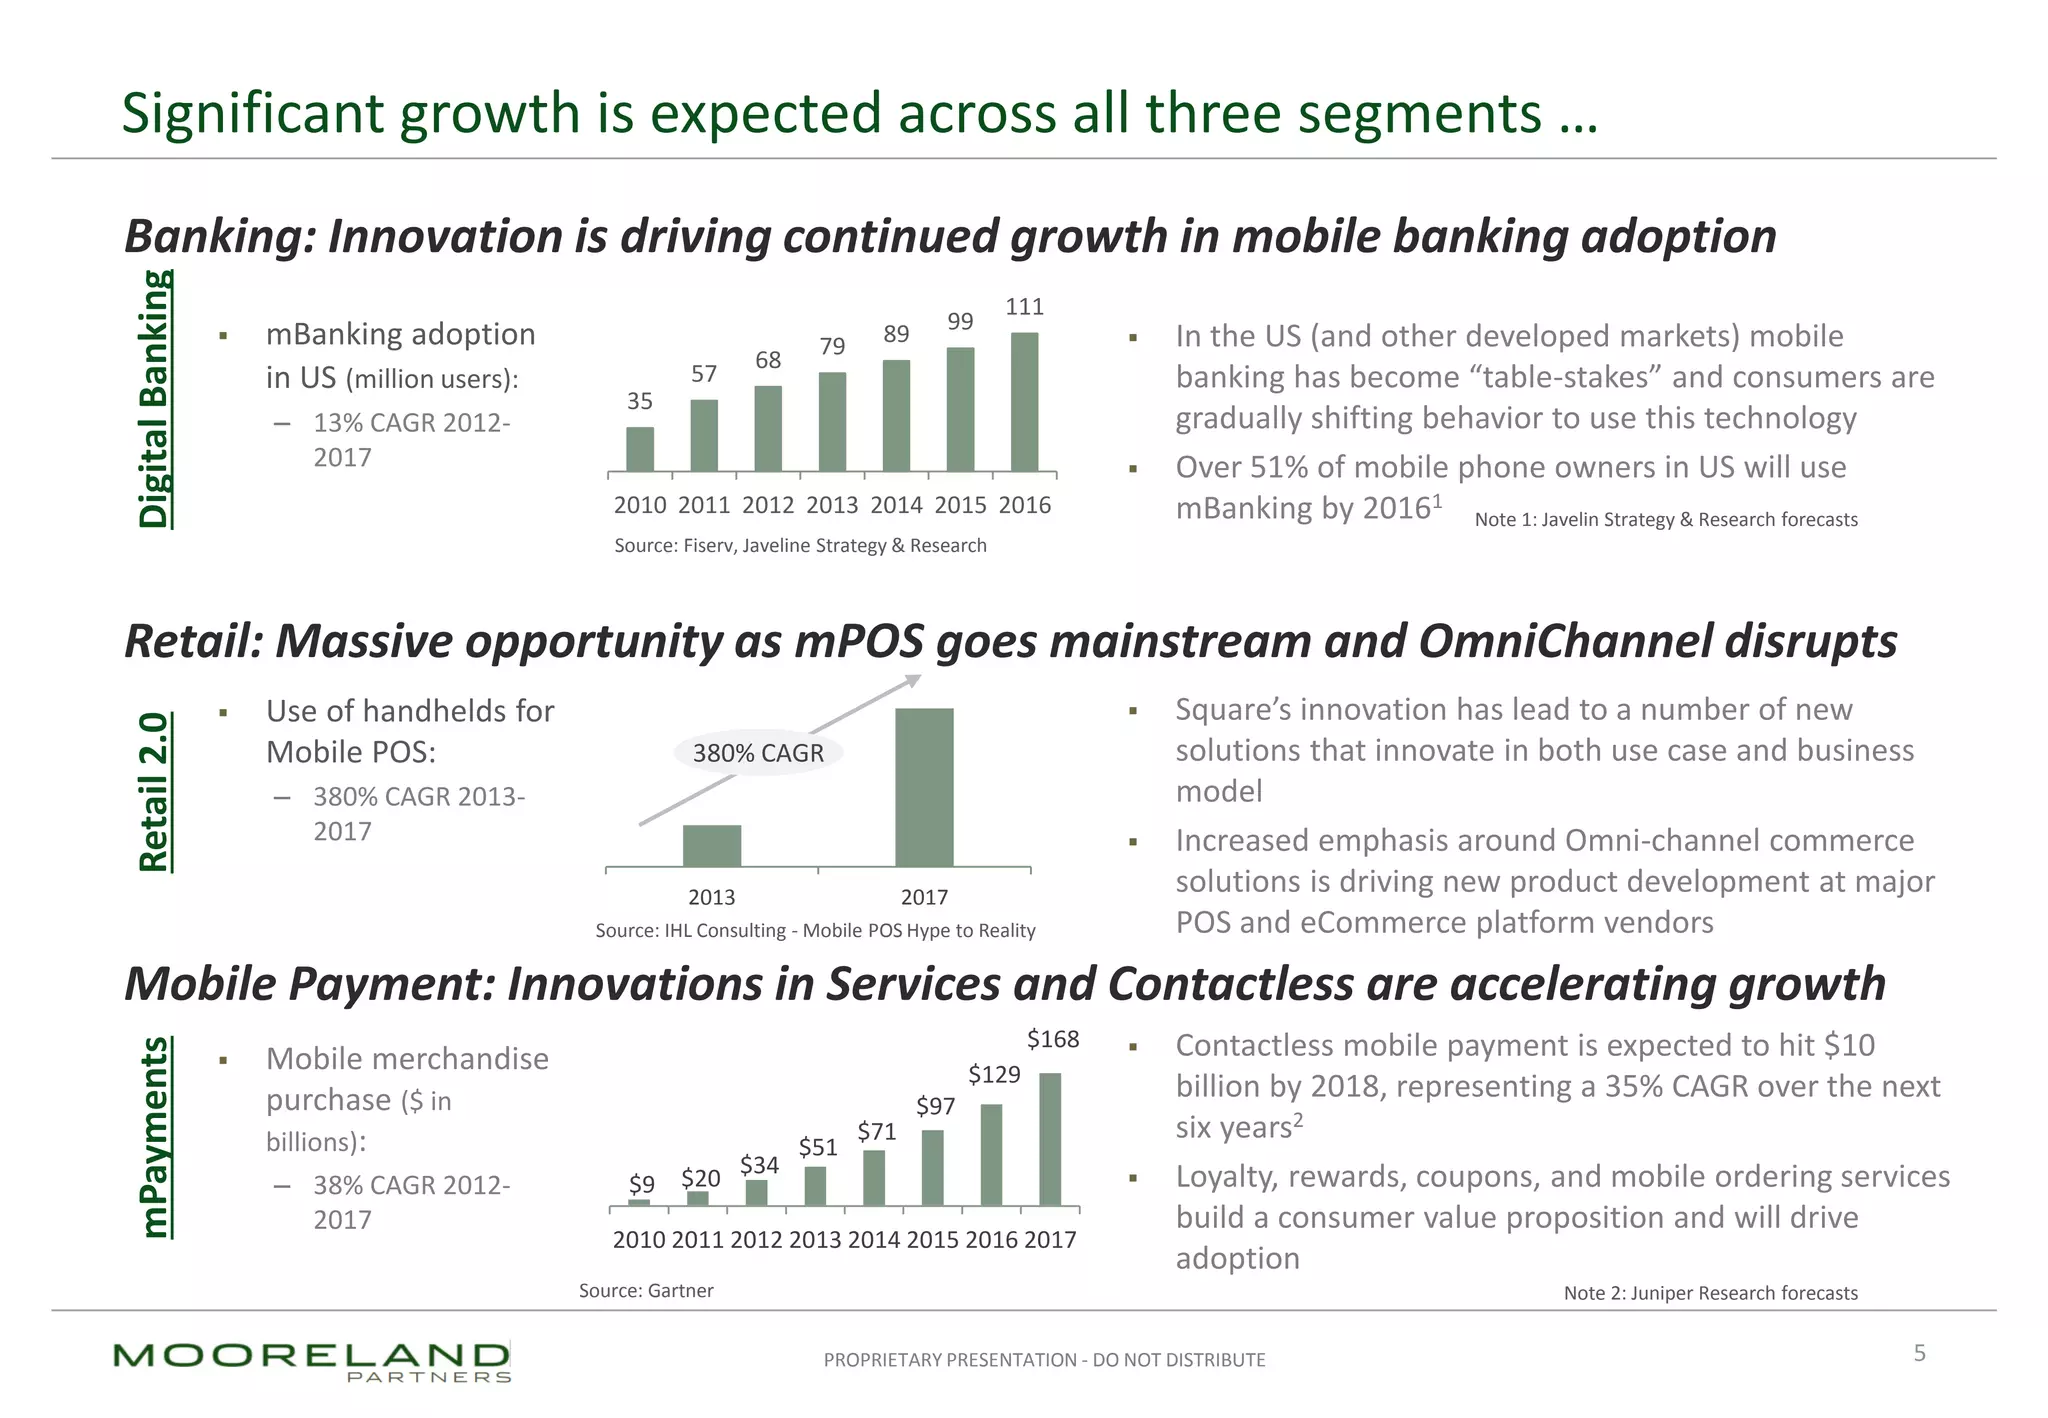
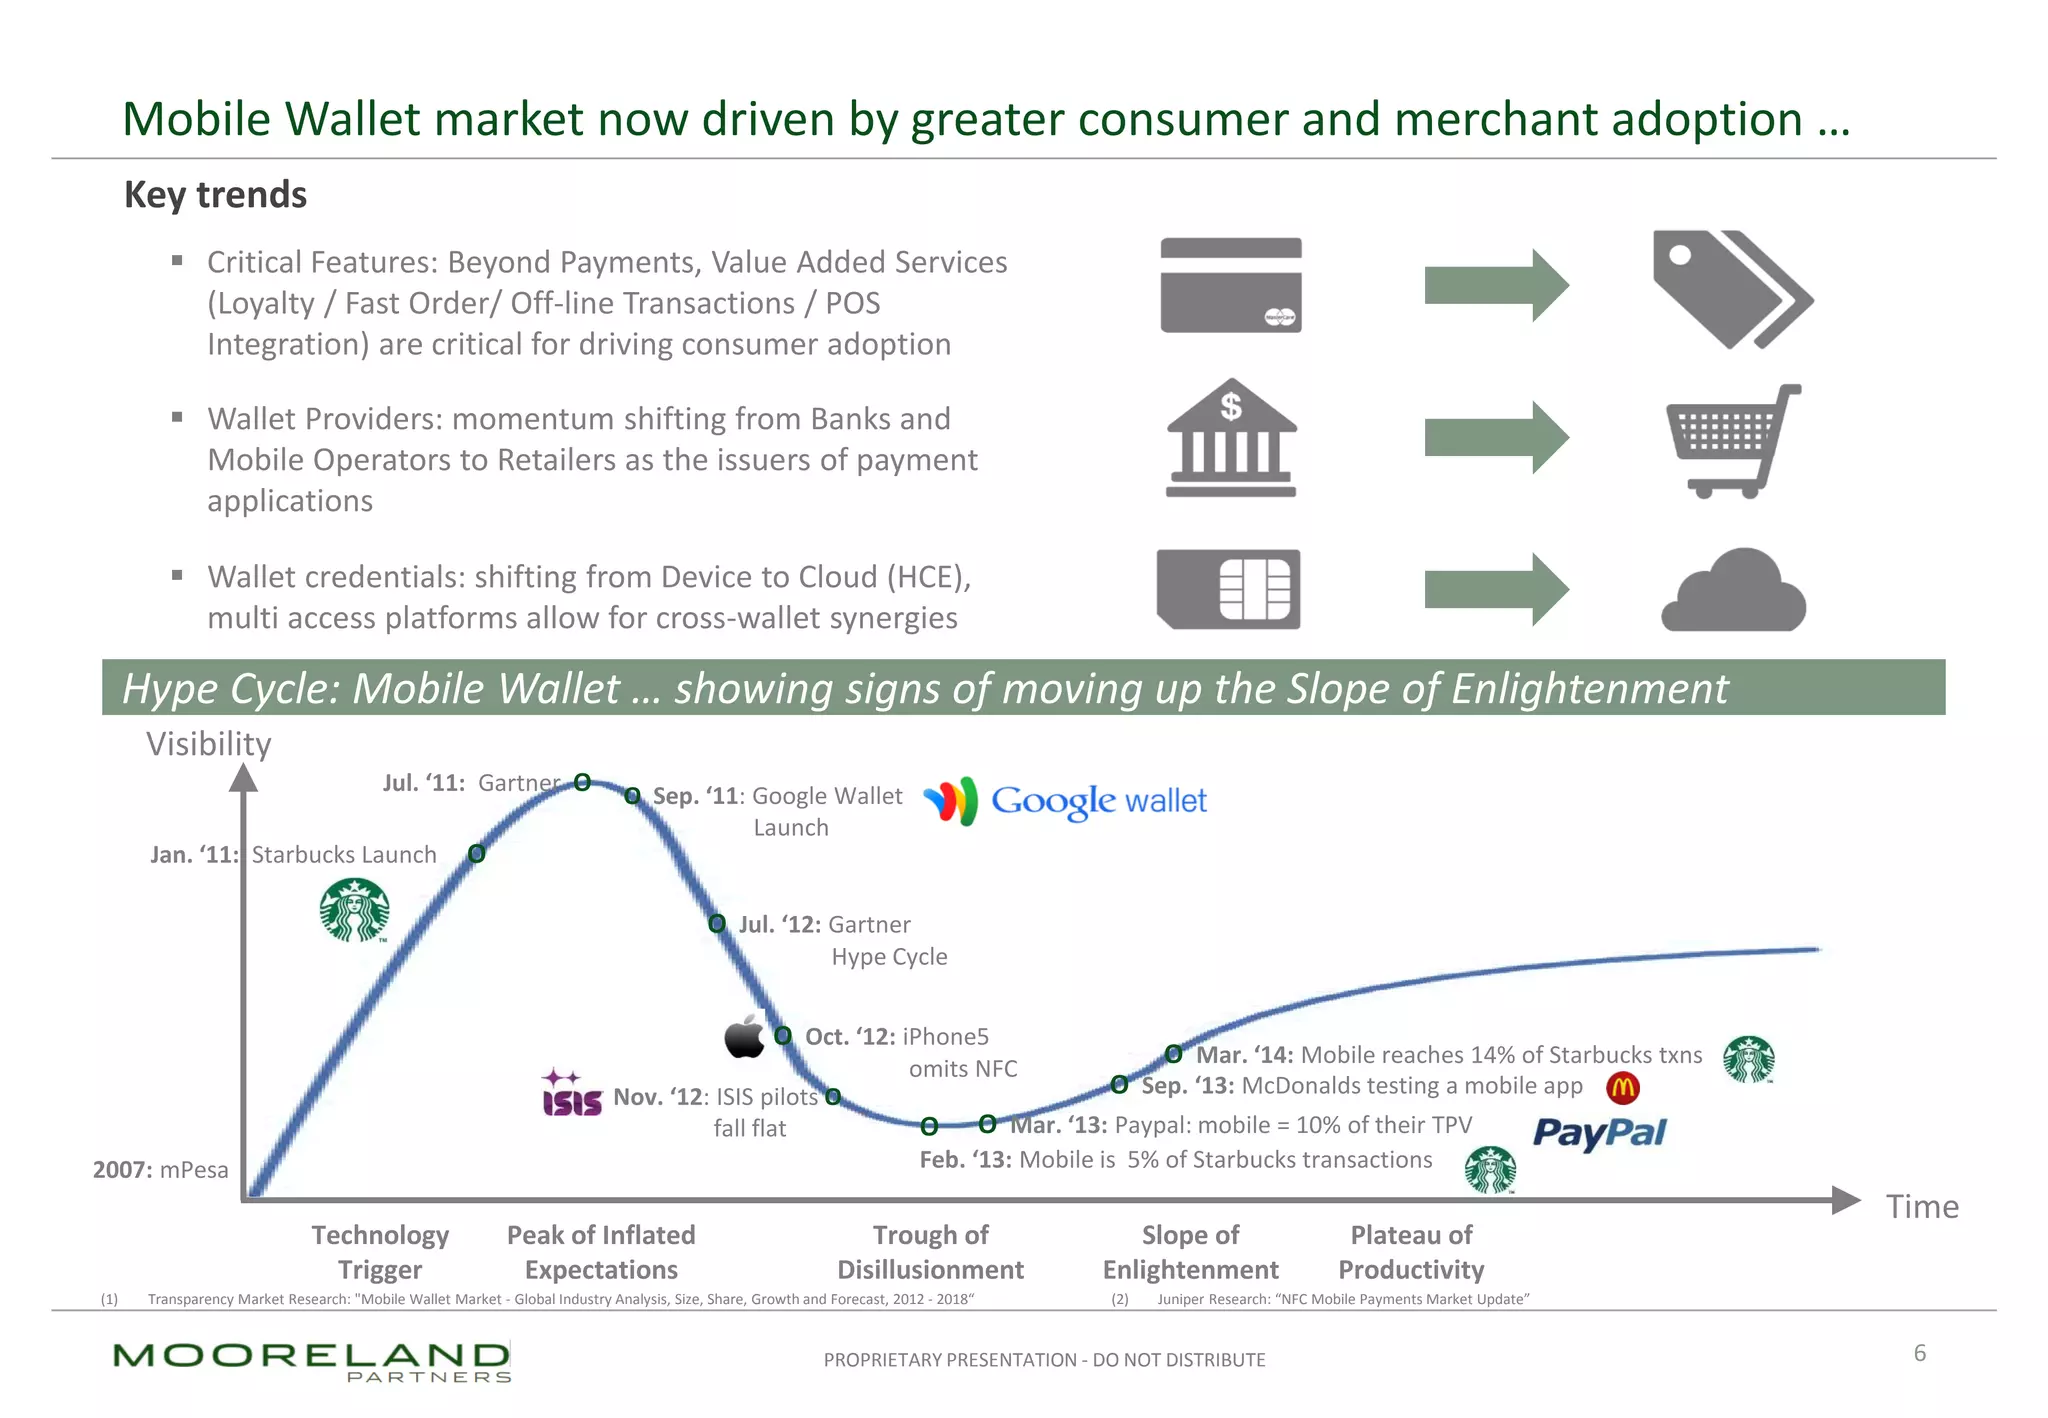
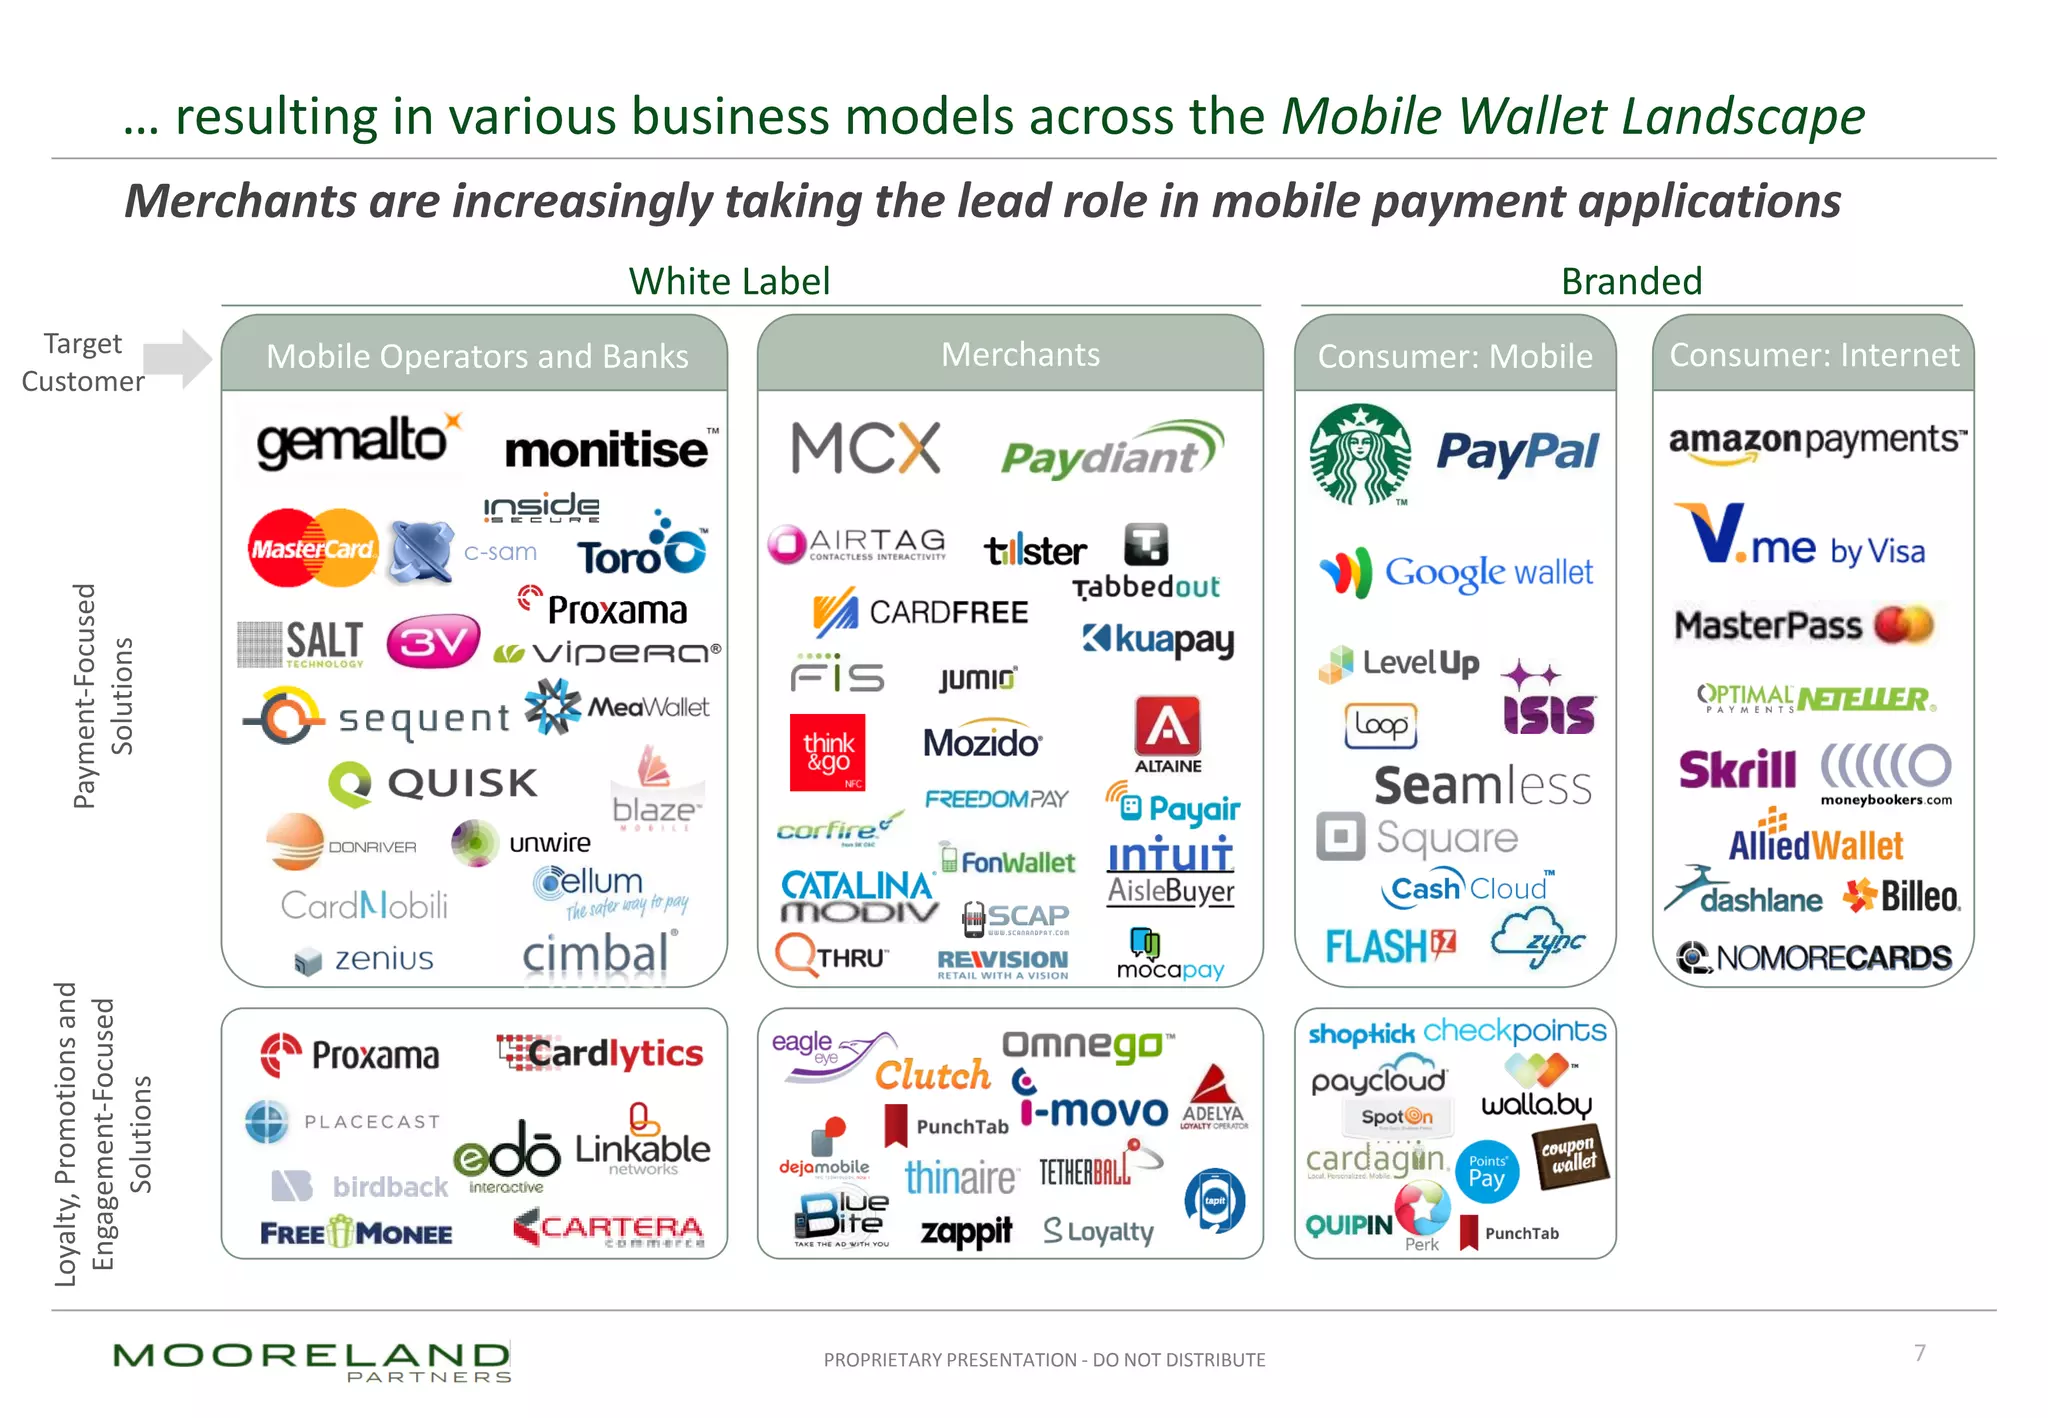
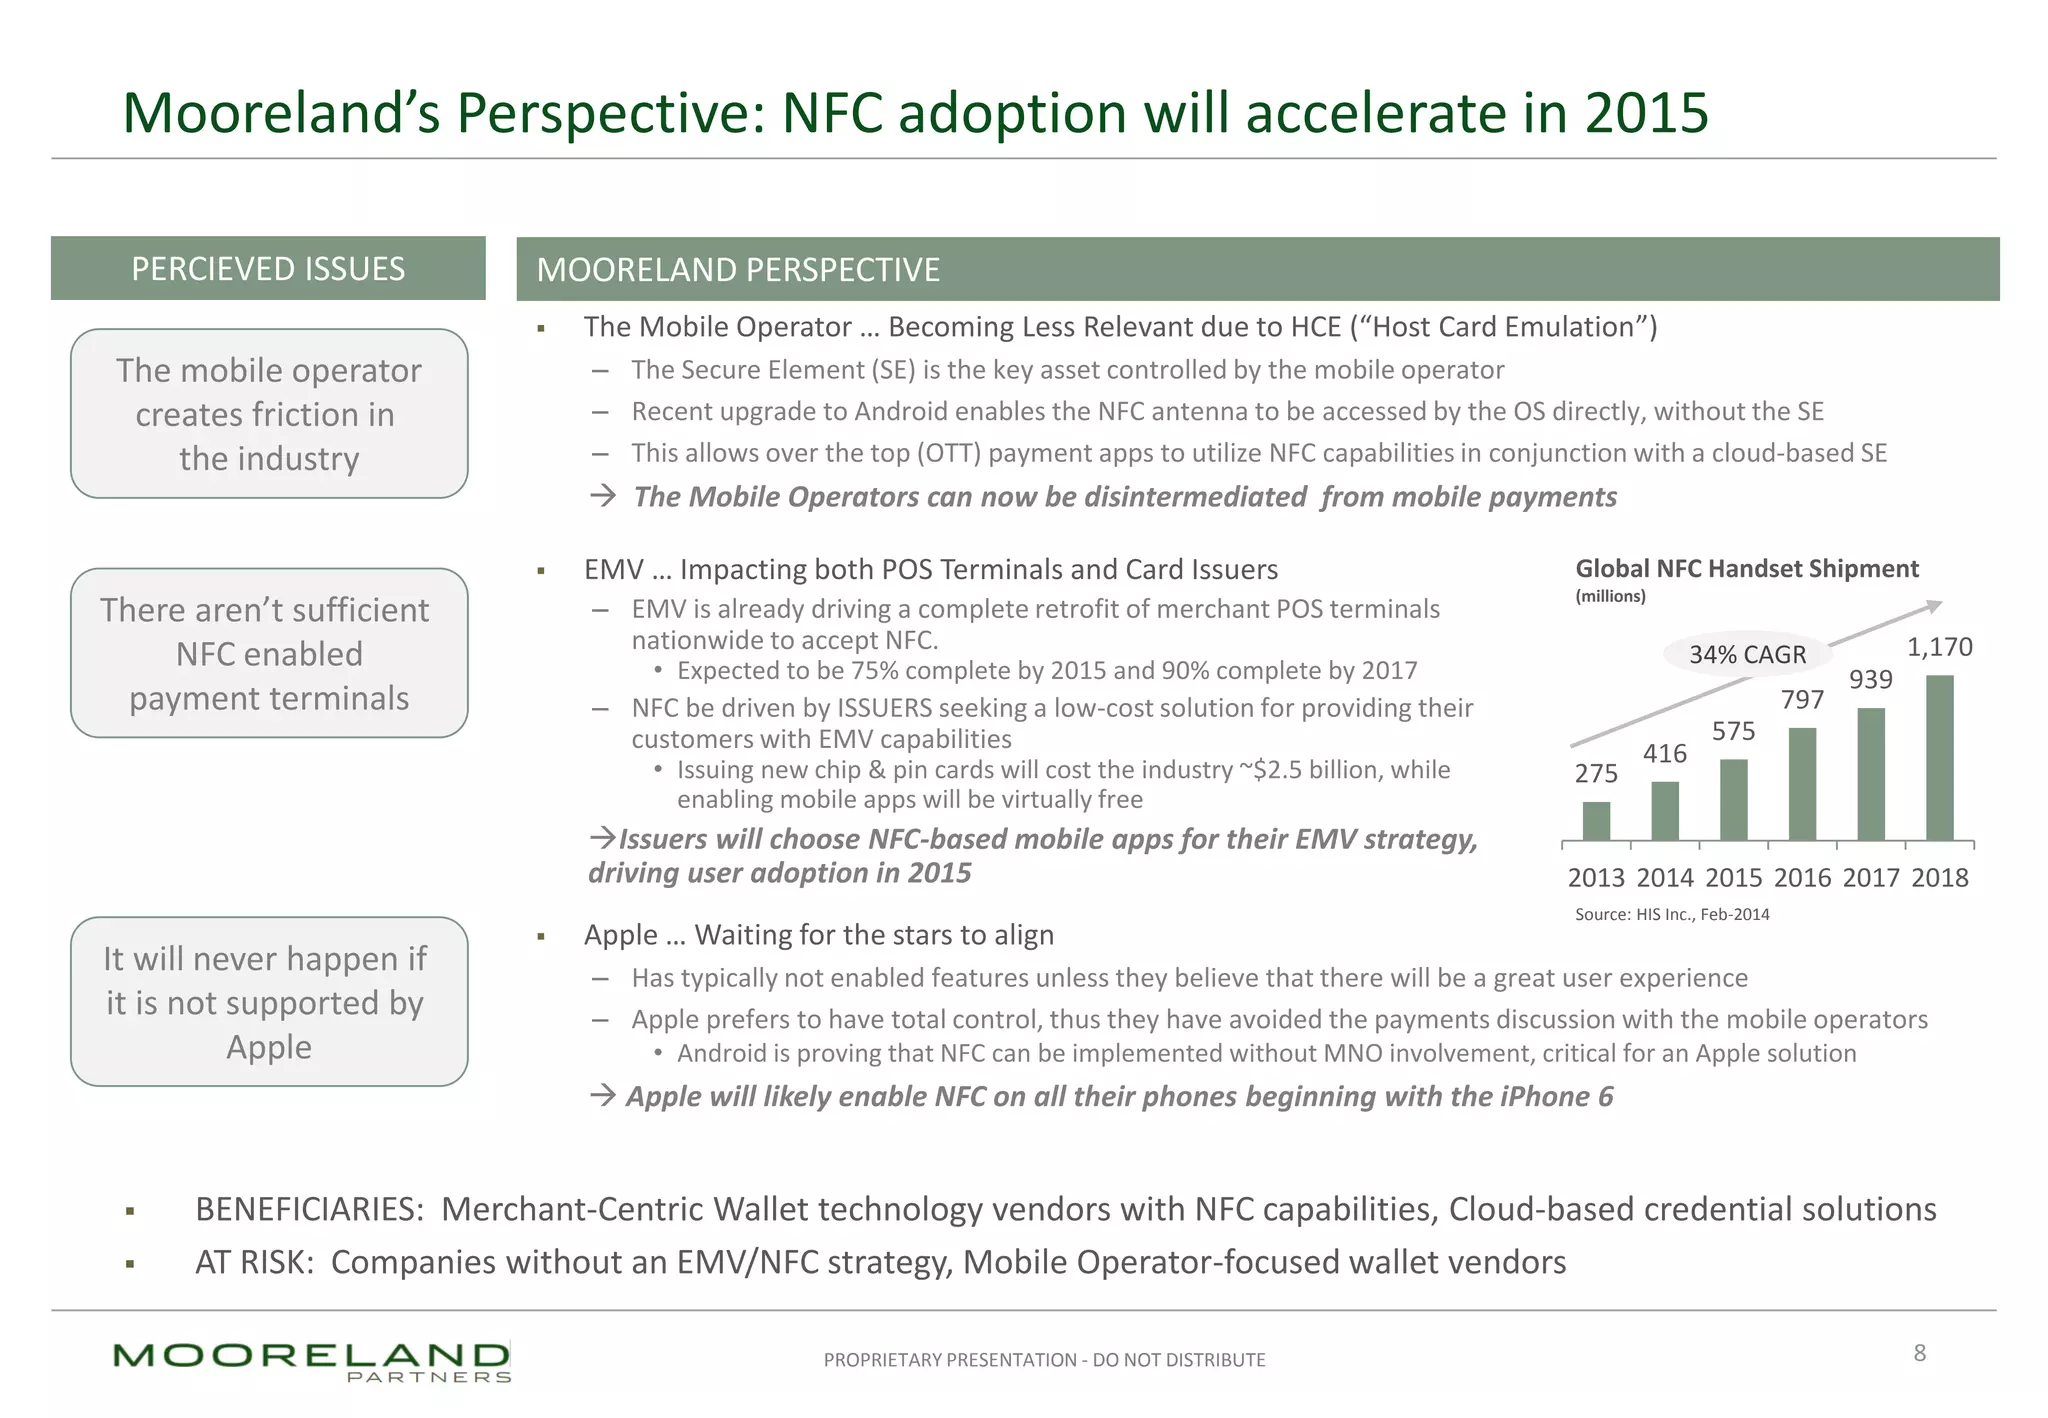
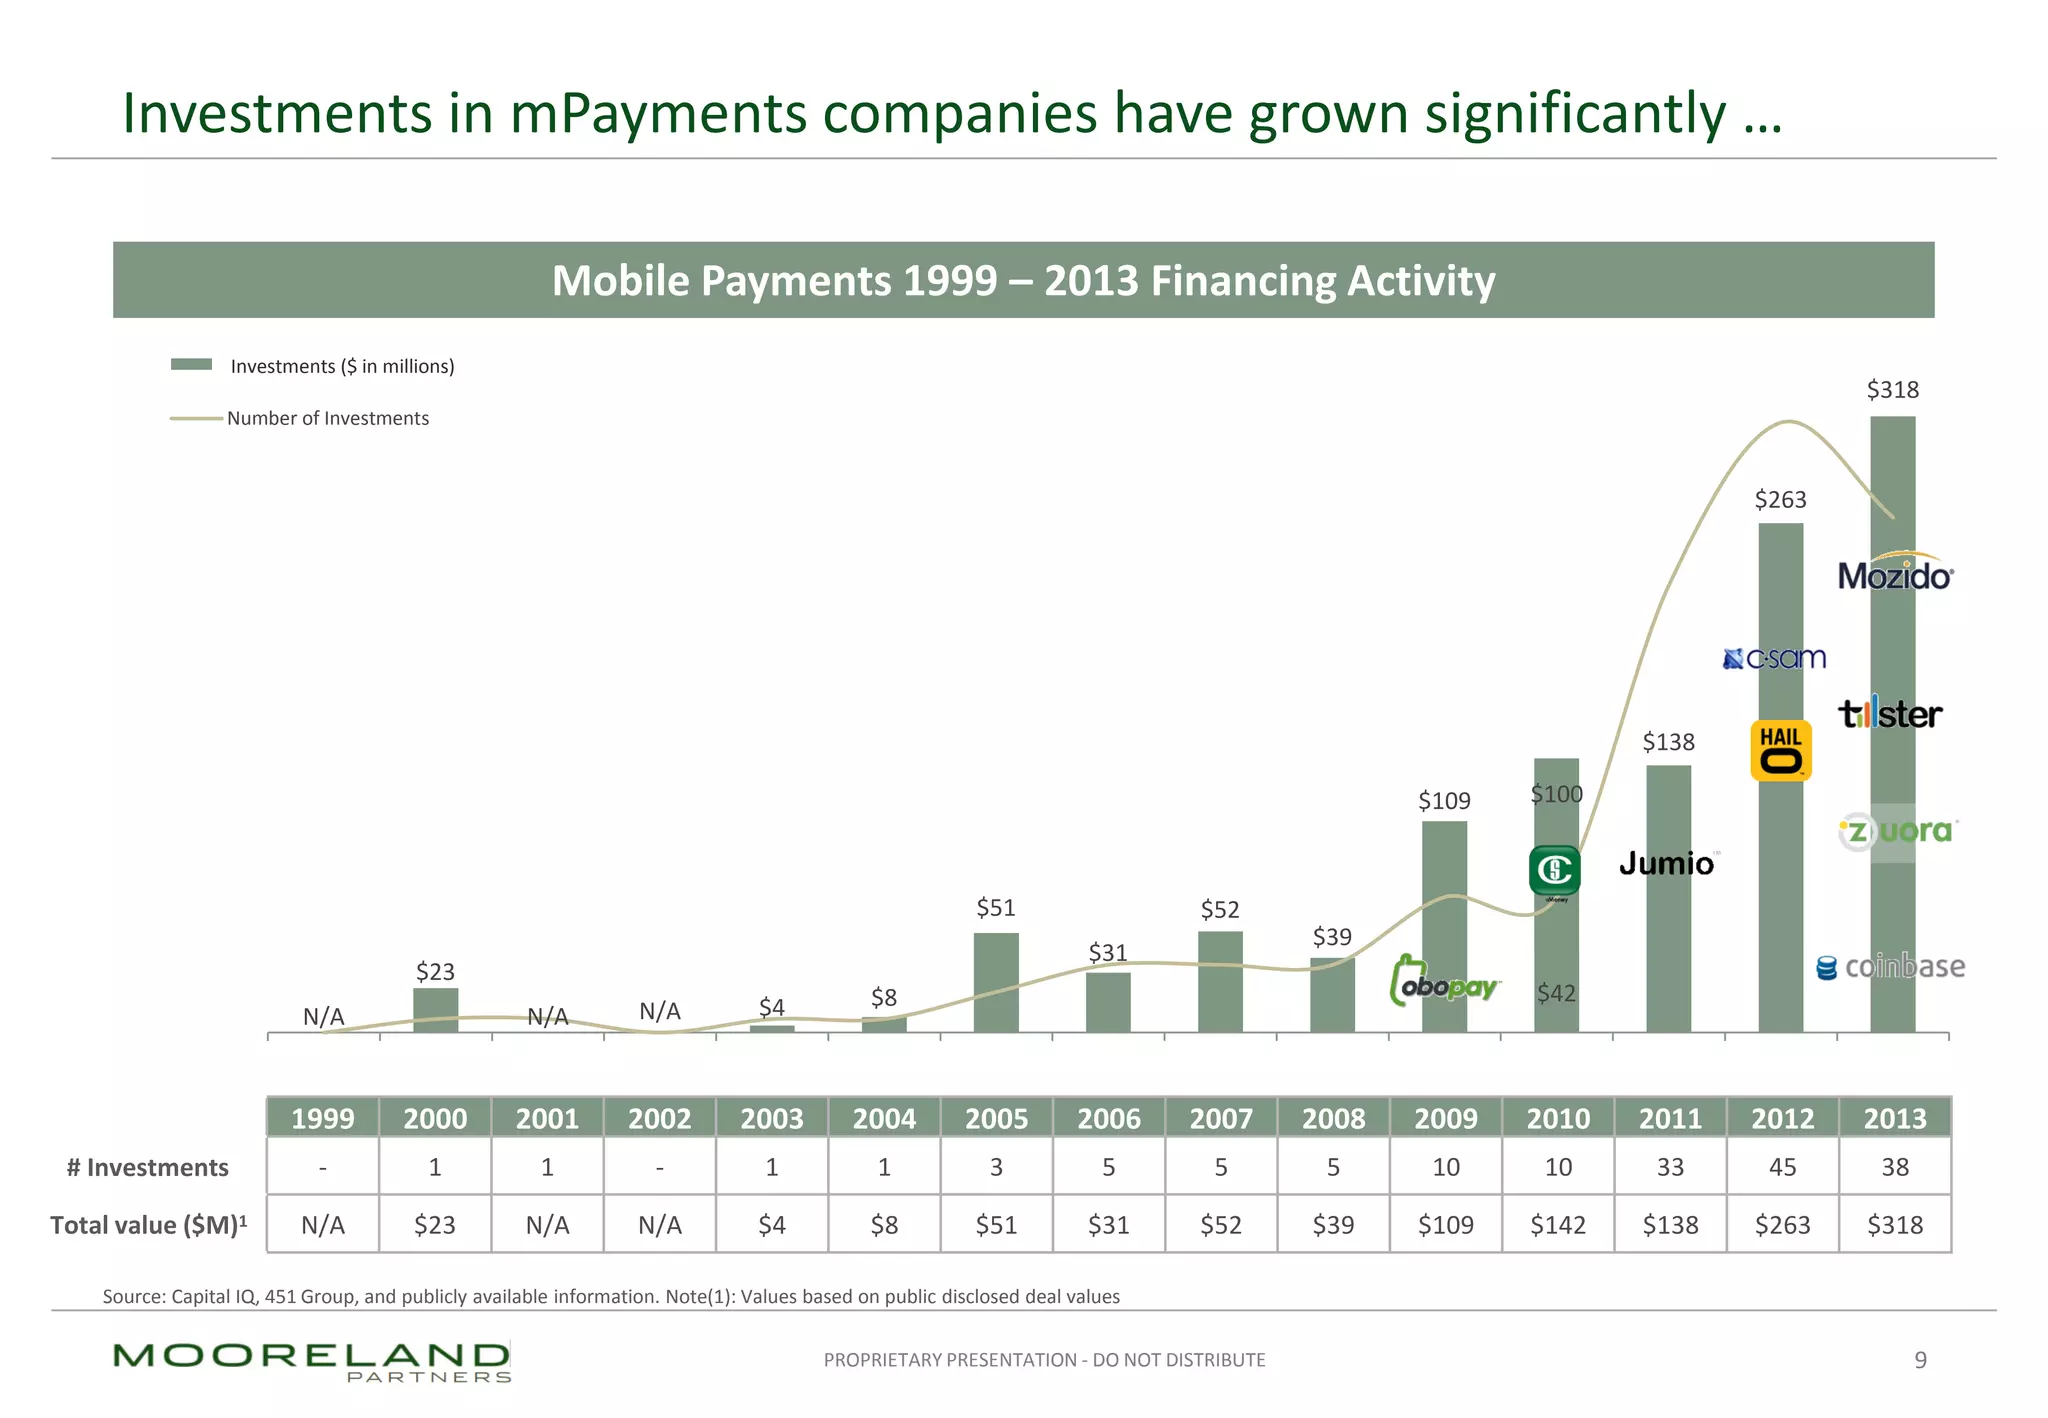
PROPRIETARY PRESENTATION - DO NOT DISTRIBUTE
The Future of Payments
Consumer Mobile Payment & Wallet
Applications
April 2014
PROPRIETARY PRESENTATION - DO NOT DISTRIBUTE
Contents
 Mobile Payments Market Dynamics
 mPayment Landscape and Ecosystem
 Mooreland’s Perspective on NFC
 mPayment Investment Activity
 mPayment M&A Transactions
 Mooreland Partners: Firm Profile
2
PROPRIETARY PRESENTATION - DO NOT DISTRIBUTE
 History of Unmet Expectations: Mobile payments
have been talked about for over a decade,
however, a lack of quality consumer technology
has slowed adoption
 Smartphone / Tablet as Catalyst: The proliferation
of smartphones and tablets is creating
opportunity for disruption across the entire
payments landscape/ecosystems
 Impact on the Whole Ecosystem: Payments are
intertwined with both Banking and Retail
solutions, so we need to examine all three
segments to form a complete picture of the
ecosystem
– mPayment: Solutions that enable the consumer to
transact and make payments using their mobile device
– Retail 2.0: Solutions, sold to Merchants, that enable
new ways to accept payments and converge online
and offline commerce to “Omnichannel” commerce
– Digital Banking: Solutions, sold to banks, that
enhance the “anywhere, anytime” consumer banking
experience (includes online and mobile banking)
Mobile Payments: Market is accelerating  the entire ecosystem is impacted
3
Retail 2.0
mPayment
Digital
Banking
• Mobile Wallet
• Merchant
Payment Apps
• Mobile Banking
• Internet Banking
• Mobile Money
Transfer
• Remote deposit
capture
• Mobile POS Terminals
• eCommerce Platforms
• Cloud/Tablet-based
POS Solutions
• Omnichannel
commerce
Dynamic Mobile Payments Ecosystem
PROPRIETARY PRESENTATION - DO NOT DISTRIBUTE
Mobile Payments: Illustrative Timeline
4
While mobile banking began to gain traction nearly a decade ago…
2004 2005 2006 2007 2008 2009 2010 2011 2012 2013
mPayments
Becoming more
Merchant-centric
while credentials
move from the
Secure Element to
the Cloud
Retail2.0
Moving
towards an
Omni-channel
SaaS solution
hosted in the
cloud
DigitalBanking
Moving towards
a completely
digital solution,
where branches
are less
important
…emerging retail solutions didn’t begin to establish themselves until ~2009 …
…and mobile payment adoption only began with the Starbucks App launch in 2011
PROPRIETARY PRESENTATION - DO NOT DISTRIBUTE
Significant growth is expected across all three segments …
5
Banking: Innovation is driving continued growth in mobile banking adoption
mPaymentsRetail2.0DigitalBanking
Retail: Massive opportunity as mPOS goes mainstream and OmniChannel disrupts
Mobile Payment: Innovations in Services and Contactless are accelerating growth
35
57
68
79 89 99
111
2010 2011 2012 2013 2014 2015 2016
 mBanking adoption
in US (million users):
– 13% CAGR 2012-
2017
Source: Fiserv, Javeline Strategy & Research
 In the US (and other developed markets) mobile
banking has become “table-stakes” and consumers are
gradually shifting behavior to use this technology
 Over 51% of mobile phone owners in US will use
mBanking by 20161
Note 1: Javelin Strategy & Research forecasts
Source: IHL Consulting - Mobile POS Hype to Reality
2013 2017
380% CAGR
 Use of handhelds for
Mobile POS:
– 380% CAGR 2013-
2017
 Square’s innovation has lead to a number of new
solutions that innovate in both use case and business
model
 Increased emphasis around Omni-channel commerce
solutions is driving new product development at major
POS and eCommerce platform vendors
 Mobile merchandise
purchase ($ in
billions):
– 38% CAGR 2012-
2017
 Contactless mobile payment is expected to hit $10
billion by 2018, representing a 35% CAGR over the next
six years2
 Loyalty, rewards, coupons, and mobile ordering services
build a consumer value proposition and will drive
adoption
$9 $20
$34
$51
$71
$97
$129
$168
2010 2011 2012 2013 2014 2015 2016 2017
Source: Gartner Note 2: Juniper Research forecasts
PROPRIETARY PRESENTATION - DO NOT DISTRIBUTE
Mobile Wallet market now driven by greater consumer and merchant adoption …
6
Key trends
 Wallet Providers: momentum shifting from Banks and
Mobile Operators to Retailers as the issuers of payment
applications
 Wallet credentials: shifting from Device to Cloud (HCE),
multi access platforms allow for cross-wallet synergies
 Critical Features: Beyond Payments, Value Added Services
(Loyalty / Fast Order/ Off-line Transactions / POS
Integration) are critical for driving consumer adoption
Hype Cycle: Mobile Wallet … showing signs of moving up the Slope of Enlightenment
(1) Transparency Market Research: "Mobile Wallet Market - Global Industry Analysis, Size, Share, Growth and Forecast, 2012 - 2018“ (2) Juniper Research: “NFC Mobile Payments Market Update”
2007: mPesa O
Technology
Trigger
Peak of Inflated
Expectations
Trough of
Disillusionment
Slope of
Enlightenment
Plateau of
Productivity
Visibility
O Jul. ‘12: Gartner
Hype Cycle
Jul. ‘11: Gartner O O Sep. ‘11: Google Wallet
Launch
Jan. ‘11: Starbucks Launch O
O Oct. ‘12: iPhone5
omits NFC
O
Feb. ‘13: Mobile is 5% of Starbucks transactions
O Mar. ‘13: Paypal: mobile = 10% of their TPV
O Sep. ‘13: McDonalds testing a mobile appNov. ‘12: ISIS pilots O
fall flat
Time
O Mar. ‘14: Mobile reaches 14% of Starbucks txns
PROPRIETARY PRESENTATION - DO NOT DISTRIBUTE
… resulting in various business models across the Mobile Wallet Landscape
Merchants are increasingly taking the lead role in mobile payment applications
7
Mobile Operators and Banks Merchants Consumer: Mobile
White Label Branded
Target
Customer
Consumer: Internet
Payment-Focused
Solutions
Loyalty,Promotionsand
Engagement-Focused
Solutions
PROPRIETARY PRESENTATION - DO NOT DISTRIBUTE
Mooreland’s Perspective: NFC adoption will accelerate in 2015
8
 The Mobile Operator … Becoming Less Relevant due to HCE (“Host Card Emulation”)
– The Secure Element (SE) is the key asset controlled by the mobile operator
– Recent upgrade to Android enables the NFC antenna to be accessed by the OS directly, without the SE
– This allows over the top (OTT) payment apps to utilize NFC capabilities in conjunction with a cloud-based SE
 The Mobile Operators can now be disintermediated from mobile payments
 Apple … Waiting for the stars to align
– Has typically not enabled features unless they believe that there will be a great user experience
– Apple prefers to have total control, thus they have avoided the payments discussion with the mobile operators
• Android is proving that NFC can be implemented without MNO involvement, critical for an Apple solution
 Apple will likely enable NFC on all their phones beginning with the iPhone 6
The mobile operator
creates friction in
the industry
There aren’t sufficient
NFC enabled
payment terminals
It will never happen if
it is not supported by
Apple
PERCIEVED ISSUES MOORELAND PERSPECTIVE
 BENEFICIARIES: Merchant-Centric Wallet technology vendors with NFC capabilities, Cloud-based credential solutions
 AT RISK: Companies without an EMV/NFC strategy, Mobile Operator-focused wallet vendors
 EMV … Impacting both POS Terminals and Card Issuers
– EMV is already driving a complete retrofit of merchant POS terminals
nationwide to accept NFC.
• Expected to be 75% complete by 2015 and 90% complete by 2017
– NFC be driven by ISSUERS seeking a low-cost solution for providing their
customers with EMV capabilities
• Issuing new chip & pin cards will cost the industry ~$2.5 billion, while
enabling mobile apps will be virtually free
Issuers will choose NFC-based mobile apps for their EMV strategy,
driving user adoption in 2015
275
416
575
797
939
1,170
2013 2014 2015 2016 2017 2018
34% CAGR
Source: HIS Inc., Feb-2014
Global NFC Handset Shipment
(millions)
PROPRIETARY PRESENTATION - DO NOT DISTRIBUTE
N/A
$23
N/A N/A $4 $8
$51
$31
$52
$39
$109
$42
$138
$263
$318
$100
0
5
10
15
20
25
30
35
40
45
50
$0
$50
$100
$150
$200
$250
$300
$350
1999
2000
2001
2002
2003
2004
2005
2006
2007
2008
2009
2010
2011
2012
2013
Investments <$100M ($ in millions)
Number of Investments
Investments in mPayments companies have grown significantly …
9
Mobile Payments 1999 – 2013 Financing Activity
Source: Capital IQ, 451 Group, and publicly available information. Note(1): Values based on public disclosed deal values
1999 2000 2001 2002 2003 2004 2005 2006 2007 2008 2009 2010 2011 2012 2013
# Investments - 1 1 - 1 1 3 5 5 5 10 10 33 45 38
Total value ($M)1 N/A $23 N/A N/A $4 $8 $51 $31 $52 $39 $109 $142 $138 $263 $318
Investments ($ in millions)
PROPRIETARY PRESENTATION - DO NOT DISTRIBUTE
$181
$96
$145
$244
$305 $240
$250
$795
$465
8
11
14
26
15
2009 2010 2011 2012 2013
… while M&A activity is just beginning to accelerate …
10
Significant Transactions Value ($M)
Number of Transactions
Transaction Value <$200M ($M)
Mobile Payments M&A Transaction and Marquee Deals 2009 – 20131
Source: Capital IQ, Group 451
Note (1): Deal values on disclosed valuation
PROPRIETARY PRESENTATION - DO NOT DISTRIBUTE
…with recent M&A activity centered around filling technology gaps
11
* Mooreland Estimate
Acquirer Target Category Date Transaction Size (EV) EV/Revenue
Feb-2014 Confidential Confidential
Oct-2013 NA NA
Aug-2013 $795m 3.0x
Jun-2013 $11m NA
Feb-2013 $175m 1.4x
Oct-2012 Confidential Confidential
Aug-2012 $26.2m 7.3x*
Jul-2012 $50m NA
Apr-2012 ~$225m* Confidential
Apr-2011 NA NA
Mobile Wallet Platform
Mobile Payments
Digital Wallet
TSM
P2P Payments
TSM
Wallet Platform
mPayments Software
Digital Wallet
PROPRIETARY PRESENTATION - DO NOT DISTRIBUTE
Mooreland in Brief
Technology Focused
Digital Media & Internet | Enterprise Software
Communications & Mobility | Industrial Technology
100% Partner
Owned
Founded 2002
One Global P&L
Global Reach
Serving European, North American, and Asian
markets from offices in Silicon Valley,
New York, and London
Team of 40+
13 Nationalities
10 Languages Spoken
53 Deals
Since January 2012,
Ranked #1 in Mid-Market
Technology M&A
Unrivalled Experience
1,000+
Deals Closed by
Senior Bankers
12
Mooreland is one of the most active tech focused M&A advisory firms in the world – differentiated by deep
sector knowledge, tier 1 buyer relationships, and a collaborative business model.
www.moorelandpartners.com
SILICON VALLEY
950 Tower Lane, Suite 1950
Foster City, CA 94404
Tel: +1 (650) 330-3790
NEW YORK
537 Steamboat Road, Suite 200
Greenwich, CT 06830
Tel: +1 (203) 629-4400
LONDON
2-4 King Street,
London SW1Y 6QL,
Tel: +44 (0)20 7016 3380

Future of Payments - Wallets (April 2014)

  • 1.
    PROPRIETARY PRESENTATION -DO NOT DISTRIBUTE The Future of Payments Consumer Mobile Payment & Wallet Applications April 2014
  • 2.
    PROPRIETARY PRESENTATION -DO NOT DISTRIBUTE Contents  Mobile Payments Market Dynamics  mPayment Landscape and Ecosystem  Mooreland’s Perspective on NFC  mPayment Investment Activity  mPayment M&A Transactions  Mooreland Partners: Firm Profile 2
  • 3.
    PROPRIETARY PRESENTATION -DO NOT DISTRIBUTE  History of Unmet Expectations: Mobile payments have been talked about for over a decade, however, a lack of quality consumer technology has slowed adoption  Smartphone / Tablet as Catalyst: The proliferation of smartphones and tablets is creating opportunity for disruption across the entire payments landscape/ecosystems  Impact on the Whole Ecosystem: Payments are intertwined with both Banking and Retail solutions, so we need to examine all three segments to form a complete picture of the ecosystem – mPayment: Solutions that enable the consumer to transact and make payments using their mobile device – Retail 2.0: Solutions, sold to Merchants, that enable new ways to accept payments and converge online and offline commerce to “Omnichannel” commerce – Digital Banking: Solutions, sold to banks, that enhance the “anywhere, anytime” consumer banking experience (includes online and mobile banking) Mobile Payments: Market is accelerating  the entire ecosystem is impacted 3 Retail 2.0 mPayment Digital Banking • Mobile Wallet • Merchant Payment Apps • Mobile Banking • Internet Banking • Mobile Money Transfer • Remote deposit capture • Mobile POS Terminals • eCommerce Platforms • Cloud/Tablet-based POS Solutions • Omnichannel commerce Dynamic Mobile Payments Ecosystem
  • 4.
    PROPRIETARY PRESENTATION -DO NOT DISTRIBUTE Mobile Payments: Illustrative Timeline 4 While mobile banking began to gain traction nearly a decade ago… 2004 2005 2006 2007 2008 2009 2010 2011 2012 2013 mPayments Becoming more Merchant-centric while credentials move from the Secure Element to the Cloud Retail2.0 Moving towards an Omni-channel SaaS solution hosted in the cloud DigitalBanking Moving towards a completely digital solution, where branches are less important …emerging retail solutions didn’t begin to establish themselves until ~2009 … …and mobile payment adoption only began with the Starbucks App launch in 2011
  • 5.
    PROPRIETARY PRESENTATION -DO NOT DISTRIBUTE Significant growth is expected across all three segments … 5 Banking: Innovation is driving continued growth in mobile banking adoption mPaymentsRetail2.0DigitalBanking Retail: Massive opportunity as mPOS goes mainstream and OmniChannel disrupts Mobile Payment: Innovations in Services and Contactless are accelerating growth 35 57 68 79 89 99 111 2010 2011 2012 2013 2014 2015 2016  mBanking adoption in US (million users): – 13% CAGR 2012- 2017 Source: Fiserv, Javeline Strategy & Research  In the US (and other developed markets) mobile banking has become “table-stakes” and consumers are gradually shifting behavior to use this technology  Over 51% of mobile phone owners in US will use mBanking by 20161 Note 1: Javelin Strategy & Research forecasts Source: IHL Consulting - Mobile POS Hype to Reality 2013 2017 380% CAGR  Use of handhelds for Mobile POS: – 380% CAGR 2013- 2017  Square’s innovation has lead to a number of new solutions that innovate in both use case and business model  Increased emphasis around Omni-channel commerce solutions is driving new product development at major POS and eCommerce platform vendors  Mobile merchandise purchase ($ in billions): – 38% CAGR 2012- 2017  Contactless mobile payment is expected to hit $10 billion by 2018, representing a 35% CAGR over the next six years2  Loyalty, rewards, coupons, and mobile ordering services build a consumer value proposition and will drive adoption $9 $20 $34 $51 $71 $97 $129 $168 2010 2011 2012 2013 2014 2015 2016 2017 Source: Gartner Note 2: Juniper Research forecasts
  • 6.
    PROPRIETARY PRESENTATION -DO NOT DISTRIBUTE Mobile Wallet market now driven by greater consumer and merchant adoption … 6 Key trends  Wallet Providers: momentum shifting from Banks and Mobile Operators to Retailers as the issuers of payment applications  Wallet credentials: shifting from Device to Cloud (HCE), multi access platforms allow for cross-wallet synergies  Critical Features: Beyond Payments, Value Added Services (Loyalty / Fast Order/ Off-line Transactions / POS Integration) are critical for driving consumer adoption Hype Cycle: Mobile Wallet … showing signs of moving up the Slope of Enlightenment (1) Transparency Market Research: "Mobile Wallet Market - Global Industry Analysis, Size, Share, Growth and Forecast, 2012 - 2018“ (2) Juniper Research: “NFC Mobile Payments Market Update” 2007: mPesa O Technology Trigger Peak of Inflated Expectations Trough of Disillusionment Slope of Enlightenment Plateau of Productivity Visibility O Jul. ‘12: Gartner Hype Cycle Jul. ‘11: Gartner O O Sep. ‘11: Google Wallet Launch Jan. ‘11: Starbucks Launch O O Oct. ‘12: iPhone5 omits NFC O Feb. ‘13: Mobile is 5% of Starbucks transactions O Mar. ‘13: Paypal: mobile = 10% of their TPV O Sep. ‘13: McDonalds testing a mobile appNov. ‘12: ISIS pilots O fall flat Time O Mar. ‘14: Mobile reaches 14% of Starbucks txns
  • 7.
    PROPRIETARY PRESENTATION -DO NOT DISTRIBUTE … resulting in various business models across the Mobile Wallet Landscape Merchants are increasingly taking the lead role in mobile payment applications 7 Mobile Operators and Banks Merchants Consumer: Mobile White Label Branded Target Customer Consumer: Internet Payment-Focused Solutions Loyalty,Promotionsand Engagement-Focused Solutions
  • 8.
    PROPRIETARY PRESENTATION -DO NOT DISTRIBUTE Mooreland’s Perspective: NFC adoption will accelerate in 2015 8  The Mobile Operator … Becoming Less Relevant due to HCE (“Host Card Emulation”) – The Secure Element (SE) is the key asset controlled by the mobile operator – Recent upgrade to Android enables the NFC antenna to be accessed by the OS directly, without the SE – This allows over the top (OTT) payment apps to utilize NFC capabilities in conjunction with a cloud-based SE  The Mobile Operators can now be disintermediated from mobile payments  Apple … Waiting for the stars to align – Has typically not enabled features unless they believe that there will be a great user experience – Apple prefers to have total control, thus they have avoided the payments discussion with the mobile operators • Android is proving that NFC can be implemented without MNO involvement, critical for an Apple solution  Apple will likely enable NFC on all their phones beginning with the iPhone 6 The mobile operator creates friction in the industry There aren’t sufficient NFC enabled payment terminals It will never happen if it is not supported by Apple PERCIEVED ISSUES MOORELAND PERSPECTIVE  BENEFICIARIES: Merchant-Centric Wallet technology vendors with NFC capabilities, Cloud-based credential solutions  AT RISK: Companies without an EMV/NFC strategy, Mobile Operator-focused wallet vendors  EMV … Impacting both POS Terminals and Card Issuers – EMV is already driving a complete retrofit of merchant POS terminals nationwide to accept NFC. • Expected to be 75% complete by 2015 and 90% complete by 2017 – NFC be driven by ISSUERS seeking a low-cost solution for providing their customers with EMV capabilities • Issuing new chip & pin cards will cost the industry ~$2.5 billion, while enabling mobile apps will be virtually free Issuers will choose NFC-based mobile apps for their EMV strategy, driving user adoption in 2015 275 416 575 797 939 1,170 2013 2014 2015 2016 2017 2018 34% CAGR Source: HIS Inc., Feb-2014 Global NFC Handset Shipment (millions)
  • 9.
    PROPRIETARY PRESENTATION -DO NOT DISTRIBUTE N/A $23 N/A N/A $4 $8 $51 $31 $52 $39 $109 $42 $138 $263 $318 $100 0 5 10 15 20 25 30 35 40 45 50 $0 $50 $100 $150 $200 $250 $300 $350 1999 2000 2001 2002 2003 2004 2005 2006 2007 2008 2009 2010 2011 2012 2013 Investments <$100M ($ in millions) Number of Investments Investments in mPayments companies have grown significantly … 9 Mobile Payments 1999 – 2013 Financing Activity Source: Capital IQ, 451 Group, and publicly available information. Note(1): Values based on public disclosed deal values 1999 2000 2001 2002 2003 2004 2005 2006 2007 2008 2009 2010 2011 2012 2013 # Investments - 1 1 - 1 1 3 5 5 5 10 10 33 45 38 Total value ($M)1 N/A $23 N/A N/A $4 $8 $51 $31 $52 $39 $109 $142 $138 $263 $318 Investments ($ in millions)
  • 10.
    PROPRIETARY PRESENTATION -DO NOT DISTRIBUTE $181 $96 $145 $244 $305 $240 $250 $795 $465 8 11 14 26 15 2009 2010 2011 2012 2013 … while M&A activity is just beginning to accelerate … 10 Significant Transactions Value ($M) Number of Transactions Transaction Value <$200M ($M) Mobile Payments M&A Transaction and Marquee Deals 2009 – 20131 Source: Capital IQ, Group 451 Note (1): Deal values on disclosed valuation
  • 11.
    PROPRIETARY PRESENTATION -DO NOT DISTRIBUTE …with recent M&A activity centered around filling technology gaps 11 * Mooreland Estimate Acquirer Target Category Date Transaction Size (EV) EV/Revenue Feb-2014 Confidential Confidential Oct-2013 NA NA Aug-2013 $795m 3.0x Jun-2013 $11m NA Feb-2013 $175m 1.4x Oct-2012 Confidential Confidential Aug-2012 $26.2m 7.3x* Jul-2012 $50m NA Apr-2012 ~$225m* Confidential Apr-2011 NA NA Mobile Wallet Platform Mobile Wallet Platform Mobile Payments Digital Wallet TSM P2P Payments TSM Wallet Platform mPayments Software Digital Wallet
  • 12.
    PROPRIETARY PRESENTATION -DO NOT DISTRIBUTE Mooreland in Brief Technology Focused Digital Media & Internet | Enterprise Software Communications & Mobility | Industrial Technology 100% Partner Owned Founded 2002 One Global P&L Global Reach Serving European, North American, and Asian markets from offices in Silicon Valley, New York, and London Team of 40+ 13 Nationalities 10 Languages Spoken 53 Deals Since January 2012, Ranked #1 in Mid-Market Technology M&A Unrivalled Experience 1,000+ Deals Closed by Senior Bankers 12 Mooreland is one of the most active tech focused M&A advisory firms in the world – differentiated by deep sector knowledge, tier 1 buyer relationships, and a collaborative business model.
  • 13.
    www.moorelandpartners.com SILICON VALLEY 950 TowerLane, Suite 1950 Foster City, CA 94404 Tel: +1 (650) 330-3790 NEW YORK 537 Steamboat Road, Suite 200 Greenwich, CT 06830 Tel: +1 (203) 629-4400 LONDON 2-4 King Street, London SW1Y 6QL, Tel: +44 (0)20 7016 3380