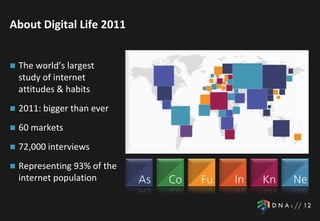
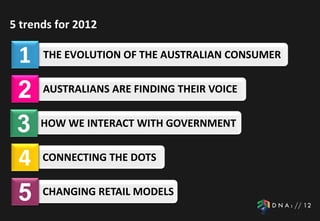
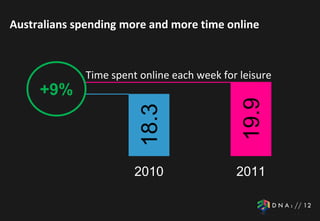
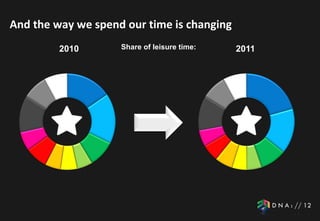
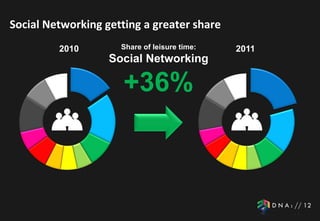
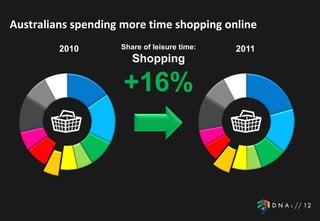
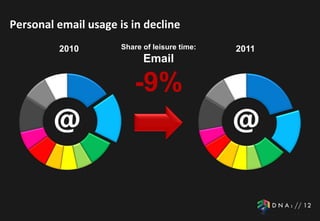
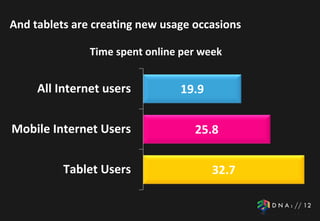
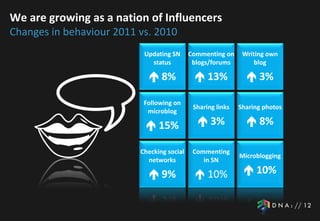
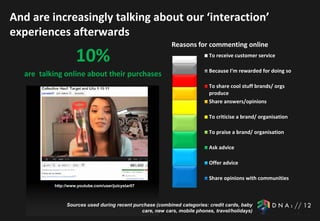
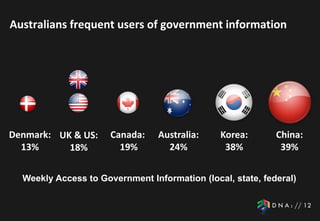
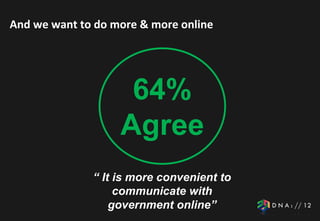
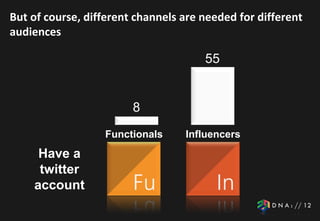
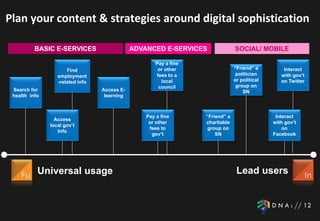
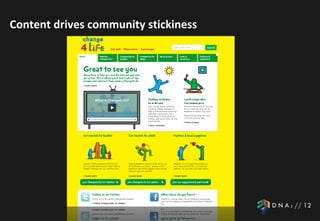
PERTH


The Evolving Online Consumer
                  Jonathan Sinton
                     TNS Australia
About Digital Life 2011


   The world’s largest
    study of internet
    attitudes & habits
   2011: bigger than ever
   60 markets
   72,000 interviews
   Representing 93% of the
    internet population
5 trends for 2012

 1    THE EVOLUTION OF THE AUSTRALIAN CONSUMER


 2    AUSTRALIANS ARE FINDING THEIR VOICE


 3    HOW WE INTERACT WITH GOVERNMENT


 4    CONNECTING THE DOTS


 5    CHANGING RETAIL MODELS
Australians spending more and more time online


              Time spent online each week for leisure
     +9%


                                               19.9
                         18.3
                        2010                 2011
And the way we spend our time is changing
         2010       Share of leisure time:   2011
Social Networking getting a greater share
         2010        Share of leisure time:   2011
                   Social Networking

                      +36%
Australians spending more time shopping online
         2010       Share of leisure time:   2011
                       Shopping

                     +16%
Personal email usage is in decline
         2010         Share of leisure time:   2011
                            Email

                         -9%
And the way we consume news is changing
        2010         Share of leisure time:   2011
               News, Sport & Weather sites

                       -13%
The base of mobile web users is increasing rapidly


               Using Mobile Web in the past 4 weeks


     +85%


                                              37
                         20
                        2010                2011
And our reliance on our mobiles is growing


              Average Time using Mobile Web each week
     +10%


                                               4.4
                         4
                        2010                 2011
Tablets are becoming more common

              Penetration of tablets in Household


   +188%


                                             23
                       8
                      2010                 2011
And tablets are creating new usage occasions

               Time spent online per week


     All Internet users         19.9


Mobile Internet Users              25.8


          Tablet Users                 32.7
Our view of the digital world
TNS Digital Life


                   http://2010.tnsdigitallife.com/an-intro-to-the-digital-lifestyles/
As behaviour changes, segments alter


                26

                             20        19        19


                                            10
                       6


 2010
As behaviour changes, segments alter


                27
                                                25


                             16        16


                       8                    8


 2011
In essence, our daily lives are evolving
                           2011
The 2 Speed Digital Community
                   Increase in usage since 2010
                                                         +10%
                                                         + 2 Hrs 49 mins


                        +5%
                        + 35 Mins


          Functionals                      Influencers


              Total growth in weekly hours (2011)
              Growth in weekly hours - mobile (2011)
              Weekly hours online (2010)
The 2 ends of the spectrum
 PC users going online                      Mobile users going online                   Tablet users going online


       In bed when
       In bed when     Early    Commuting    Late     Midday      Early       Late      Early    Late evening  In bed
                                                                                                               In bed      During the
       I wake up in
       I wake up in   morning
                       Early                morning
                                             Late              afternoon
                                                                  Early    afternoon
                                                                              Late     evening
                                                                                        Early                before I go
                                                                                                             before I go     night
                                                                                                                           During the
       the morning
       the morning    morning   Commuting   morning   Midday   afternoon   afternoon   evening                to sleep
                                                                                                 Late evening to sleep       night
We are growing as a nation of Influencers
Changes in behaviour 2011 vs. 2010
                           Updating SN      Commenting on     Writing own
                             status          blogs/forums         blog

                             8%              13%              3%

                           Following on
                                             Sharing links   Sharing photos
                            microblog

                            15%               3%              8%

                          Checking social    Commenting
                                                             Microblogging
                            networks            in SN

                             9%              10%             10%
And are increasingly talking about our ‘interaction’
experiences afterwards
                                                          Reasons for commenting online
                    10%                                                   To receive customer service

                                                                          Because I’m rewarded for doing so
  are talking online about their purchases
                                                                          To share cool stuff brands/ orgs
                                                                          produce
                                                                          Share answers/opinions

                                                                          To criticise a brand/ organisation

                                                                          To praise a brand/ organisation

                                                                          Ask advice

                                                                          Offer advice

                                                                          Share opinions with communities
          http://www.youtube.com/user/juicystar07


               Sources used during recent purchase (combined categories: credit cards, baby
                                             care, new cars, mobile phones, travel/holidays)
Australians frequent users of government information


Denmark: UK & US:     Canada:    Australia:    Korea:       China:
  13%      18%          19%        24%          38%          39%


  Weekly Access to Government Information (local, state, federal)
And we want to do more & more online


                    64%
                   Agree
              “ It is more convenient to
                   communicate with
                  government online”
But of course, different channels are needed for different
audiences

                                      55


                        8
                  Functionals     Influencers
     Have a
     twitter
    account
Plan your content & strategies around digital sophistication

          BASIC E-SERVICES                    ADVANCED E-SERVICES               SOCIAL/ MOBILE

                                                      Pay a fine
                      Find                             or other                 “Friend” a         Interact
                  employment                          fees to a                  politician       with gov’t
                  -related info                         local                   or political      on Twitter
                                                       council                   group on
 Search for                       Access E-                                         SN
 health info                       learning


                                                  Pay a fine       “Friend” a                   Interact
                 Access
                                                   or other        charitable                  with gov’t
               local gov’t
                                                   fees to          group on                       on
                  Info
                                                    gov’t              SN                      Facebook


           Universal usage                                                       Lead users
Content drives community stickiness
Engagement via content: Childline


                  http://www.youtube.com/watch?v=mWChU3JxGvo
Online and Offline being used equally during
path to purchase

           Online                           78%
         Touchpoints                                                 70%                      65%


                                   New product                   Product/                     Purchase
         Purchase                   awareness                  brand choice                   location


           Offline                                                   64%                      68%
                                            75%
         Touchpoints
Average number of touchpoints                6.0                     5.1                      4.1
              Sources used during recent purchase (combined categories: credit cards, baby
                                            care, new cars, mobile phones, travel/holidays)
Mobile is the glue to connect the dots

                                            When use mobile web
                                                                Find out more
                                  Find product    Listening
                                                                about product
         68%                      info in store    to radio       advertised

                                    58%            31%            42%
        Agree
                                                    Reading
                                 While watching                While shopping
                                                  newspaper/
                                       TV          magazine       in store
 “ With my mobile, I feel that
  I am 'always connected' to        51%            23%            55%
          the Internet”
True online-offline integration


                    http://www.youtube.com/watch?v=fGaVFRzTTP4
We’ve all seen the headlines
Egypt
                                 Indonesia
                                Philippines
                                   Nigeria
                                     Kenya
                                   Uganda
                               South Africa
                                  Tanzania
                                   Estonia
                                   Finland
                                    Russia
                                   Mexico
                                   Sweden
                                     Brazil
                                  Denmark
                                   Norway
                                   Belgium
                                      India
                               LUXEMBURG
                                  Portugal
                                     Japan
                                    Austria
                                   Canada
                                    France
                               Netherlands
Frequency of Online Shopping


                                    Poland
                                     Spain
                                Hong Kong
                                  Malaysia
                                              Australia is becoming an eCommerce leader


                                      Italy
                                     Israel
                                    Turkey
                                   Greece
                                     China
                                      USA
                                        UK
                                  Australia
                                 Singapore
                               South Korea
Increasingly Fragmented Online Media Environment


                                                   Brand / Manufacturer Site, 4.5%


                                                   Online retailer, 5.6%
Offline sales, 83.2

                                                   C2C site / Auction site, 3.1%
                                                   Group buying / Daily Deals site, 1.6%
                                                   Other online site, 2.0%


             Share Of Sales Across 34 categories
Group Buying & Daily Deal sites are gaining Momentum

        Clothes & Shoes
                                                        48
  Computer peripherals
                                    22
    Cleaning/household
         products
   Cosmetics/facial care
        products
                                 Have used        Have heard of
      Skin care products
                                         Use of Sites
         Mobile phones

                                             32               28
               Software
                            18                    19    18
                                    11
    Alcoholic Beverages

TV (LCD, 3D, Plasma, LED
          etc)

      PC/Laptop/Tablet
                                  Use of Sites by segment
       Categories shopped
The Domination of eBay

              Clothes & Shoes

               Movies (DVDs)

        Computer peripherals
                                          21
                  Music (CDs)

Cosmetics/facial care products

            Skin care products

                     Software

            Hair care products

               Mobile gadget

        Camera (still & video)
                                     Check Daily

            Categories shopped   People visiting eBay
4 ways to respond


           Global Pricing   Embrace


            Collaborate     Add Value
2 speed digital
community:
Understand your
target’s needs and
behaviours
Ensure
everything
you do is
joined up
Keep a constant
eye on the future
as technology
and media
consumption are
changing rapidly
PERTH


The Evolving Online Consumer
                  Jonathan Sinton
                     TNS Australia

The Evolving Online Consumer

  • 1.
    PERTH The Evolving OnlineConsumer Jonathan Sinton TNS Australia
  • 2.
    About Digital Life2011  The world’s largest study of internet attitudes & habits  2011: bigger than ever  60 markets  72,000 interviews  Representing 93% of the internet population
  • 3.
    5 trends for2012 1 THE EVOLUTION OF THE AUSTRALIAN CONSUMER 2 AUSTRALIANS ARE FINDING THEIR VOICE 3 HOW WE INTERACT WITH GOVERNMENT 4 CONNECTING THE DOTS 5 CHANGING RETAIL MODELS
  • 5.
    Australians spending moreand more time online Time spent online each week for leisure +9% 19.9 18.3 2010 2011
  • 6.
    And the waywe spend our time is changing 2010 Share of leisure time: 2011
  • 7.
    Social Networking gettinga greater share 2010 Share of leisure time: 2011 Social Networking +36%
  • 8.
    Australians spending moretime shopping online 2010 Share of leisure time: 2011 Shopping +16%
  • 9.
    Personal email usageis in decline 2010 Share of leisure time: 2011 Email -9%
  • 10.
    And the waywe consume news is changing 2010 Share of leisure time: 2011 News, Sport & Weather sites -13%
  • 11.
    The base ofmobile web users is increasing rapidly Using Mobile Web in the past 4 weeks +85% 37 20 2010 2011
  • 12.
    And our relianceon our mobiles is growing Average Time using Mobile Web each week +10% 4.4 4 2010 2011
  • 13.
    Tablets are becomingmore common Penetration of tablets in Household +188% 23 8 2010 2011
  • 14.
    And tablets arecreating new usage occasions Time spent online per week All Internet users 19.9 Mobile Internet Users 25.8 Tablet Users 32.7
  • 16.
    Our view ofthe digital world TNS Digital Life http://2010.tnsdigitallife.com/an-intro-to-the-digital-lifestyles/
  • 17.
    As behaviour changes,segments alter 26 20 19 19 10 6 2010
  • 18.
    As behaviour changes,segments alter 27 25 16 16 8 8 2011
  • 19.
    In essence, ourdaily lives are evolving 2011
  • 20.
    The 2 SpeedDigital Community Increase in usage since 2010 +10% + 2 Hrs 49 mins +5% + 35 Mins Functionals Influencers Total growth in weekly hours (2011) Growth in weekly hours - mobile (2011) Weekly hours online (2010)
  • 21.
    The 2 endsof the spectrum PC users going online Mobile users going online Tablet users going online In bed when In bed when Early Commuting Late Midday Early Late Early Late evening In bed In bed During the I wake up in I wake up in morning Early morning Late afternoon Early afternoon Late evening Early before I go before I go night During the the morning the morning morning Commuting morning Midday afternoon afternoon evening to sleep Late evening to sleep night
  • 22.
    We are growingas a nation of Influencers Changes in behaviour 2011 vs. 2010 Updating SN Commenting on Writing own status blogs/forums blog  8%  13%  3% Following on Sharing links Sharing photos microblog  15%  3%  8% Checking social Commenting Microblogging networks in SN  9%  10%  10%
  • 23.
    And are increasinglytalking about our ‘interaction’ experiences afterwards Reasons for commenting online 10% To receive customer service Because I’m rewarded for doing so are talking online about their purchases To share cool stuff brands/ orgs produce Share answers/opinions To criticise a brand/ organisation To praise a brand/ organisation Ask advice Offer advice Share opinions with communities http://www.youtube.com/user/juicystar07 Sources used during recent purchase (combined categories: credit cards, baby care, new cars, mobile phones, travel/holidays)
  • 25.
    Australians frequent usersof government information Denmark: UK & US: Canada: Australia: Korea: China: 13% 18% 19% 24% 38% 39% Weekly Access to Government Information (local, state, federal)
  • 26.
    And we wantto do more & more online 64% Agree “ It is more convenient to communicate with government online”
  • 27.
    But of course,different channels are needed for different audiences 55 8 Functionals Influencers Have a twitter account
  • 28.
    Plan your content& strategies around digital sophistication BASIC E-SERVICES ADVANCED E-SERVICES SOCIAL/ MOBILE Pay a fine Find or other “Friend” a Interact employment fees to a politician with gov’t -related info local or political on Twitter council group on Search for Access E- SN health info learning Pay a fine “Friend” a Interact Access or other charitable with gov’t local gov’t fees to group on on Info gov’t SN Facebook Universal usage Lead users
  • 29.
  • 30.
    Engagement via content:Childline http://www.youtube.com/watch?v=mWChU3JxGvo
  • 32.
    Online and Offlinebeing used equally during path to purchase Online 78% Touchpoints 70% 65% New product Product/ Purchase Purchase awareness brand choice location Offline 64% 68% 75% Touchpoints Average number of touchpoints 6.0 5.1 4.1 Sources used during recent purchase (combined categories: credit cards, baby care, new cars, mobile phones, travel/holidays)
  • 33.
    Mobile is theglue to connect the dots When use mobile web Find out more Find product Listening about product 68% info in store to radio advertised 58% 31% 42% Agree Reading While watching While shopping newspaper/ TV magazine in store “ With my mobile, I feel that I am 'always connected' to 51% 23% 55% the Internet”
  • 34.
    True online-offline integration http://www.youtube.com/watch?v=fGaVFRzTTP4
  • 36.
    We’ve all seenthe headlines
  • 37.
    Egypt Indonesia Philippines Nigeria Kenya Uganda South Africa Tanzania Estonia Finland Russia Mexico Sweden Brazil Denmark Norway Belgium India LUXEMBURG Portugal Japan Austria Canada France Netherlands Frequency of Online Shopping Poland Spain Hong Kong Malaysia Australia is becoming an eCommerce leader Italy Israel Turkey Greece China USA UK Australia Singapore South Korea
  • 38.
    Increasingly Fragmented OnlineMedia Environment Brand / Manufacturer Site, 4.5% Online retailer, 5.6% Offline sales, 83.2 C2C site / Auction site, 3.1% Group buying / Daily Deals site, 1.6% Other online site, 2.0% Share Of Sales Across 34 categories
  • 39.
    Group Buying &Daily Deal sites are gaining Momentum Clothes & Shoes 48 Computer peripherals 22 Cleaning/household products Cosmetics/facial care products Have used Have heard of Skin care products Use of Sites Mobile phones 32 28 Software 18 19 18 11 Alcoholic Beverages TV (LCD, 3D, Plasma, LED etc) PC/Laptop/Tablet Use of Sites by segment Categories shopped
  • 40.
    The Domination ofeBay Clothes & Shoes Movies (DVDs) Computer peripherals 21 Music (CDs) Cosmetics/facial care products Skin care products Software Hair care products Mobile gadget Camera (still & video) Check Daily Categories shopped People visiting eBay
  • 41.
    4 ways torespond Global Pricing Embrace Collaborate Add Value
  • 42.
    2 speed digital community: Understandyour target’s needs and behaviours
  • 43.
  • 44.
    Keep a constant eyeon the future as technology and media consumption are changing rapidly
  • 45.
    PERTH The Evolving OnlineConsumer Jonathan Sinton TNS Australia