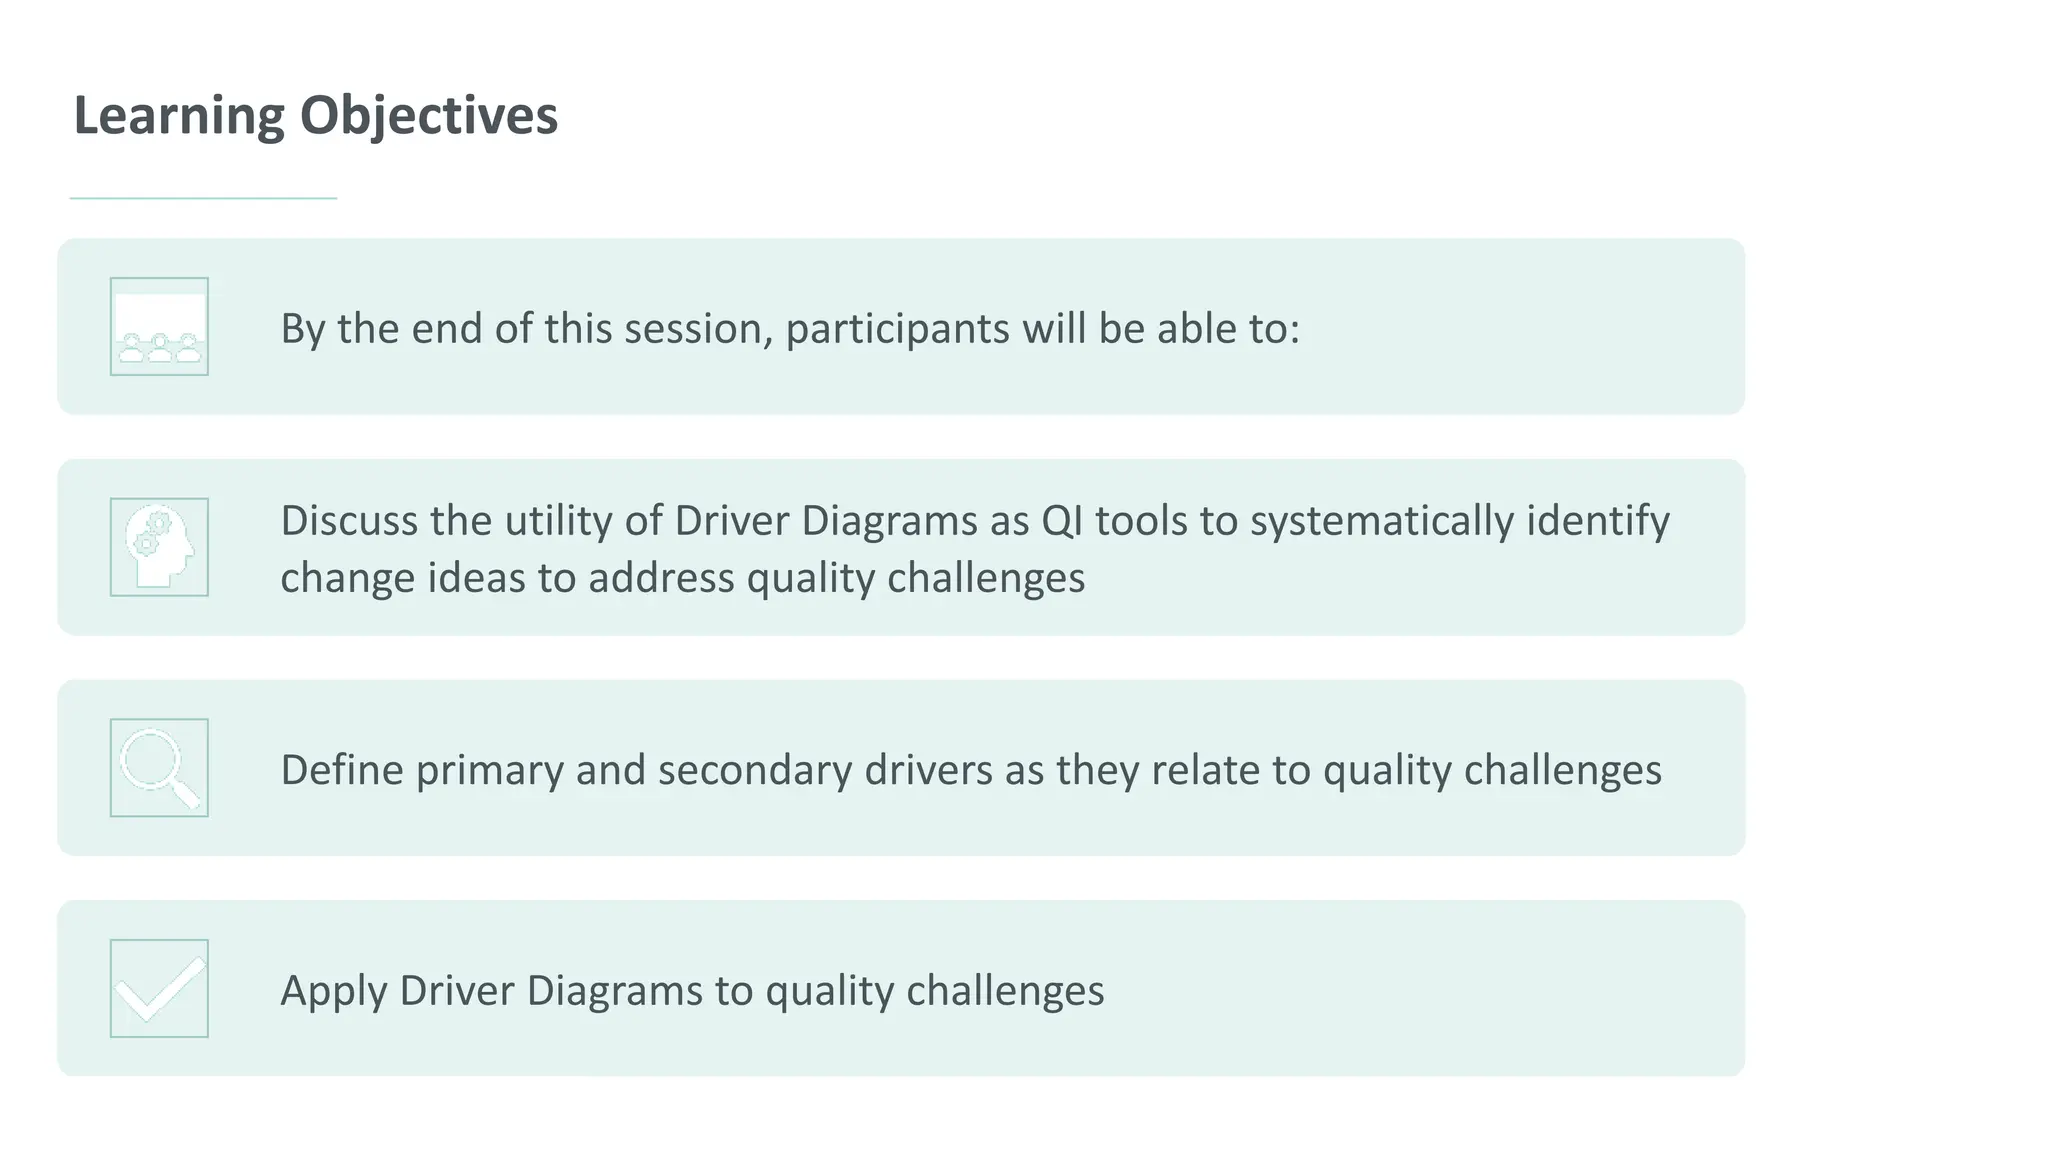
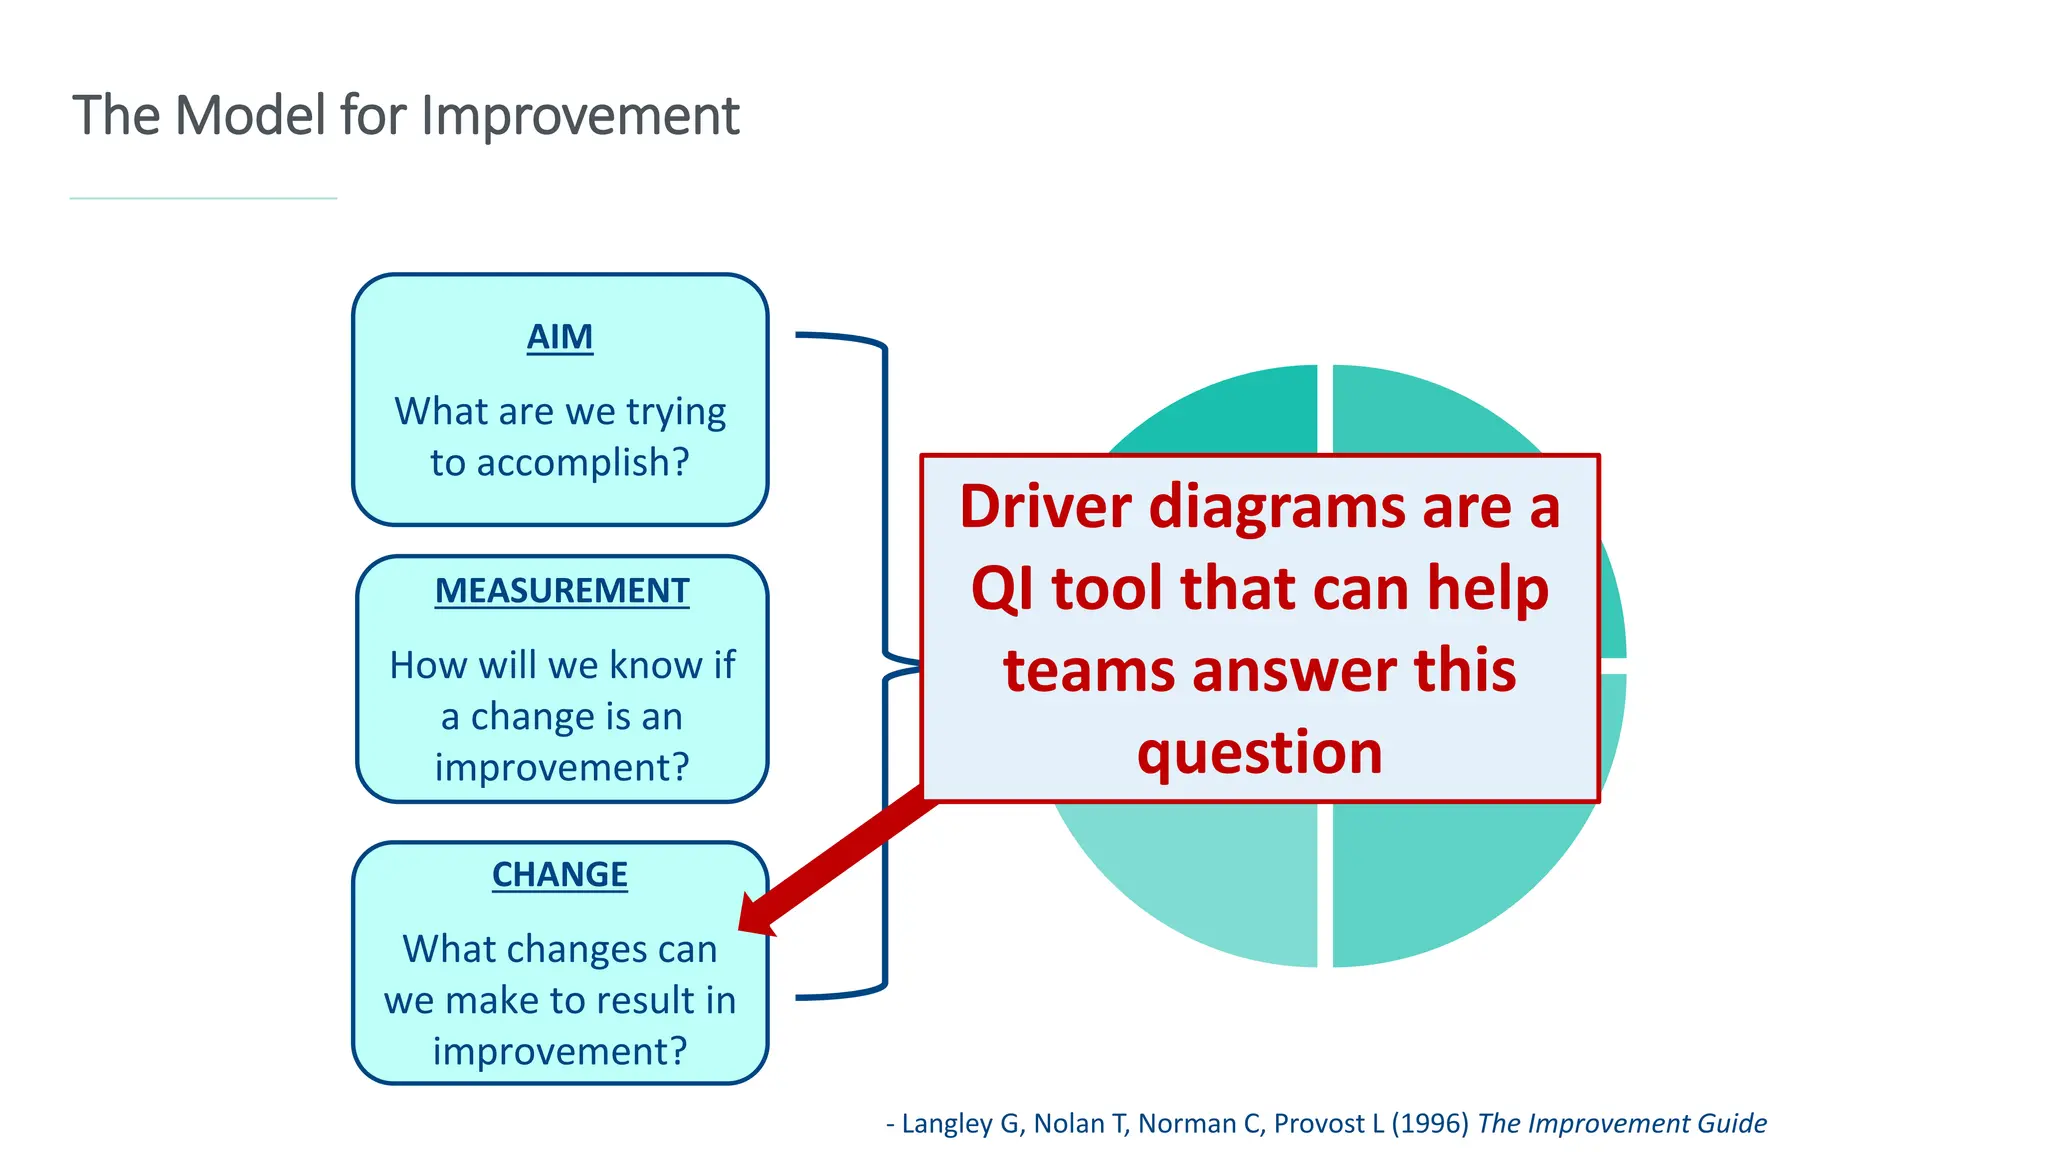
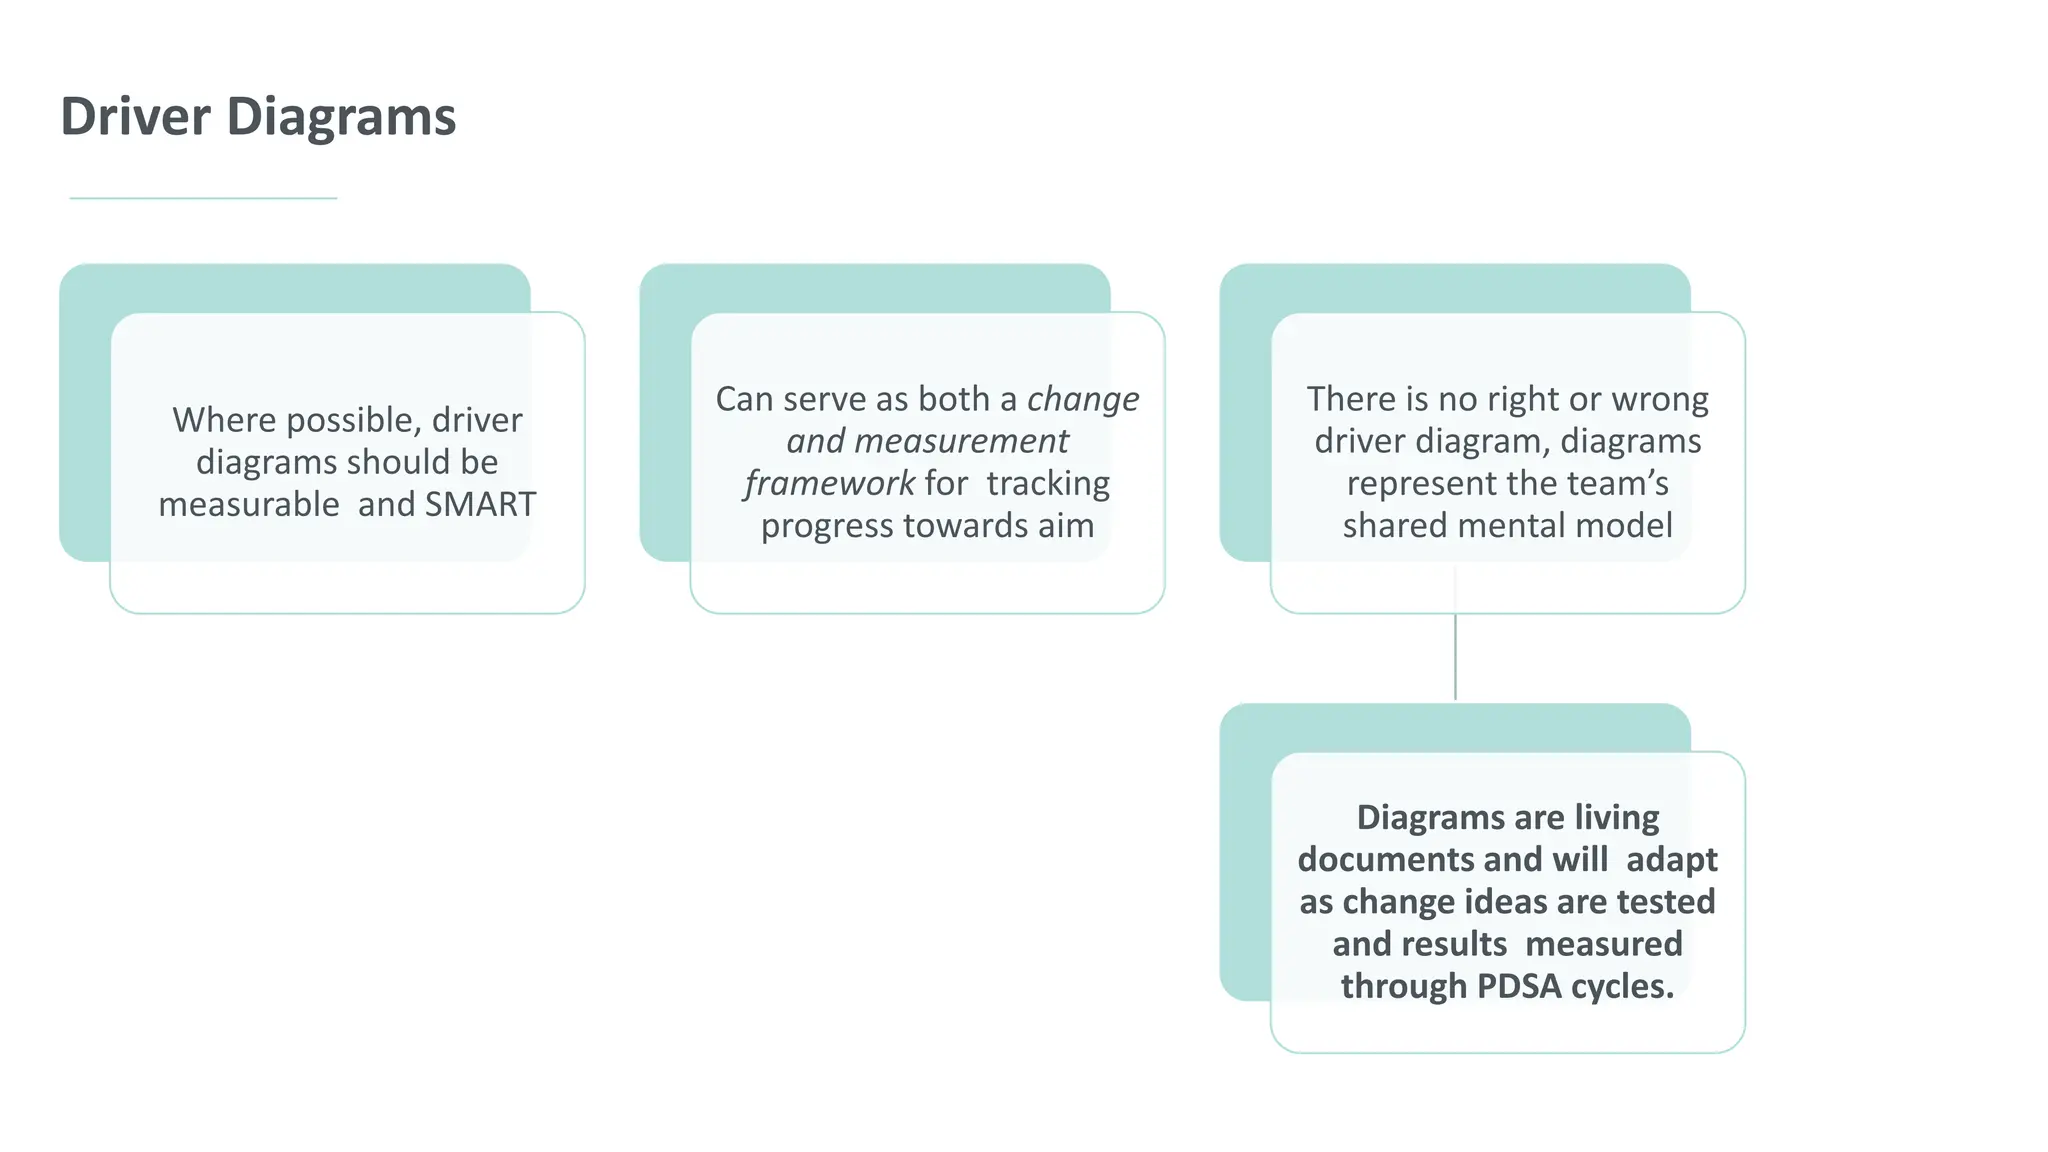
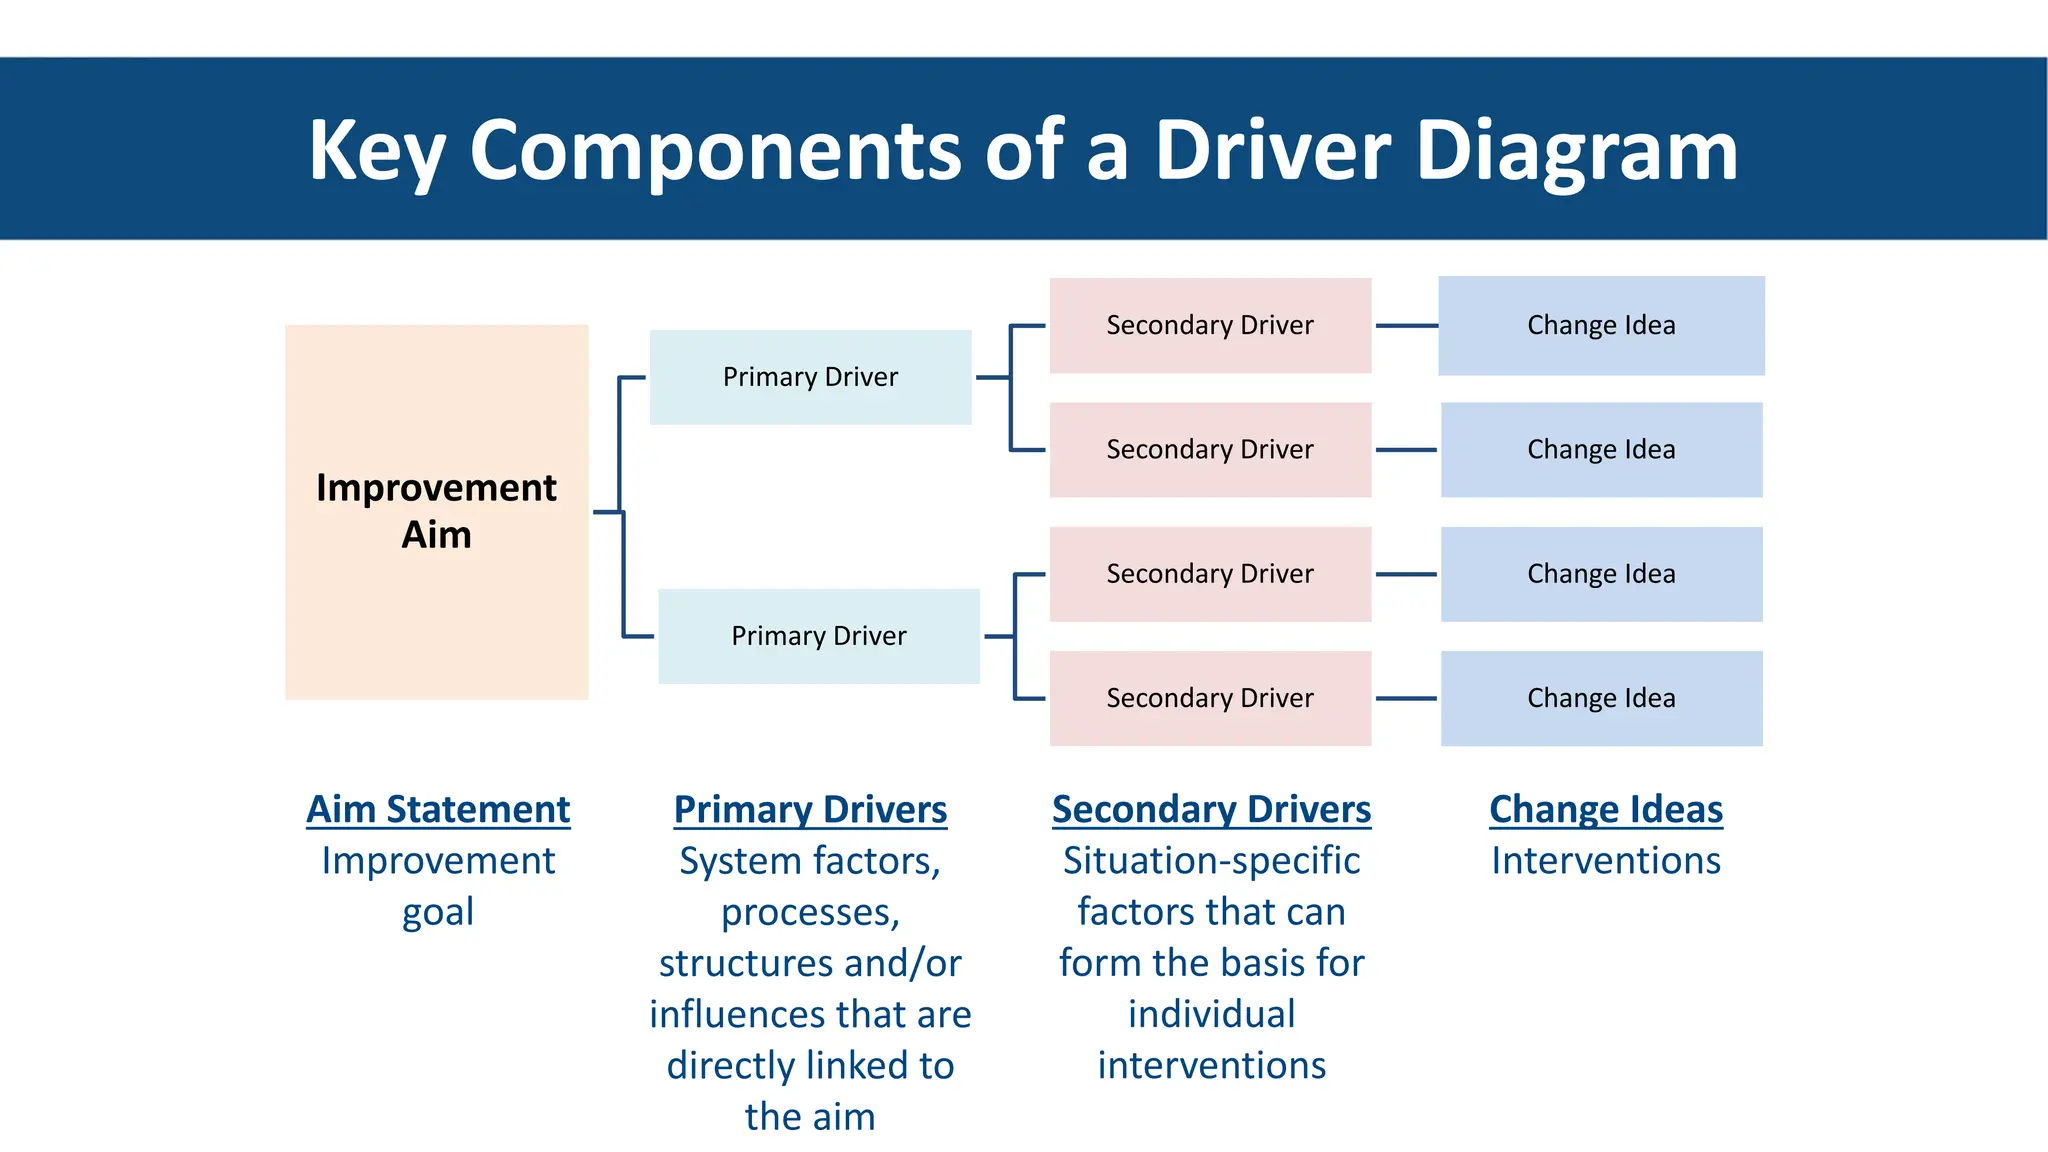
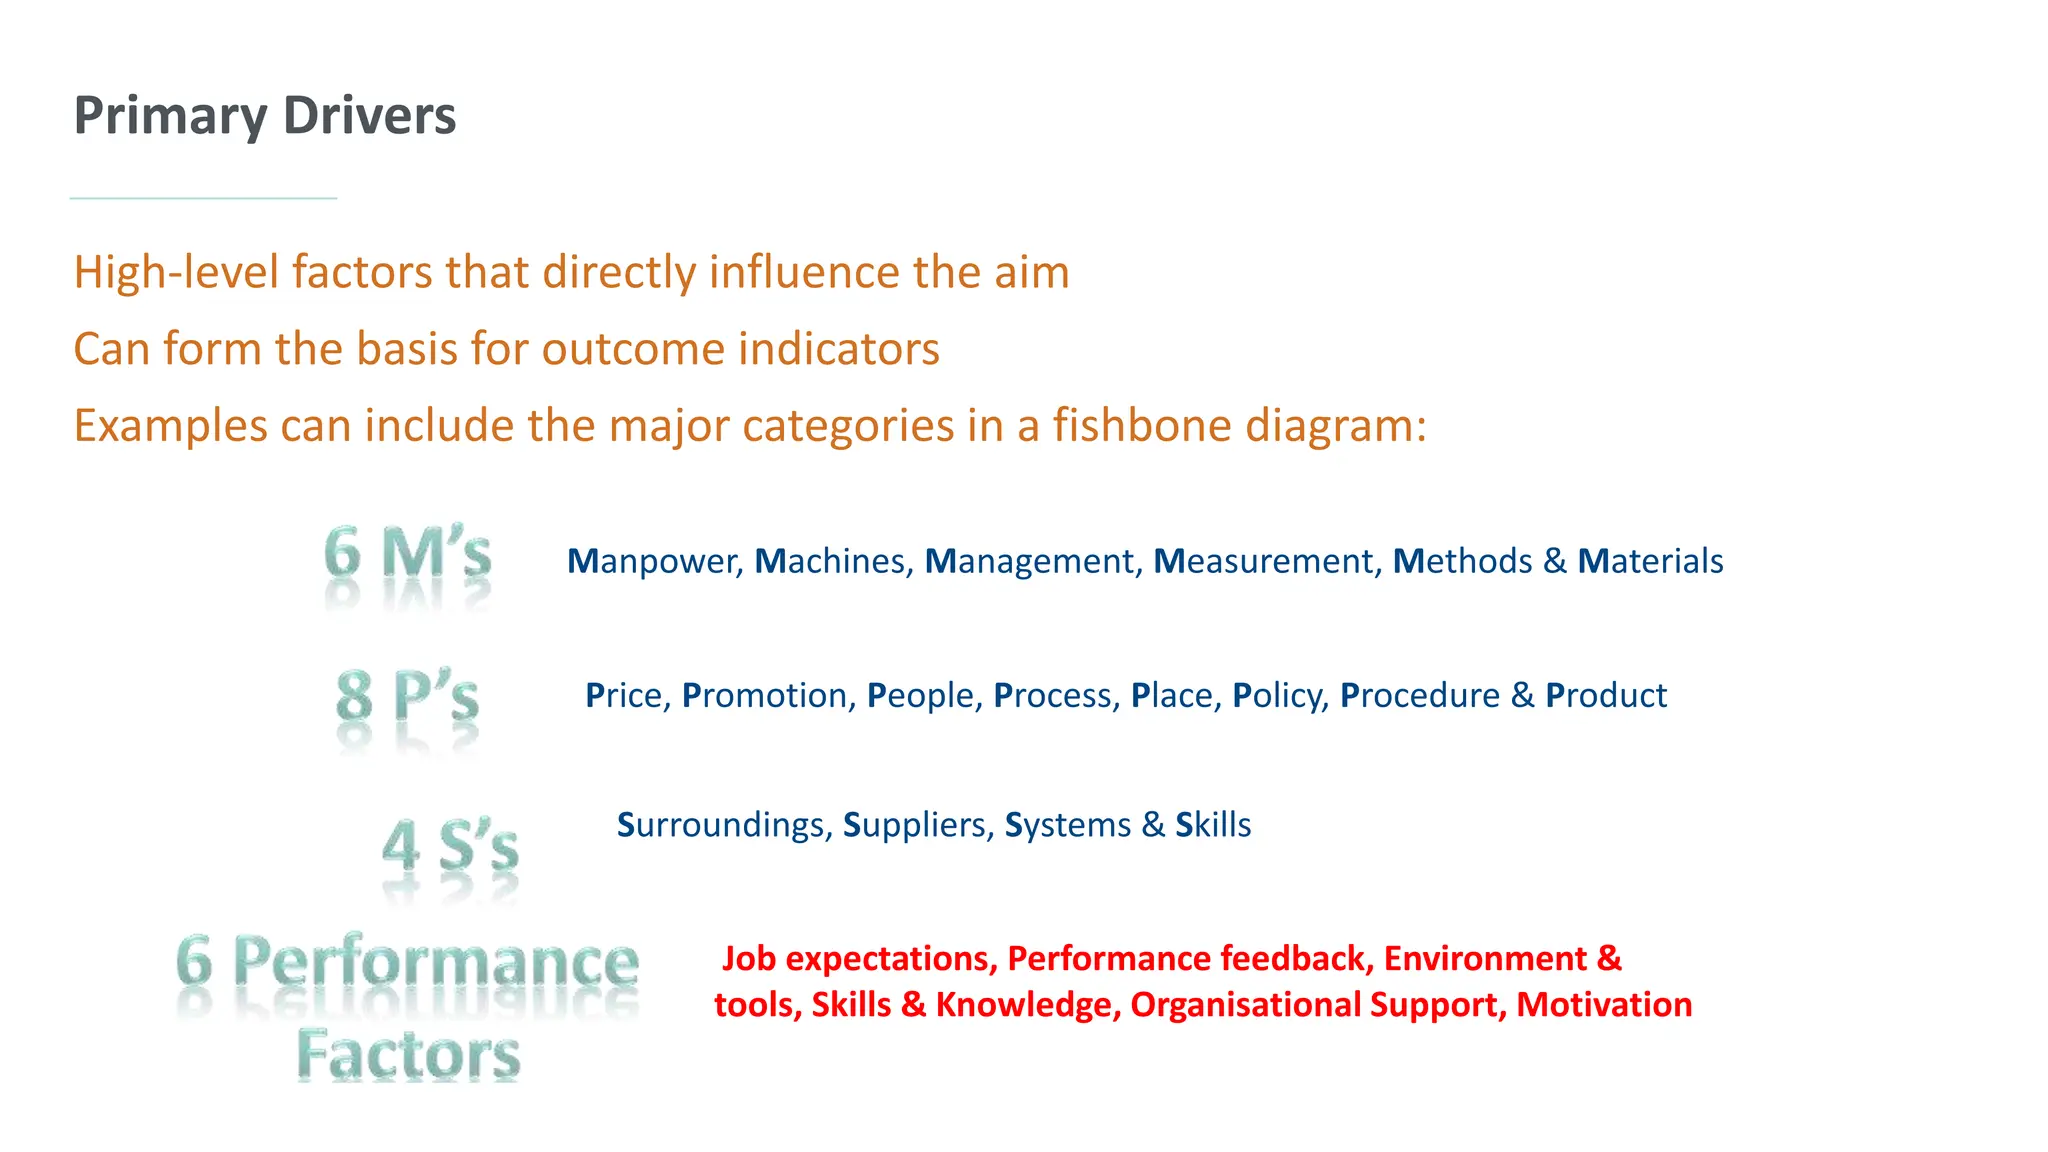
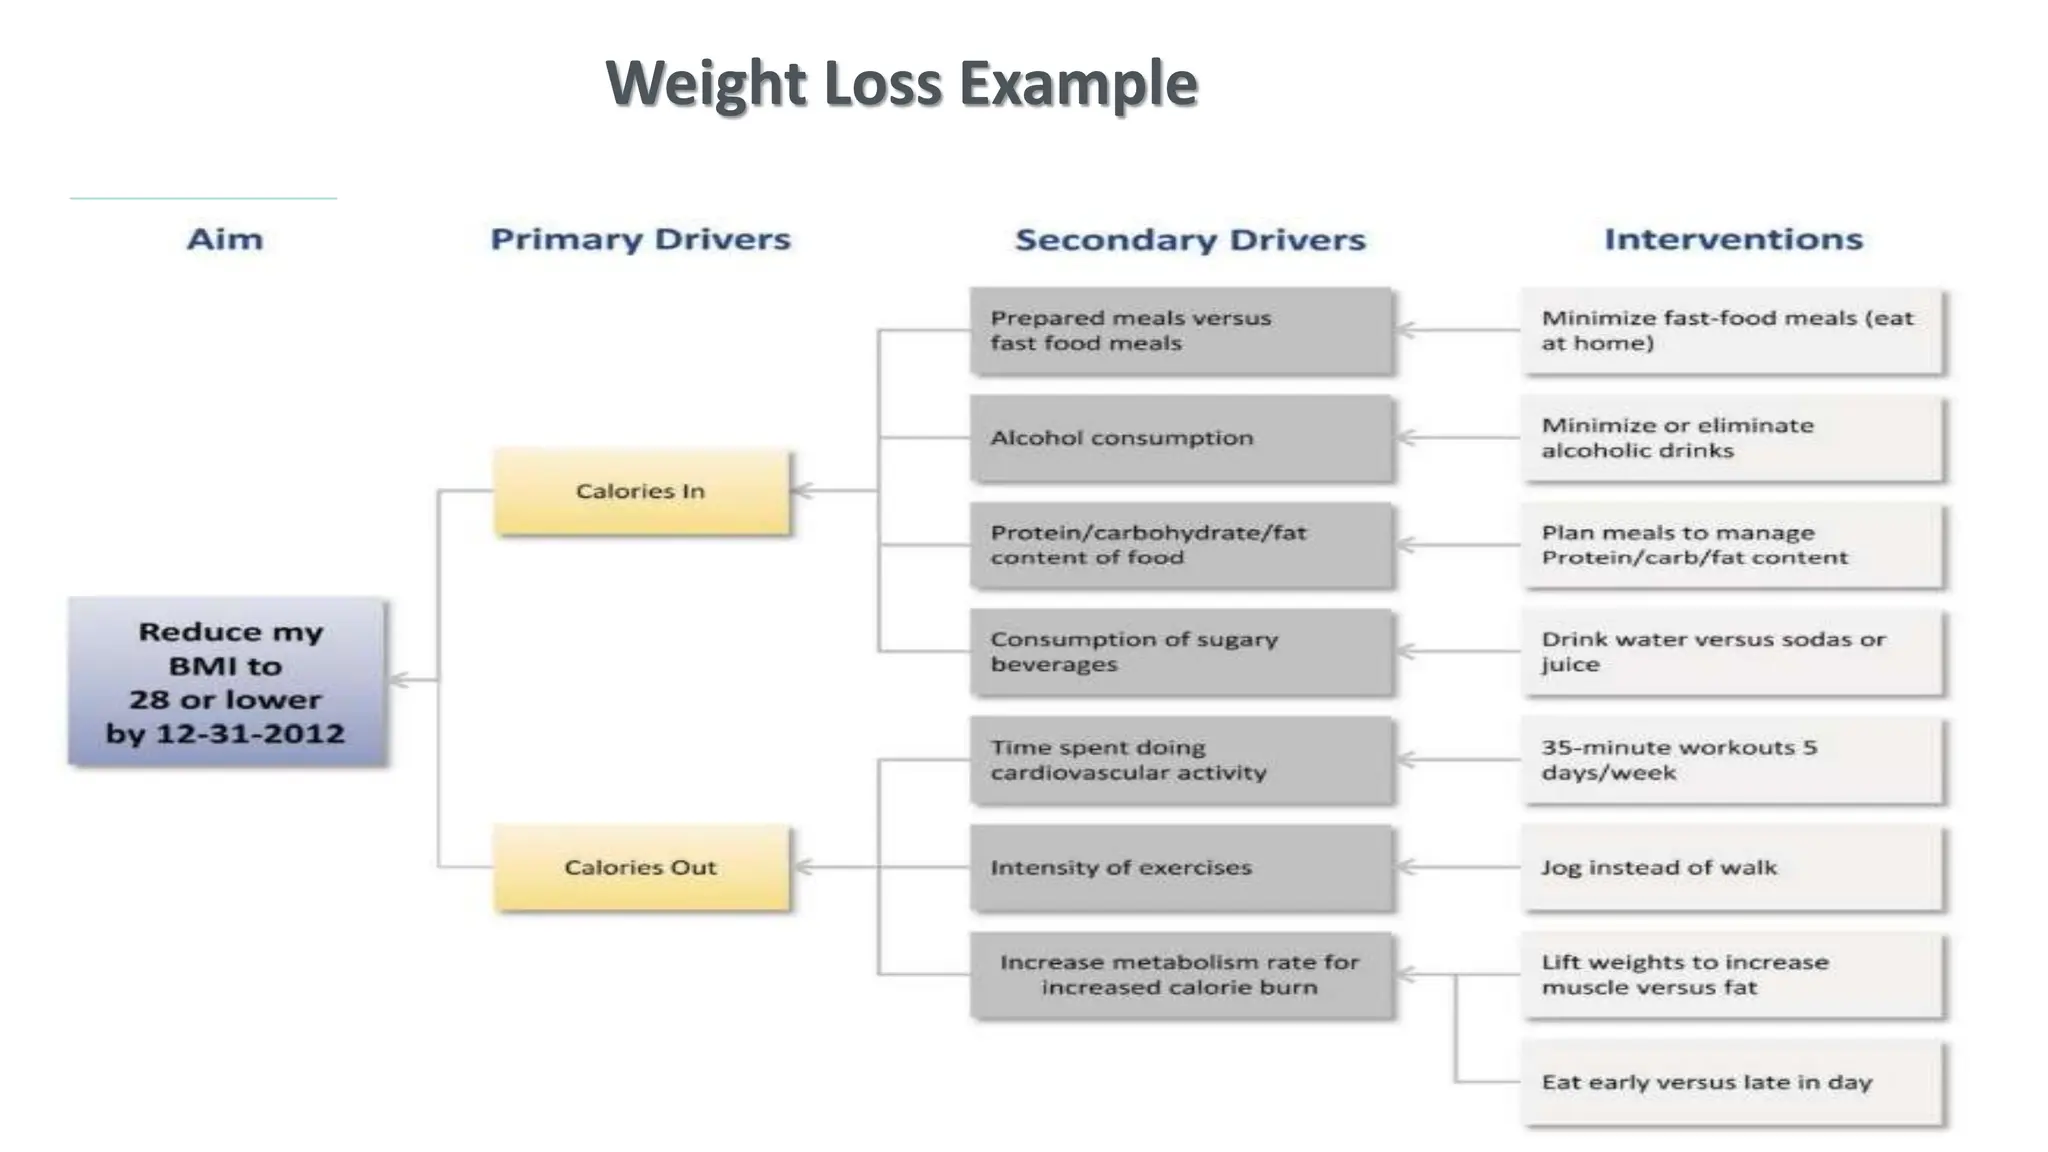
Developing
Solutions:
Driver
Diagrams
By the end of this session, participants will be able to:
Discuss the utility of Driver Diagrams as QI tools to systematically identify
change ideas to address quality challenges
Define primary and secondary drivers as they relate to quality challenges
Apply Driver Diagrams to quality challenges
Learning Objectives
Outline
What is a Driver Diagram?
Components and Development of Driver Diagrams
Techniques for generating change ideas
Recap: QI Tool: Root Cause Analysis
Makes issues less
ambiguous
Minimizes bias
Incorporates the
perspective of
multiple team
members
Allows for a full
understanding of
all processes
Provides baseline
data
1. Establish a QI team
2. Define the problem
3. Determine overall improvement aim
4. Develop system for measuring improvement
5. Identify & test change ideas
6. Collect data & analyze change
REMINDER: COMMON QI PROJECT STEPS
The Model for Improvement
AIM
What are we trying
to accomplish?
MEASUREMENT
How will we know if
a change is an
improvement?
CHANGE
What changes can
we make to result in
improvement?
Act Plan
Do
Study
- Langley G, Nolan T, Norman C, Provost L (1996) The Improvement Guide
Driver diagrams are a
QI tool that can help
teams answer this
question
Help to answer the question,
What change can we make that will lead to improvement?
• Conceptualize a quality issue and generate change ideas linked to root
causes
• Explore systems and process mechanisms through primary and secondary
drivers
• Generate theories and hypotheses about change initiatives that can
lead to improvement
Driver Diagrams
• Strategic planning and analysis tool that is updated
systematically throughout an entire project
• Breaks down an aim into the drivers that contribute to and
the detailed actions that could be done to achieve the aim
• Helps to focus on the cause-and-effect relationships
that exist in complicated systems
• Provides a pathway for change which identifies the types of
interventions that can bring about the desired outcome
Driver Diagrams: Purpose
Driver Diagrams
Logically links change ideas to drivers
Often used with Fishbone Diagrams and Process Maps as part of the
participatory improvement process to utilize the list of identified causes
and organize them into action steps that will lead to improved aim
Driver Diagrams
Where possible, driver
diagrams should be
measurable and SMART
Can serve as both a change
and measurement
framework for tracking
progress towards aim
There is no right or wrong
driver diagram, diagrams
represent the team’s
shared mental model
Diagrams are living
documents and will adapt
as change ideas are tested
and results measured
through PDSA cycles.
• Aim Statement
• Primary Drivers: System factors, processes,
structures and influences that directly link to
aim
• Secondary Drivers: Situation-specific factors
that can form the basis for specific
interventions
• Change Ideas
• Measurement Indicators
Driver Diagrams: Main Components
Key Components of a Driver Diagram
Improvement
Aim
Primary Driver
Secondary Driver Change Idea
Primary Driver
Secondary Driver Change Idea
Primary Drivers
System factors,
processes,
structures and/or
influences that are
directly linked to
the aim
Secondary Drivers
Situation-specific
factors that can
form the basis for
individual
interventions
Aim Statement
Improvement
goal
Change Ideas
Interventions
• Team approach: Gather key stakeholders
• Start with the improvement aim
• Brainstorm: What main factors influence the aim?
» Where? What? When? Who? Why?
• Group drivers into primary or secondary
• Generate change ideas related to the drivers
• Link the drivers and change ideas with arrows
• Include indicators and measurements
Developing a Driver Diagram
High-level factors that directly influence the aim
Can form the basis for outcome indicators
Examples can include the major categories in a fishbone diagram:
Primary Drivers
Manpower, Machines, Management, Measurement, Methods & Materials
Price, Promotion, People, Process, Place, Policy, Procedure & Product
Surroundings, Suppliers, Systems & Skills
Job expectations, Performance feedback, Environment &
tools, Skills & Knowledge, Organisational Support, Motivation
• Lower-level, more actionable drivers
• Drivers that can form the basis for specific interventions
• Situation-specific causes or factors that are related to the primary driver
• Measurable components are usually process indicators
Secondary Drivers
• Literature reviews and evidence base
• Professional networks and associations
• Borrowing and collaborations
• Review of failed ideas
• Creative brainstorming methods
Generating Change Ideas
Aim for quantity (The more ideas the better)
Encourage participation (Welcome & note all ideas)
Do not rush to criticize
Once list is complete
o Categorize/group ideas
o Analyze & reduce list of ideas
Brainstorming change ideas: Dos & Don’ts
Weight Loss Example
Cheers team

The Driver Diagrams for Quality Improvement

  • 1.
  • 2.
    By the endof this session, participants will be able to: Discuss the utility of Driver Diagrams as QI tools to systematically identify change ideas to address quality challenges Define primary and secondary drivers as they relate to quality challenges Apply Driver Diagrams to quality challenges Learning Objectives
  • 3.
    Outline What is aDriver Diagram? Components and Development of Driver Diagrams Techniques for generating change ideas
  • 4.
    Recap: QI Tool:Root Cause Analysis Makes issues less ambiguous Minimizes bias Incorporates the perspective of multiple team members Allows for a full understanding of all processes Provides baseline data
  • 5.
    1. Establish aQI team 2. Define the problem 3. Determine overall improvement aim 4. Develop system for measuring improvement 5. Identify & test change ideas 6. Collect data & analyze change REMINDER: COMMON QI PROJECT STEPS
  • 6.
    The Model forImprovement AIM What are we trying to accomplish? MEASUREMENT How will we know if a change is an improvement? CHANGE What changes can we make to result in improvement? Act Plan Do Study - Langley G, Nolan T, Norman C, Provost L (1996) The Improvement Guide Driver diagrams are a QI tool that can help teams answer this question
  • 7.
    Help to answerthe question, What change can we make that will lead to improvement? • Conceptualize a quality issue and generate change ideas linked to root causes • Explore systems and process mechanisms through primary and secondary drivers • Generate theories and hypotheses about change initiatives that can lead to improvement Driver Diagrams
  • 8.
    • Strategic planningand analysis tool that is updated systematically throughout an entire project • Breaks down an aim into the drivers that contribute to and the detailed actions that could be done to achieve the aim • Helps to focus on the cause-and-effect relationships that exist in complicated systems • Provides a pathway for change which identifies the types of interventions that can bring about the desired outcome Driver Diagrams: Purpose
  • 9.
    Driver Diagrams Logically linkschange ideas to drivers Often used with Fishbone Diagrams and Process Maps as part of the participatory improvement process to utilize the list of identified causes and organize them into action steps that will lead to improved aim
  • 10.
    Driver Diagrams Where possible,driver diagrams should be measurable and SMART Can serve as both a change and measurement framework for tracking progress towards aim There is no right or wrong driver diagram, diagrams represent the team’s shared mental model Diagrams are living documents and will adapt as change ideas are tested and results measured through PDSA cycles.
  • 11.
    • Aim Statement •Primary Drivers: System factors, processes, structures and influences that directly link to aim • Secondary Drivers: Situation-specific factors that can form the basis for specific interventions • Change Ideas • Measurement Indicators Driver Diagrams: Main Components
  • 12.
    Key Components ofa Driver Diagram Improvement Aim Primary Driver Secondary Driver Change Idea Secondary Driver Change Idea Primary Driver Secondary Driver Change Idea Secondary Driver Change Idea Primary Drivers System factors, processes, structures and/or influences that are directly linked to the aim Secondary Drivers Situation-specific factors that can form the basis for individual interventions Aim Statement Improvement goal Change Ideas Interventions
  • 13.
    • Team approach:Gather key stakeholders • Start with the improvement aim • Brainstorm: What main factors influence the aim? » Where? What? When? Who? Why? • Group drivers into primary or secondary • Generate change ideas related to the drivers • Link the drivers and change ideas with arrows • Include indicators and measurements Developing a Driver Diagram
  • 14.
    High-level factors thatdirectly influence the aim Can form the basis for outcome indicators Examples can include the major categories in a fishbone diagram: Primary Drivers Manpower, Machines, Management, Measurement, Methods & Materials Price, Promotion, People, Process, Place, Policy, Procedure & Product Surroundings, Suppliers, Systems & Skills Job expectations, Performance feedback, Environment & tools, Skills & Knowledge, Organisational Support, Motivation
  • 15.
    • Lower-level, moreactionable drivers • Drivers that can form the basis for specific interventions • Situation-specific causes or factors that are related to the primary driver • Measurable components are usually process indicators Secondary Drivers
  • 16.
    • Literature reviewsand evidence base • Professional networks and associations • Borrowing and collaborations • Review of failed ideas • Creative brainstorming methods Generating Change Ideas
  • 17.
    Aim for quantity(The more ideas the better) Encourage participation (Welcome & note all ideas) Do not rush to criticize Once list is complete o Categorize/group ideas o Analyze & reduce list of ideas Brainstorming change ideas: Dos & Don’ts
  • 18.
  • 19.

Editor's Notes

  • #4 Questions after change ideas
  • #7 Questions after change ideas
  • #8 Driver Diagrams are a tool designed to answer that question. The driver diagram is a useful tool for Gaining knowledge about improvement. Aids in establishing consensus in change initiatives. Serves an excellent communication tool for the team approach, leadership commitment. Helps teams focus and communicate thoughts Another example of a QI tool that can be applied in almost any environment for any level of the health system Action Oriented tool!
  • #12 Relationship arrows show the connection between drivers and the aim and change ideas. Relationship arrows also Demonstrate the causal relationship
  • #13 In addition to what’s illustrated here, relationship arrows/lines demonstrate the connection or causal relationship between the aim, drivers and change ideas.
  • #15 Other examples can include: Often primary drivers are easier to identify especially in a system that is well known.