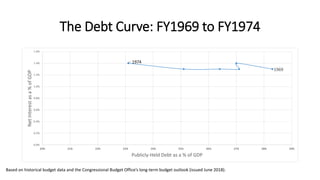
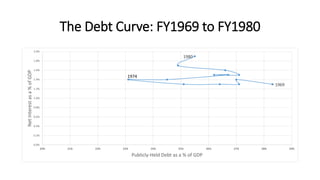
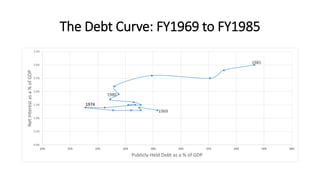
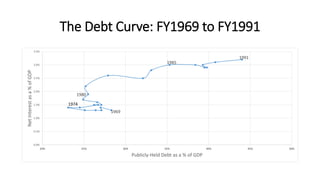
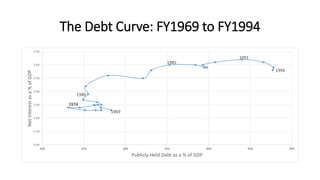
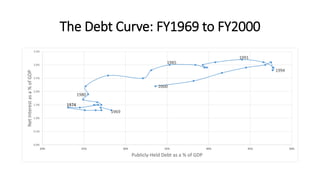
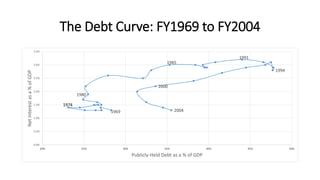
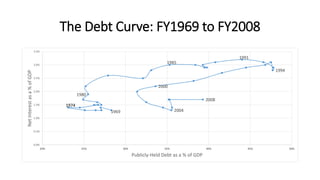
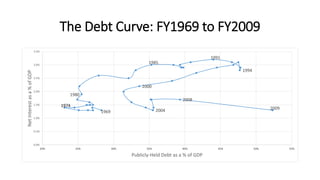
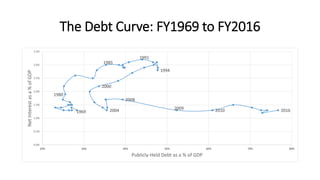
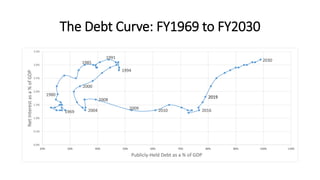
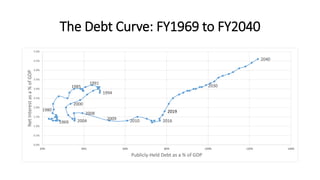
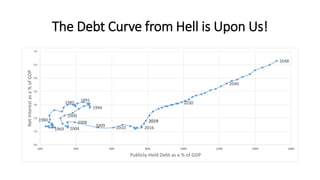
The Debt Curve From Hell is Upon Us
The Federal Deficit & Debt: FY1969 to FY2048
By James Carter
Deputy Assistant Secretary, U.S. Treasury
2002-06
The Debt Curve: FY1969 to FY1974
1969
1974
0.0%
0.2%
0.4%
0.6%
0.8%
1.0%
1.2%
1.4%
1.6%
20% 21% 22% 23% 24% 25% 26% 27% 28% 29%
NetInterestasa%ofGDP
Publicly-Held Debt as a % of GDP
Based on historical budget data and the Congressional Budget Office’s long-term budget outlook (issued June 2018).
The Debt Curve: FY1969 to FY1980
1969
1974
1980
0.0%
0.2%
0.4%
0.6%
0.8%
1.0%
1.2%
1.4%
1.6%
1.8%
2.0%
20% 21% 22% 23% 24% 25% 26% 27% 28% 29%
NetInterestasa%ofGDP
Publicly-Held Debt as a % of GDP
The Debt Curve: FY1969 to FY1985
1969
1974
1980
1985
0.0%
0.5%
1.0%
1.5%
2.0%
2.5%
3.0%
3.5%
20% 22% 24% 26% 28% 30% 32% 34% 36% 38%
NetInterestasa%ofGDP
Publicly-Held Debt as a % of GDP
The Debt Curve: FY1969 to FY1991
1969
1974
1980
1985
1991
0.0%
0.5%
1.0%
1.5%
2.0%
2.5%
3.0%
3.5%
20% 25% 30% 35% 40% 45% 50%
NetInterestasa%ofGDP
Publicly-Held Debt as a % of GDP
The Debt Curve: FY1969 to FY1994
1969
1974
1980
1985
1991
1994
0.0%
0.5%
1.0%
1.5%
2.0%
2.5%
3.0%
3.5%
20% 25% 30% 35% 40% 45% 50%
NetInterestasa%ofGDP
Publicly-Held Debt as a % of GDP
The Debt Curve: FY1969 to FY2000
1969
1974
1980
1985
1991
1994
2000
0.0%
0.5%
1.0%
1.5%
2.0%
2.5%
3.0%
3.5%
20% 25% 30% 35% 40% 45% 50%
NetInterestasa%ofGDP
Publicly-Held Debt as a % of GDP
The Debt Curve: FY1969 to FY2004
1969
1974
1980
1985
1991
1994
2000
2004
0.0%
0.5%
1.0%
1.5%
2.0%
2.5%
3.0%
3.5%
20% 25% 30% 35% 40% 45% 50%
NetInterestasa%ofGDP
Publicly-Held Debt as a % of GDP
The Debt Curve: FY1969 to FY2008
1969
1974
1980
1985
1991
1994
2000
2004
2008
0.0%
0.5%
1.0%
1.5%
2.0%
2.5%
3.0%
3.5%
20% 25% 30% 35% 40% 45% 50%
NetInterestasa%ofGDP
Publicly-Held Debt as a % of GDP
The Debt Curve: FY1969 to FY2009
1969
1974
1980
1985
1991
1994
2000
2004
2008
2009
0.0%
0.5%
1.0%
1.5%
2.0%
2.5%
3.0%
3.5%
20% 25% 30% 35% 40% 45% 50% 55%
NetInterestasa%ofGDP
Publicly-Held Debt as a % of GDP
The Debt Curve: FY1969 to FY2010
1969
1974
1980
1985
1991
1994
2000
2004
2008
2009 2010
0.0%
0.5%
1.0%
1.5%
2.0%
2.5%
3.0%
3.5%
20% 25% 30% 35% 40% 45% 50% 55% 60% 65%
NetInterestasa%ofGDP
Publicly-Held Debt as a % of GDP
The Debt Curve: FY1969 to FY2016
1969
1980
1985
1991
1994
2000
2004
2008
2009 2010 2016
0.0%
0.5%
1.0%
1.5%
2.0%
2.5%
3.0%
3.5%
20% 30% 40% 50% 60% 70% 80%
NetInterestasa%ofGDP
Publicly-Held Debt as a % of GDP
The Debt Curve: FY1969 to FY2019
1969
1980
1985
1991
1994
2000
2004
2008
2009 2010 2016
2019
0.0%
0.5%
1.0%
1.5%
2.0%
2.5%
3.0%
3.5%
20% 30% 40% 50% 60% 70% 80% 90%
NetInterestasa%ofGDP
Publicly-Held Debt as a % of GDP
The Debt Curve: FY1969 to FY2030
1969
1980
1985
1991
1994
2000
2004
2008
2009 2010 2016
2019
2030
0.0%
0.5%
1.0%
1.5%
2.0%
2.5%
3.0%
3.5%
20% 30% 40% 50% 60% 70% 80% 90% 100% 110%
NetInterestasa%ofGDP
Publicly-Held Debt as a % of GDP
The Debt Curve: FY1969 to FY2040
1969
1980
1985
1991
1994
2000
2004
2008
2009 2010 2016
2019
2030
2040
0.0%
0.5%
1.0%
1.5%
2.0%
2.5%
3.0%
3.5%
4.0%
4.5%
5.0%
20% 40% 60% 80% 100% 120% 140%
NetInterestasa%ofGDP
Publicly-Held Debt as a % of GDP
The Debt Curve from Hell is Upon Us!
1969
1980
1985 1991
1994
2000
2004
2008
2009 2010 2016
2019
2030
2040
2048
0%
1%
2%
3%
4%
5%
6%
7%
20% 40% 60% 80% 100% 120% 140% 160%
NetInterestasa%ofGDP
Publicly-Held Debt as a % of GDP

The Debt Curve From Hell is Upon Us

  • 1.
    The Debt CurveFrom Hell is Upon Us The Federal Deficit & Debt: FY1969 to FY2048 By James Carter Deputy Assistant Secretary, U.S. Treasury 2002-06
  • 2.
    The Debt Curve:FY1969 to FY1974 1969 1974 0.0% 0.2% 0.4% 0.6% 0.8% 1.0% 1.2% 1.4% 1.6% 20% 21% 22% 23% 24% 25% 26% 27% 28% 29% NetInterestasa%ofGDP Publicly-Held Debt as a % of GDP Based on historical budget data and the Congressional Budget Office’s long-term budget outlook (issued June 2018).
  • 3.
    The Debt Curve:FY1969 to FY1980 1969 1974 1980 0.0% 0.2% 0.4% 0.6% 0.8% 1.0% 1.2% 1.4% 1.6% 1.8% 2.0% 20% 21% 22% 23% 24% 25% 26% 27% 28% 29% NetInterestasa%ofGDP Publicly-Held Debt as a % of GDP
  • 4.
    The Debt Curve:FY1969 to FY1985 1969 1974 1980 1985 0.0% 0.5% 1.0% 1.5% 2.0% 2.5% 3.0% 3.5% 20% 22% 24% 26% 28% 30% 32% 34% 36% 38% NetInterestasa%ofGDP Publicly-Held Debt as a % of GDP
  • 5.
    The Debt Curve:FY1969 to FY1991 1969 1974 1980 1985 1991 0.0% 0.5% 1.0% 1.5% 2.0% 2.5% 3.0% 3.5% 20% 25% 30% 35% 40% 45% 50% NetInterestasa%ofGDP Publicly-Held Debt as a % of GDP
  • 6.
    The Debt Curve:FY1969 to FY1994 1969 1974 1980 1985 1991 1994 0.0% 0.5% 1.0% 1.5% 2.0% 2.5% 3.0% 3.5% 20% 25% 30% 35% 40% 45% 50% NetInterestasa%ofGDP Publicly-Held Debt as a % of GDP
  • 7.
    The Debt Curve:FY1969 to FY2000 1969 1974 1980 1985 1991 1994 2000 0.0% 0.5% 1.0% 1.5% 2.0% 2.5% 3.0% 3.5% 20% 25% 30% 35% 40% 45% 50% NetInterestasa%ofGDP Publicly-Held Debt as a % of GDP
  • 8.
    The Debt Curve:FY1969 to FY2004 1969 1974 1980 1985 1991 1994 2000 2004 0.0% 0.5% 1.0% 1.5% 2.0% 2.5% 3.0% 3.5% 20% 25% 30% 35% 40% 45% 50% NetInterestasa%ofGDP Publicly-Held Debt as a % of GDP
  • 9.
    The Debt Curve:FY1969 to FY2008 1969 1974 1980 1985 1991 1994 2000 2004 2008 0.0% 0.5% 1.0% 1.5% 2.0% 2.5% 3.0% 3.5% 20% 25% 30% 35% 40% 45% 50% NetInterestasa%ofGDP Publicly-Held Debt as a % of GDP
  • 10.
    The Debt Curve:FY1969 to FY2009 1969 1974 1980 1985 1991 1994 2000 2004 2008 2009 0.0% 0.5% 1.0% 1.5% 2.0% 2.5% 3.0% 3.5% 20% 25% 30% 35% 40% 45% 50% 55% NetInterestasa%ofGDP Publicly-Held Debt as a % of GDP
  • 11.
    The Debt Curve:FY1969 to FY2010 1969 1974 1980 1985 1991 1994 2000 2004 2008 2009 2010 0.0% 0.5% 1.0% 1.5% 2.0% 2.5% 3.0% 3.5% 20% 25% 30% 35% 40% 45% 50% 55% 60% 65% NetInterestasa%ofGDP Publicly-Held Debt as a % of GDP
  • 12.
    The Debt Curve:FY1969 to FY2016 1969 1980 1985 1991 1994 2000 2004 2008 2009 2010 2016 0.0% 0.5% 1.0% 1.5% 2.0% 2.5% 3.0% 3.5% 20% 30% 40% 50% 60% 70% 80% NetInterestasa%ofGDP Publicly-Held Debt as a % of GDP
  • 13.
    The Debt Curve:FY1969 to FY2019 1969 1980 1985 1991 1994 2000 2004 2008 2009 2010 2016 2019 0.0% 0.5% 1.0% 1.5% 2.0% 2.5% 3.0% 3.5% 20% 30% 40% 50% 60% 70% 80% 90% NetInterestasa%ofGDP Publicly-Held Debt as a % of GDP
  • 14.
    The Debt Curve:FY1969 to FY2030 1969 1980 1985 1991 1994 2000 2004 2008 2009 2010 2016 2019 2030 0.0% 0.5% 1.0% 1.5% 2.0% 2.5% 3.0% 3.5% 20% 30% 40% 50% 60% 70% 80% 90% 100% 110% NetInterestasa%ofGDP Publicly-Held Debt as a % of GDP
  • 15.
    The Debt Curve:FY1969 to FY2040 1969 1980 1985 1991 1994 2000 2004 2008 2009 2010 2016 2019 2030 2040 0.0% 0.5% 1.0% 1.5% 2.0% 2.5% 3.0% 3.5% 4.0% 4.5% 5.0% 20% 40% 60% 80% 100% 120% 140% NetInterestasa%ofGDP Publicly-Held Debt as a % of GDP
  • 16.
    The Debt Curvefrom Hell is Upon Us! 1969 1980 1985 1991 1994 2000 2004 2008 2009 2010 2016 2019 2030 2040 2048 0% 1% 2% 3% 4% 5% 6% 7% 20% 40% 60% 80% 100% 120% 140% 160% NetInterestasa%ofGDP Publicly-Held Debt as a % of GDP