Downloaded 44 times
![Overview
1.
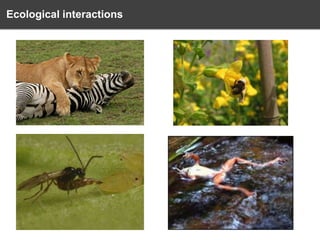
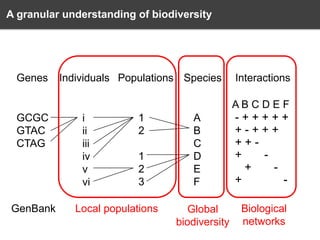
Background – the biodiversity informatics domain
•
•
•
2.
Social challenges
•
•
•
3.
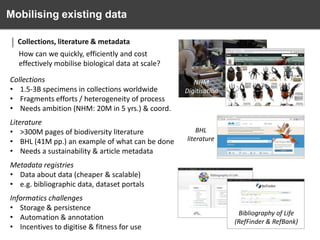
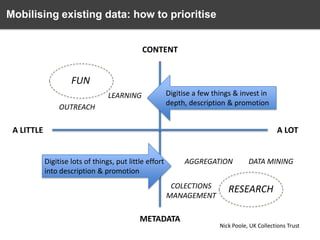
Mobilizing existing data (metadata, literature, collections)
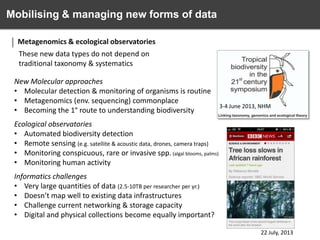
New forms of data ([meta]genomics & observatories)
Synthetic challenges
•
•
•
5.
Openness
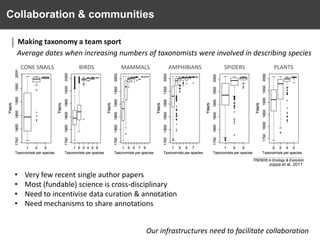
Collaboration and communities
Standards, identifiers & protocols
(Big) data challenges
•
•
4.
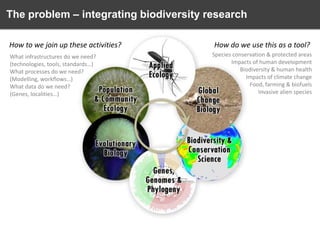
The problem (i.e. why are we here)
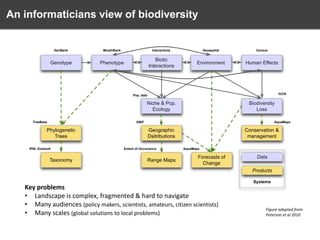
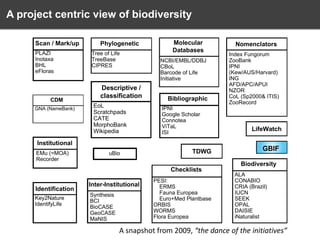
Representations of the domain (data, infrastructures, projects…)
Toward an integrated view (strategy)
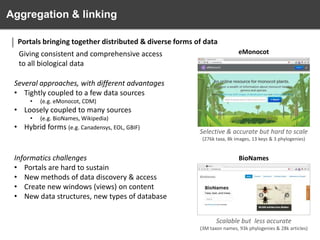
Data Aggregation & linking
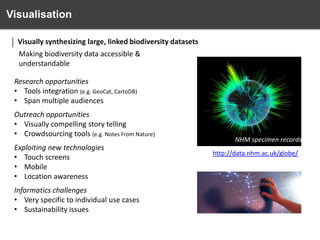
Visualisation
Modeling
Next steps (data infrastructures & funding)
•
Lessons learned: new informatics opportunities in H2020](https://image.slidesharecdn.com/vince-smith-the-biodiversity-informatics-landscape-no-text-131209094222-phpapp01/85/The-biodiversity-informatics-landscape-a-systematics-perspective-2-320.jpg)


The document discusses the challenges and opportunities in the field of biodiversity informatics, emphasizing the need for effective data mobilization, collaboration, and integration across diverse projects. It outlines the social, data, and synthetic challenges faced, including the importance of openness, standards, and addressing large data volumes. The document also suggests pathways for future action and integration, leveraging existing programs and encouraging user-informed design principles.


