Download to read offline
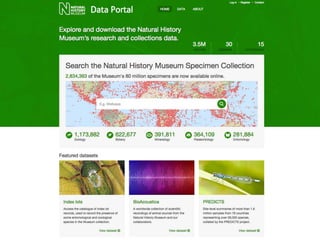
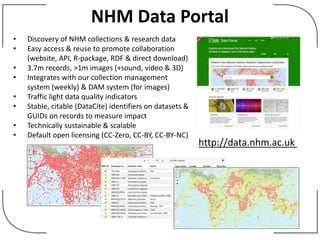


The NHM Data Portal is an initiative aimed at improving access and reuse of the Natural History Museum's collections and research data, featuring over 3.7 million records and more than 1 million images. The portal integrates multiple data management systems and uses open licensing to promote collaboration and data quality. Future development will focus on expanding datasets, enhancing ecological interaction data, and creating visualizations to address ecological questions.


