Downloaded 119 times


![starting simple
1st and Folsom
(twilio)
1st and Howard
(peet’s)
http://maps.googleapis.com/maps/api/geocode/json?
address=1st St and Folsom St,+San+Francisco,
+CA&sensor=false
{
"results" : [
{
"address_components" : [
...
],
"formatted_address" : "Folsom Street & 1st Street, San Francisco, CA 94105, USA",
"geometry" : {
"location" : {
"lat" : 37.78733430,
"lng" : -122.39453480
},
...
},
"types" : [ "intersection" ]
}
],
"status" : "OK"
}
the bike map](https://image.slidesharecdn.com/bikemapslides-130110190804-phpapp02/75/the-bike-map-a-look-into-a-practical-application-of-graph-theory-4-2048.jpg)
![starting simple
1st and Folsom
(twilio)
1st and Howard
(peet’s)
http://maps.googleapis.com/maps/api/elevation/json?
locations=37.78733430,-122.39453480&sensor=false
{
"results" : [
{
"elevation" : 12.22284126281738,
"location" : {
"lat" : 37.78733430,
"lng" : -122.39453480
},
"resolution" : 0.5964969992637634
}
],
"status" : "OK"
}
the bike map](https://image.slidesharecdn.com/bikemapslides-130110190804-phpapp02/75/the-bike-map-a-look-into-a-practical-application-of-graph-theory-5-2048.jpg)
![voila!
new google.maps.Polyline({
path: [<latlng for 1st &
folsom>, <latlng for 1st &
howard>],
strokeColor: <color based
on elevation difference
divided by distance>,
...
map: BikeMap.MAP_OBJECT,
})
...now just repeat for all intersections in the city...
the bike map](https://image.slidesharecdn.com/bikemapslides-130110190804-phpapp02/75/the-bike-map-a-look-into-a-practical-application-of-graph-theory-6-2048.jpg)
![proximobus
proximobus.appspot.com
http://proximobus.appspot.com/agencies/sf-muni/
routes/F/stops.json
{"items": [
{"latitude": 37.7875299, "display_name": "Market St & 3rd St", "id": "15640", "longitude":
-122.40352},
{"latitude": 37.76979, "display_name": "Market St & Buchanan St", "id": "15659", "longitude":
-122.4261499},
{"latitude": 37.7805699, "display_name": "Market St & 7th St North", "id": "15656",
"longitude": -122.41244},
{"latitude": 37.7911099, "display_name": "Market St & Battery St", "id": "15657", "longitude":
-122.39907},
{"latitude": 37.7840799, "display_name": "Market St & 5th St North", "id": "15655",
"longitude": -122.40799},
{"latitude": 37.7774099, "display_name": "Market St & 9th St", "id": "15652", "longitude":
-122.41634},
...
]}
great! i’ll just map all the transit lines.
charlie
the bike map](https://image.slidesharecdn.com/bikemapslides-130110190804-phpapp02/75/the-bike-map-a-look-into-a-practical-application-of-graph-theory-11-2048.jpg)
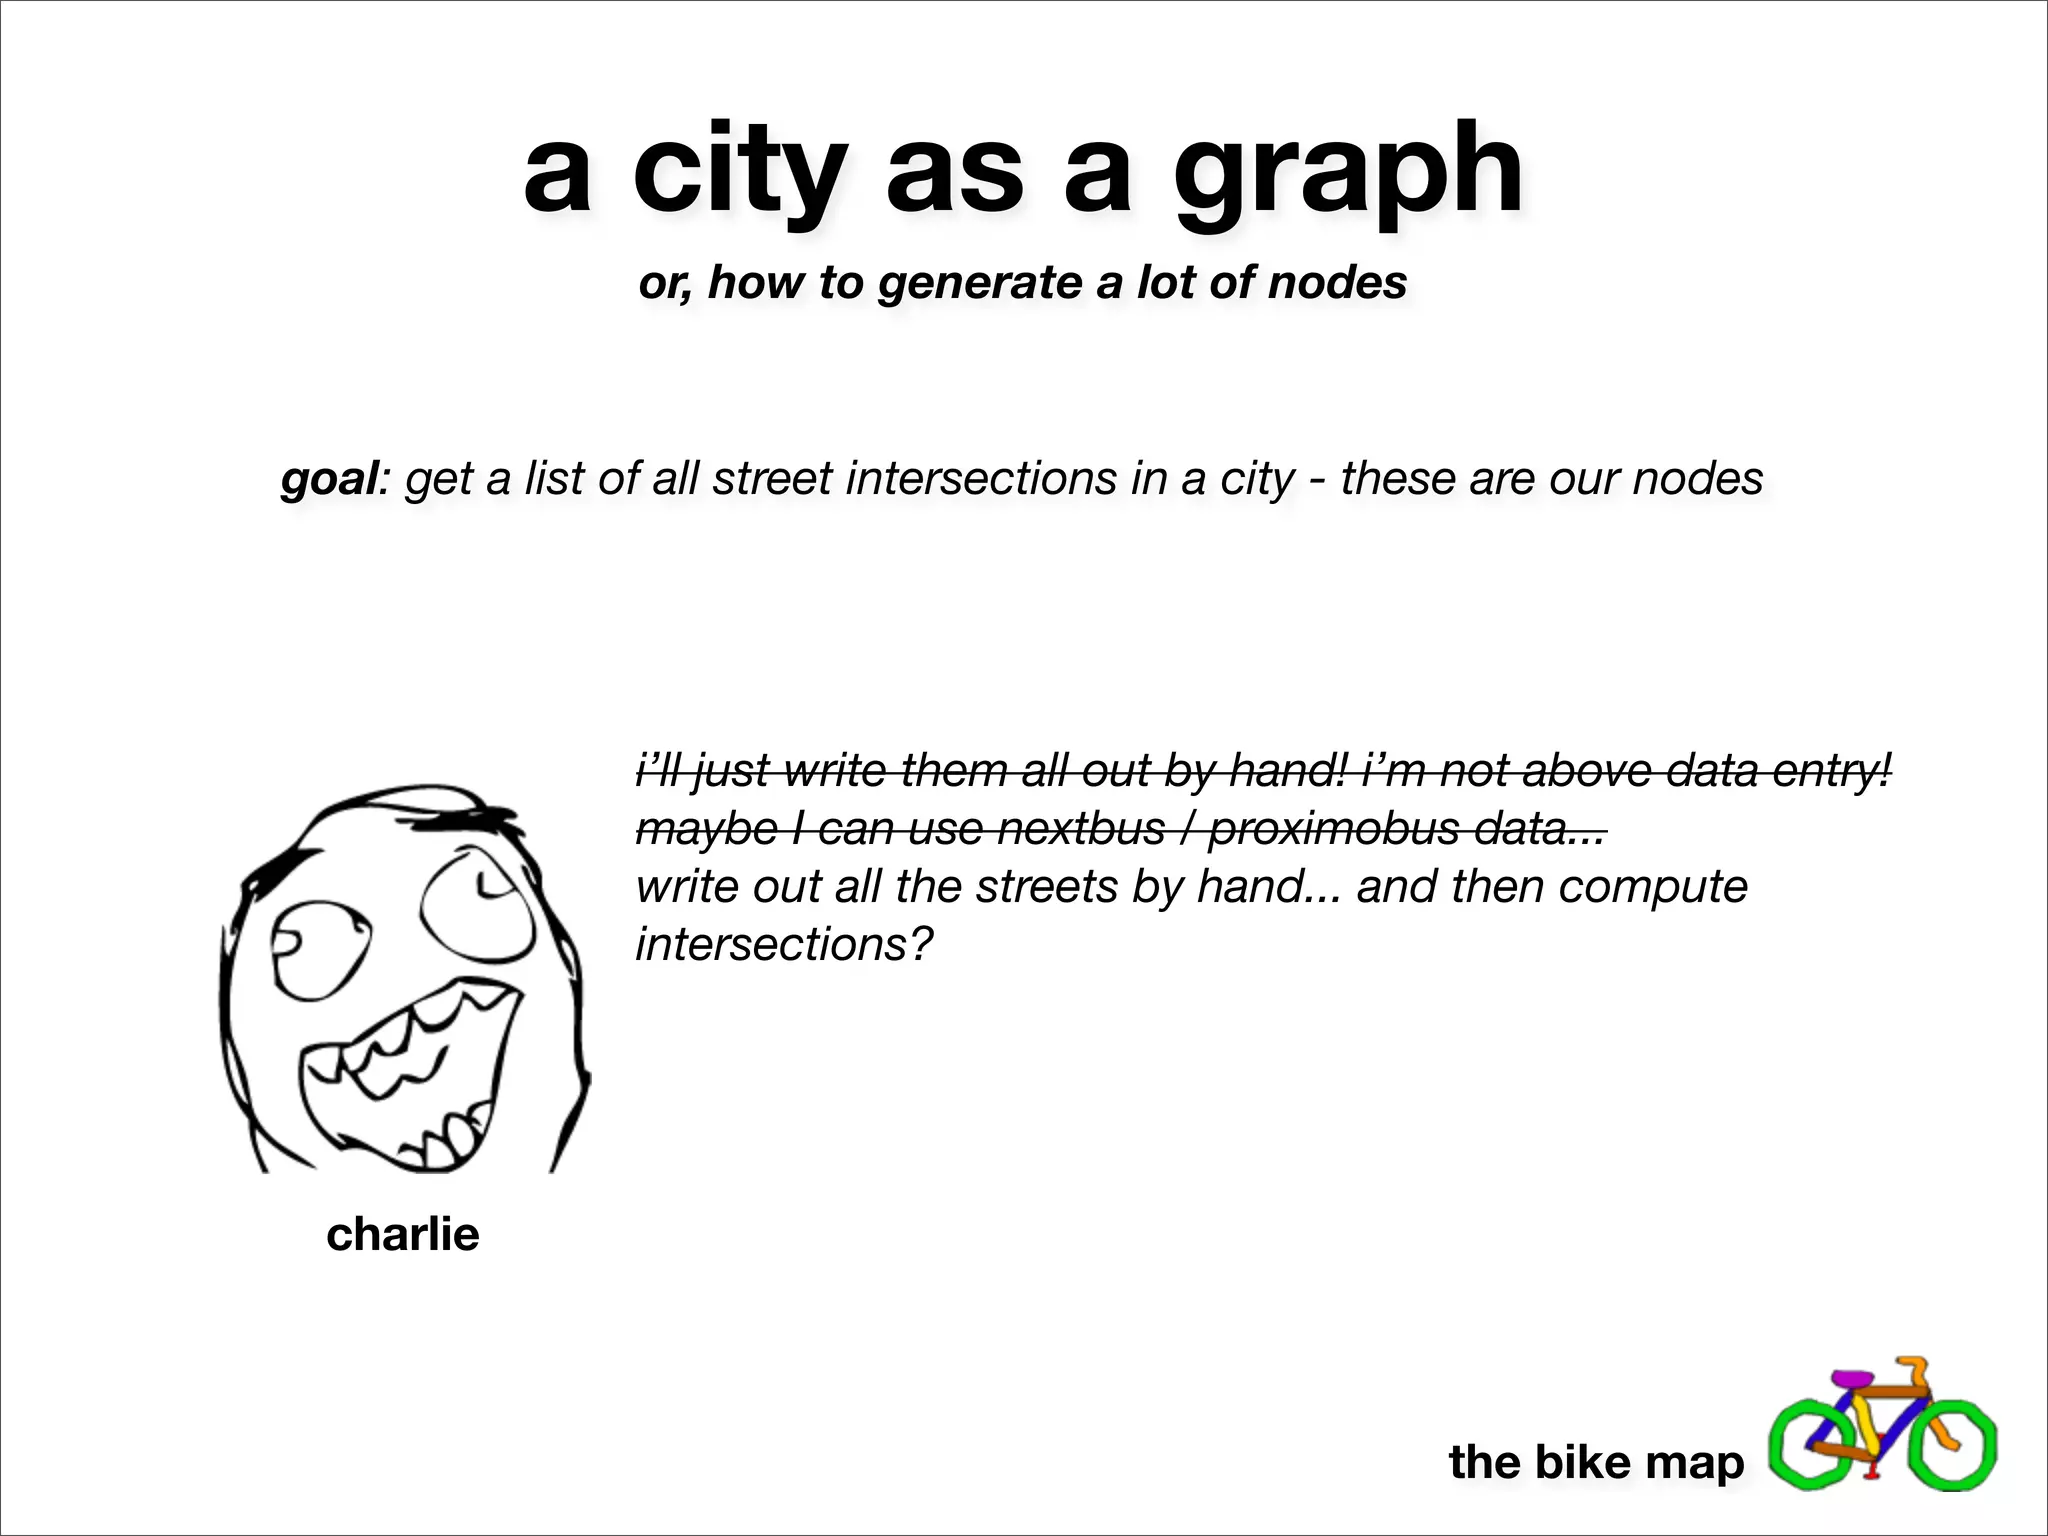
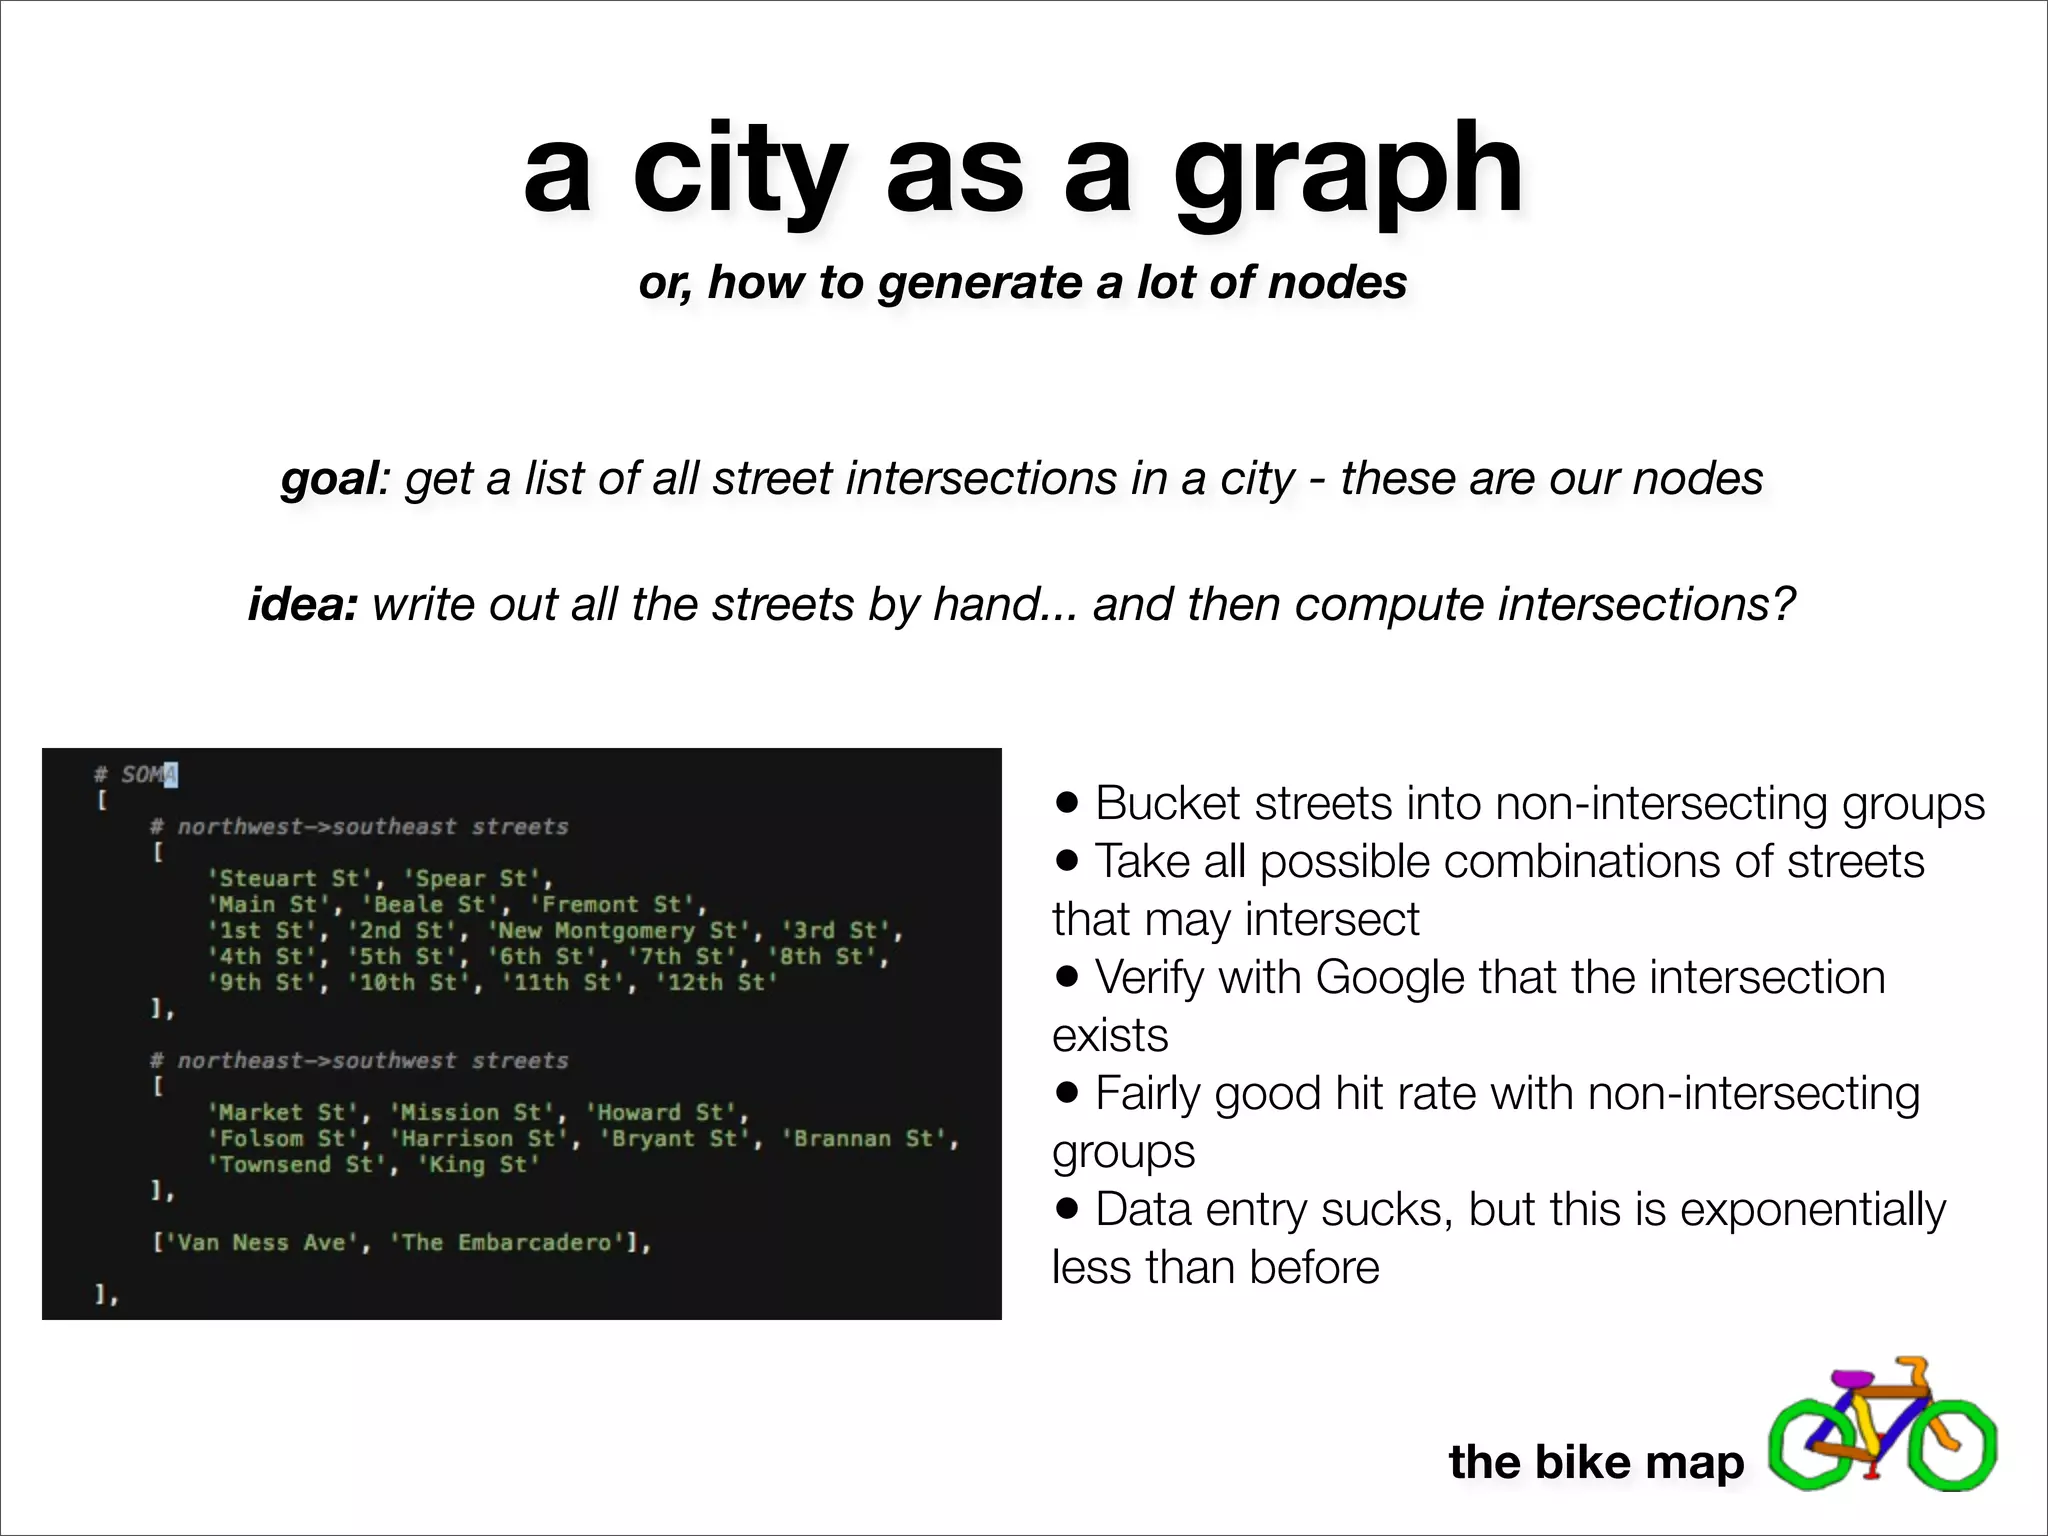
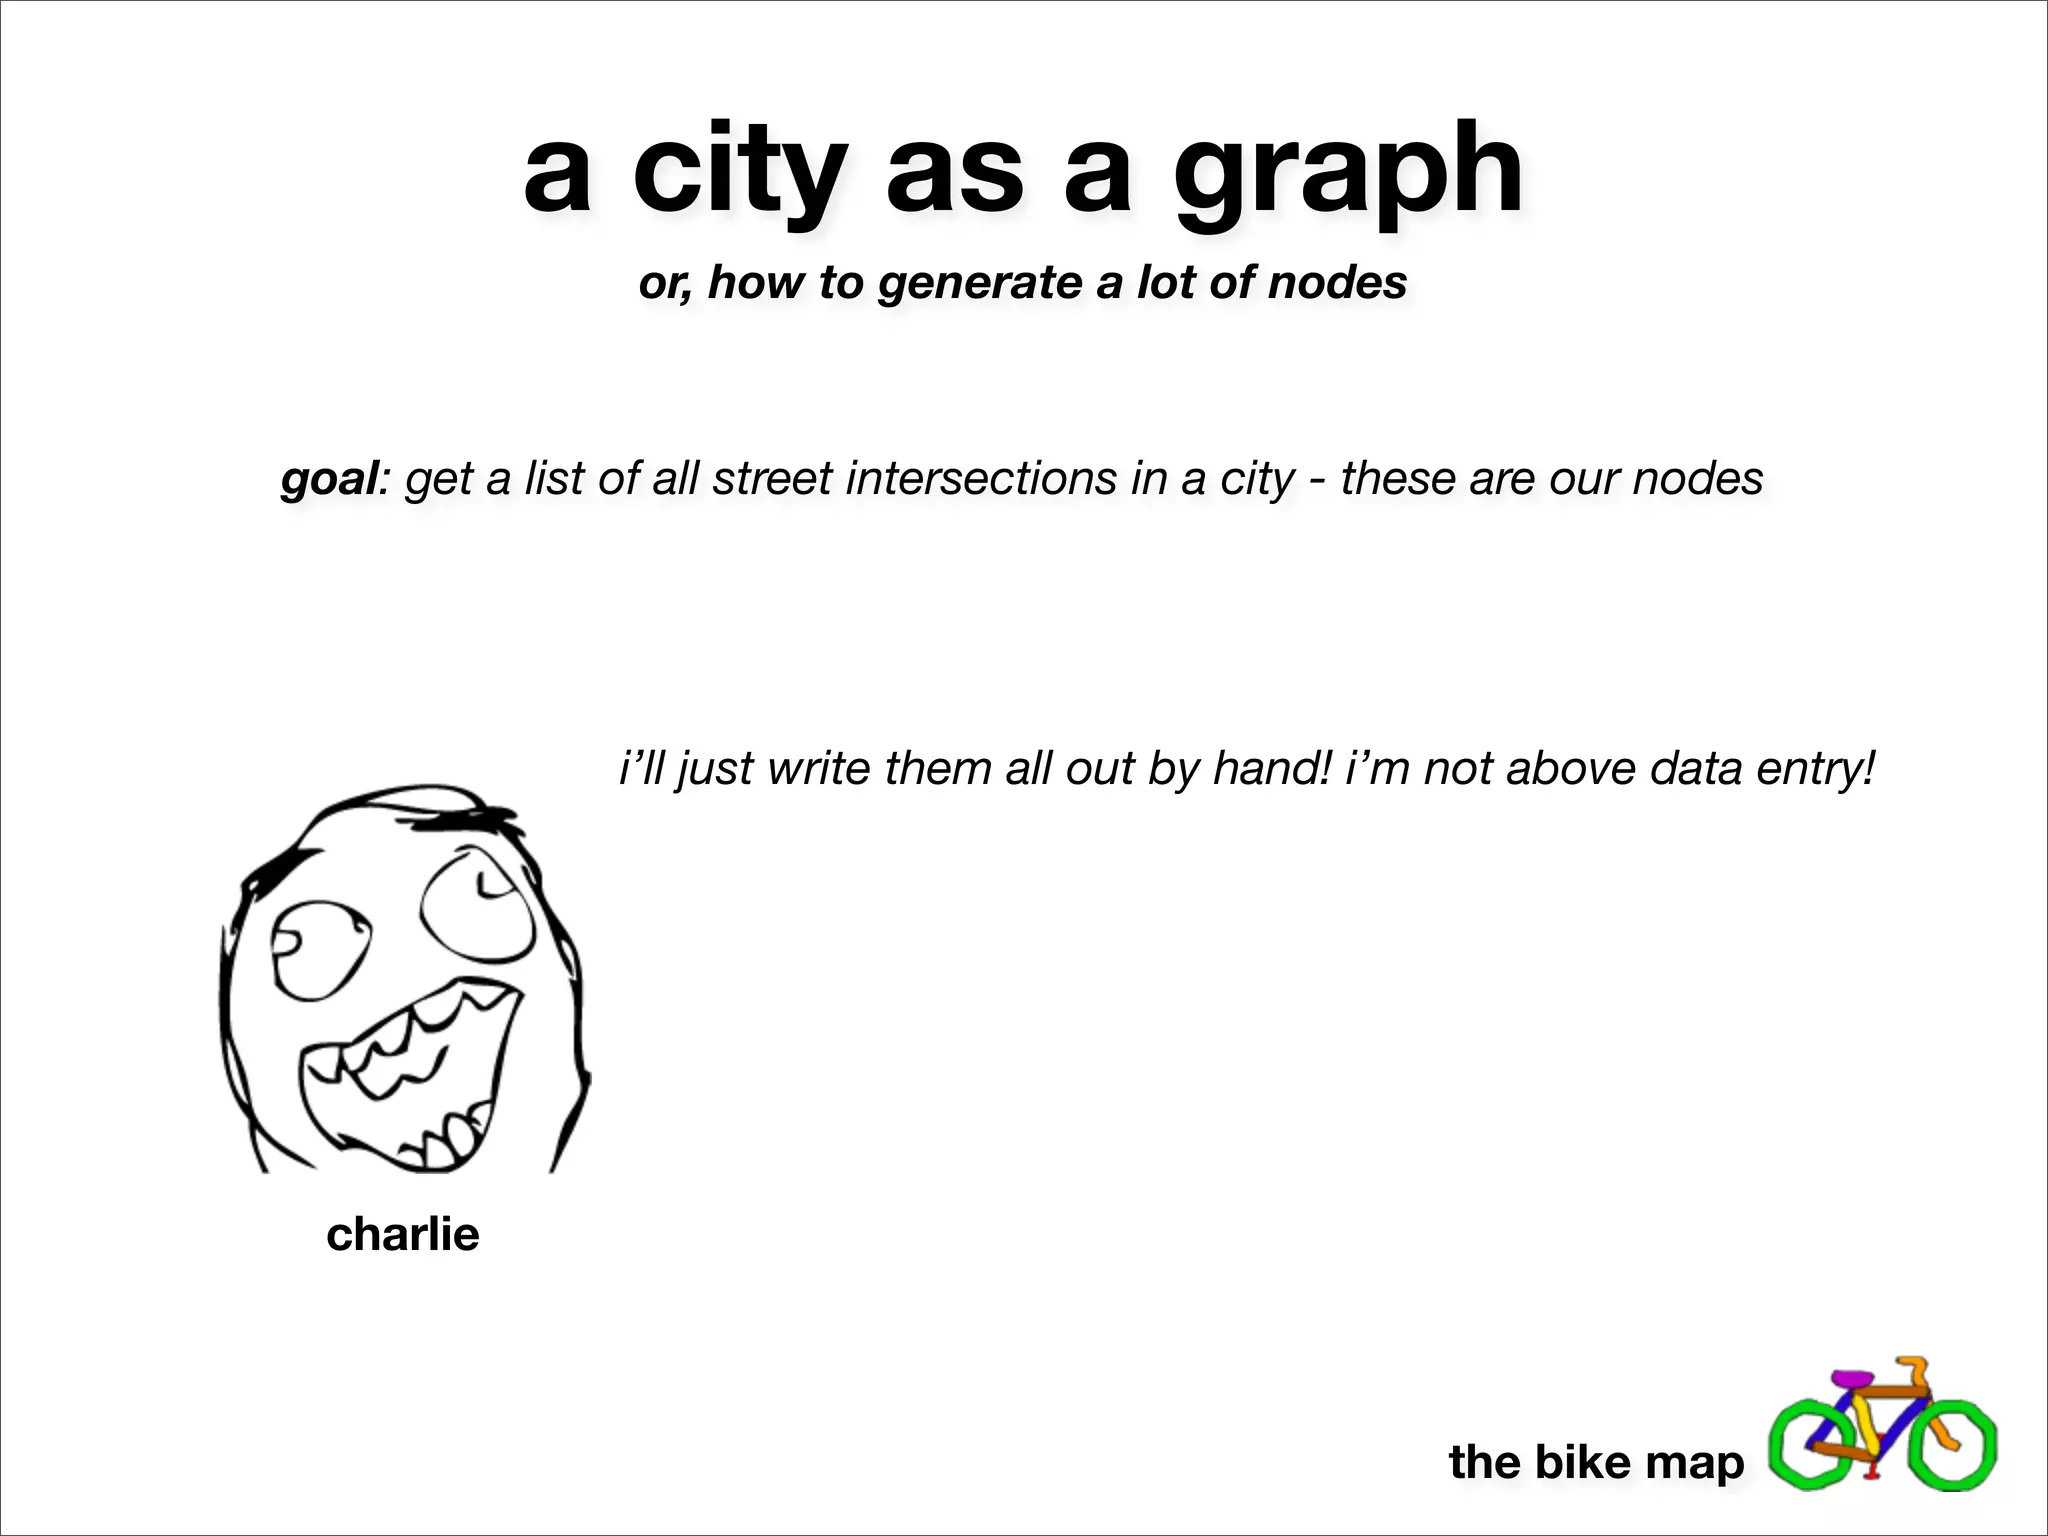
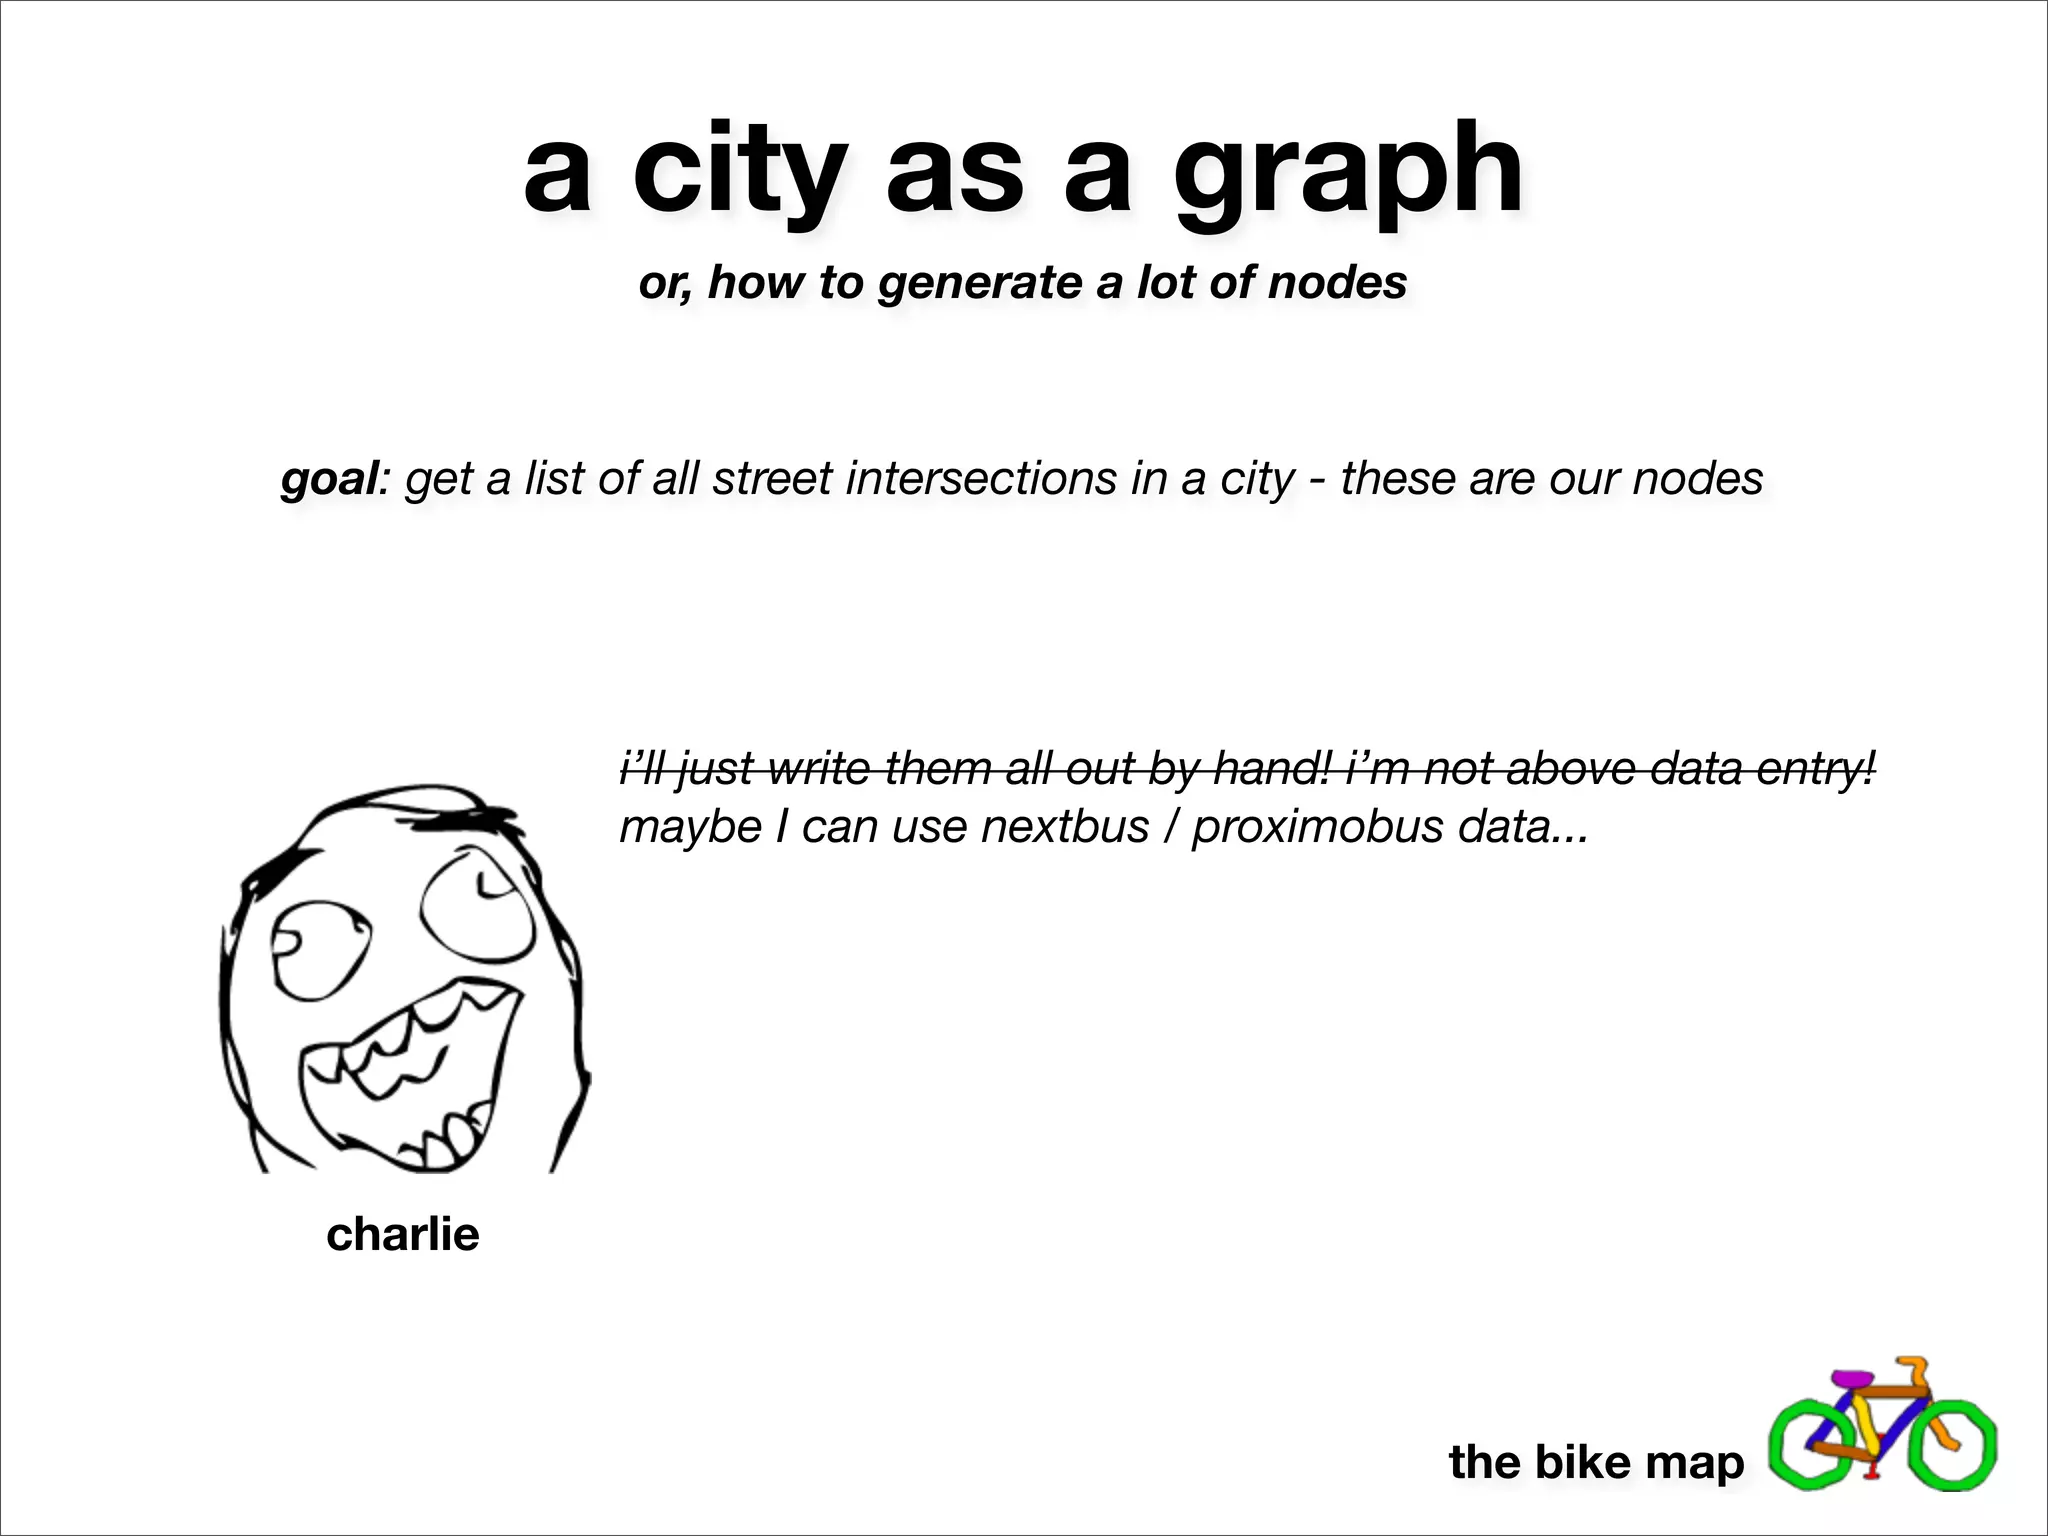
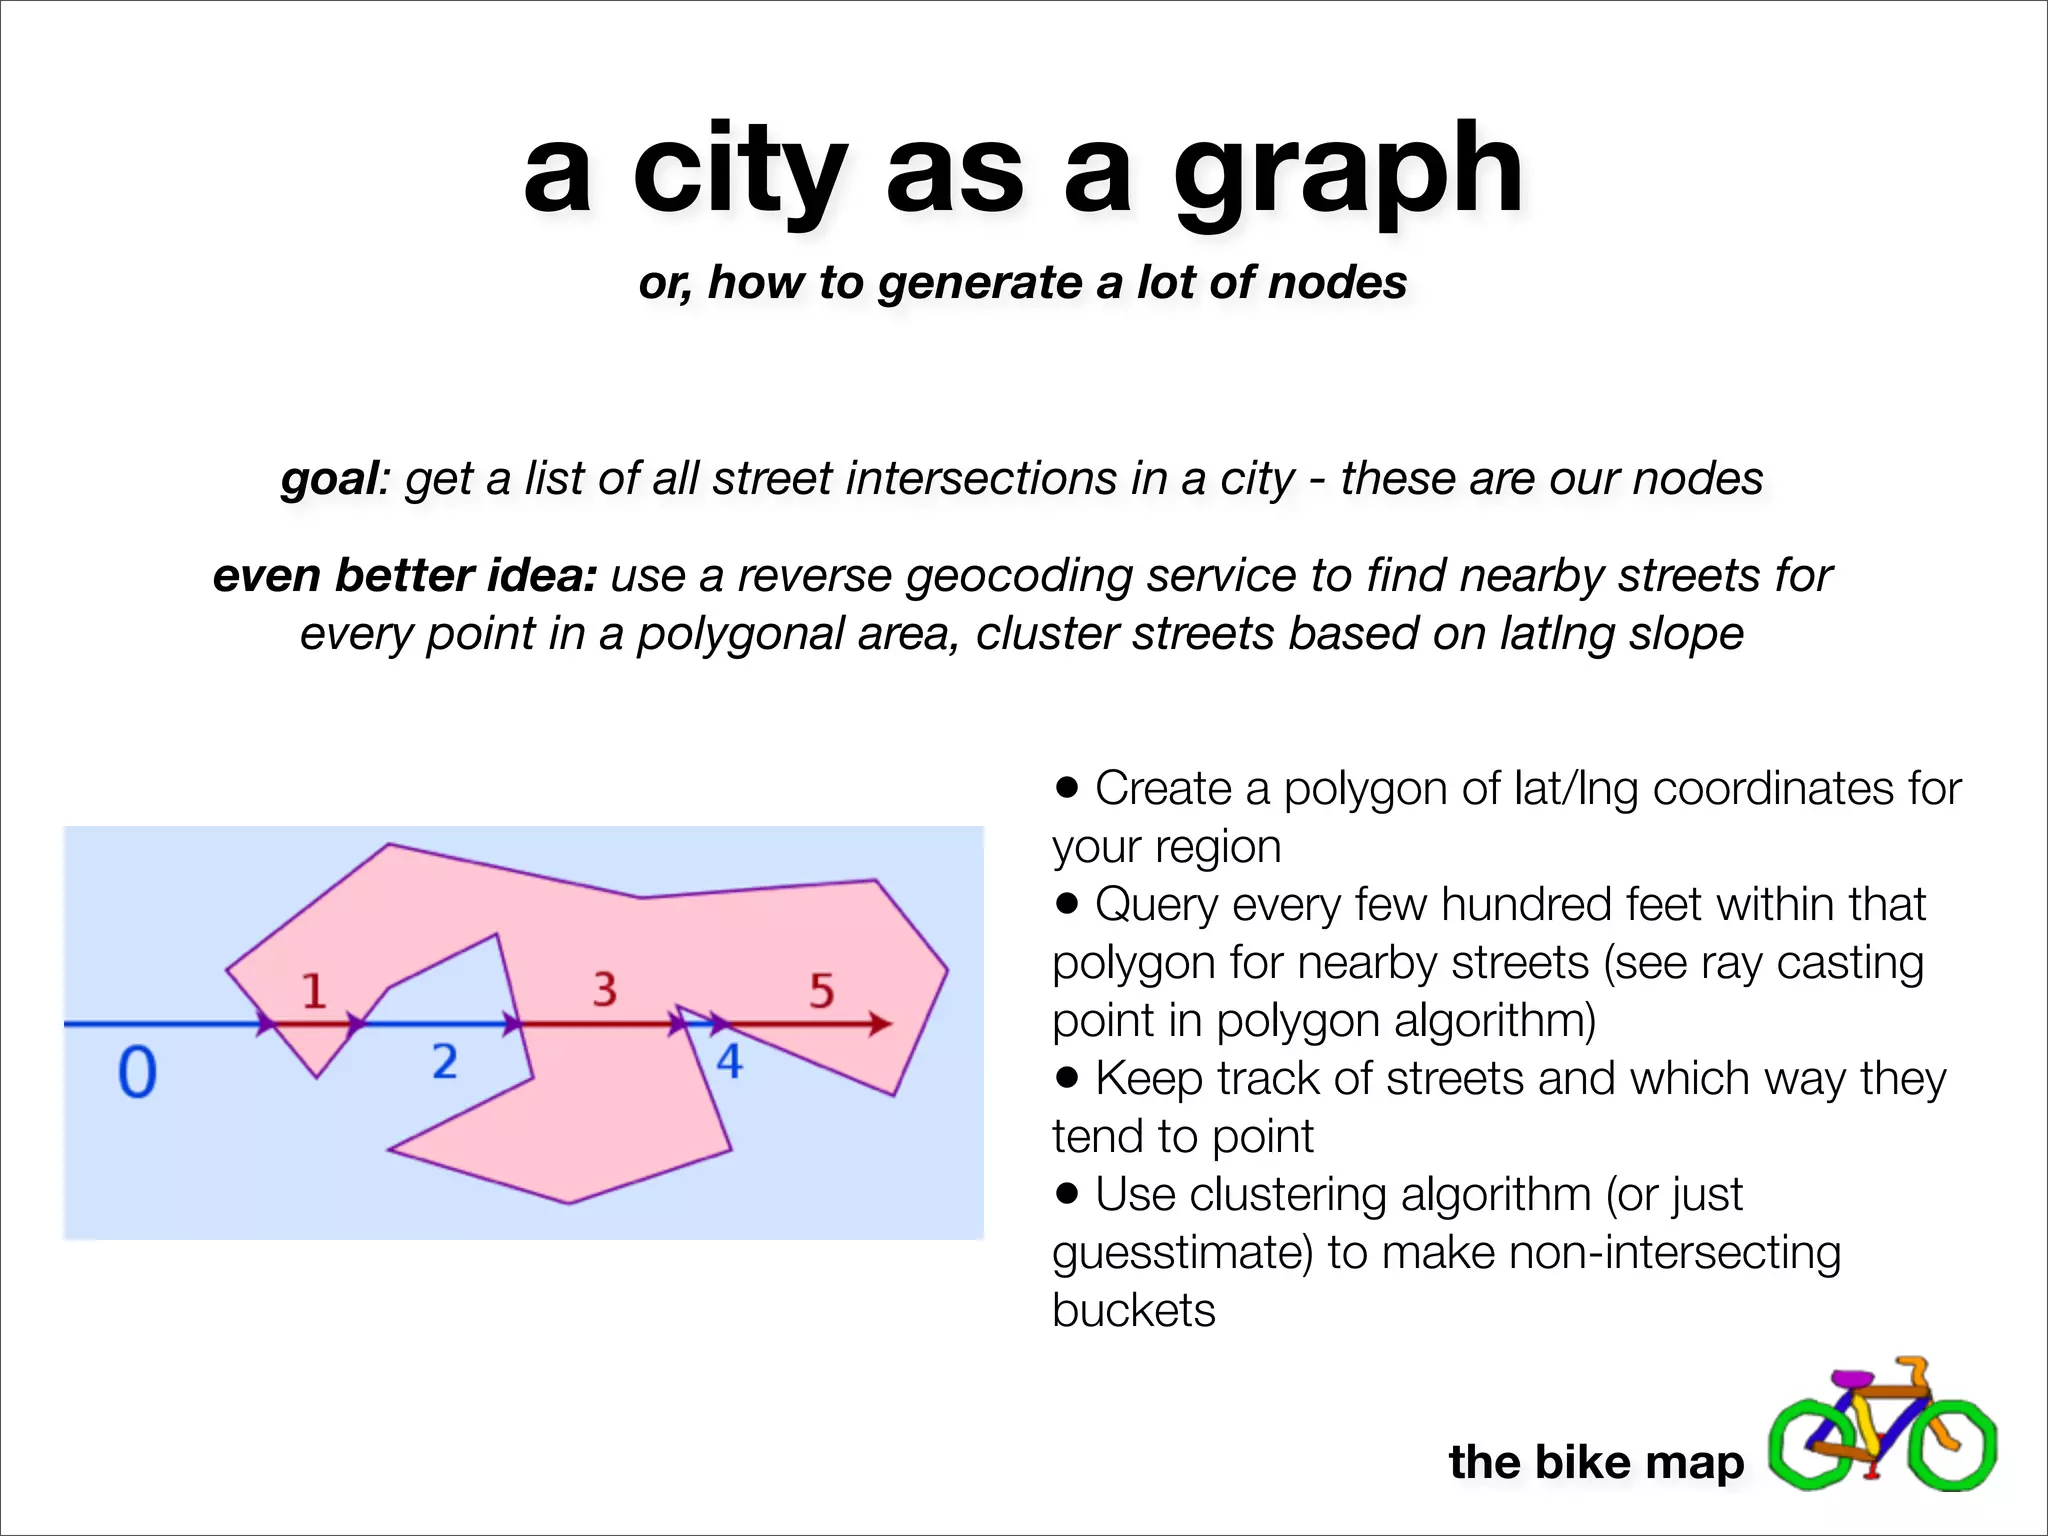
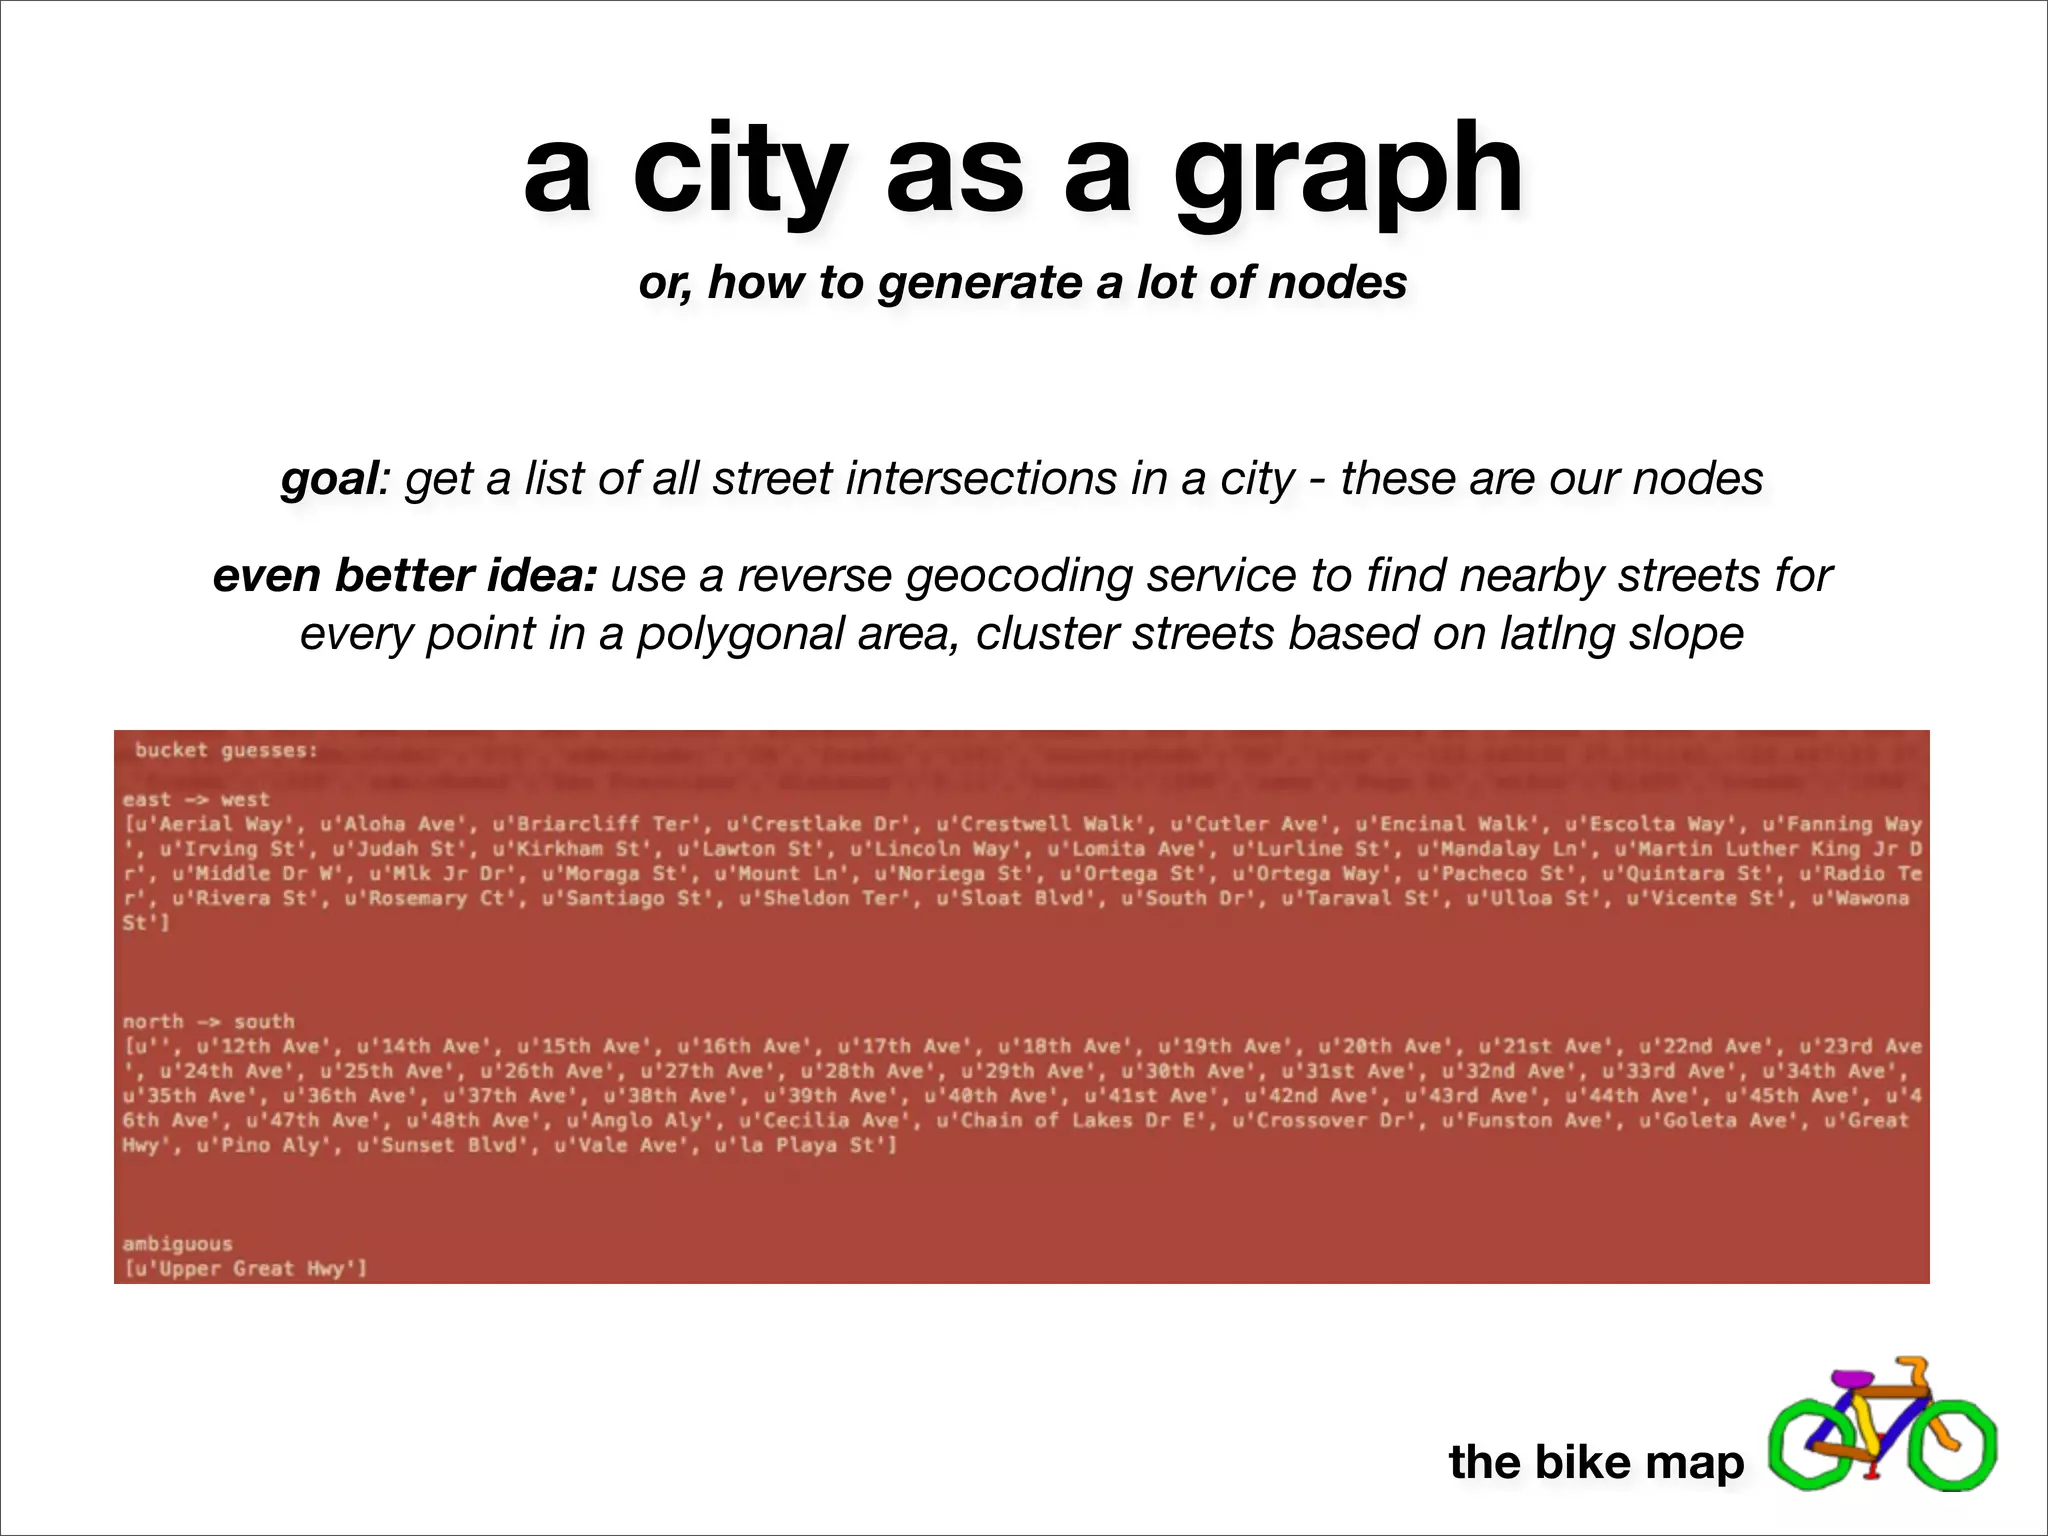
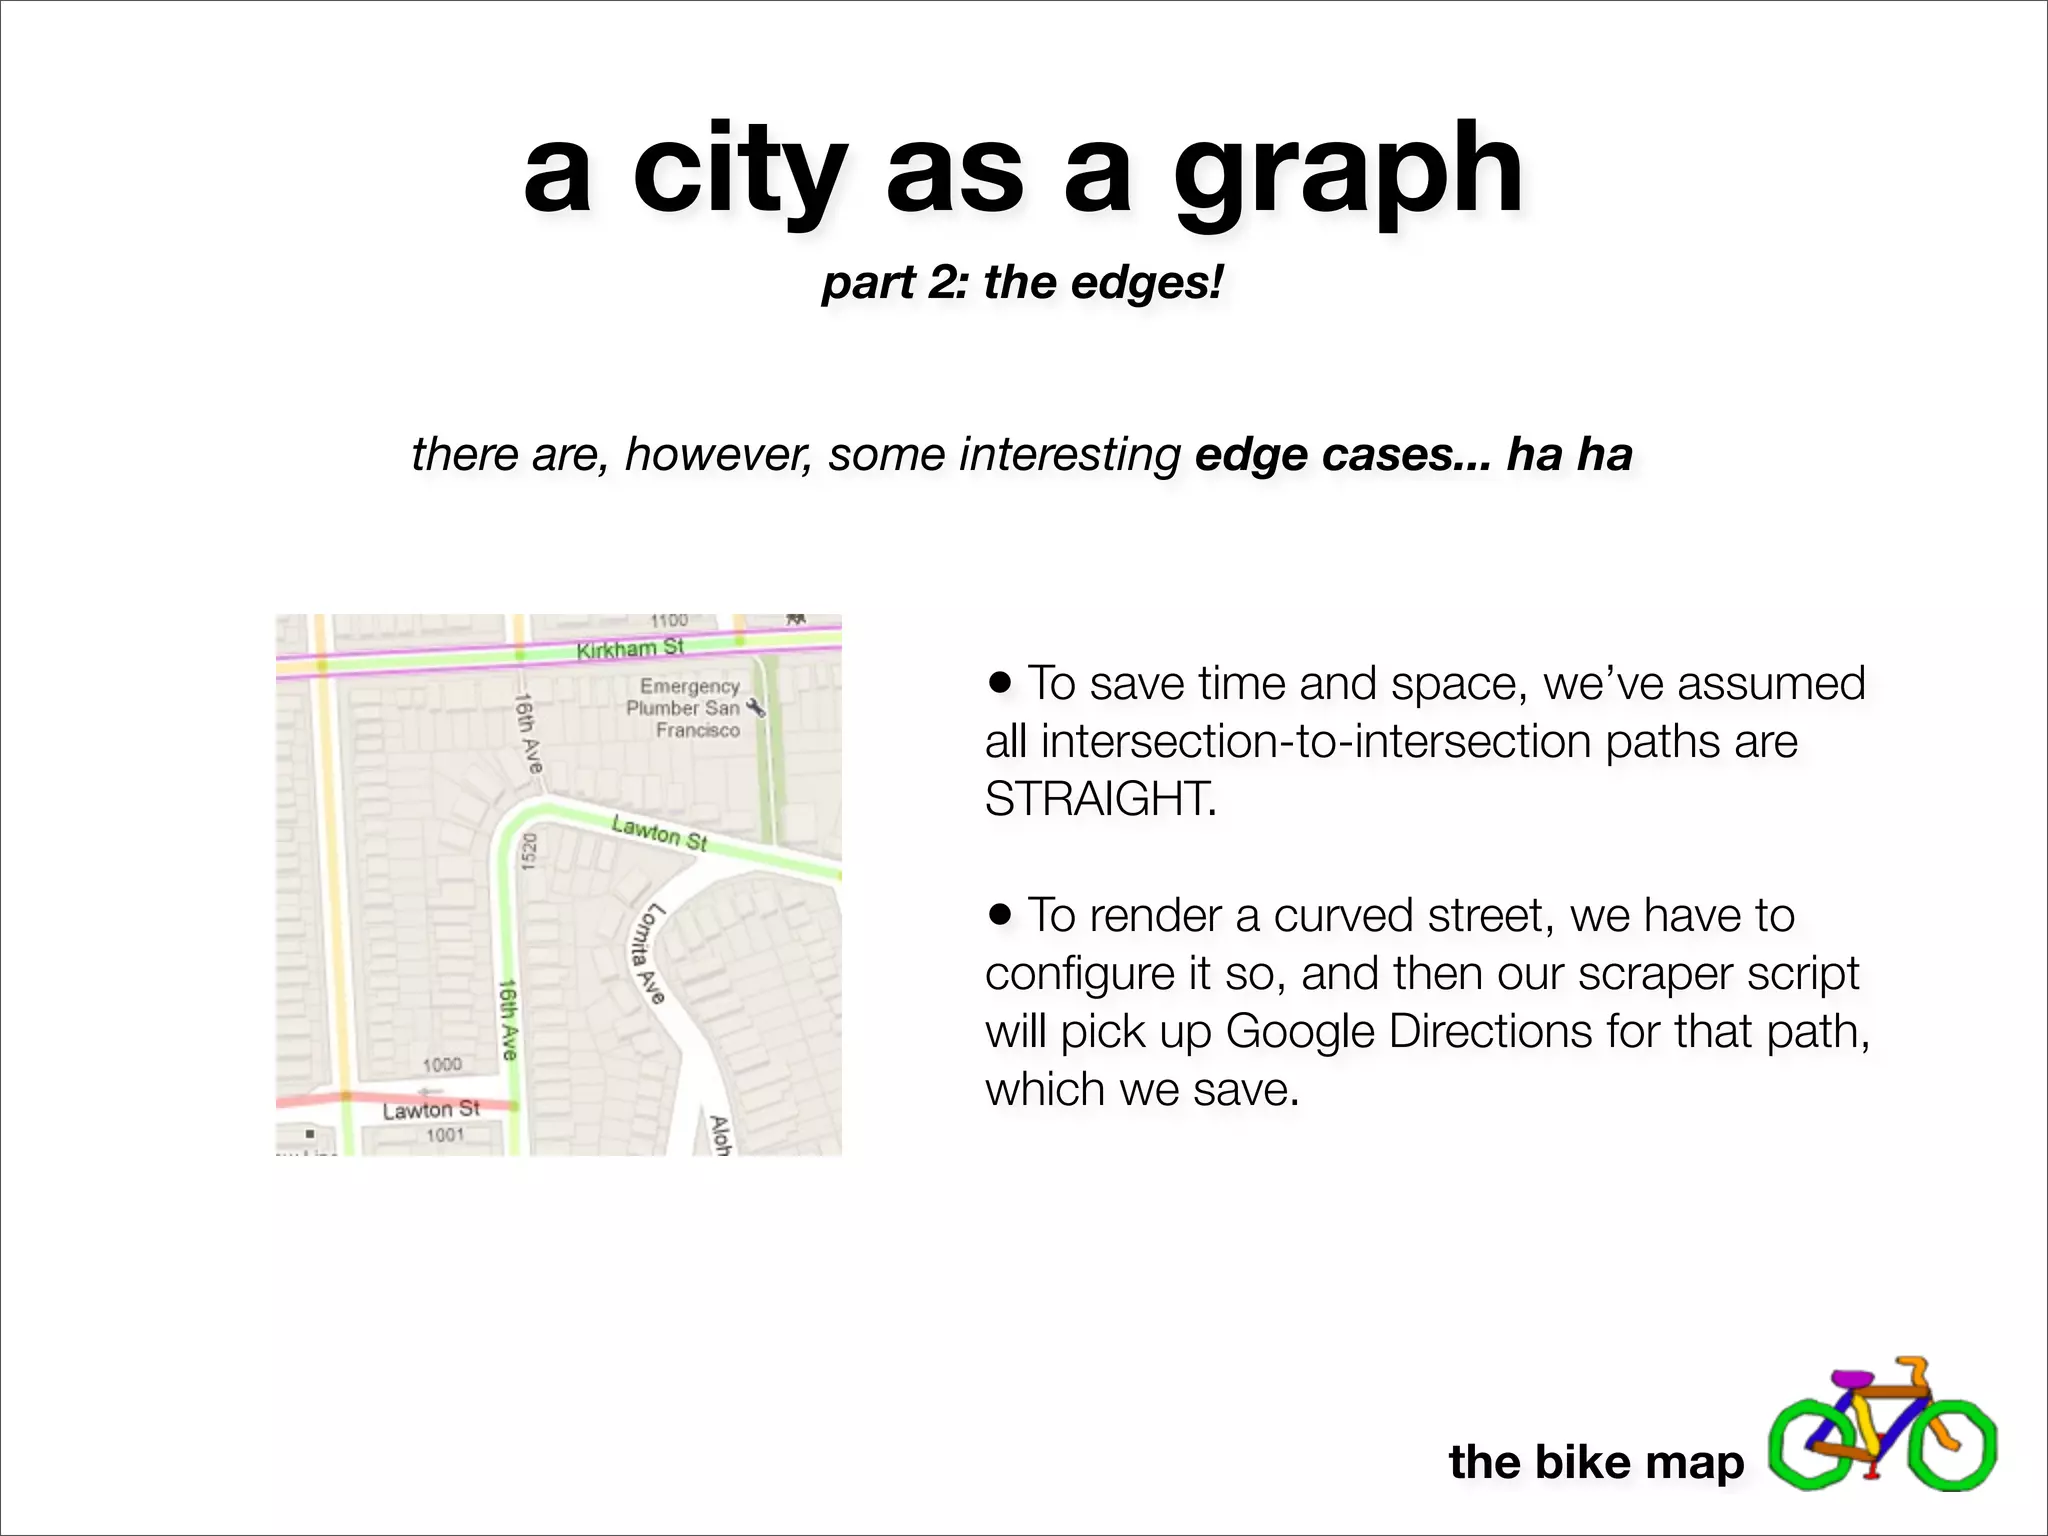
![a city as a graph
or, how to generate a lot of nodes
goal: get a list of all street intersections in a city - these are our nodes
even better idea: use a reverse geocoding service to find nearby streets for
every point in a polygonal area, cluster streets based on latlng slope
http://api.geonames.org/findNearbyStreetsJSON?
lat=37.770443&lng=-122.448172&username=demo
{
"streetSegment" : [
{"line":"-122.447123 37.770935,-122.448768 37.770731", "distance":"0.06", "name":"Page St"},
{"line":"-122.448768 37.770731,-122.448579 37.769798", "distance":"0.06", "name":"Clayton
St"},
{"line":"-122.446934 37.770008,-122.448579 37.769798", "distance":"0.08", "name":"Haight St"},
],
}
the bike map](https://image.slidesharecdn.com/bikemapslides-130110190804-phpapp02/75/the-bike-map-a-look-into-a-practical-application-of-graph-theory-15-2048.jpg)
![how A* works
Strategy:
1. Start with a queue
containing the start node.
2. Dequeue the node with
the lowest sum [f-score] of
heuristic cost (estimated
future cost) and already
sunk cost (cost to get to
current node).
3. Get all the neighbors of
said node, compute their f-
scores, and add them to
your queue.
4. Repeat. End when you
dequeue the goal.
the bike map](https://image.slidesharecdn.com/bikemapslides-130110190804-phpapp02/75/the-bike-map-a-look-into-a-practical-application-of-graph-theory-23-2048.jpg)
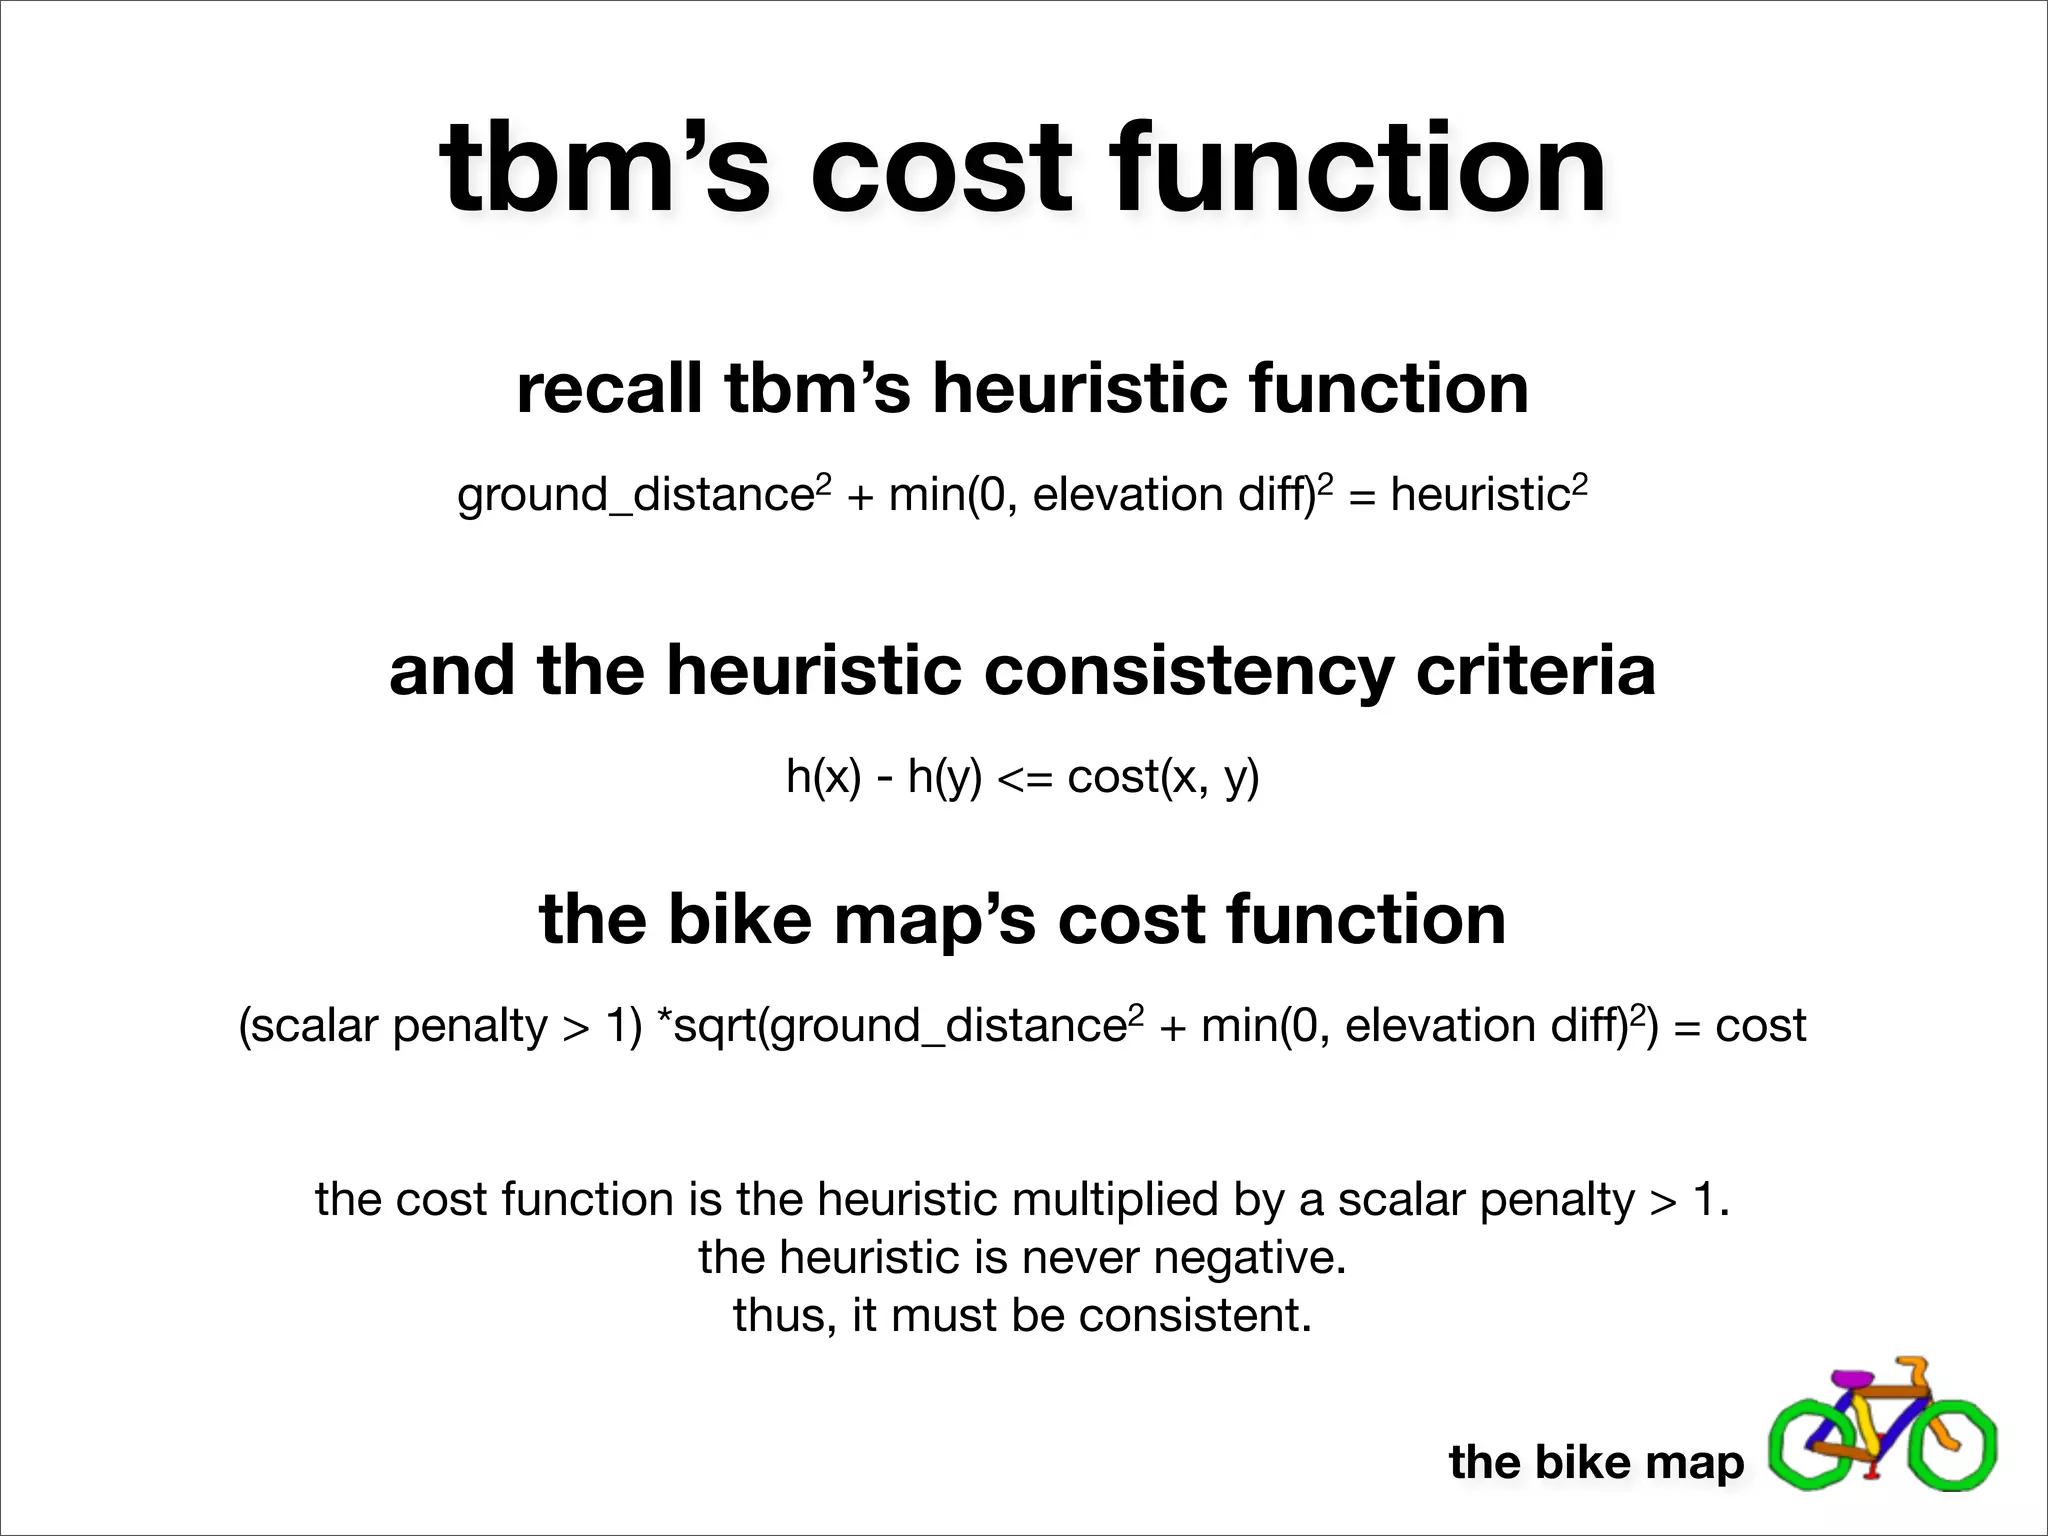
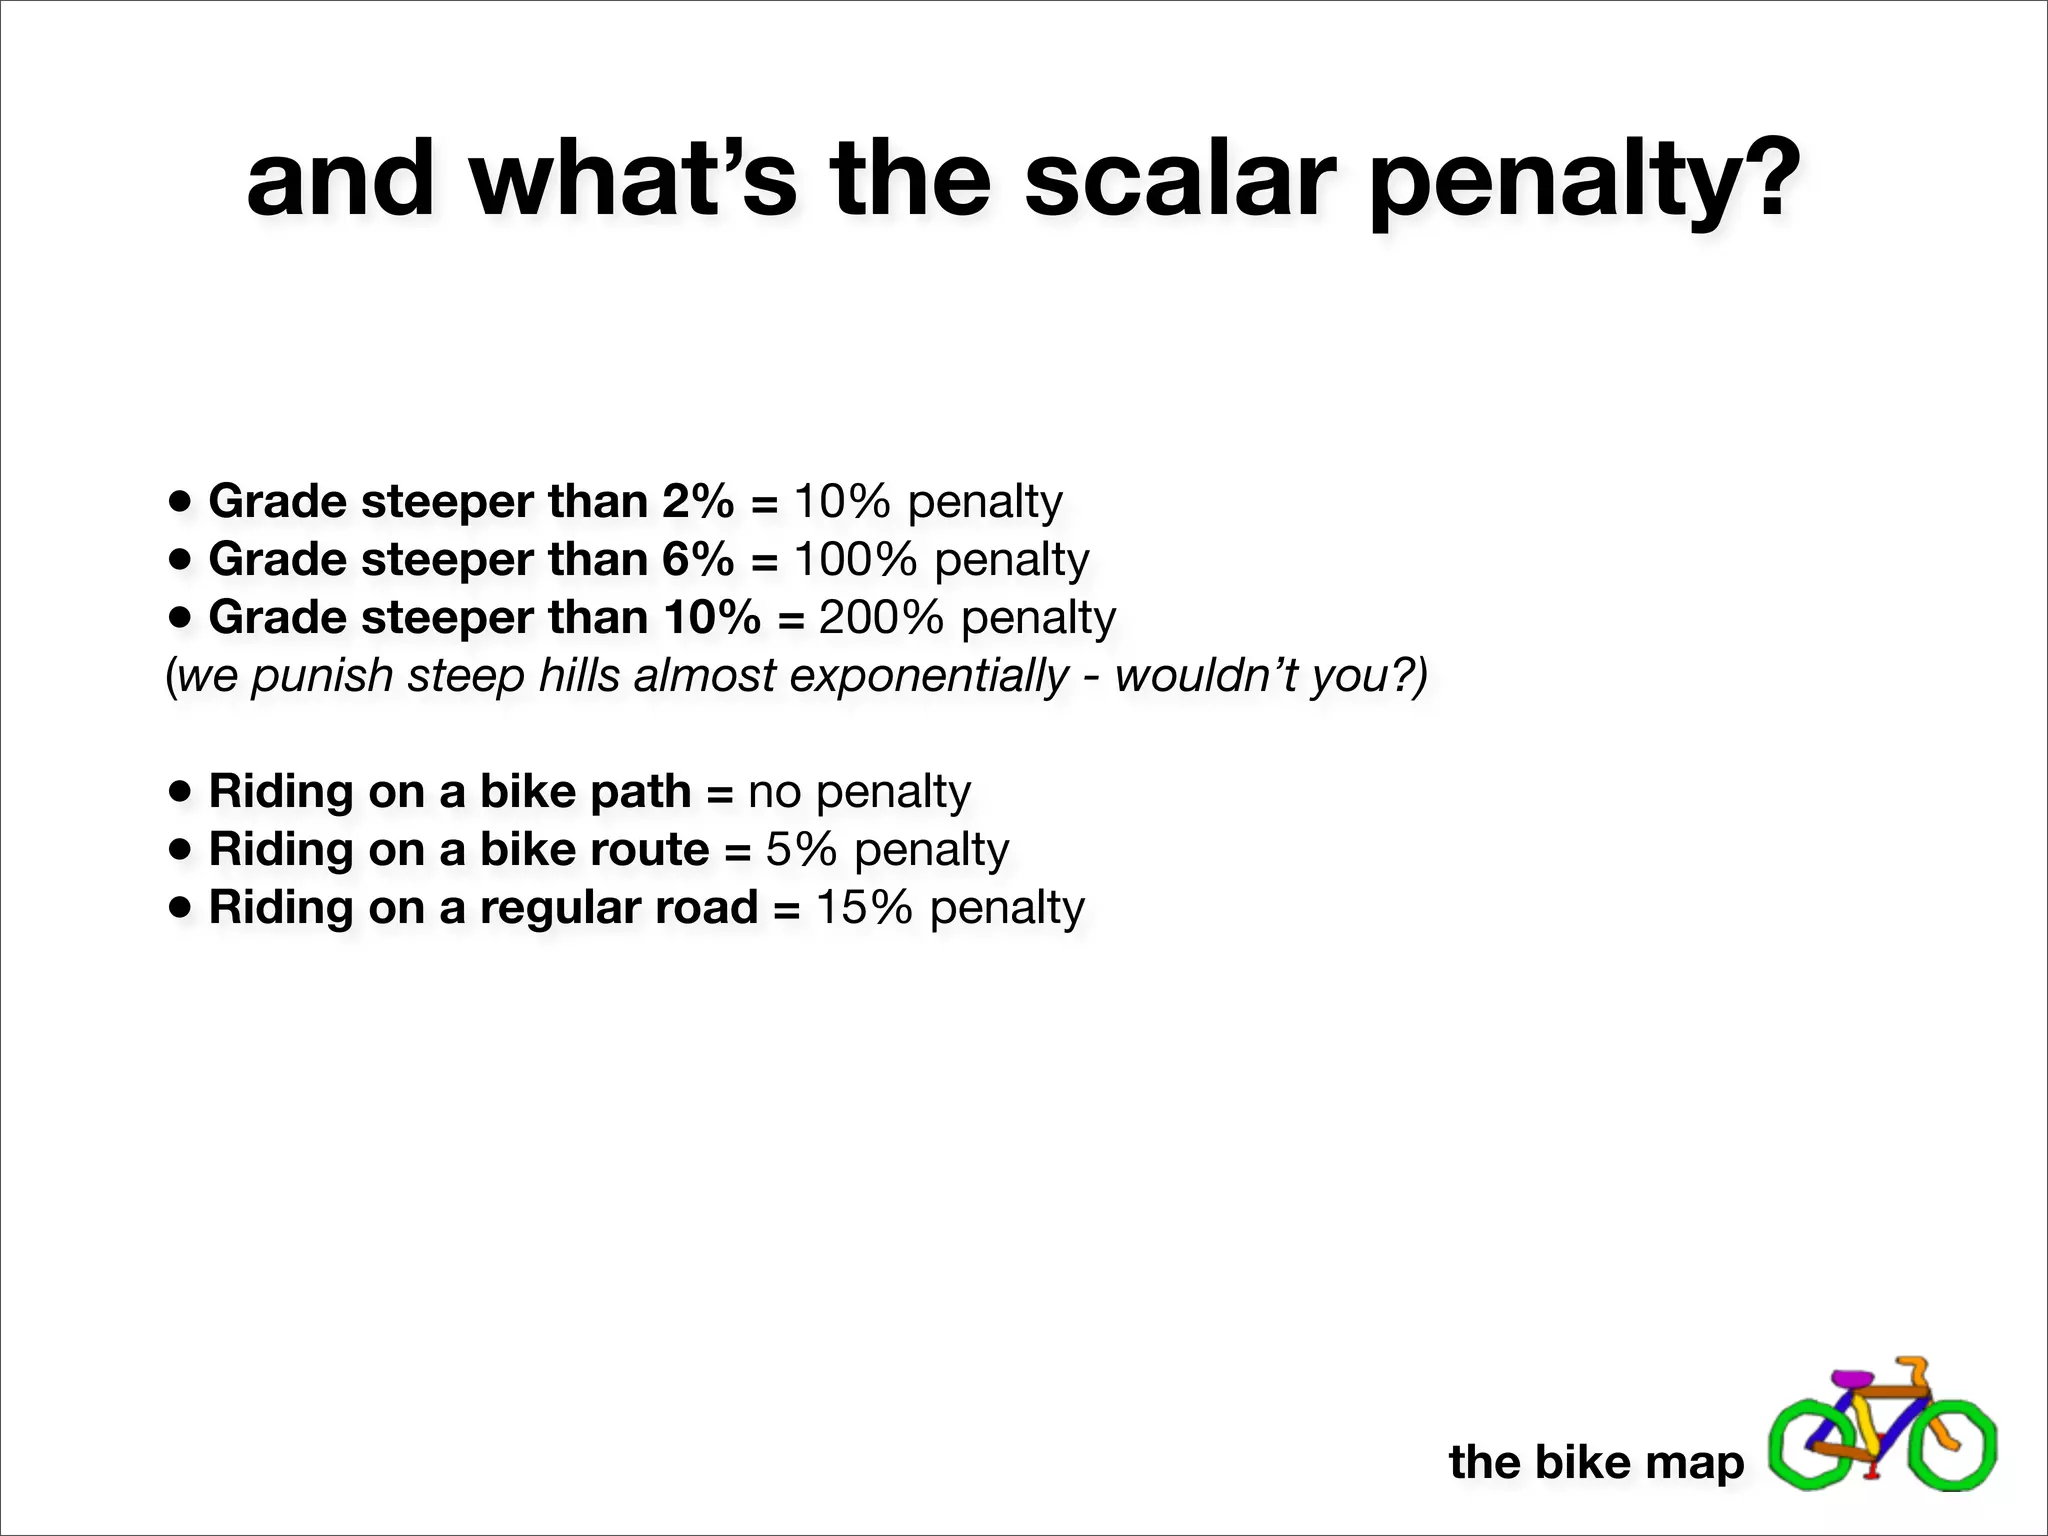
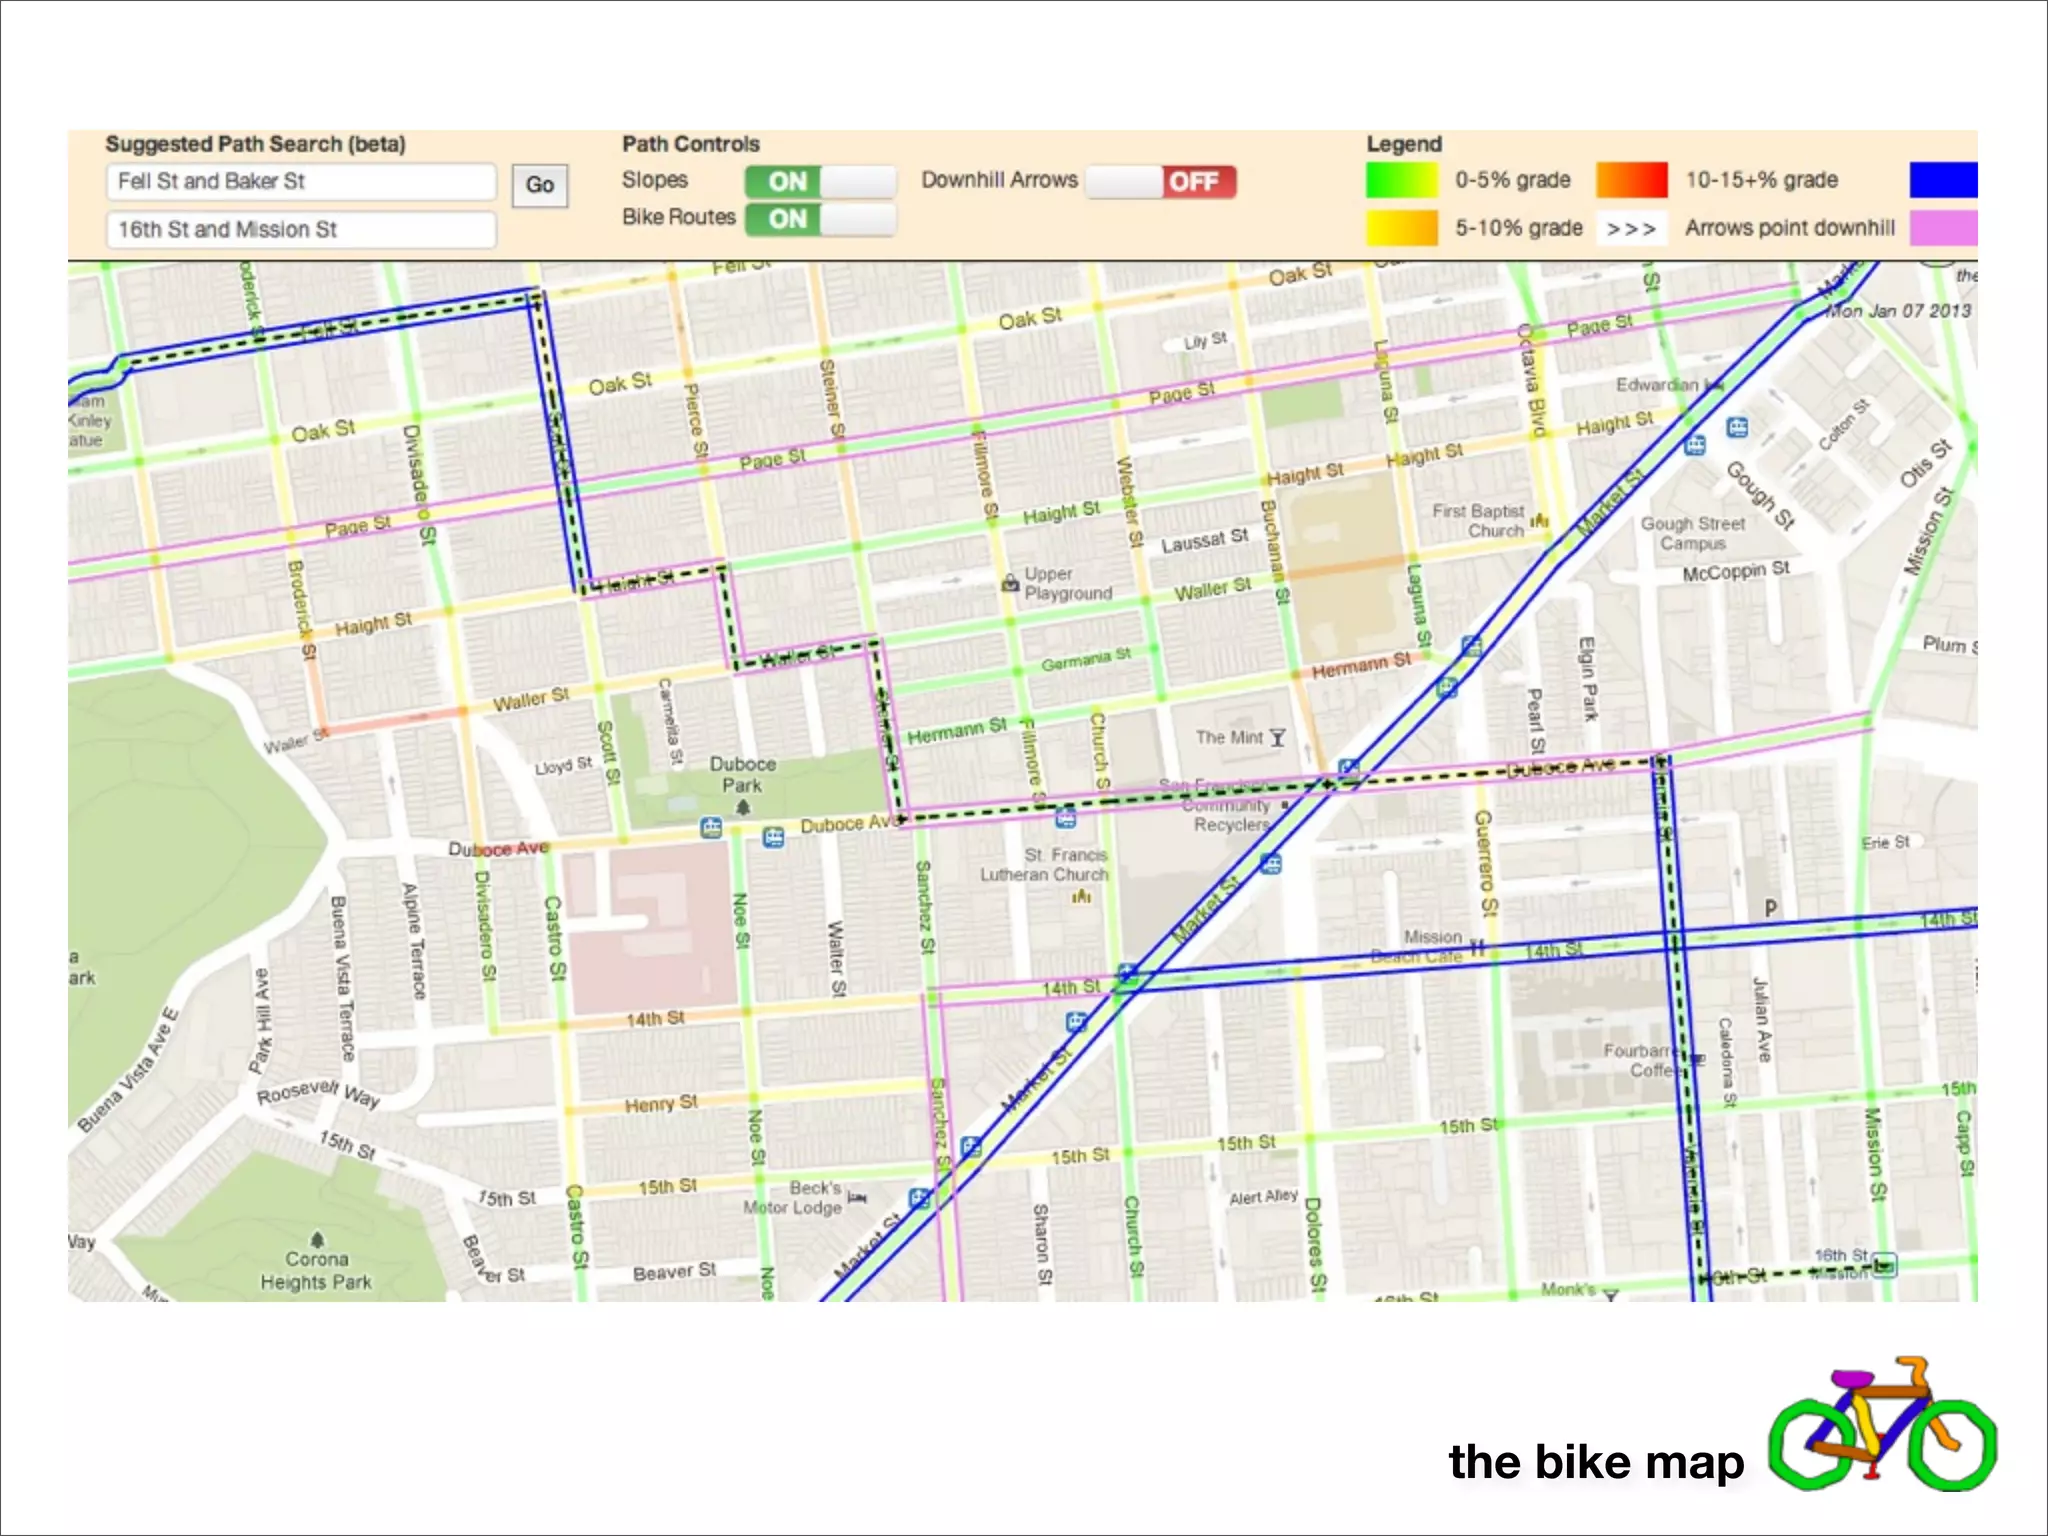


The document describes how a bike route map was created using graph theory and algorithms. Key nodes (intersections) and edges (street segments) were generated from public transit and map data. An A* search algorithm was then used to find optimal routes between locations by minimizing a cost function based on distance and elevation change. The cost function applies penalties for steep grades and road types to encourage bike-friendly routes.


