Downloaded 2,436 times

![Average Time to Respond to Email Inquiries
Sum of Response Times in [TIME UNIT]/ Total Number of Email Inquries =
Average Time to Respond
The [TIME UNIT] in this equation refers to minutes, hours or days, e.g., “Sum of
Response Times in Days”. Response time is defined as the difference in [TIME UNITS]
between the time the inquiry is received and the time that someone in your company
answers the email. While there are a handful of technologies designed to automate
responses, rare is the substitute for a personal email responding to the question or
concern. Any company concerned with how visitors perceive their commitment to
customer support is advised to respond personally to these inquires.
While summing these times can be arduous, the process can be simplified by creating a
central spreadsheet of inquiries and responses or mining your customer support
application for the data.
Presentation
Because nothing is more frustrating to visitors than sending an email and having to wait
endlessly for the response, this KPI is one that lends itself well to conservative alerts and
warnings being generated. Depending on your particular business, you should set the
warning threshold very low and use warning generation as a strong action driver.
Expectation
Your visitors and customers expect a near-instantaneous response to any email they send
you, especially when they have a problem. If you want happy customers and prospects
you should consider setting expectations of response times very low, e.g., less than 6
hours or under one day—same day response. As an exercise, track this KPI against the
volume of calls into your organization to see if a 10 percent improvement in average
response time correlates well to a 10 percent decrease in call volume. You may be
pleasantly surprised.
Action
Regardless of your average response time this KPI should never get worse and increase.
Any sustained increase should immediately be investigated, looking to see if perhaps
there has been an increase in complex inquiries, an extended illness or problem among
those responsible for responding or worse, someone completely ignoring requests for
help.
Average Cost per Visitor
Visitor acquisition costs often spiral out of control when left untracked. While tracking
these costs can be difficult in the long run the effort is worth it.
Definition
A function of the total sum of marketing costs, the average cost per visitor is defined as:
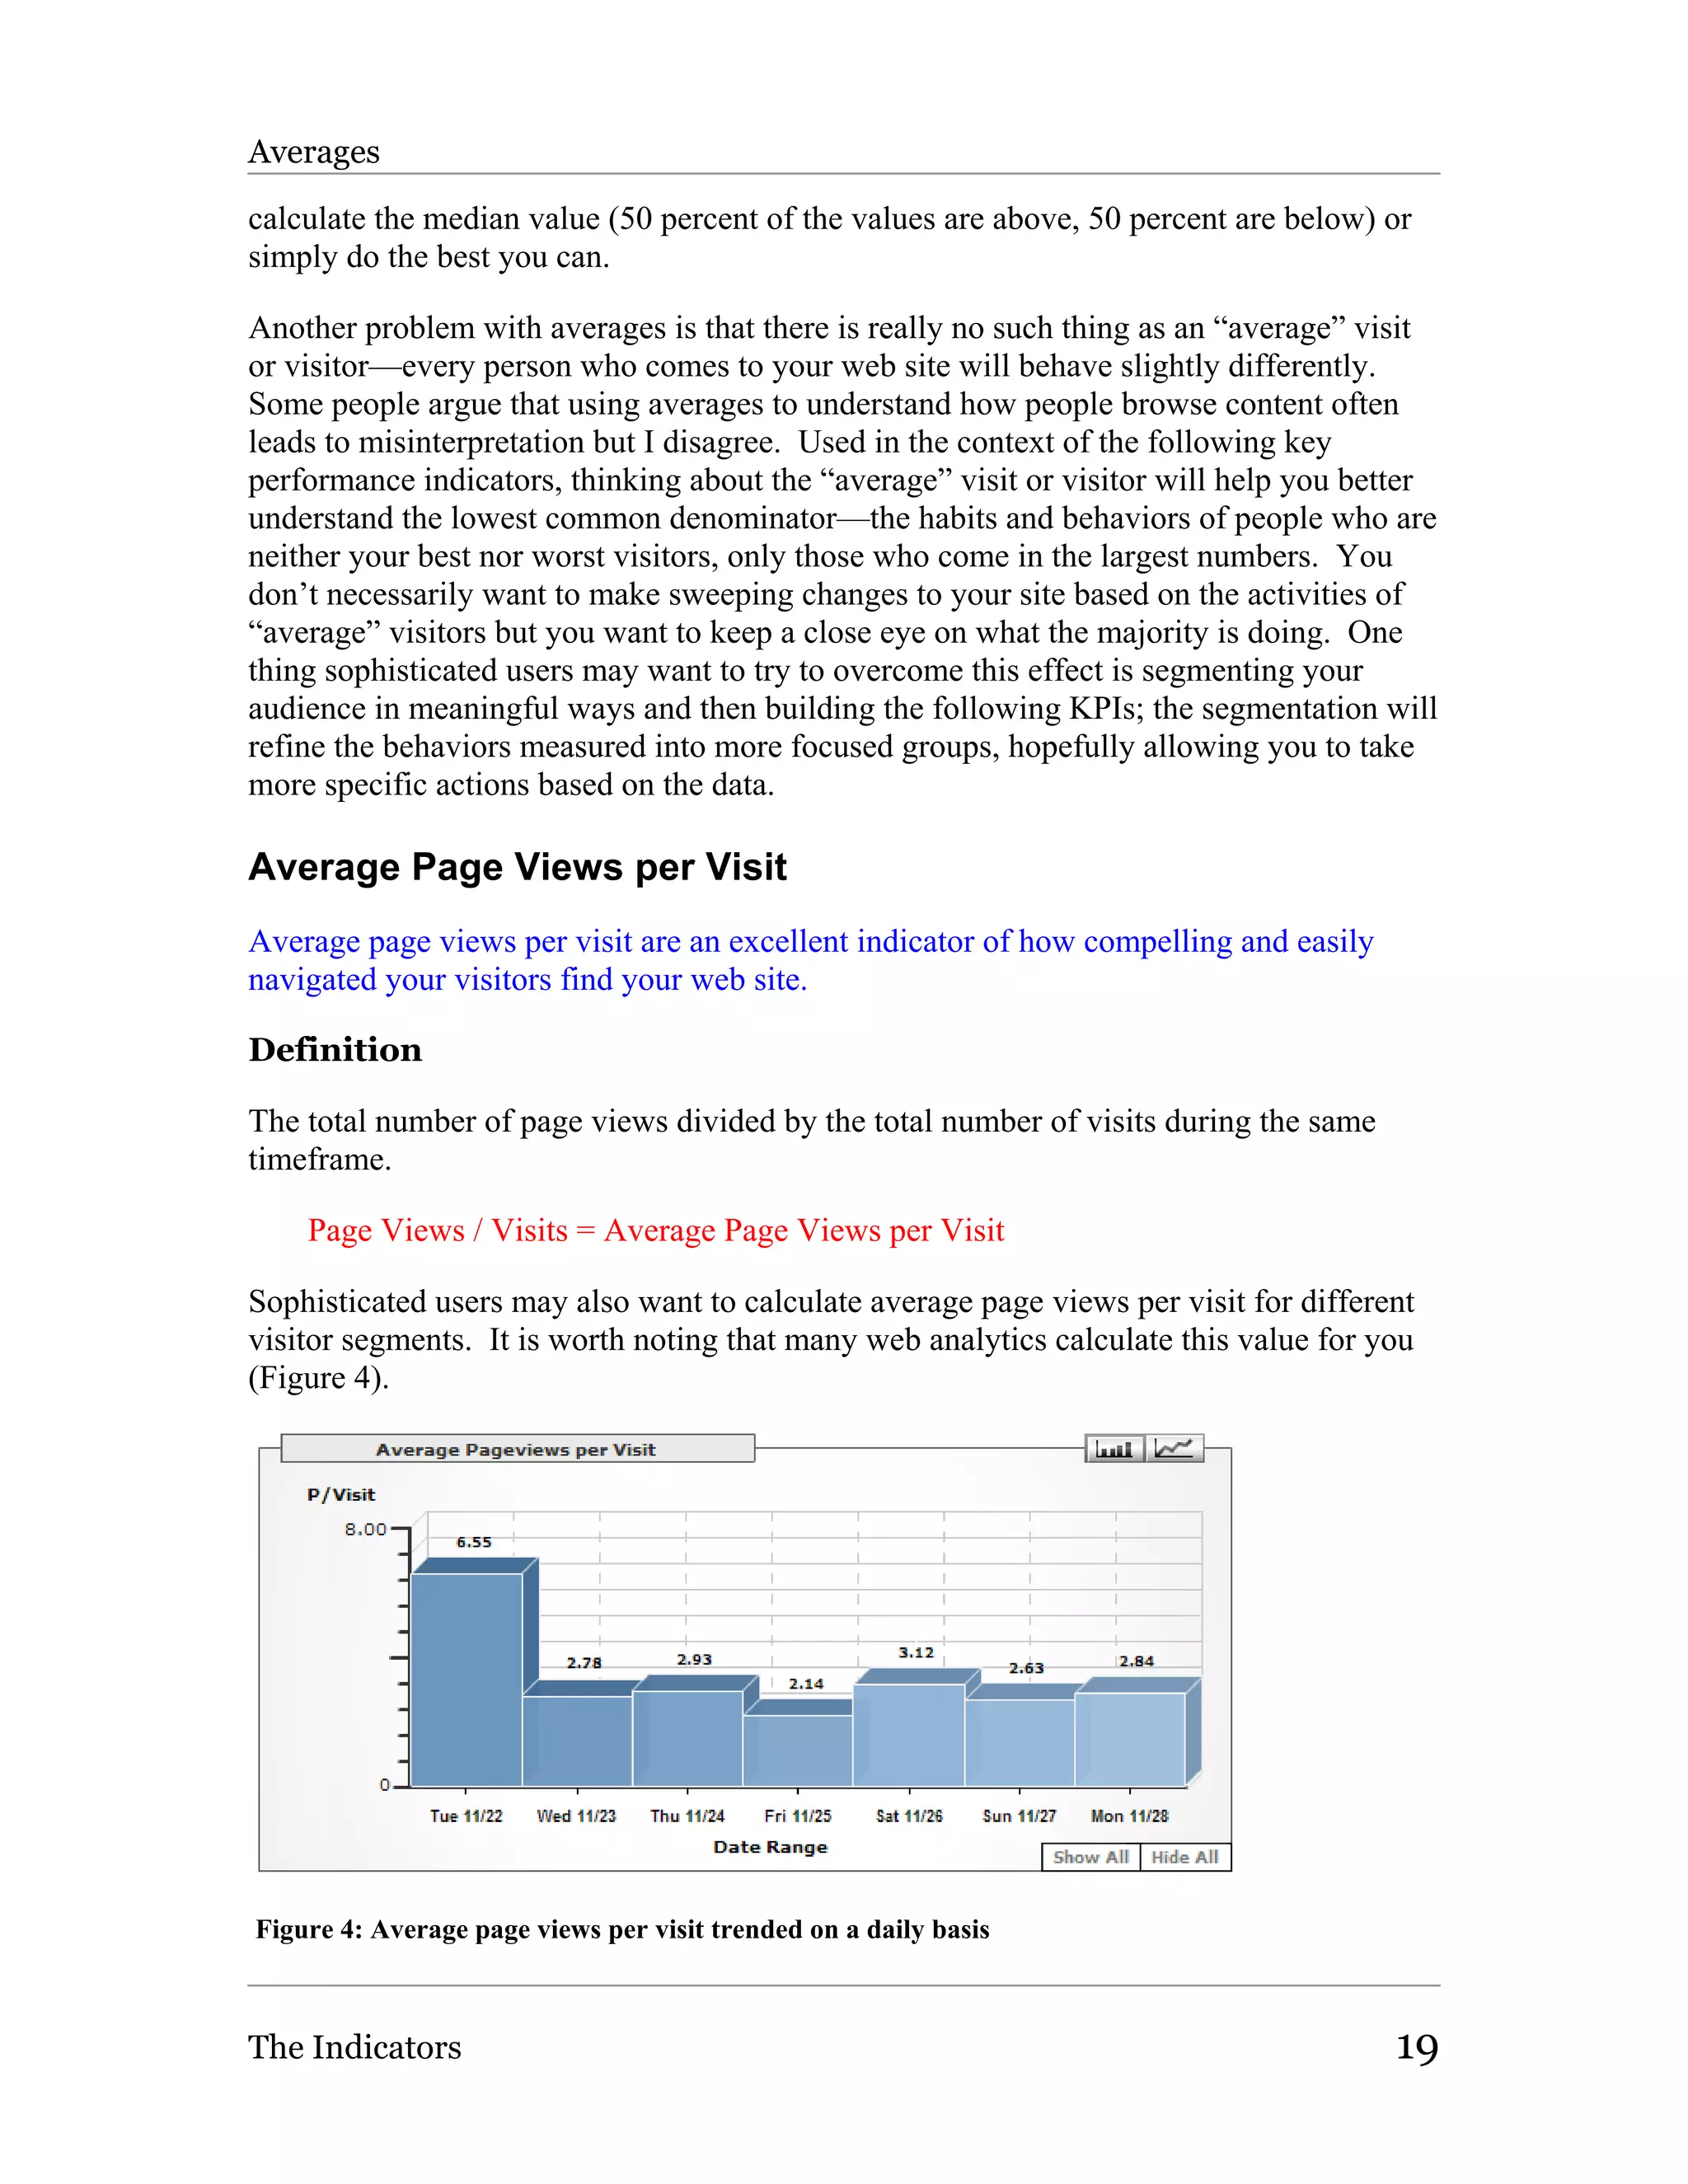
The Indicators 24](https://image.slidesharecdn.com/thebigbookofkeyperformanceindicatorsbyericpeterson-111202070632-phpapp02/75/The-big-book-of-key-performance-indicators-by-eric-peterson-33-2048.jpg)
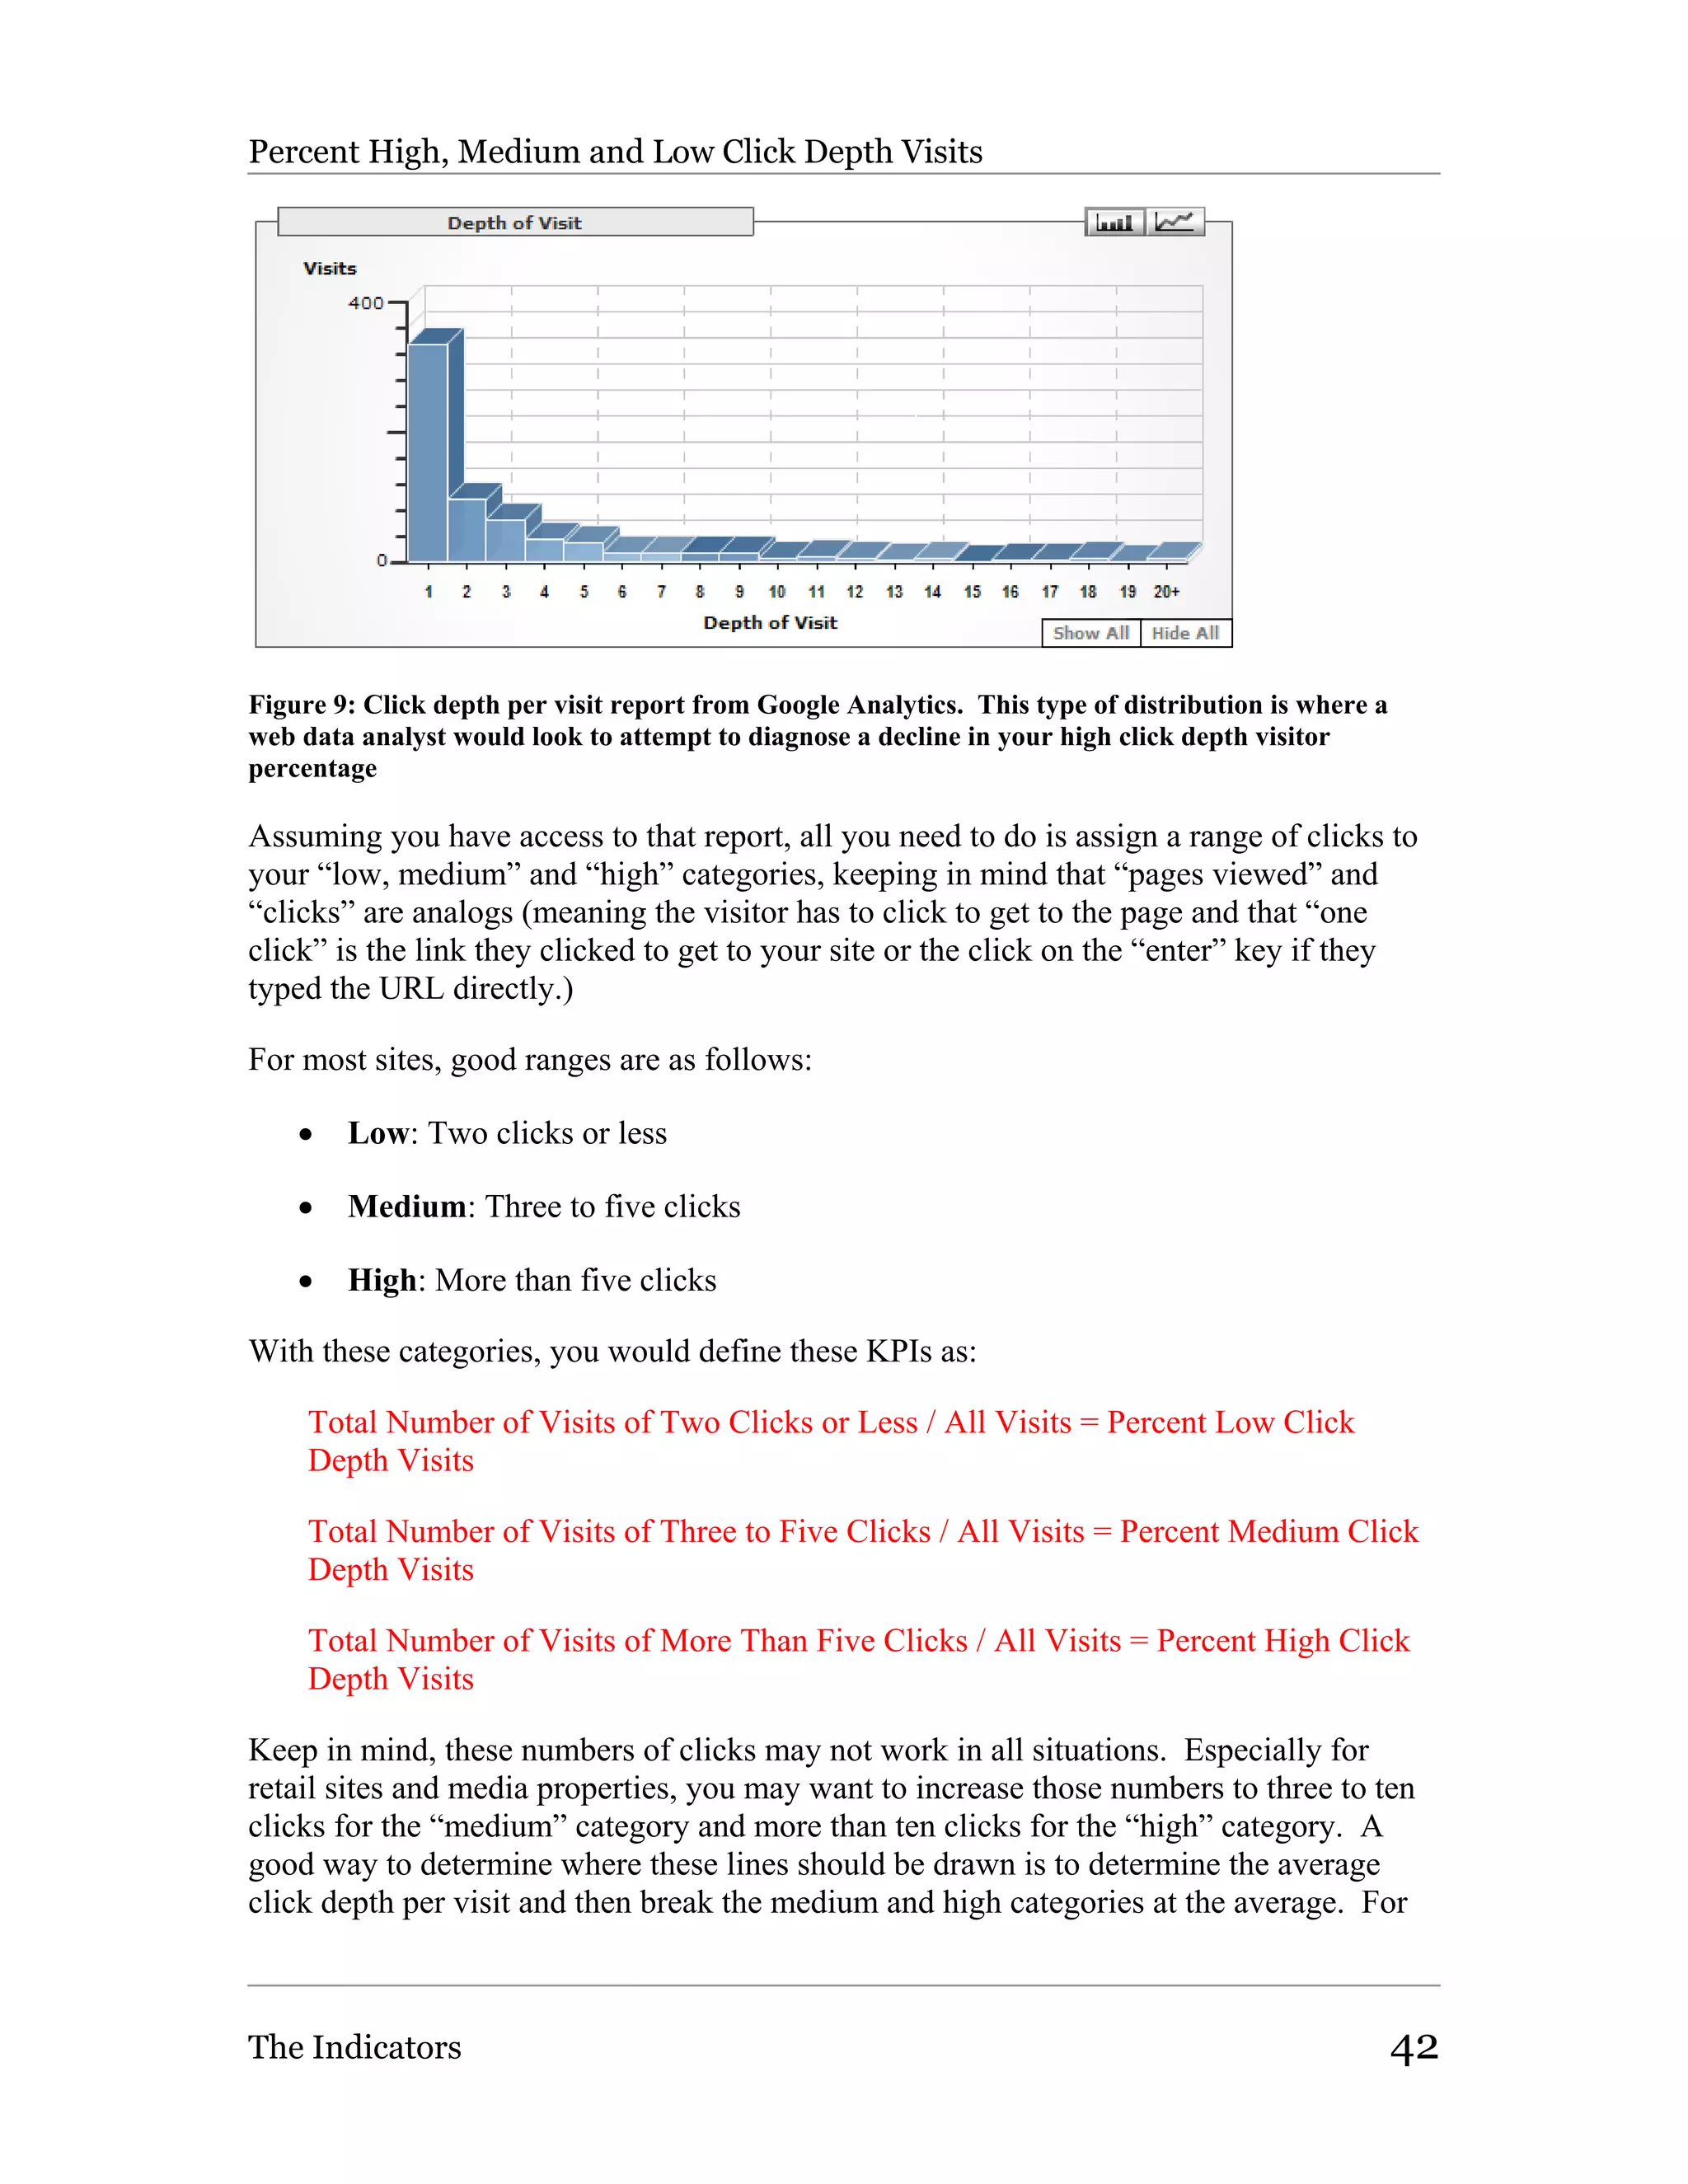


This document is the forward written by Jason Burby for the book "The Big Book of Key Performance Indicators" by Eric T. Peterson. It discusses how most companies have too much web analytics data but lack clear KPIs to measure performance. It states that defining KPIs is crucial but difficult for marketers. The forward explains that the book will provide criteria for what makes a good KPI, examples by industry, and guidance on developing your own KPIs. It aims to help readers better use web analytics tools by first establishing a foundation of key metrics.


