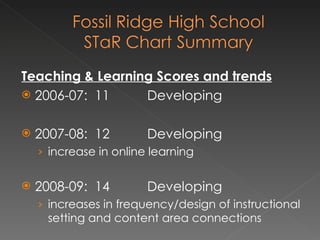
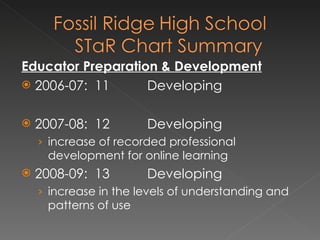
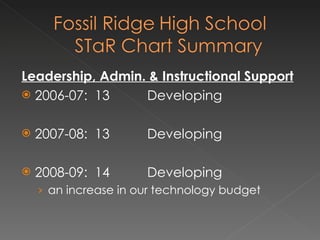
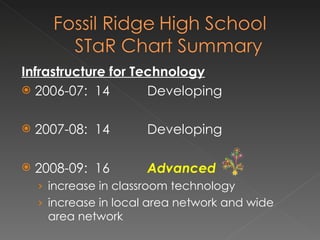
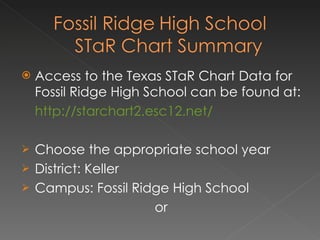
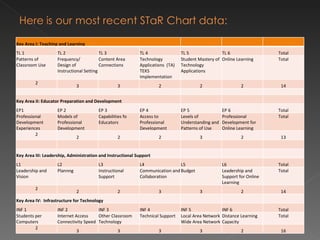
Introduction Our STaR Chart Data and how it applies. What is the STaR chart? used to evaluate a campus’ progress toward meeting the goals of the Texas Long-Range Plan for Technology
How does the STaR Chart benefit student learning? Reflection of how we are incorporating technology Identifies areas of need for us to improve upon.
Teaching & Learning Scores and trends 2006-07:  11 Developing 2007-08:  12 Developing increase in online learning 2008-09:  14 Developing increases in frequency/design of instructional setting and content area connections
Educator Preparation & Development 2006-07:  11 Developing 2007-08:  12 Developing increase of recorded professional development for online learning 2008-09:  13 Developing increase in the levels of understanding and patterns of use
Leadership, Admin. & Instructional Support 2006-07:  13 Developing 2007-08:  13 Developing 2008-09:  14 Developing an increase in our technology budget
Infrastructure for Technology 2006-07:  14 Developing 2007-08:  14 Developing 2008-09:  16 Advanced increase in classroom technology  increase in local area network and wide area network
Access to the Texas STaR Chart Data for Fossil Ridge High School can be found at: http://starchart2.esc12.net/ Choose the appropriate school year District: Keller Campus: Fossil Ridge High School or
Key Area I: Teaching and Learning TL 1 TL 2 TL 3 TL 4 TL 5 TL 6 Total Patterns of Classroom Use Frequency/  Design of Instructional Setting Content Area Connections Technology Applications  (TA)  TEKS Implementation Student Mastery of Technology Applications Online Learning Total 2 3 3 2 2 2 14 Key Area II: Educator Preparation and Development EP1 EP 2 EP 3 EP 4 EP 5 EP 6 Total Professional Development Experiences Models of Professional Development Capabilities fo Educators Access to Professional Development Levels of Understanding and Patterns of Use Professional Development for Online Learning Total 2 2 2 2 3 2 13               Key Area III: Leadership, Administration and Instructional Support L1 L2 L3 L4 L5 L6 Total Leadership and Vision Plannng Instructional Support Communication and Collaboration Budget Leadership and Support for Online Learning Total 2 2 2 3 3 2 14 Key Area IV:  Infrastructure for Technology INF 1 INF 2 INF 3 INF 4 INF 5 INF 6 Total Students per Computers Internet Access Connectivity Speed Other Classroom Technology Technical Support Local Area Network Wide Area Network Distance Learning Capacity Total 2 3 3 3 3 2 16
Conclusion We are at the “toddler” stage We must collaborate and incorporate The dinosaurs could not adapt!
 

Fossil ridge high school s ta r chart summary

  • 1.
    Introduction Our STaRChart Data and how it applies. What is the STaR chart? used to evaluate a campus’ progress toward meeting the goals of the Texas Long-Range Plan for Technology
  • 2.
    How does theSTaR Chart benefit student learning? Reflection of how we are incorporating technology Identifies areas of need for us to improve upon.
  • 3.
    Teaching & LearningScores and trends 2006-07: 11 Developing 2007-08: 12 Developing increase in online learning 2008-09: 14 Developing increases in frequency/design of instructional setting and content area connections
  • 4.
    Educator Preparation &Development 2006-07: 11 Developing 2007-08: 12 Developing increase of recorded professional development for online learning 2008-09: 13 Developing increase in the levels of understanding and patterns of use
  • 5.
    Leadership, Admin. &Instructional Support 2006-07: 13 Developing 2007-08: 13 Developing 2008-09: 14 Developing an increase in our technology budget
  • 6.
    Infrastructure for Technology2006-07: 14 Developing 2007-08: 14 Developing 2008-09: 16 Advanced increase in classroom technology increase in local area network and wide area network
  • 7.
    Access to theTexas STaR Chart Data for Fossil Ridge High School can be found at: http://starchart2.esc12.net/ Choose the appropriate school year District: Keller Campus: Fossil Ridge High School or
  • 8.
    Key Area I:Teaching and Learning TL 1 TL 2 TL 3 TL 4 TL 5 TL 6 Total Patterns of Classroom Use Frequency/ Design of Instructional Setting Content Area Connections Technology Applications (TA) TEKS Implementation Student Mastery of Technology Applications Online Learning Total 2 3 3 2 2 2 14 Key Area II: Educator Preparation and Development EP1 EP 2 EP 3 EP 4 EP 5 EP 6 Total Professional Development Experiences Models of Professional Development Capabilities fo Educators Access to Professional Development Levels of Understanding and Patterns of Use Professional Development for Online Learning Total 2 2 2 2 3 2 13               Key Area III: Leadership, Administration and Instructional Support L1 L2 L3 L4 L5 L6 Total Leadership and Vision Plannng Instructional Support Communication and Collaboration Budget Leadership and Support for Online Learning Total 2 2 2 3 3 2 14 Key Area IV: Infrastructure for Technology INF 1 INF 2 INF 3 INF 4 INF 5 INF 6 Total Students per Computers Internet Access Connectivity Speed Other Classroom Technology Technical Support Local Area Network Wide Area Network Distance Learning Capacity Total 2 3 3 3 3 2 16
  • 9.
    Conclusion We areat the “toddler” stage We must collaborate and incorporate The dinosaurs could not adapt!
  • 10.