1
Sedimentation Trends andTheir Effects on Water Storage
Capacity in the Wyra Reservoir
By
Dr. P. Shyamsunder
&
Prof. K.V.Jayakumar
International Conference on Advanced Intelligent Sustainable
Technologies, Materials and Infrastructure
07/09/2025 3
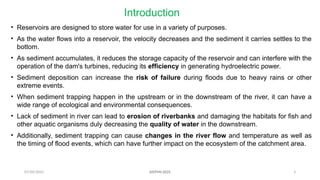
Introduction
• Reservoirsare designed to store water for use in a variety of purposes.
• As the water flows into a reservoir, the velocity decreases and the sediment it carries settles to the
bottom.
• As sediment accumulates, it reduces the storage capacity of the reservoir and can interfere with the
operation of the dam's turbines, reducing its efficiency in generating hydroelectric power.
• Sediment deposition can increase the risk of failure during floods due to heavy rains or other
extreme events.
• When sediment trapping happen in the upstream or in the downstream of the river, it can have a
wide range of ecological and environmental consequences.
• Lack of sediment in river can lead to erosion of riverbanks and damaging the habitats for fish and
other aquatic organisms duly decreasing the quality of water in the downstream.
• Additionally, sediment trapping can cause changes in the river flow and temperature as well as
the timing of flood events, which can have further impact on the ecosystem of the catchment area.
AISTMI-2025
4.
07/09/2025 DSC Presentation_May 2023 4
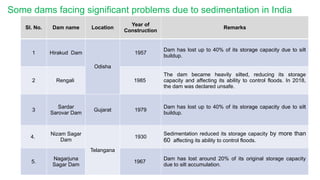
Sl. No. Dam name Location
Year of
Construction
Remarks
1 Hirakud Dam
Odisha
1957
Dam has lost up to 40% of its storage capacity due to silt
buildup.
2 Rengali 1985
The dam became heavily silted, reducing its storage
capacity and affecting its ability to control floods. In 2018,
the dam was declared unsafe.
3
Sardar
Sarovar Dam
Gujarat 1979
Dam has lost up to 40% of its storage capacity due to silt
buildup.
4.
Nizam Sagar
Dam
Telangana
1930
Sedimentation reduced its storage capacity by more than
60 affecting its ability to control floods.
5.
Nagarjuna
Sagar Dam
1967
Dam has lost around 20% of its original storage capacity
due to silt accumulation.
Some dams facing significant problems due to sedimentation in India
5.
07/09/2025 5
RESEARCH GAPS
•The sedimentation research in India is limited knowledge base regarding in
using satellite data.
• In previous studies on Wyra basin, different rainfall patterns and coverage
of different tributary catchments have not been considered in assessment
of sedimentation.
• Usually sedimentation is explained in terms of hydrologic indices which
may not adequately represent in hydraulic form.
• Studies made by scientists in different parts of the world on sedimentation
assessments (methods, methodologies, approaches) vary in terms of use
of biotic data and socio-economic aspect of sedimentation. Further, the
sedimentation studies and guidelines are region specific.
AISTMI-2025
6.
07/09/2025 6
Objectives
1. Todetermine the sediment yield from the outlet of the Wyra
watershed using satellite data.
2. To assess the variability of sediment yield among the sub-basins in
the watershed and identify areas with high erosion rates that require
site-specific management interventions using an empirical model and
SWAT model.
3. To analyse seasonal sediment yield.
AISTMI-2025
07/09/2025 8
Data Collection& Analysis
• Gridded Precipitation and Gridded Temperature are collected from IMD
website.
• Downloaded the 30m resolution DEM data of the study area from the Earth
explorer. Website: https://earthexplorer.usgs.gov/
• Land use and Land Cover (LULC) data are collected from Global LULC
maps website.
• Soil data of the Wyra watershed are downloaded from the NASA website
https://power.larc.nasa.gov/data-access-viewer/
• Hydrographic survey was performed for measuring the water depths,
allowing for the calculation of the volume of water and the sediment
deposition over the period of time.
AISTMI-2025
9.
07/09/2025 9
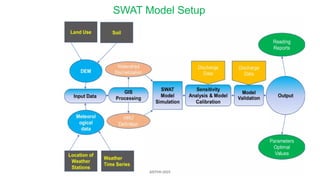
The Soiland Water Assessment Tool (SWAT) Model
• SWAT is a small watershed to river basin-scale model developed by the United
States Department of Agriculture – Agricultural Research Services (USDA –
ARS).
• It is semi distributed, physically and process based and data driven river basin
model.
• The model breaks the entire catchment in to sub-catchments which are further
divided in to hydrologic response units (HRU), land use, vegetation and soil
characteristics.
• It is a continuous time model that operates on a daily time step.
• The inputs, used by this model, are Daily rainfall data, Maximum and minimum
air temperature, Solar radiation, Relative air humidity and Wind speed.
• The model can describe water and sediment circulation, vegetation growth and
nutrients circulation.
• Based on amount of precipitation and mean daily air temperature runoff can be
determined.
AISTMI-2025
07/09/2025 12
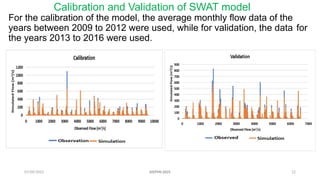
Calibration andValidation of SWAT model
For the calibration of the model, the average monthly flow data of the
years between 2009 to 2012 were used, while for validation, the data for
the years 2013 to 2016 were used.
AISTMI-2025
13.
07/09/2025 13
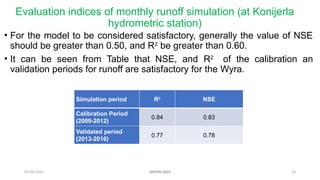
Evaluation indicesof monthly runoff simulation (at Konijerla
hydrometric station)
• For the model to be considered satisfactory, generally the value of NSE
should be greater than 0.50, and R2
be greater than 0.60.
• It can be seen from Table that NSE, and R2
of the calibration an
validation periods for runoff are satisfactory for the Wyra.
Simulation period R2
NSE
Calibration Period
(2009-2012)
0.84 0.83
Validated period
(2013-2016)
0.77 0.78
AISTMI-2025
07/09/2025 15
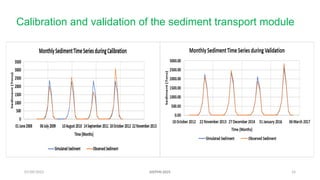
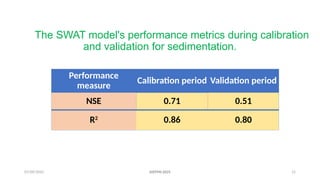
The SWATmodel's performance metrics during calibration
and validation for sedimentation.
Performance
measure
Calibration period Validation period
NSE 0.71 0.51
R2
0.86 0.80
AISTMI-2025
16.
07/09/2025 16
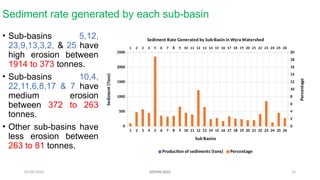
Sediment rategenerated by each sub-basin
• Sub-basins 5,12,
23,9,13,3,2, & 25 have
high erosion between
1914 to 373 tonnes.
• Sub-basins 10,4,
22,11,6,8,17 & 7 have
medium erosion
between 372 to 263
tonnes.
• Other sub-basins have
less erosion between
263 to 81 tonnes.
1 2 3 4 5 6 7 8 9 10 11 12 13 14 15 16 17 18 19 20 21 22 23 24 25 26
1 2 3 4 5 6 7 8 9 10 11 12 13 14 15 16 17 18 19 20 21 22 23 24 25 26
0
500
1000
1500
2000
2500
0
2
4
6
8
10
12
14
16
18
20
Sediment Rate Generated by Sub-Basin in Wyra Watershed
Production of sediments (tons) Percentage
Sub Basins
Sediment
(Tons)
Percentage
AISTMI-2025
17.
07/09/2025 17
Observations
• Sub-basin5 contributes the highest percentage of sediment, with
a value of 18.88%, while the sub-basin 24 contributes the lowest
percentage of sediment, with a value of 1.05%.
• Out of 26 sub-basins below 2 tones producing sub-basins are
seven, above 2 to 3 tonnes producing sub-basins are eight, above
3 to 4 tones and above 4 tonnes producing sub-basins are six
each.
• Wyra sedimentation is not uniformly across the watershed but it is
varying sub-basin to sub-basin.
• An average of 413 tonnes of sedimentation is occurring per year
(?)
AISTMI-2025
18.
07/09/2025 18
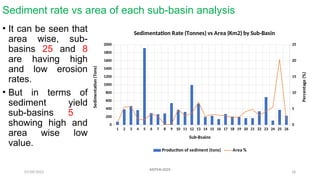
Sediment ratevs area of each sub-basin analysis
• It can be seen that
area wise, sub-
basins 25 and 8
are having high
and low erosion
rates.
• But in terms of
sediment yield
sub-basins 5
showing high and
area wise low
value.
1 2 3 4 5 6 7 8 9 10 11 12 13 14 15 16 17 18 19 20 21 22 23 24 25 26
0
200
400
600
800
1000
1200
1400
1600
1800
2000
0
5
10
15
20
25
Sedimentation Rate (Tonnes) vs Area (Km2) by Sub-Basin
Production of sediment (tons) Area %
Sub-Bsains
Sedimentation
(Tons)
Percentage
(%)
AISTMI-2025
19.
07/09/2025 19
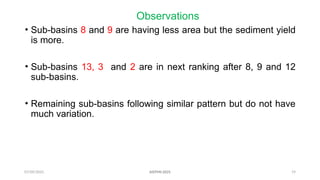
Observations
• Sub-basins8 and 9 are having less area but the sediment yield
is more.
• Sub-basins 13, 3 and 2 are in next ranking after 8, 9 and 12
sub-basins.
• Remaining sub-basins following similar pattern but do not have
much variation.
AISTMI-2025
20.
07/09/2025 20
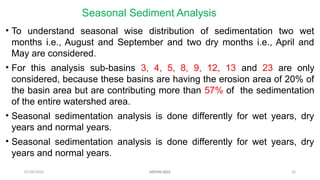
Seasonal SedimentAnalysis
• To understand seasonal wise distribution of sedimentation two wet
months i.e., August and September and two dry months i.e., April and
May are considered.
• For this analysis sub-basins 3, 4, 5, 8, 9, 12, 13 and 23 are only
considered, because these basins are having the erosion area of 20% of
the basin area but are contributing more than 57% of the sedimentation
of the entire watershed area.
• Seasonal sedimentation analysis is done differently for wet years, dry
years and normal years.
• Seasonal sedimentation analysis is done differently for wet years, dry
years and normal years.
AISTMI-2025
21.
07/09/2025 21
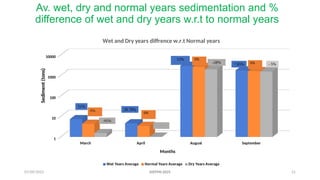
Av. wet,dry and normal years sedimentation and %
difference of wet and dry years w.r.t to normal years
March April August September
1
10
100
1000
10000
Wet and Dry years diffrence w.r.t Normal years
Wet Years Average Normal Years Average Dry Years Average
Months
Sediment
(tons)
51%
-108%
-95%
28.78%
12%
7.85%
-28% - 5%
0%
0%
0%
0%
AISTMI-2025
22.
07/09/2025 22
Observations
• Inwet years sedimentation is higher than that of normal and dry
years. But in normal years also, some amount of sedimentation is
occurring due to more deforestation.
• The average sedimentation yield for the three periods for the
selected sub-basins and for the chosen months.
• Sediment yield peaks are occurring during the months of floods,
while in the dry and normal season the sediment yield is very close
to 1 ton.
• In the month of March, the wet years average sedimentation is
increased by 51%, where as in dry season it is decreased by 95%.
• The highest sedimentation producing month i.e., August in wet
years increased by 12% and decreased by 28% in dry years.
AISTMI-2025
23.
07/09/2025 23
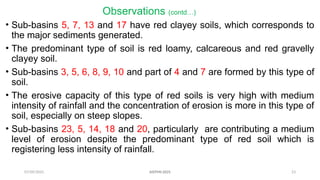
Observations (contd…)
•Sub-basins 5, 7, 13 and 17 have red clayey soils, which corresponds to
the major sediments generated.
• The predominant type of soil is red loamy, calcareous and red gravelly
clayey soil.
• Sub-basins 3, 5, 6, 8, 9, 10 and part of 4 and 7 are formed by this type of
soil.
• The erosive capacity of this type of red soils is very high with medium
intensity of rainfall and the concentration of erosion is more in this type of
soil, especially on steep slopes.
• Sub-basins 23, 5, 14, 18 and 20, particularly are contributing a medium
level of erosion despite the predominant type of red soil which is
registering less intensity of rainfall.
AISTMI-2025
24.
07/09/2025 24
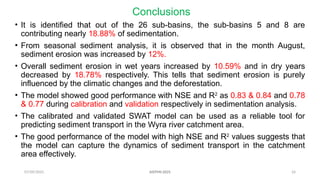
Conclusions
• Itis identified that out of the 26 sub-basins, the sub-basins 5 and 8 are
contributing nearly 18.88% of sedimentation.
• From seasonal sediment analysis, it is observed that in the month August,
sediment erosion was increased by 12%.
• Overall sediment erosion in wet years increased by 10.59% and in dry years
decreased by 18.78% respectively. This tells that sediment erosion is purely
influenced by the climatic changes and the deforestation.
• The model showed good performance with NSE and R2
as 0.83 & 0.84 and 0.78
& 0.77 during calibration and validation respectively in sedimentation analysis.
• The calibrated and validated SWAT model can be used as a reliable tool for
predicting sediment transport in the Wyra river catchment area.
• The good performance of the model with high NSE and R2
values suggests that
the model can capture the dynamics of sediment transport in the catchment
area effectively.
AISTMI-2025
25.
07/09/2025 25
Selected References
•Acharyya, R., Pramanick, N., Mukherjee, S., Ghosh, S., Chanda, A., Pal, I., ... & Mukhopadhyay, A. (2022). Evaluation of
catchment hydrology and soil loss in non-perennial river system: a case study of Subarnarekha Basin, India. Modeling
Earth Systems and Environment, 1-29.https://doi.org/10.1007/s40808-021-01231-3
• Adeogun, A. G., Sule, B. F., & Salami, A. W. (2015). Simulation of sediment yield at the upstream watershed of Jebba
Lake in Nigeria using SWAT model. Malaysian Journal of Civil Engineering, 27(1).
• Ayana, A. B., Edossa, D. C., & Kositsakulchai, E. (2012). Simulation of sediment yield using SWAT model in Fincha
Watershed, Ethiopia. Agriculture and Natural Resources, 46(2), 283-297.
https://li01.tci-thaijo.org/index.php/anres/article/view/242823.
• Erskine, W. D., Mahmoudzadeh, A. H. M. A. D., & Myers, C. (2002). Land use effects on sediment yields and soil loss
rates in small basins of Triassic sandstone near Sydney, NSW, Australia. Catena, 49(4), 271-287,
https://doi.org/10.1016/S0341-8162(02)00065-6
• Himanshu, S. K., Pandey, A., Yadav, B., & Gupta, A. (2019). Evaluation of best management practices for sediment and
nutrient loss control using SWAT model. Soil and Tillage Research, 192, 42-58.
• Markose, V. J., & Jayappa, K. S. (2016). Soil loss estimation and prioritization of sub-watersheds of Kali River basin,
Karnataka, India, using RUSLE and GIS. Environmental monitoring and assessment, 188, 1-16.,
https://doi.org/10.1007/s10661-016-5218-2
• Mishra, A., Kar, S., & Singh, V. P. (2007). Prioritizing structural management by quantifying the effect of land use and
land cover on watershed runoff and sediment yield. Water Resources Management, 21, 1899-1913.,
https://doi.org/10.1007/s11269-006-9136-x
• Sanjay K, J., Jaivir, T., & Vishal, S. (2010). Simulation of runoff and sediment yield for a Himalayan watershed using SWAT
model. Journal of Water Resource and Protection, 2010. doi: 10.4236/jwarp.2010.23031.
AISTMI-2025