SlideShare a Scribd company logo
1 of 9
1 
Introduction: 
Ultimate tensile strength (UTS), often shortened to tensile strength (TS) or ultimate strength, is the 
maximum stress that a material can withstand while being stretched or pulled before necking, which is 
when the specimen's cross-section starts to significantly stretch. Tensile strength is the opposite of 
compressive strength and the values can be quite different. 
Definition: 
Tensile strength is defined as a stress, which is measured as force per unit area. Maximum load that a 
material can support without fracture when being stretched, divided by the original cross -sectional area of 
the material. Tensile strengths have dimensions of force per unit area and in the English system of 
measurement are commonly expressed in units of pounds per square inch, often abbreviated to psi. When 
stresses less than the tensile strength are removed, a material returns either completely or partially to its 
original shape and size. As the stress reaches the value of the tensile strength, however, a material, if 
ductile, that has already begun to flow plastically rapidly forms a constricted region called a neck, where it 
then fractures. 
The ability to resist breaking under tensile stress is one of the most important and widely measured 
properties of materials used in structural applications. The force per unit area (MPa or psi) required to 
break a material in such a manner is the ultimate tensile strength or tensile strength at break . The rate at 
which a sample is pulled apart in the test can range from 0.2 to 20 inches per minute and will influence the 
results. The analogous test to measure tensile properties in the ISO system is ISO 527. The values 
reported in the ASTM D638 and ISO 527 tests in general do not vary significantly and either test will 
provide good results early in the material selection process. Separate tensile test methods are commonly 
applied to polymer films (ASTM D882) and elastomers (ASTM D412). 
For some non-homogeneous materials (or for assembled components) it can be reported just as a force or 
as a force per unit width. In the SI system, the unit is the pascal (Pa) (or a multiple thereof, often 
megapascals (MPa), using the mega- prefix); or, equivalently to pascals, newtons per square metre 
(N/m²). The customary unit is pounds-force per square inch (lbf/in² or psi), or kilo-pounds per square inch 
(ksi, or sometimes kpsi), which is equal to 1000 psi; kilo-pounds per square inch are commonly used for 
convenience when measuring tensile strengths. 
There are three typical definitions of tensile strength: 
Yield strength - The stress a material can withstand without permanent deformation. This is not a sharply 
defined point. Yield strength is the stress which will cause a permanent deformation of 0.2% of the original 
dimension. 
Ultimate strength - The maximum stress a material can withstand. 
Breaking strength :The stress coordinate on the stress-strain curve at the point of rupture.
2 
Tensile Properties: 
Tensile properties indicate how the material will react to forces being applied in tension. A tensile test is a 
fundamental mechanical test where a carefully prepared specimen is loaded in a very controlled manner 
while measuring the applied load and the elongation of the specimen over some distance. Tensile tests are 
used to determine the modulus of elasticity, elastic limit, elongation, proportional limit, reduction in area, 
tensile strength, yield point, yield strength and other tensile properties. 
The main product of a tensile test is a load versus elongation curve which is then converted into a stress 
versus strain curve. Since both the engineering stress and the engineering strain are obtained by dividing 
the load and elongation by constant values (specimen geometry information), the load -elongation curve will 
have the same shape as the engineering stress-strain curve. The stress-strain curve relates the applied 
stress to the resulting strain and each material has its own unique stress -strain curve. A typical engineering 
stress-strain curve is shown below. If the true stress, based on the actual cross-sectional area of the 
specimen, is used, it is found that the stress-strain curve increases continuously up to fracture. 
Linear-Elastic Region and Elastic Constants 
As can be seen in the figure, the stress and strain initially increase with a line ar relationship. This is the 
linear-elastic portion of the curve and it indicates that no plastic deformation has occurred. In this region of 
the curve, when the stress is reduced, the material will return to its original shape. In this linear region, the 
line obeys the relationship defined as Hooke's Law where the ratio of stress to strain is a constant. 
The slope of the line in this region where stress is proportional to strain and is called the modulus of 
elasticity or Young's modulus. The modulus of elasticity (E) defines the properties of a material as it 
undergoes stress, deforms, and then returns to its original shape after the 
stress is removed. It is a measure of the stiffness of a given material. To compute the modulus of elastic , 
simply divide the stress by the strain in the material. Since strain is unitless, the modulus will have the 
same units as the stress, such as kpi or MPa. The modulus of elasticity applies specifically to the situation 
of a component being stretched with a tensile force. This modulus is of interest when it is necessary to 
compute how much a rod or wire stretches under a tensile load. There are several different kinds of moduli 
depending on the way the material is being stretched, bent, or otherwise distorted. When a component is 
subjected to pure shear, for instance, a cylindrical bar under torsion, the shear modulus describes the 
linear-elastic stress-strain relationship. 
Axial strain is always accompanied by lateral strains of opposite sign in the two directions mutually 
perpendicular to the axial strain. Strains that result from an increase in length are designated as positive 
(+) and those that result in a decrease in length are designated as negative (-). Poisson's ratio is defined 
as the negative of the ratio of the lateral strain to the axial strain for a uniaxial stress state. 
Poisson's ratio is sometimes also defined as the ratio of the absolute values of lateral and axial strain. This 
ratio, like strain, is unitless since both strains are unitless. For stresses within the elastic range, this ratio is
3 
approximately constant. For a perfectly isotropic elastic material, Poisson's Ratio is 0.25, but for most 
materials the value lies in the range of 0.28 to 0.33. Generally for steels, Poisson’s ratio will have a value 
of approximately 0.3. This means that if there is one inch per inch of deformation in the direction that stress 
is applied, there will be 0.3 inches per inch of deformation perpendicular to the direction that force is 
applied. 
change in pressure and the resulting strain produced is the bulk modulus. Lame's constants are derived 
from modulus of elasticity and Poisson's ratio. 
Yield Point: 
In ductile materials, at some point, the stress-strain curve deviates from the straight-line relationship and 
Law no longer applies as the strain increases faster than the stress. From this point on in the tensile test, 
some permanent deformation occurs in the specimen and the material is said to react plastically to any 
further increase in load or stress. The material will not return to its original, unstressed condition when the 
load is removed. In brittle materials, little or no plastic deformation occurs and the material fractures near 
the end of the linear-elastic portion of the curve. 
With most materials there is a gradual transition from elastic to plastic behavior, and the exact point at 
which plastic deformation begins to occur is hard to determine. Therefore, various criteria for the initiation of 
yielding are used depending on the sensitivity of the strain measurements and the intended use of the data. 
(See Table) For most engineering design and specification applications, the yield strength is used. The 
yield strength is defined as the stress required to produce a small, amount of plastic deformatio n. The offset 
yield strength is the stress corresponding to the intersection of the stress -strain curve and a line parallel to 
the elastic part of the curve offset by a specified strain (in the US the offset is typically 0.2% for metals and 
2% for plastics). In Great Britain, the yield strength is often referred to as the proof stress. The offset value 
is either 0.1% or 0.5% 
To determine the yield strength using this offset, the point is found on the strain axis (x -axis) of 0.002, and 
then a line parallel to the stress-strain line is drawn. This line will intersect the stress-strain line slightly after 
it begins to curve, and that intersection is defined as the yield strength with a 0.2% offset. A good way of 
looking at offset yield strength is that after a specimen has been loaded to its 0.2 percent offset yield 
strength and then unloaded it will be 0.2 percent longer than before the test. Even though the yield strength 
is meant to represent the exact point at which the material becomes permanently deforme d, 0.2% 
elongation is considered to be a tolerable amount of sacrifice for the ease it creates in defining the yield 
strength. 
Some materials such as gray cast iron or soft copper exhibit essentially no linear-elastic behavior. For 
these materials the usual practice is to define the yield strength as the stress required to produce some 
total amount of strain.
4 
True elastic limit is a very low value and is related to the motion of a few hundred dislocations. Micro strain 
measurements are required to detect strain on order of 2 x 10 -6 in/in. 
Proportional limit is the highest stress at which stress is directly proportional to strain. It is obtained by 
observing the deviation from the straight-line portion of the stress-strain curve. 
Elastic limit is the greatest stress the material can withstand without any measurable permanent strain 
remaining on the complete release of load. It is determined using a tedious incremental loading -unloading 
test procedure. With the sensitivity of strain measurements usually emp loyed in engineering studies (10 - 
4in/in), the elastic limit is greater than the proportional limit. With increasing sensitivity of strain 
measurement, the value of the elastic limit decreases until it eventually equals the true elastic limit 
determined from micro strain measurements. 
Yield strength is the stress required to produce a small-specified amount of plastic deformation. The yield 
strength obtained by an offset method is commonly used for engineering purposes because it avoids the 
practical difficulties of measuring the elastic limit or proportional limit. 
Ultimate Tensile Strength: 
The ultimate tensile strength (UTS) or, more simply, the tensile strength, is the maximum engineering 
stress level reached in a tension test. The strength of a material is its ability to withstand external forces 
without breaking. In brittle materials, the UTS will at the end of the linear-elastic portion of the stress-strain 
curve or close to the elastic limit. In ductile materials, the UTS will be well outside of the elastic portion into 
the plastic portion of the stress-strain curve. 
On the stress-strain curve above, the UTS is the highest point where the line is momentarily flat. Since the 
UTS is based on the engineering stress, it is often not the same as the breaking strength. In ductile 
materials strain hardening occurs and the stress will continue to increase until fracture occurs, but the 
engineering stress-strain curve may show a decline in the stress level before fracture occurs. This is the 
result of engineering stress being based on the original cross-section area and not accounting for the 
necking that commonly occurs in the test specimen. The UTS may not be completely representative of the 
highest level of stress that a material can support, but the value is not typically used in the design of 
components anyway. For ductile metals the current design practice is to use the yield strength for sizing 
static components. However, since the UTS is easy to determine and quite reproducible, it is useful for the 
purposes of specifying a material and for quality control purposes. On the other hand, for br ittle materials 
the design of a component may be based on the tensile strength of the material. 
Measures of Ductility (Elongation and Reduction of Area): 
The ductility of a material is a measure of the extent to which a material will deform before fracture. The 
amount of ductility is an important factor when considering forming operations such as rolling and extrusion. 
It also provides an indication of how visible overload damage to a component might become before the
5 
component fractures. Ductility is also used a quality control measure to assess the level of impurities and 
proper processing of a material. 
Tensile strengths are rarely used in the design of ductile members, but they are important in brittle 
members. They are tabulated for common materials such as alloys, composite materials, ceramics, 
plastics, and wood. 
Fig: Stress vs. Strain curve typical of aluminum 
1. Ultimate strength 
2. Yield strength 
3. Proportional limit stress 
4. Fracture 
5. Offset strain (typically 0.2%) 
After the yield point, ductile metals will undergo a period of strain hardening, in which the stress increases 
again with increasing strain, and they begin to neck, as the cross-sectional area of the specimen decreases 
due to plastic flow. In a sufficiently ductile material, when necking becomes substantial, it causes a reversal 
of the engineering stress-strain curve (curve A); this is because the engineering stress is calculated 
assuming the original cross-sectional area before necking. The reversal point is the maximum stress on the 
engineering stress-strain curve, and the engineering stress coordinate of this point is the tensile ultimate 
strength, given by point 1.
6 
Fig: Stress vs. strain curve typical of structural steel 
1. Ultimate strength 
2. Yield strength 
3. Fracture 
4. Strain hardening region 
5. Necking region 
A: Engineering stress 
B: True stress 
The conventional measures of ductility are the engineering strain at fracture (usually called the elongation ) 
and the reduction of area at fracture. Both of these properties are obtained by fitting the specimen back 
together after fracture and measuring the change in length and cross -sectional area. Elongation is the 
change in axial length divided by the original length of the specimen or portion of the specimen. It is 
expressed as a percentage. Because an appreciable fraction of the plastic deformation will be concentrated 
in the necked region of the tensile specimen, the value of elongation will depend on the gage length over 
which the measurement is taken. The smaller the gage length the greater the large localized strain in the 
necked region will factor into the calculation. Therefore, when reporting values of elongation , the gage 
length should be given. 
One way to avoid the complication from necking is to base the elongation measurement on the uniform 
strain out to the point at which necking begins. This works well at times but some engineering stress -strain 
curve are often quite flat in the vicinity of maximum loading and it is difficult to precisely establish the strain 
when necking starts to occur.
7 
Reduction of area is the change in cross-sectional area divided by the original cross-sectional area. This 
change is measured in the necked down region of the specimen. Like elongation, it is usually expressed as 
a percentage. 
As previously discussed, tension is just one of the way that a material can be loaded. Other ways of loading 
a material include compression, bending, shear and torsion, and there are a number of standard tests that 
have been established to characterize how a material performs under these other loading conditions. A 
very cursory introduction to some of these other material properties will be provided on the next page. 
Tensile properties indicate how the material will react to the forces being applied in tension. A tensile test 
is a fundamental mechanical test where a careful prepared specimen is loaded in a very controlled manner, 
while measuring the applied load and the elongation of the specimen over some distance. 
Tensile properties included: 
Hooke’s Law: 
For most tensile testing of materials, you will notice that in the initial portion of the test, the relationship 
between the applied force, or load, and the elongation the specimen exhibits is linear. In this linear region, 
the line obeys the relationship defined as "Hooke's Law" where the ratio of stress to strain is a constant, or . 
E is the slope of the line in this region where stress (σ) is proportional to strain (ε) and is called the 
"Modulus of Elasticity" or "Young's Modulus". 
E= σ/ ε 
Strain: 
You will also be able to find the amount of stretch or elongation the specimen undergoes during tensile 
testing This can be expressed as an absolute measurement in the change in length or as a relative 
measurement called "strain". Strain itself can be expressed in two different ways, as "engineering strain" 
and "true strain". Engineering strain is probably the easiest and the most common expression of strain 
used. It is the ratio of the change in length to the original length, . Whereas, the true strain is similar but 
based on the instantaneous length of the specimen as the test progresses, , where Li is the instantaneous 
length and L0 the initial length. 
Yield Strength: 
A value called "yield strength" of a material is defined as the stress applied to the material at which plastic 
deformation starts to occur while the material is loaded. 
Select image to enlarge The modulus of elasticity is a measure of the stiffness of the material, but it only 
applies in the linear region of the curve. If a specimen is loaded within this linear region, the material will 
return to its exact same condition if the load is removed. At the point that the curve is no longer linear and
8 
deviates from the straight-line relationship, Hooke's Law no longer applies and some permanent 
deformation occurs in the specimen. This point is called the "elastic, or proportional, limit". From this point 
on in the tensile test, the material reacts plastically to any further increase in load or stress. It will not return 
to its original, unstressed condition if the load were removed. 
Typical tensile strengths: 
Some typical tensile strengths of some materials: 
Material Yield strength(MPa) Unlimited strength(MPa) Density 
(g/cm³) 
Bamboo 350-500 0.4 
Boron N/A 3100 2.46 
Carbon fiber N/A 1600 for 
Laminate, 
4137 for fiber alone 
1.75 
Copper 99.9% Cu 70 220 8.92 
Glass 33 2.53 
Rubber 15 
Tungsten 1510 19.25 
Typical properties for annealed elements: 
Element Young's Modulus(GPa) Proof or yield stress 
(MPa) 
Ultimate strength 
(MPa) 
Aluminium 70 15-20 40-50 
Copper 130 33 210 
Gold 79 100 
Iron 211 80-100 350 
Nickel 170 14-35 140-195
9 
References: 
1: Engineering Materials, Vol. 1. 5th Edition. 
2: From Wikipedia, the free encyclopedia 
3: Lecture sheets

More Related Content

What's hot

stress strain
stress strainstress strain
stress strainSb Parmar
 
Mechanical Properties of Metals
Mechanical Properties of MetalsMechanical Properties of Metals
Mechanical Properties of Metalsguesteed04b
 
Tensile testing ppt
Tensile testing pptTensile testing ppt
Tensile testing pptRahul Yadav
 
Mechanical properties of metals
Mechanical properties of metalsMechanical properties of metals
Mechanical properties of metalsSahreen Shamshad
 
Demonstration of Mechanical Behaviour of Material Using a Practical Approach
Demonstration of Mechanical Behaviour of Material Using a Practical Approach Demonstration of Mechanical Behaviour of Material Using a Practical Approach
Demonstration of Mechanical Behaviour of Material Using a Practical Approach Dr.Gaurav Kumar Gugliani
 
Stress strain curve
Stress strain curveStress strain curve
Stress strain curveFakhar Hayat
 
Unit 2 theory_of_plasticity
Unit 2 theory_of_plasticityUnit 2 theory_of_plasticity
Unit 2 theory_of_plasticityavinash shinde
 
Em321 lesson 08b solutions ch6 - mechanical properties of metals
Em321 lesson 08b solutions   ch6 - mechanical properties of metalsEm321 lesson 08b solutions   ch6 - mechanical properties of metals
Em321 lesson 08b solutions ch6 - mechanical properties of metalsusna12345
 
mechanical properties
mechanical propertiesmechanical properties
mechanical propertiesKum Visal
 
20 08 2020stress_straincurve_p
20 08 2020stress_straincurve_p20 08 2020stress_straincurve_p
20 08 2020stress_straincurve_psushma chinta
 
Axial stress strain curve---sahin
Axial stress   strain curve---sahinAxial stress   strain curve---sahin
Axial stress strain curve---sahinYasin Sahin
 
Elasticity 2012
Elasticity 2012Elasticity 2012
Elasticity 2012mantlfin
 

What's hot (18)

stress strain
stress strainstress strain
stress strain
 
Mechanical Properties of Metals
Mechanical Properties of MetalsMechanical Properties of Metals
Mechanical Properties of Metals
 
Tensile testing ppt
Tensile testing pptTensile testing ppt
Tensile testing ppt
 
Stress strain curve
Stress strain curveStress strain curve
Stress strain curve
 
Mechanical properties of metals
Mechanical properties of metalsMechanical properties of metals
Mechanical properties of metals
 
Demonstration of Mechanical Behaviour of Material Using a Practical Approach
Demonstration of Mechanical Behaviour of Material Using a Practical Approach Demonstration of Mechanical Behaviour of Material Using a Practical Approach
Demonstration of Mechanical Behaviour of Material Using a Practical Approach
 
stress and strain
stress and strainstress and strain
stress and strain
 
Stress strain curve
Stress strain curveStress strain curve
Stress strain curve
 
Unit 2 theory_of_plasticity
Unit 2 theory_of_plasticityUnit 2 theory_of_plasticity
Unit 2 theory_of_plasticity
 
Opti 222 w4
Opti 222 w4Opti 222 w4
Opti 222 w4
 
Em321 lesson 08b solutions ch6 - mechanical properties of metals
Em321 lesson 08b solutions   ch6 - mechanical properties of metalsEm321 lesson 08b solutions   ch6 - mechanical properties of metals
Em321 lesson 08b solutions ch6 - mechanical properties of metals
 
mechanical properties
mechanical propertiesmechanical properties
mechanical properties
 
what is Poisons Ratio
what is Poisons Ratiowhat is Poisons Ratio
what is Poisons Ratio
 
20 08 2020stress_straincurve_p
20 08 2020stress_straincurve_p20 08 2020stress_straincurve_p
20 08 2020stress_straincurve_p
 
Axial stress strain curve---sahin
Axial stress   strain curve---sahinAxial stress   strain curve---sahin
Axial stress strain curve---sahin
 
Unit 1- simple stress and strain
Unit 1- simple stress and strainUnit 1- simple stress and strain
Unit 1- simple stress and strain
 
Elasticity 2012
Elasticity 2012Elasticity 2012
Elasticity 2012
 
4 tension test
4 tension test4 tension test
4 tension test
 

Viewers also liked

Թութանհամոն
ԹութանհամոնԹութանհամոն
Թութանհամոնnshartak
 
Wool is water resistant assi3
Wool is water resistant assi3Wool is water resistant assi3
Wool is water resistant assi3VICTOR ROY
 
Fabric and garment finishing
Fabric and garment finishingFabric and garment finishing
Fabric and garment finishingVICTOR ROY
 
էխնաթոնի շրջանի արվեստի օրինակներ
էխնաթոնի շրջանի արվեստի օրինակներէխնաթոնի շրջանի արվեստի օրինակներ
էխնաթոնի շրջանի արվեստի օրինակներnshartak
 
կիսամյակային հաշվետվություն
կիսամյակային հաշվետվությունկիսամյակային հաշվետվություն
կիսամյակային հաշվետվությունnshartak
 
Weaving calculation
Weaving calculationWeaving calculation
Weaving calculationVICTOR ROY
 
Tensile Strength
Tensile StrengthTensile Strength
Tensile StrengthVICTOR ROY
 
Swot analysis of textile sector for bangladesh
Swot analysis of textile sector for bangladeshSwot analysis of textile sector for bangladesh
Swot analysis of textile sector for bangladeshVICTOR ROY
 
Application of Computer in Textiles
Application of Computer in TextilesApplication of Computer in Textiles
Application of Computer in TextilesVICTOR ROY
 

Viewers also liked (10)

ERP
ERP ERP
ERP
 
Թութանհամոն
ԹութանհամոնԹութանհամոն
Թութանհամոն
 
Wool is water resistant assi3
Wool is water resistant assi3Wool is water resistant assi3
Wool is water resistant assi3
 
Fabric and garment finishing
Fabric and garment finishingFabric and garment finishing
Fabric and garment finishing
 
էխնաթոնի շրջանի արվեստի օրինակներ
էխնաթոնի շրջանի արվեստի օրինակներէխնաթոնի շրջանի արվեստի օրինակներ
էխնաթոնի շրջանի արվեստի օրինակներ
 
կիսամյակային հաշվետվություն
կիսամյակային հաշվետվությունկիսամյակային հաշվետվություն
կիսամյակային հաշվետվություն
 
Weaving calculation
Weaving calculationWeaving calculation
Weaving calculation
 
Tensile Strength
Tensile StrengthTensile Strength
Tensile Strength
 
Swot analysis of textile sector for bangladesh
Swot analysis of textile sector for bangladeshSwot analysis of textile sector for bangladesh
Swot analysis of textile sector for bangladesh
 
Application of Computer in Textiles
Application of Computer in TextilesApplication of Computer in Textiles
Application of Computer in Textiles
 

Similar to Tensile Strengthy

Mc testing Lec 2.pptx
Mc testing Lec 2.pptxMc testing Lec 2.pptx
Mc testing Lec 2.pptxDrAjitKatkar
 
Demonstration of Mechanical Behaviour of Material Using a Practical Approach
Demonstration of Mechanical Behaviour of Material Using a Practical Approach Demonstration of Mechanical Behaviour of Material Using a Practical Approach
Demonstration of Mechanical Behaviour of Material Using a Practical Approach Dr. Gaurav Kumar Gugliani
 
Demonstration of Mechanical Behaviour of Material Using a Practical Approach
Demonstration of Mechanical Behaviour of Material Using a Practical Approach Demonstration of Mechanical Behaviour of Material Using a Practical Approach
Demonstration of Mechanical Behaviour of Material Using a Practical Approach Dr.Gaurav Kumar Gugliani
 
Mechanical properties of materials (lecture+2).pdf
Mechanical properties of materials (lecture+2).pdfMechanical properties of materials (lecture+2).pdf
Mechanical properties of materials (lecture+2).pdfHeshamBakr3
 
Mechanical properties of dental materials/ orthodontic course by indian denta...
Mechanical properties of dental materials/ orthodontic course by indian denta...Mechanical properties of dental materials/ orthodontic course by indian denta...
Mechanical properties of dental materials/ orthodontic course by indian denta...Indian dental academy
 
Review of mechanical concepts
Review of mechanical conceptsReview of mechanical concepts
Review of mechanical conceptsssuserfdee441
 
Tom&md notes module 03
Tom&md notes module 03Tom&md notes module 03
Tom&md notes module 03Ashish Mishra
 
Mechanical properties
Mechanical propertiesMechanical properties
Mechanical propertiesYatin Singh
 
Rheology-Terminology.pdf
Rheology-Terminology.pdfRheology-Terminology.pdf
Rheology-Terminology.pdfabiyotnegu1
 
2. Stress And Strain Analysis And Measurement
2. Stress And Strain Analysis And Measurement2. Stress And Strain Analysis And Measurement
2. Stress And Strain Analysis And MeasurementPedro Craggett
 
Eng.Materials-mechanical-properties-6.pdf
Eng.Materials-mechanical-properties-6.pdfEng.Materials-mechanical-properties-6.pdf
Eng.Materials-mechanical-properties-6.pdforvanbestunsaeedfara
 
Strength of Materials _Simple Strees and Stains _Unit-1.pptx
Strength of Materials _Simple Strees and Stains _Unit-1.pptxStrength of Materials _Simple Strees and Stains _Unit-1.pptx
Strength of Materials _Simple Strees and Stains _Unit-1.pptxSivarajuR
 
Chpr3 experimental
Chpr3 experimentalChpr3 experimental
Chpr3 experimentalRaj Shekaran
 

Similar to Tensile Strengthy (20)

Mc testing Lec 2.pptx
Mc testing Lec 2.pptxMc testing Lec 2.pptx
Mc testing Lec 2.pptx
 
Demonstration of Mechanical Behaviour of Material Using a Practical Approach
Demonstration of Mechanical Behaviour of Material Using a Practical Approach Demonstration of Mechanical Behaviour of Material Using a Practical Approach
Demonstration of Mechanical Behaviour of Material Using a Practical Approach
 
Demonstration of Mechanical Behaviour of Material Using a Practical Approach
Demonstration of Mechanical Behaviour of Material Using a Practical Approach Demonstration of Mechanical Behaviour of Material Using a Practical Approach
Demonstration of Mechanical Behaviour of Material Using a Practical Approach
 
Tensile testing experiment
Tensile testing experimentTensile testing experiment
Tensile testing experiment
 
Mechanical properties of materials (lecture+2).pdf
Mechanical properties of materials (lecture+2).pdfMechanical properties of materials (lecture+2).pdf
Mechanical properties of materials (lecture+2).pdf
 
Mech CE6306 som_notes
Mech CE6306 som_notesMech CE6306 som_notes
Mech CE6306 som_notes
 
Chap02-A.pdf
Chap02-A.pdfChap02-A.pdf
Chap02-A.pdf
 
Mechanical properties of dental materials/ orthodontic course by indian denta...
Mechanical properties of dental materials/ orthodontic course by indian denta...Mechanical properties of dental materials/ orthodontic course by indian denta...
Mechanical properties of dental materials/ orthodontic course by indian denta...
 
Mechanical properties
Mechanical propertiesMechanical properties
Mechanical properties
 
Review of mechanical concepts
Review of mechanical conceptsReview of mechanical concepts
Review of mechanical concepts
 
Mechanical properties
Mechanical propertiesMechanical properties
Mechanical properties
 
Tom&md notes module 03
Tom&md notes module 03Tom&md notes module 03
Tom&md notes module 03
 
Mechanical properties
Mechanical propertiesMechanical properties
Mechanical properties
 
Ch7_mechanical_properties_1.ppt
Ch7_mechanical_properties_1.pptCh7_mechanical_properties_1.ppt
Ch7_mechanical_properties_1.ppt
 
Mm210(4)
Mm210(4)Mm210(4)
Mm210(4)
 
Rheology-Terminology.pdf
Rheology-Terminology.pdfRheology-Terminology.pdf
Rheology-Terminology.pdf
 
2. Stress And Strain Analysis And Measurement
2. Stress And Strain Analysis And Measurement2. Stress And Strain Analysis And Measurement
2. Stress And Strain Analysis And Measurement
 
Eng.Materials-mechanical-properties-6.pdf
Eng.Materials-mechanical-properties-6.pdfEng.Materials-mechanical-properties-6.pdf
Eng.Materials-mechanical-properties-6.pdf
 
Strength of Materials _Simple Strees and Stains _Unit-1.pptx
Strength of Materials _Simple Strees and Stains _Unit-1.pptxStrength of Materials _Simple Strees and Stains _Unit-1.pptx
Strength of Materials _Simple Strees and Stains _Unit-1.pptx
 
Chpr3 experimental
Chpr3 experimentalChpr3 experimental
Chpr3 experimental
 

Recently uploaded

Key Features Of Token Development (1).pptx
Key  Features Of Token  Development (1).pptxKey  Features Of Token  Development (1).pptx
Key Features Of Token Development (1).pptxLBM Solutions
 
My INSURER PTE LTD - Insurtech Innovation Award 2024
My INSURER PTE LTD - Insurtech Innovation Award 2024My INSURER PTE LTD - Insurtech Innovation Award 2024
My INSURER PTE LTD - Insurtech Innovation Award 2024The Digital Insurer
 
costume and set research powerpoint presentation
costume and set research powerpoint presentationcostume and set research powerpoint presentation
costume and set research powerpoint presentationphoebematthew05
 
#StandardsGoals for 2024: What’s new for BISAC - Tech Forum 2024
#StandardsGoals for 2024: What’s new for BISAC - Tech Forum 2024#StandardsGoals for 2024: What’s new for BISAC - Tech Forum 2024
#StandardsGoals for 2024: What’s new for BISAC - Tech Forum 2024BookNet Canada
 
Artificial intelligence in the post-deep learning era
Artificial intelligence in the post-deep learning eraArtificial intelligence in the post-deep learning era
Artificial intelligence in the post-deep learning eraDeakin University
 
APIForce Zurich 5 April Automation LPDG
APIForce Zurich 5 April  Automation LPDGAPIForce Zurich 5 April  Automation LPDG
APIForce Zurich 5 April Automation LPDGMarianaLemus7
 
Unblocking The Main Thread Solving ANRs and Frozen Frames
Unblocking The Main Thread Solving ANRs and Frozen FramesUnblocking The Main Thread Solving ANRs and Frozen Frames
Unblocking The Main Thread Solving ANRs and Frozen FramesSinan KOZAK
 
Bun (KitWorks Team Study 노별마루 발표 2024.4.22)
Bun (KitWorks Team Study 노별마루 발표 2024.4.22)Bun (KitWorks Team Study 노별마루 발표 2024.4.22)
Bun (KitWorks Team Study 노별마루 발표 2024.4.22)Wonjun Hwang
 
Unlocking the Potential of the Cloud for IBM Power Systems
Unlocking the Potential of the Cloud for IBM Power SystemsUnlocking the Potential of the Cloud for IBM Power Systems
Unlocking the Potential of the Cloud for IBM Power SystemsPrecisely
 
Streamlining Python Development: A Guide to a Modern Project Setup
Streamlining Python Development: A Guide to a Modern Project SetupStreamlining Python Development: A Guide to a Modern Project Setup
Streamlining Python Development: A Guide to a Modern Project SetupFlorian Wilhelm
 
Transcript: New from BookNet Canada for 2024: BNC BiblioShare - Tech Forum 2024
Transcript: New from BookNet Canada for 2024: BNC BiblioShare - Tech Forum 2024Transcript: New from BookNet Canada for 2024: BNC BiblioShare - Tech Forum 2024
Transcript: New from BookNet Canada for 2024: BNC BiblioShare - Tech Forum 2024BookNet Canada
 
Enhancing Worker Digital Experience: A Hands-on Workshop for Partners
Enhancing Worker Digital Experience: A Hands-on Workshop for PartnersEnhancing Worker Digital Experience: A Hands-on Workshop for Partners
Enhancing Worker Digital Experience: A Hands-on Workshop for PartnersThousandEyes
 
My Hashitalk Indonesia April 2024 Presentation
My Hashitalk Indonesia April 2024 PresentationMy Hashitalk Indonesia April 2024 Presentation
My Hashitalk Indonesia April 2024 PresentationRidwan Fadjar
 
"LLMs for Python Engineers: Advanced Data Analysis and Semantic Kernel",Oleks...
"LLMs for Python Engineers: Advanced Data Analysis and Semantic Kernel",Oleks..."LLMs for Python Engineers: Advanced Data Analysis and Semantic Kernel",Oleks...
"LLMs for Python Engineers: Advanced Data Analysis and Semantic Kernel",Oleks...Fwdays
 
Pigging Solutions in Pet Food Manufacturing
Pigging Solutions in Pet Food ManufacturingPigging Solutions in Pet Food Manufacturing
Pigging Solutions in Pet Food ManufacturingPigging Solutions
 
Connect Wave/ connectwave Pitch Deck Presentation
Connect Wave/ connectwave Pitch Deck PresentationConnect Wave/ connectwave Pitch Deck Presentation
Connect Wave/ connectwave Pitch Deck PresentationSlibray Presentation
 
CloudStudio User manual (basic edition):
CloudStudio User manual (basic edition):CloudStudio User manual (basic edition):
CloudStudio User manual (basic edition):comworks
 

Recently uploaded (20)

Key Features Of Token Development (1).pptx
Key  Features Of Token  Development (1).pptxKey  Features Of Token  Development (1).pptx
Key Features Of Token Development (1).pptx
 
My INSURER PTE LTD - Insurtech Innovation Award 2024
My INSURER PTE LTD - Insurtech Innovation Award 2024My INSURER PTE LTD - Insurtech Innovation Award 2024
My INSURER PTE LTD - Insurtech Innovation Award 2024
 
Hot Sexy call girls in Panjabi Bagh 🔝 9953056974 🔝 Delhi escort Service
Hot Sexy call girls in Panjabi Bagh 🔝 9953056974 🔝 Delhi escort ServiceHot Sexy call girls in Panjabi Bagh 🔝 9953056974 🔝 Delhi escort Service
Hot Sexy call girls in Panjabi Bagh 🔝 9953056974 🔝 Delhi escort Service
 
costume and set research powerpoint presentation
costume and set research powerpoint presentationcostume and set research powerpoint presentation
costume and set research powerpoint presentation
 
#StandardsGoals for 2024: What’s new for BISAC - Tech Forum 2024
#StandardsGoals for 2024: What’s new for BISAC - Tech Forum 2024#StandardsGoals for 2024: What’s new for BISAC - Tech Forum 2024
#StandardsGoals for 2024: What’s new for BISAC - Tech Forum 2024
 
Artificial intelligence in the post-deep learning era
Artificial intelligence in the post-deep learning eraArtificial intelligence in the post-deep learning era
Artificial intelligence in the post-deep learning era
 
APIForce Zurich 5 April Automation LPDG
APIForce Zurich 5 April  Automation LPDGAPIForce Zurich 5 April  Automation LPDG
APIForce Zurich 5 April Automation LPDG
 
Unblocking The Main Thread Solving ANRs and Frozen Frames
Unblocking The Main Thread Solving ANRs and Frozen FramesUnblocking The Main Thread Solving ANRs and Frozen Frames
Unblocking The Main Thread Solving ANRs and Frozen Frames
 
Bun (KitWorks Team Study 노별마루 발표 2024.4.22)
Bun (KitWorks Team Study 노별마루 발표 2024.4.22)Bun (KitWorks Team Study 노별마루 발표 2024.4.22)
Bun (KitWorks Team Study 노별마루 발표 2024.4.22)
 
Unlocking the Potential of the Cloud for IBM Power Systems
Unlocking the Potential of the Cloud for IBM Power SystemsUnlocking the Potential of the Cloud for IBM Power Systems
Unlocking the Potential of the Cloud for IBM Power Systems
 
Streamlining Python Development: A Guide to a Modern Project Setup
Streamlining Python Development: A Guide to a Modern Project SetupStreamlining Python Development: A Guide to a Modern Project Setup
Streamlining Python Development: A Guide to a Modern Project Setup
 
Transcript: New from BookNet Canada for 2024: BNC BiblioShare - Tech Forum 2024
Transcript: New from BookNet Canada for 2024: BNC BiblioShare - Tech Forum 2024Transcript: New from BookNet Canada for 2024: BNC BiblioShare - Tech Forum 2024
Transcript: New from BookNet Canada for 2024: BNC BiblioShare - Tech Forum 2024
 
Enhancing Worker Digital Experience: A Hands-on Workshop for Partners
Enhancing Worker Digital Experience: A Hands-on Workshop for PartnersEnhancing Worker Digital Experience: A Hands-on Workshop for Partners
Enhancing Worker Digital Experience: A Hands-on Workshop for Partners
 
My Hashitalk Indonesia April 2024 Presentation
My Hashitalk Indonesia April 2024 PresentationMy Hashitalk Indonesia April 2024 Presentation
My Hashitalk Indonesia April 2024 Presentation
 
"LLMs for Python Engineers: Advanced Data Analysis and Semantic Kernel",Oleks...
"LLMs for Python Engineers: Advanced Data Analysis and Semantic Kernel",Oleks..."LLMs for Python Engineers: Advanced Data Analysis and Semantic Kernel",Oleks...
"LLMs for Python Engineers: Advanced Data Analysis and Semantic Kernel",Oleks...
 
The transition to renewables in India.pdf
The transition to renewables in India.pdfThe transition to renewables in India.pdf
The transition to renewables in India.pdf
 
Pigging Solutions in Pet Food Manufacturing
Pigging Solutions in Pet Food ManufacturingPigging Solutions in Pet Food Manufacturing
Pigging Solutions in Pet Food Manufacturing
 
Connect Wave/ connectwave Pitch Deck Presentation
Connect Wave/ connectwave Pitch Deck PresentationConnect Wave/ connectwave Pitch Deck Presentation
Connect Wave/ connectwave Pitch Deck Presentation
 
CloudStudio User manual (basic edition):
CloudStudio User manual (basic edition):CloudStudio User manual (basic edition):
CloudStudio User manual (basic edition):
 
Vulnerability_Management_GRC_by Sohang Sengupta.pptx
Vulnerability_Management_GRC_by Sohang Sengupta.pptxVulnerability_Management_GRC_by Sohang Sengupta.pptx
Vulnerability_Management_GRC_by Sohang Sengupta.pptx
 

Tensile Strengthy

  • 1. 1 Introduction: Ultimate tensile strength (UTS), often shortened to tensile strength (TS) or ultimate strength, is the maximum stress that a material can withstand while being stretched or pulled before necking, which is when the specimen's cross-section starts to significantly stretch. Tensile strength is the opposite of compressive strength and the values can be quite different. Definition: Tensile strength is defined as a stress, which is measured as force per unit area. Maximum load that a material can support without fracture when being stretched, divided by the original cross -sectional area of the material. Tensile strengths have dimensions of force per unit area and in the English system of measurement are commonly expressed in units of pounds per square inch, often abbreviated to psi. When stresses less than the tensile strength are removed, a material returns either completely or partially to its original shape and size. As the stress reaches the value of the tensile strength, however, a material, if ductile, that has already begun to flow plastically rapidly forms a constricted region called a neck, where it then fractures. The ability to resist breaking under tensile stress is one of the most important and widely measured properties of materials used in structural applications. The force per unit area (MPa or psi) required to break a material in such a manner is the ultimate tensile strength or tensile strength at break . The rate at which a sample is pulled apart in the test can range from 0.2 to 20 inches per minute and will influence the results. The analogous test to measure tensile properties in the ISO system is ISO 527. The values reported in the ASTM D638 and ISO 527 tests in general do not vary significantly and either test will provide good results early in the material selection process. Separate tensile test methods are commonly applied to polymer films (ASTM D882) and elastomers (ASTM D412). For some non-homogeneous materials (or for assembled components) it can be reported just as a force or as a force per unit width. In the SI system, the unit is the pascal (Pa) (or a multiple thereof, often megapascals (MPa), using the mega- prefix); or, equivalently to pascals, newtons per square metre (N/m²). The customary unit is pounds-force per square inch (lbf/in² or psi), or kilo-pounds per square inch (ksi, or sometimes kpsi), which is equal to 1000 psi; kilo-pounds per square inch are commonly used for convenience when measuring tensile strengths. There are three typical definitions of tensile strength: Yield strength - The stress a material can withstand without permanent deformation. This is not a sharply defined point. Yield strength is the stress which will cause a permanent deformation of 0.2% of the original dimension. Ultimate strength - The maximum stress a material can withstand. Breaking strength :The stress coordinate on the stress-strain curve at the point of rupture.
  • 2. 2 Tensile Properties: Tensile properties indicate how the material will react to forces being applied in tension. A tensile test is a fundamental mechanical test where a carefully prepared specimen is loaded in a very controlled manner while measuring the applied load and the elongation of the specimen over some distance. Tensile tests are used to determine the modulus of elasticity, elastic limit, elongation, proportional limit, reduction in area, tensile strength, yield point, yield strength and other tensile properties. The main product of a tensile test is a load versus elongation curve which is then converted into a stress versus strain curve. Since both the engineering stress and the engineering strain are obtained by dividing the load and elongation by constant values (specimen geometry information), the load -elongation curve will have the same shape as the engineering stress-strain curve. The stress-strain curve relates the applied stress to the resulting strain and each material has its own unique stress -strain curve. A typical engineering stress-strain curve is shown below. If the true stress, based on the actual cross-sectional area of the specimen, is used, it is found that the stress-strain curve increases continuously up to fracture. Linear-Elastic Region and Elastic Constants As can be seen in the figure, the stress and strain initially increase with a line ar relationship. This is the linear-elastic portion of the curve and it indicates that no plastic deformation has occurred. In this region of the curve, when the stress is reduced, the material will return to its original shape. In this linear region, the line obeys the relationship defined as Hooke's Law where the ratio of stress to strain is a constant. The slope of the line in this region where stress is proportional to strain and is called the modulus of elasticity or Young's modulus. The modulus of elasticity (E) defines the properties of a material as it undergoes stress, deforms, and then returns to its original shape after the stress is removed. It is a measure of the stiffness of a given material. To compute the modulus of elastic , simply divide the stress by the strain in the material. Since strain is unitless, the modulus will have the same units as the stress, such as kpi or MPa. The modulus of elasticity applies specifically to the situation of a component being stretched with a tensile force. This modulus is of interest when it is necessary to compute how much a rod or wire stretches under a tensile load. There are several different kinds of moduli depending on the way the material is being stretched, bent, or otherwise distorted. When a component is subjected to pure shear, for instance, a cylindrical bar under torsion, the shear modulus describes the linear-elastic stress-strain relationship. Axial strain is always accompanied by lateral strains of opposite sign in the two directions mutually perpendicular to the axial strain. Strains that result from an increase in length are designated as positive (+) and those that result in a decrease in length are designated as negative (-). Poisson's ratio is defined as the negative of the ratio of the lateral strain to the axial strain for a uniaxial stress state. Poisson's ratio is sometimes also defined as the ratio of the absolute values of lateral and axial strain. This ratio, like strain, is unitless since both strains are unitless. For stresses within the elastic range, this ratio is
  • 3. 3 approximately constant. For a perfectly isotropic elastic material, Poisson's Ratio is 0.25, but for most materials the value lies in the range of 0.28 to 0.33. Generally for steels, Poisson’s ratio will have a value of approximately 0.3. This means that if there is one inch per inch of deformation in the direction that stress is applied, there will be 0.3 inches per inch of deformation perpendicular to the direction that force is applied. change in pressure and the resulting strain produced is the bulk modulus. Lame's constants are derived from modulus of elasticity and Poisson's ratio. Yield Point: In ductile materials, at some point, the stress-strain curve deviates from the straight-line relationship and Law no longer applies as the strain increases faster than the stress. From this point on in the tensile test, some permanent deformation occurs in the specimen and the material is said to react plastically to any further increase in load or stress. The material will not return to its original, unstressed condition when the load is removed. In brittle materials, little or no plastic deformation occurs and the material fractures near the end of the linear-elastic portion of the curve. With most materials there is a gradual transition from elastic to plastic behavior, and the exact point at which plastic deformation begins to occur is hard to determine. Therefore, various criteria for the initiation of yielding are used depending on the sensitivity of the strain measurements and the intended use of the data. (See Table) For most engineering design and specification applications, the yield strength is used. The yield strength is defined as the stress required to produce a small, amount of plastic deformatio n. The offset yield strength is the stress corresponding to the intersection of the stress -strain curve and a line parallel to the elastic part of the curve offset by a specified strain (in the US the offset is typically 0.2% for metals and 2% for plastics). In Great Britain, the yield strength is often referred to as the proof stress. The offset value is either 0.1% or 0.5% To determine the yield strength using this offset, the point is found on the strain axis (x -axis) of 0.002, and then a line parallel to the stress-strain line is drawn. This line will intersect the stress-strain line slightly after it begins to curve, and that intersection is defined as the yield strength with a 0.2% offset. A good way of looking at offset yield strength is that after a specimen has been loaded to its 0.2 percent offset yield strength and then unloaded it will be 0.2 percent longer than before the test. Even though the yield strength is meant to represent the exact point at which the material becomes permanently deforme d, 0.2% elongation is considered to be a tolerable amount of sacrifice for the ease it creates in defining the yield strength. Some materials such as gray cast iron or soft copper exhibit essentially no linear-elastic behavior. For these materials the usual practice is to define the yield strength as the stress required to produce some total amount of strain.
  • 4. 4 True elastic limit is a very low value and is related to the motion of a few hundred dislocations. Micro strain measurements are required to detect strain on order of 2 x 10 -6 in/in. Proportional limit is the highest stress at which stress is directly proportional to strain. It is obtained by observing the deviation from the straight-line portion of the stress-strain curve. Elastic limit is the greatest stress the material can withstand without any measurable permanent strain remaining on the complete release of load. It is determined using a tedious incremental loading -unloading test procedure. With the sensitivity of strain measurements usually emp loyed in engineering studies (10 - 4in/in), the elastic limit is greater than the proportional limit. With increasing sensitivity of strain measurement, the value of the elastic limit decreases until it eventually equals the true elastic limit determined from micro strain measurements. Yield strength is the stress required to produce a small-specified amount of plastic deformation. The yield strength obtained by an offset method is commonly used for engineering purposes because it avoids the practical difficulties of measuring the elastic limit or proportional limit. Ultimate Tensile Strength: The ultimate tensile strength (UTS) or, more simply, the tensile strength, is the maximum engineering stress level reached in a tension test. The strength of a material is its ability to withstand external forces without breaking. In brittle materials, the UTS will at the end of the linear-elastic portion of the stress-strain curve or close to the elastic limit. In ductile materials, the UTS will be well outside of the elastic portion into the plastic portion of the stress-strain curve. On the stress-strain curve above, the UTS is the highest point where the line is momentarily flat. Since the UTS is based on the engineering stress, it is often not the same as the breaking strength. In ductile materials strain hardening occurs and the stress will continue to increase until fracture occurs, but the engineering stress-strain curve may show a decline in the stress level before fracture occurs. This is the result of engineering stress being based on the original cross-section area and not accounting for the necking that commonly occurs in the test specimen. The UTS may not be completely representative of the highest level of stress that a material can support, but the value is not typically used in the design of components anyway. For ductile metals the current design practice is to use the yield strength for sizing static components. However, since the UTS is easy to determine and quite reproducible, it is useful for the purposes of specifying a material and for quality control purposes. On the other hand, for br ittle materials the design of a component may be based on the tensile strength of the material. Measures of Ductility (Elongation and Reduction of Area): The ductility of a material is a measure of the extent to which a material will deform before fracture. The amount of ductility is an important factor when considering forming operations such as rolling and extrusion. It also provides an indication of how visible overload damage to a component might become before the
  • 5. 5 component fractures. Ductility is also used a quality control measure to assess the level of impurities and proper processing of a material. Tensile strengths are rarely used in the design of ductile members, but they are important in brittle members. They are tabulated for common materials such as alloys, composite materials, ceramics, plastics, and wood. Fig: Stress vs. Strain curve typical of aluminum 1. Ultimate strength 2. Yield strength 3. Proportional limit stress 4. Fracture 5. Offset strain (typically 0.2%) After the yield point, ductile metals will undergo a period of strain hardening, in which the stress increases again with increasing strain, and they begin to neck, as the cross-sectional area of the specimen decreases due to plastic flow. In a sufficiently ductile material, when necking becomes substantial, it causes a reversal of the engineering stress-strain curve (curve A); this is because the engineering stress is calculated assuming the original cross-sectional area before necking. The reversal point is the maximum stress on the engineering stress-strain curve, and the engineering stress coordinate of this point is the tensile ultimate strength, given by point 1.
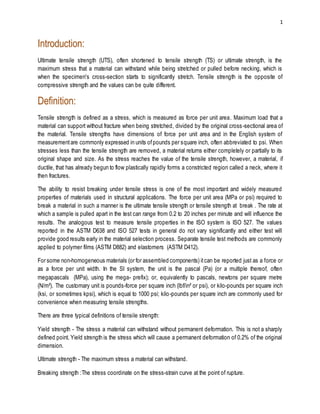
  • 6. 6 Fig: Stress vs. strain curve typical of structural steel 1. Ultimate strength 2. Yield strength 3. Fracture 4. Strain hardening region 5. Necking region A: Engineering stress B: True stress The conventional measures of ductility are the engineering strain at fracture (usually called the elongation ) and the reduction of area at fracture. Both of these properties are obtained by fitting the specimen back together after fracture and measuring the change in length and cross -sectional area. Elongation is the change in axial length divided by the original length of the specimen or portion of the specimen. It is expressed as a percentage. Because an appreciable fraction of the plastic deformation will be concentrated in the necked region of the tensile specimen, the value of elongation will depend on the gage length over which the measurement is taken. The smaller the gage length the greater the large localized strain in the necked region will factor into the calculation. Therefore, when reporting values of elongation , the gage length should be given. One way to avoid the complication from necking is to base the elongation measurement on the uniform strain out to the point at which necking begins. This works well at times but some engineering stress -strain curve are often quite flat in the vicinity of maximum loading and it is difficult to precisely establish the strain when necking starts to occur.
  • 7. 7 Reduction of area is the change in cross-sectional area divided by the original cross-sectional area. This change is measured in the necked down region of the specimen. Like elongation, it is usually expressed as a percentage. As previously discussed, tension is just one of the way that a material can be loaded. Other ways of loading a material include compression, bending, shear and torsion, and there are a number of standard tests that have been established to characterize how a material performs under these other loading conditions. A very cursory introduction to some of these other material properties will be provided on the next page. Tensile properties indicate how the material will react to the forces being applied in tension. A tensile test is a fundamental mechanical test where a careful prepared specimen is loaded in a very controlled manner, while measuring the applied load and the elongation of the specimen over some distance. Tensile properties included: Hooke’s Law: For most tensile testing of materials, you will notice that in the initial portion of the test, the relationship between the applied force, or load, and the elongation the specimen exhibits is linear. In this linear region, the line obeys the relationship defined as "Hooke's Law" where the ratio of stress to strain is a constant, or . E is the slope of the line in this region where stress (σ) is proportional to strain (ε) and is called the "Modulus of Elasticity" or "Young's Modulus". E= σ/ ε Strain: You will also be able to find the amount of stretch or elongation the specimen undergoes during tensile testing This can be expressed as an absolute measurement in the change in length or as a relative measurement called "strain". Strain itself can be expressed in two different ways, as "engineering strain" and "true strain". Engineering strain is probably the easiest and the most common expression of strain used. It is the ratio of the change in length to the original length, . Whereas, the true strain is similar but based on the instantaneous length of the specimen as the test progresses, , where Li is the instantaneous length and L0 the initial length. Yield Strength: A value called "yield strength" of a material is defined as the stress applied to the material at which plastic deformation starts to occur while the material is loaded. Select image to enlarge The modulus of elasticity is a measure of the stiffness of the material, but it only applies in the linear region of the curve. If a specimen is loaded within this linear region, the material will return to its exact same condition if the load is removed. At the point that the curve is no longer linear and
  • 8. 8 deviates from the straight-line relationship, Hooke's Law no longer applies and some permanent deformation occurs in the specimen. This point is called the "elastic, or proportional, limit". From this point on in the tensile test, the material reacts plastically to any further increase in load or stress. It will not return to its original, unstressed condition if the load were removed. Typical tensile strengths: Some typical tensile strengths of some materials: Material Yield strength(MPa) Unlimited strength(MPa) Density (g/cm³) Bamboo 350-500 0.4 Boron N/A 3100 2.46 Carbon fiber N/A 1600 for Laminate, 4137 for fiber alone 1.75 Copper 99.9% Cu 70 220 8.92 Glass 33 2.53 Rubber 15 Tungsten 1510 19.25 Typical properties for annealed elements: Element Young's Modulus(GPa) Proof or yield stress (MPa) Ultimate strength (MPa) Aluminium 70 15-20 40-50 Copper 130 33 210 Gold 79 100 Iron 211 80-100 350 Nickel 170 14-35 140-195
  • 9. 9 References: 1: Engineering Materials, Vol. 1. 5th Edition. 2: From Wikipedia, the free encyclopedia 3: Lecture sheets