Download to read offline
![International Research Journal of Engineering and Technology (IRJET) e-ISSN: 2395 -0056
Volume: 04 Issue: 03 | Mar -2017 www.irjet.net p-ISSN: 2395-0072
© 2017, IRJET | Impact Factor value: 5.181 | ISO 9001:2008 Certified Journal | Page 1847
learning models. In Section 5, we present the experimental
setup and results, followed by, in Section 6, we conclude the
paper with future directions of this research.
2. RELATED WORK
There are a lot of researches being carried out in the area
of customer churn prediction modeling. In this section, we
survey some of the researches carried out in this area in the
past few years.
Authors of [1] depict phasesof a generalchurnprediction
model such as data collection, preparation, classificationand
prediction. It also describes that identifying the right
grouping of variables has significant influence in improving
the percentage of true predictions (TP). A churn prediction
model was proposed by [1], which works in 5 steps: i)
problem identification; ii) dataset selection; iii)investigation
of data set; iv) classification; v) clustering, and vi) using the
knowledge. It seems to be a complete model. Classification
techniques are usedfordistinguishingChurners.Clusteringis
used for model evaluation. For classification, Decision tree,
Support vector machine and Neural Network are used. And
for clustering Simple K-Means was used. It concluded that
SVM was the best among the three methods in distinguishing
churners from non-churners.
Building an effective customer churn prediction model
using various techniques has become a significant topic for
business andacademics in recentyears[2].Theidentification
of why customers give up their relationships has been focus
of marketing research for the past few years [3]. Due to the
enormous growth of customer related data and call detail
data collectedand maintained by the companiesintherecent
years, more sophisticated metrics have evolved to describe
customer behaviourand better understandhowbehavioural
characteristics can be linked to customer retention and firm
performance [4].
Authors in [5] proposed a decision tree based Random
Forest method for feature extraction. From the original data
with Q features, exactly N samples with q < Q are randomly
selected for each tree to form a forest. The number of trees
depends on the number of features randomly combined for
each decision tree from the wholeQfeatures.Developmentof
a predictive model based on data-centric approach for
detecting the early warning signs of churn, and for
developing a Churn Score to identify subscribers who are
likely to end their relationship with the company was
discussed in [6], where the customer’scalling pattern played
the major role in predicting churn.
An overview of socially grouped users and their
behavioural pattern are elaborately identified in [7]. It also
explores the impact of centrality features among customers.
It concludes that when a customer in a group leaves the
network, there is a high probability of others in that group to
leave the network. It classifies the feature variables in two
types: i) dependent variables (call duration of in-degree and
out-degree), ii) independent variables (social forum like
services and the customer’s involvement in the forum). The
level of customer’s active participation was used as the
measure of probability of churn. Customers who are
members of multiple community forums areathighriskthan
those who are members in less number of forums.
In the recent past, deep learning algorithms have evolved
to provide outstanding results in computer vision compared
to the traditional classifiers. Authors of [8], applied deep
convolutional neural networks and auto-encoders for
building a churn prediction model. They transformed the
temporal behavior of customers into images and then they
modeledthechurnpredictionproblemasimageclassification
problem. Their experimental results show that their deep
learning model outperforms decision trees. Authors of [9]
also used deep learning models for churn prediction. They
applied auto encoders, deep belief networks and multi-layer
forward networks for churn prediction and showed that the
deep learning models achieves better accuracy compared to
random forests. In contrast with all these approaches, we
designed three deep learning models with increasing
complexity using simple and convolutional neural networks
for the churn prediction task. We trained our networks over
two public datasets and show that some datasets deep
learning networks are better than traditional classifiers but
not for all the datasets.
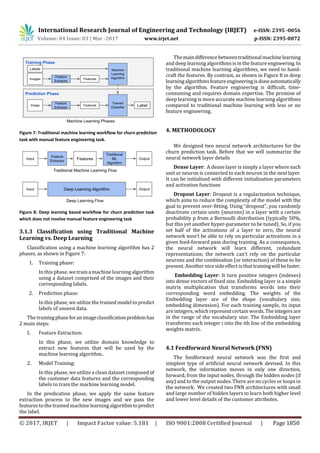
3. DEEP LEARNING MODELS
In this section, we first present an overview of deep
learning networks and then present the proposed deep
learning architectures for churn prediction task.
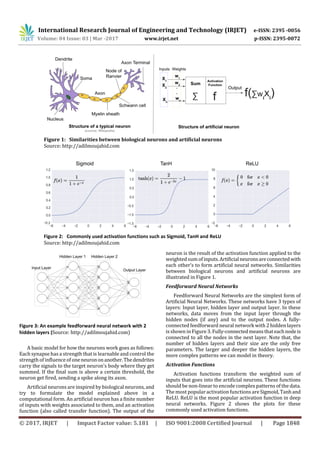
3.1 Overview of Deep Learning
Deep learningreferstoaclassofartificialneuralnetworks
(ANNs) composed of many processing layers. ANNs existed
formany decades,butattemptsattrainingdeeparchitectures
of ANNs failed until Geoffrey Hinton's breakthrough work of
the mid-2000s. In addition to algorithmic innovations, the
increase in computing capabilities using GPUs and the
collection of larger datasets are all factors that helped in the
recent surge of deep learning.
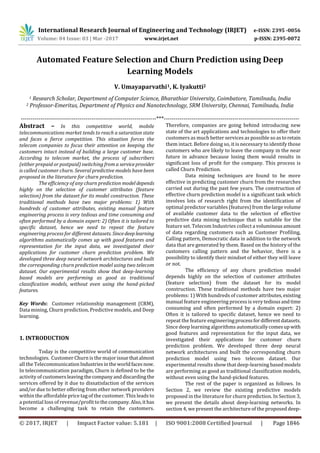
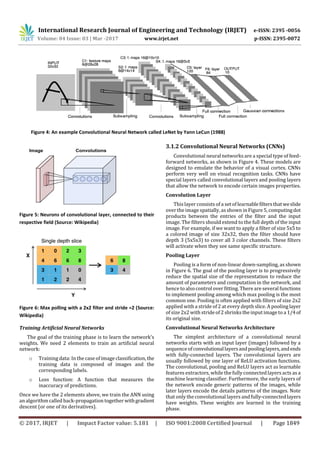
3.1.1 Artificial Neural Networks (ANNs)
Artificial neural networks (ANNs) are a familyofmachine
learning models inspired by biological neural networks.
Artificial Neural Networks vs. Biological Neural Networks
Biological Neurons arethecorecomponentsofthehuman
brain. A neuron consists of a cell body, dendrites, and an
axon. It processes and transmit informationtootherneurons
by emitting electrical signals. Each neuron receives input
signals from its dendrites and produces output signals along
its axon. The axon branches out and connects viasynapsesto
dendrites of other neurons.](https://image.slidesharecdn.com/irjet-v4i3422-171228092704/85/Automated-Feature-Selection-and-Churn-Prediction-using-Deep-Learning-Models-2-320.jpg)
![International Research Journal of Engineering and Technology (IRJET) e-ISSN: 2395 -0056
Volume: 04 Issue: 03 | Mar -2017 www.irjet.net p-ISSN: 2395-0072
© 2017, IRJET | Impact Factor value: 5.181 | ISO 9001:2008 Certified Journal | Page 1854
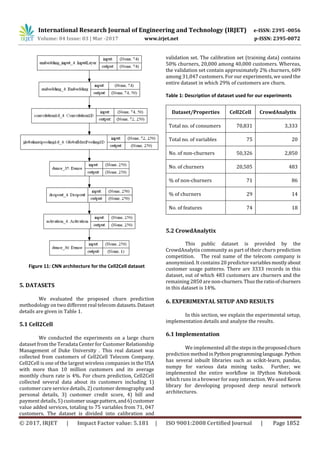
ACKNOWLEDGEMENT
Authors would like thank Teradata Center for
Customer Relationship Management (CCRM) of Duke
University and CrowdAnalytix community for providing the
churn prediction competition dataset for our research.
REFERENCES
[1] Liao, Shu-Hsien, Pei-Hui Chu, and Pei-Yuan Hsiao. "Data
mining techniques and applications–A decade review
from 2000 to 2011." Expert Systems with Applications
39, no. 12 (2012): 11303-11311.
[2] Kamalraj, N., and A. Malathi. "A survey on churn
prediction techniques in communication sector."
International Journal of Computer Applications64, no.5
(2013).
[3] N.Hashmi, N.ButtandM.Iqbal. Customer Churn
Prediction in Telecommunication A Decade Review and
Classification. International Journal of Com-puter
Science Vol.10(5),2013
[4] V. Umayaparvathi, K. Iyakutti, “ Applications of Data
Mining Techniques in Telecom Churn Prediction”,
International Journal of Computer Applications, Vol. 42,
No.20, 2012
[5] V. Umayaparvathi, K. Iyakutti,, “Attribute Selection and
Customer Churn Prediction in Telecom Industry”,
Proceedings of the IEEE International Conference On
Data Mining and Advanced Computing, 2016 (to be
appeared).
[6] Huang, Bingquan, Mohand Tahar Kechadi, and Brian
Buckley. "Customer churn prediction in
telecommunications." Expert SystemswithApplications
39, no. 1 (2012): 1414-1425
[7] Shaaban, Essam, Yehia Helmy, Ayman Khedr, and Mona
Nasr. "A proposed churn prediction model." IJERA 2
(2012): 693-697.
[8] Wangperawong, Artit, Cyrille Brun, Olav Laudy, and
Rujikorn Pavasuthipaisit. "Churn analysis using deep
convolutional neural networksandautoencoders."arXiv
preprint arXiv:1604.05377 (2016).
[9] Castanedo, Federico, Gabriel Valverde, JaimeZaratiegui,
and Alfonso Vazquez. "Using deep learning to predict
customer churn in a mobile telecommunication
network." (2014).](https://image.slidesharecdn.com/irjet-v4i3422-171228092704/85/Automated-Feature-Selection-and-Churn-Prediction-using-Deep-Learning-Models-9-320.jpg)

This document discusses using deep learning models for churn prediction in the telecommunications industry. It begins with an introduction to churn prediction and feature selection challenges. It then provides an overview of deep learning techniques, including artificial neural networks, convolutional neural networks, and their applications. The document proposes three deep learning architectures for churn prediction and experiments with them on two telecom datasets. The results show deep learning models can achieve performance comparable to traditional models without manual feature engineering.