SlideShare a Scribd company logo
1 of 67
Download to read offline
Blu-ray Weekly Revenue Trend
      (Week Ending 01/13/08 to 10/29/11)
100

            with linear trendline
         and current week level line
         and YTD average level line
       and 4Q sales highlighted in blue
 80
      and YTY comparison weeks in red


 60


 40


 20


  0
20
                40
                     60
                          80


       0
                               100
J-08
F-08
M-08
A-08
M-08
J-08
J-08
A-08
S-08
O-08
N-08
D-08
J-09
F-09
M-09
A-09
M-09
J-09
J-09
A-09
S-09
O-09
N-09
D-09
J-10
F-10
M-10
A-10
M-10
J-10
J-10
A-10
S-10
O-10
N-10
D-10
                                     Blu-ray Weekly Revenue Trend ($M) (week ending 1/06/08 thru 10/29/11)


J-11
F-11
M-11
A-11
M-11
J-11
J-11
A-11
S-11
O-11
Blu-ray Revenue Trend
                               4 per. Mov. Avg. (Blu-ray Revenue Trend)
100


80


60


40


20


  0
      J F M A M J J A S O N D J F M A M J J A S O N D J F M A M J J A S O N D J F M A M J J A S O
      … … … … … … … … … … … … … … … … … … … … … … … … … … … … … … … … … … … … … … … … … … … … … …
Blu-ray Revenues 2011 vs 2010 by matching YTY weeks HMM ($M)
                                                                           2011         2010
$100


$80


$60


$40


$20


 $0
       1 2 3 4 5 6 7 8 9 10 11 12 13 14 15 16 17 18 19 20 21 22 23 24 25 26 27 28 29 30 31 32 33 34 35 36 37 38 39 40 41 42 43 44 45 46 47 48 49 50 51 52
Blu-ray Revenues (Matched Weeks 2008 2009 2010 2011 ) $ M

100
           2008 Blu-ray         2009 Blu-ray

           2010 Blu-ray         2011 Blu-ray

80


60


40


20


 0
 January   February     March   April   May    June   July   August   September   October   November   December
1200

                 Blu-ray Quarterly Revenue Trend
                    2008 - 2011 (as of 10/29/11)

             Cumulative Weekly HMM Published Data
1000
           Even 7 Day Mon-Sun Reporting Weeks x 13
       Even 7 day Sun - Sat Reporting Week starting 12/18/10


800


600


                                                                4Q
                                                               Week
400                                                            4/13


200


   0
1Q 2011 vs 1Q 2010 by matching YTY weeks ($ M)

                                        1Q 2011   1Q 2010
$100


$80


$60


$40


$20


 $0
       1   2   3   4         5      6       7       8       9   10      11   12   13
2Q 2011 vs 2Q 2010 by matching YTY weeks ($ M)
                                        2Q 2011   2Q 2010
$100


$80


$60


$40


$20


 $0
       1   2   3   4         5      6       7       8       9   10      11   12   13
3Q 2011 vs 3Q 2010 by matching YTY weeks ($ M)
                                        3Q 2011   3Q 2010
$100


$80


$60


$40


$20


  $0
       1   2   3   4         5      6       7       8       9    10     11   12   13
4Q 2011 vs 4Q 2010 by matching YTY weeks ($ M)
                                     4Q 2011   4Q 2010
$100


$80


$60


$40


$20


 $0
       1   2   3   4     5       6        7       8      9   10     11   12   13
1Q 2011 vs 1Q 2010 sorted by relative quarterly revenue performance ($ M)
                                         1Q 2011   1Q 2010
$100


$80


$60


$40


$20


 $0
2Q 2011 vs 2Q 2010 sorted by relative quarterly revenue performance ($ M)
                                         2Q 2011   2Q 2010
$100


$80


$60


$40


$20


 $0
3Q 2011 vs 3Q 2010 sorted by relative quarterly revenue performance ($ M)
                                         3Q 2011   3Q 2010
$100


$80


$60


$40


$20


 $0
4Q 2011 vs 4Q 2010 sorted by relative quarterly revenue performance ($ M)

                                      4Q 2011   4Q 2010
$100


 $80


 $60


 $40


 $20


  $0
200.00%

                      Blu-ray YTY Change             DVD YTY Change               Total DVD+BD Change from Previous Year Matching Weeks


150.00%


100.00%


 50.00%


  0.00%


-50.00%
       8-Jan   22-Jan 5-Feb 19-Feb 5-Mar 19-Mar 2-Apr 16-Apr 30-Apr 14-May 28-May 11-Jun 25-Jun   9-Jul   23-Jul   6-Aug 20-Aug 3-Sep 17-Sep 1-Oct 15-Oct 29-Oct
Blu-ray YTY Change             DVD YTY Change               Total DVD+BD Change from Previous Year Matching Weeks
90.00%


70.00%


50.00%


30.00%


10.00%


-10.00%


-30.00%


-50.00%
       8-Jan   22-Jan 5-Feb 19-Feb 5-Mar 19-Mar 2-Apr 16-Apr 30-Apr 14-May 28-May 11-Jun 25-Jun   9-Jul   23-Jul   6-Aug 20-Aug 3-Sep 17-Sep 1-Oct 15-Oct 29-Oct
30%


                                             Blu-ray 2011 Cumulative YTD YoY Gain Trend


25%


20%


15%


10%


5%


0%
  8-Jan   22-Jan   5-Feb   19-Feb 5-Mar 19-Mar 2-Apr   16-Apr 30-Apr 14-May 28-May 11-Jun 25-Jun   9-Jul   23-Jul   6-Aug 20-Aug   3-Sep   17-Sep   1-Oct   15-Oct 29-O
-10%
       J-11   J-11   F-11   F-11   M-11   M-11   A-11   A-11   A-11   M-11   M-11   J-11   J-11   J-11   J-11   A-11   A-11   S-11   S-11   O-11   O-11   O-1


                                                 DVD+Blu-ray (OD) 2011 Cumulative YTD YoY Gain Trend
-12%


-14%


-16%


-18%


-20%


-22%
30%


                                              Blu-ray and OD 2011 Cumulative YTD YoY Gain Trend


20%


10%


 0%
   8-Jan   22-Jan   5-Feb   19-Feb 5-Mar 19-Mar 2-Apr    16-Apr 30-Apr 14-May 28-May 11-Jun 25-Jun   9-Jul   23-Jul   6-Aug 20-Aug   3-Sep   17-Sep   1-Oct   15-Oct 29-O


-10%


-20%


                                                        Cumulative YTD Blu-ray YoY Gain          OD YTD Cumulative YoY Gain
-30%
800


      HMM Reported DVD and Blu-ray Revenue Sales Trends

700


600


500


400


300


200


100


 0
700

                        Blu-ray and DVD Revenues Full Year (Matched Weeks 2008 2009 2010 2011)

600
                      2008 DVD                              2009 DVD                              2008 Blu-ray
                      2009 Blu-ray                          2010 DVD                              2010 Blu-ray
                      2010 DVD+BD                           2009 DVD+BD                           2011 DVD
                      2011 Blu-ray                          2011 Blu-ray+DVD
500


400


300


200


100


 0
      1 2 3 4 5 6 7 8 9 10 11 12 13 14 15 16 17 18 19 20 21 22 23 24 25 26 27 28 29 30 31 32 33 34 35 36 37 38 39 40 41 42 43 44 45 46 47 48 49 50 51 52
700


      HMM reported DVD and Blu-ray Revenue Sales Trends

600


500


400


300


200


100


  0
700

                           DVD Revenues
                           Blu-ray Revenues ($M) (overlaid & non stacked)
600


500


400


300


200


100


 0
      J-08 F-08M-08 A-08M-08 J-08 J-08 A-08 S-08O-08 N-08 D-08 J-09 F-09M-09 A-09M-09 J-09 J-09 A-09 S-09O-09 N-09D-09 J-10 F-10M-10 A-10M-10 J-10 J-10 A-10 S-10O-10 N-10D-10 J-11 F-11M-11 A-11M-11 J-11 J-11 A-11 S-11O-11
700


                                                          DVD Revenues (stacked on top of Blu-ray)                       Blu-ray Revenues (stacked under DVD)


600


500


400


300


200


100


  0
      J   F   M   A   M   J   J   A   S   O   N   D   J   F    M    A    M    J    J    A    S       O   N   D   J   F   M    A    M    J    J    A   S    O    N   D   J   F   M   A   M   J   J   A   S   O
700


                                                                             Blu-ray Revenues                       DVD Revenues

600


500


400


300


200


100


 0
      J-08F-08M-08A-08M-08J-08J-08A-08S-08O-08N-08D-08J-09F-09
                                                             M-09A-09M-09J-09J-09A-09S-09O-09N-09D-09J-10F-10
                                                                                                            M-10A-10M-10J-10J-10A-10S-10O-10N-10D-10J-11F-11
                                                                                                                                                           M-11A-11M-11J-11J-11A-11S-11O-11
700
                                                                                             Blu-ray Revenues
                                                                                             DVD Revenues
                                                                                             DVD+BD Revenues
600


500


400


300


200


100


 0
      J-08F-08M-08A-08M-08J-08J-08A-08S-08O-08N-08D-08J-09F-09
                                                             M-09A-09M-09J-09J-09A-09S-09O-09N-09D-09J-10F-10
                                                                                                            M-10A-10M-10J-10J-10A-10S-10O-10N-10D-10J-11F-11
                                                                                                                                                           M-11A-11M-11J-11J-11A-11S-11O-11
1800

                                       Cumulative Blu-ray Revenues (Matched Weeks) ($ M)

1600                                                      2008         2009        2010         2011


1400


1200


1000


800


600


400


200


  0
       1 2 3 4 5 6 7 8 9 10 11 12 13 14 15 16 17 18 19 20 21 22 23 24 25 26 27 28 29 30 31 32 33 34 35 36 37 38 39 40 41 42 43 44 45 46 47 48 49 50 51 52
12000


                                   Cumulative Blu-ray and DVD Revenues (Matched Weeks)
                  2008 DVD                     2009 DVD                    2008 Blu-ray
10000             2009 Blu-ray                 2010 DVD                    2010 Blu-ray


8000


6000


4000


2000


    0
        1 2 3 4 5 6 7 8 9 10 11 12 13 14 15 16 17 18 19 20 21 22 23 24 25 26 27 28 29 30 31 32 33 34 35 36 37 38 39 40 41 42 43 44 45 46 47 48 49 50 51 52
14000


                                  Cumulative Blu-ray and DVD Revenues (Matched Weeks)

12000
                        2008 DVD                         2008 Blu-ray                    2008 DVD+BD                     2009 DVD
                        2009 Blu-ray                     2009 DVD+BD                     2010 DVD                        2010 Blu-ray

10000


 8000


 6000


 4000


 2000


    0
        1 2 3 4 5 6 7 8 9 10 11 12 13 14 15 16 17 18 19 20 21 22 23 24 25 26 27 28 29 30 31 32 33 34 35 36 37 38 39 40 41 42 43 44 45 46 47 48 49 50 51 52
1,700                                                                                                                                                        35,000
                                  Dual Axis Cumulative Blu-ray and DVD Revenues                                                               DVD $ M
        Blu-ray $ M
                        Axis Scale Adjusted to Match DVD and Blu-ray 2008 Seasonal Trend
1,500
                      (Compares Succesive Blu-ray Seasonal Sales Acceleration Rates to DVD )
                                                                                                                                                             30,000

              2008 Blu-ray              2009 Blu-ray
1,300


              2010 Blu-ray              2011 Blu-ray                                                                                                         25,000

1,100

              2008 DVD                  2009 DVD
                                                                                                                                                             20,000
 900

              2010 DVD                  2011 DVD

 700
                                                                                                                                                             15,000


 500

                                                                                                                                                             10,000


 300


                                                                                                                                                             5,000
 100


-100                                                                                                                                                         0
        1 2 3 4 5 6 7 8 9 10 11 12 13 14 15 16 17 18 19 20 21 22 23 24 25 26 27 28 29 30 31 32 33 34 35 36 37 38 39 40 41 42 43 44 45 46 47 48 49 50 51 52
5000


                                                        Cumulative Blu-ray Sell Through Revenues $M
4500


4000


3500


3000


2500


2000


1500


1000


500


  0
       J-08   M-08   M-08   J-08   S-08   N-08   J-09   M-09   M-09   J-09   S-09   N-09   J-10   M-10   M-10   J-10   S-10   N-10   J-11   M-11   M-11   J-11   S-11
40%
                                  Blu-ray Revenue Marketshare by Quarter 2008-2011
                                           (HMM published data (weighted average per quarter)

35%


30%


25%


20%


15%


10%


5%


0%
      E1Q    E2Q    E3Q    E4Q      E1Q    E2Q      E3Q      E4Q     E1Q      E2Q      E3Q      4QTD   E1Q    E2Q    E3Q    4QTD
      2008   2008   2008   2008     2009   2009     2009     2009    2010     2010     2010     2010   2011   2011   2011   2011
60%
                           Blu-ray Top 20 Sellers Unit Marketshare by Quarter 2008-2011
                                            (HMM published data (non weighted average)


50%


40%


30%


20%


10%


0%
      E1Q    E2Q    E3Q     E4Q    E1Q    E2Q     E3Q     E4Q      E1Q     E2Q      E3Q    4QTD   E1Q    E2Q    E3Q    4QTD
      2008   2008   2008    2008   2009   2009    2009    2009     2010    2010     2010   2010   2011   2011   2011   2011
40%


                                  Blu-ray Revenue Market Share (BD/(BD+DVD) REVENUE)

35%


30%


25%


20%


15%


10%


5%


0%
  J-08F-08M-08A-08M-08J-08J-08A-08S-08O-08N-08D-08J-09F-09
                                                         M-09A-09M-09J-09J-09A-09S-09O-09N-09D-09J-10F-10
                                                                                                        M-10A-10M-10J-10J-10A-10S-10O-10N-10D-10J-11F-11
                                                                                                                                                       M-11A-11M-11J-11J-11A-11S-11O-11
40%

          Blu-Ray Revenue Share Percentage (BD / (BD+DVD))

35%


30%


25%


20%


15%


10%


5%


                                                                                                                               2008             2009
                                                                                                                               2010             2011
0%
      1   2   3   4   5   6   7   8   9 10 11 12 13 14 15 16 17 18 19 20 21 22 23 24 25 26 27 28 29 30 31 32 33 34 35 36 37 38 39 40 41 42 43 44 45 46 47 48 49 50 51 52
BD Top 20 Sellers Unit % - Blu-ray Unit Marketshare
60%                                                   of All Titles on Top 20 Sellers Chart


50%


40%


30%


20%


10%


0%
      J-08 F-08M-08 A-08 M-08 J-08 J-08 A-08 S-08 O-08 N-08 D-08 J-09 F-09M-09 A-09 M-09 J-09 J-09 A-09 S-09 O-09 N-09 D-09 J-10 F-10M-10 A-10 M-10 J-10 J-10 A-10 S-10 O-10 N-10 D-10 J-11 F-11M-11 A-11 M-11 J-11 J-11 A-11 S-11 O-11
BD Top 20 Sellers Unit % - Blu-ray Unit Marketshare Of All Titles on Top 20 Sellers List - YTY Comparison
   65%


   60%


   55%


   50%


   45%


   40%


   35%


   30%


   25%


   20%


   15%


   10%


    5%
                          Top 20 Sellers 2010 BD Unit%                                             Top 20 Sellers 2009 BD% After 7/19/09
                          Total Market Blu-ray Unit Marketshare %                                  Top 20 Sellers BD% 2011
    0%
         1 2 3 4 5 6 7 8 9 10 11 12 13 14 15 16 17 18 19 20 21 22 23 24 25 26 27 28 29 30 31 32 33 34 35 36 37 38 39 40 41 42 43 44 45 46 47 48 49 50 51 52
100%
                                              DVD and Blu-ray Format Revenue Share by Week

                                   Blu-ray Contribution            DVD Contribution          Source: Nielsen Videoscan first alert and Home Media Magazine Research

90%


80%


70%


60%


50%


40%


30%


20%


10%


 0%
       J-08   M-08   M-08   J-08    S-08    N-08     J-09   M-09     M-09    J-09     S-09   N-09    J-10   M-10    M-10     J-10    S-10    N-10     J-11   M-11     M-11   J-11   S-11
100%
                                              DVD and Blu-ray Format Nielsen Videoscan Top 20 Unit Share by Week

                                   Blu-ray Contribution            DVD Contribution          Source: Nielsen Videoscan first alert and Home Media Magazine Research

90%


80%


70%


60%


50%


40%


30%


20%


10%


 0%
       J-08   M-08   M-08   J-08    S-08    N-08     J-09   M-09     M-09    J-09     S-09   N-09    J-10   M-10    M-10     J-10    S-10    N-10     J-11   M-11     M-11   J-11   S-11
0%
               10%
                     20%
                                 40%
                                       50%
                                                                                                                                                                  60%
                                                                                                                                                                                                                                    70%


                           30%
Jan-08
Feb-08
Mar-08
Apr-08
May-08
Jun-08
 Jul-08
Aug-08
Sep-08
Oct-08
Nov-08
Dec-08
Jan-09
Feb-09
Mar-09
Apr-09
May-09
Jun-09
 Jul-09
Aug-09
Sep-09
                                                                                                                                                                                                2008-2011


Oct-09
Nov-09
Dec-09
Jan-10
Feb-10
Mar-10
                                                                                                            Blu-ray Revenue Share (New Pie Chart Since 7/19/09)


Apr-10
May-10
                                             Blu-ray Top 20 Sellers Unit % (Old Pie Chart before 7/12/09)


Jun-10
 Jul-10
Aug-10
                                                                                                                                                                        Blu-ray Revenue vs Top 20 Sellers Unit Marketshare Growth


Sep-10
Oct-10
Nov-10
Dec-10
Jan-11
Feb-11
Mar-11
Apr-11
May-11
Jun-11
 Jul-11
Aug-11
Sep-11
Oct-11
70%
              Blu-ray Revenue vs Top 20 Sellers Unit Marketshare Growth 2009-2011


60%


50%


40%


30%


20%


10%
                                                                          Blu-ray Revenue Share               Blu-ray Top 20 Sellers Unit Marketshare %


0%
  Jan-09   Mar-09   May-09   Jul-09   Sep-09   Nov-09   Jan-10   Mar-10   May-10   Jul-10   Sep-10   Nov-10     Jan-11   Mar-11   May-11   Jul-11   Sep-11   Nov-11
70%
           Blu-ray revenue vs Top 20 Sellers Unit Marketshare Growth 2010-2011


60%


50%


40%


30%


20%


10%

                                                                        Blu-ray Revenue Share            Blu-ray Top 20 Sellers Unit Marketshare %


0%
  Jan-10 Feb-10 Mar-10 Apr-10 May-10 Jun-10 Jul-10 Aug-10 Sep-10 Oct-10 Nov-10 Dec-10 Jan-11 Feb-11 Mar-11 Apr-11 May-11 Jun-11 Jul-11 Aug-11 Sep-11 Oct-11
70%
      Blu-ray revenue vs Top 20 Sellers Unit Marketshare Growth 2011


60%


50%


40%


30%


20%


10%
                                            Blu-ray Revenue Share   Blu-ray Top 20 Sellers Unit Marketshare %


0%
7,000,000,000
                       DVD New Release Revenue Trends 2007- 2010
                            Top 100 DVD Titles The-Numbers

6,000,000,000


5,000,000,000


4,000,000,000


3,000,000,000


2,000,000,000


1,000,000,000


           -
                2007            2008                 2009          2010
7,000,000,000
                       New Release Revenue Trends 2007 - 2011
                       80% of Blu-ray Total Sell Through Revenues (HMM)
                       DVD New Release Revenues (Top 100 Titles The-Numbers)
6,000,000,000


5,000,000,000


4,000,000,000


3,000,000,000


2,000,000,000


1,000,000,000


           -
                2007             2008                     2009                 2010
7,000,000,000
                       New Release Revenue Trends 2007- 2011
                       DVD New Release Revenues (Top 100 Titles The-Numbers)
                       Blu-ray Total Sell Through Revenues (HMM)
6,000,000,000


5,000,000,000


4,000,000,000


3,000,000,000


2,000,000,000


1,000,000,000


           -
                2007               2008                     2009               2010
7,000,000,000
                        DVD New Release Revenue Trends 2007- 2011
                             Top 100 DVD Titles (The-Numbers)

6,000,000,000


5,000,000,000


4,000,000,000


3,000,000,000


2,000,000,000


1,000,000,000


           -
                2007   2008        2009        2010     2011 (Q1-Q3)*2   (Q1-Q3 2011)
7,500,000,000
                                80% of Blu-ray Revenue Trends 2007 - 2011
                              (Assumed New Release Revenue Contribution)
6,500,000,000


5,500,000,000


4,500,000,000


3,500,000,000


2,500,000,000


1,500,000,000


 500,000,000


                2007   2008          2009         2010     2011 (Q1-Q3)*2   (Q1-Q3 2011)
(500,000,000)
7,000,000,000
                              New Release Revenue Trends 2007 - 2011
                              80% of Blu-ray Total Sell Through Revenues (HMM)
                              DVD New Release Revenues (Top 100 Titles The-Numbers)
6,000,000,000


5,000,000,000


4,000,000,000


3,000,000,000


2,000,000,000


1,000,000,000


           -
                2007   2008           2009          2010       2011 (Q1-Q3)*2         (Q1-Q3 2011)
7,000,000,000
                          New Release Revenue Trends 2007 - 2011
                              DVD New Release Revenues (Top 100 Titles The-Numbers)
                              80% of Blu-ray Total Sell Through Revenues (HMM)
6,000,000,000


5,000,000,000


4,000,000,000


3,000,000,000


2,000,000,000


1,000,000,000


           -
                2007   2008             2009          2010       2011 (Q1-Q3)*2       (Q1-Q3 2011)
7,000,000,000
                              DVD New Release Revenue Trends 2007- 2011
                                   Top 100 DVD Titles The-Numbers

6,000,000,000


5,000,000,000


4,000,000,000


3,000,000,000


2,000,000,000


1,000,000,000


           -
                2007   2008          2009         2010     2011 (Q1-Q3)*2   (Q1-Q3 2011)
7,000,000,000
                       Total Blu-ray Sell Through Revenue Trends 2007 - 2011


6,000,000,000


5,000,000,000


4,000,000,000


3,000,000,000


2,000,000,000


1,000,000,000


           -
                2007      2008         2009         2010      2011 (Q1-Q3)*2   (Q1-Q3 2011)
7,000,000,000
                              New Release Revenue Trends 2007- 2011
                              DVD New Release Revenues (Top 100 Titles The-Numbers)
                              Blu-ray Total Sell Through Revenues (HMM)
6,000,000,000


5,000,000,000


4,000,000,000


3,000,000,000


2,000,000,000


1,000,000,000


           -
                2007   2008             2009           2010      2011 (Q1-Q3)*2       (Q1-Q3 2011)
7,000,000,000
                          New Release Revenue Trends 2007 - 2011
                              Blu-ray Total Sell Through Revenues (HMM)
                              DVD New Release Revenues (Top 100 Titles The-Numbers)
6,000,000,000


5,000,000,000


4,000,000,000


3,000,000,000


2,000,000,000


1,000,000,000


           -
                2007   2008             2009           2010      2011 (Q1-Q3)*2       (Q1-Q3 2011)
800

                Blu-ray Quarterly Revenue Trend
                   2008 - 2011 (as of 10/22/11)
700
            Cumulative Weekly HMM Published Data
          Even 7 Day Mon-Sun Reporting Weeks x 13
      Even 7 day Sun - Sat Reporting Week starting 12/18/10
600


500


400


300
                                                               4Q
                                                              Week
                                                              3/13

200


100


  0
700


      Blu-ray Quarterly Revenue Trend
         2008 - 2011 (as of 10/31/11)
600

      Rentrak / DEG Data by Quarter


500


400


300


200


100


  0
Bd rev 102911

More Related Content

What's hot

Radio 2.0 Andomediagroup presentacion Daniel Karlsson organized by Actuonda
Radio 2.0 Andomediagroup presentacion Daniel Karlsson organized by ActuondaRadio 2.0 Andomediagroup presentacion Daniel Karlsson organized by Actuonda
Radio 2.0 Andomediagroup presentacion Daniel Karlsson organized by ActuondaACTUONDA
 
Hit the-road (maranan)
Hit the-road (maranan)Hit the-road (maranan)
Hit the-road (maranan)maranan_zyra
 
Granite Company Overview 2013 | Nationwide Voice and Data for Businesses
Granite Company Overview 2013 | Nationwide Voice and Data for BusinessesGranite Company Overview 2013 | Nationwide Voice and Data for Businesses
Granite Company Overview 2013 | Nationwide Voice and Data for BusinessesShane Hoff
 
Grand Lake OK 2005 2011 full year real estate market analysis
Grand Lake OK 2005   2011 full year real estate market analysisGrand Lake OK 2005   2011 full year real estate market analysis
Grand Lake OK 2005 2011 full year real estate market analysisRE/MAX Grand Lake
 
Chicagoland Quarterly Supply/Demand Report - 7/1/2011
Chicagoland Quarterly Supply/Demand Report - 7/1/2011Chicagoland Quarterly Supply/Demand Report - 7/1/2011
Chicagoland Quarterly Supply/Demand Report - 7/1/2011chipwags
 
H W 2010 Q3 De 12 Mo
H W 2010 Q3 De 12 MoH W 2010 Q3 De 12 Mo
H W 2010 Q3 De 12 Mochipwags
 
Comparative Financial Analysis
Comparative Financial AnalysisComparative Financial Analysis
Comparative Financial AnalysisJen
 

What's hot (8)

Radio 2.0 Andomediagroup presentacion Daniel Karlsson organized by Actuonda
Radio 2.0 Andomediagroup presentacion Daniel Karlsson organized by ActuondaRadio 2.0 Andomediagroup presentacion Daniel Karlsson organized by Actuonda
Radio 2.0 Andomediagroup presentacion Daniel Karlsson organized by Actuonda
 
Hit the-road (maranan)
Hit the-road (maranan)Hit the-road (maranan)
Hit the-road (maranan)
 
Npd
NpdNpd
Npd
 
Granite Company Overview 2013 | Nationwide Voice and Data for Businesses
Granite Company Overview 2013 | Nationwide Voice and Data for BusinessesGranite Company Overview 2013 | Nationwide Voice and Data for Businesses
Granite Company Overview 2013 | Nationwide Voice and Data for Businesses
 
Grand Lake OK 2005 2011 full year real estate market analysis
Grand Lake OK 2005   2011 full year real estate market analysisGrand Lake OK 2005   2011 full year real estate market analysis
Grand Lake OK 2005 2011 full year real estate market analysis
 
Chicagoland Quarterly Supply/Demand Report - 7/1/2011
Chicagoland Quarterly Supply/Demand Report - 7/1/2011Chicagoland Quarterly Supply/Demand Report - 7/1/2011
Chicagoland Quarterly Supply/Demand Report - 7/1/2011
 
H W 2010 Q3 De 12 Mo
H W 2010 Q3 De 12 MoH W 2010 Q3 De 12 Mo
H W 2010 Q3 De 12 Mo
 
Comparative Financial Analysis
Comparative Financial AnalysisComparative Financial Analysis
Comparative Financial Analysis
 

Viewers also liked

Viewers also liked (9)

Blu-ray Disc
Blu-ray Disc Blu-ray Disc
Blu-ray Disc
 
Blu-Ray Final2
Blu-Ray   Final2Blu-Ray   Final2
Blu-Ray Final2
 
Blu ray technology
Blu ray technologyBlu ray technology
Blu ray technology
 
Blu ray disc slides
Blu ray disc slidesBlu ray disc slides
Blu ray disc slides
 
Blu Ray Disc
Blu Ray  DiscBlu Ray  Disc
Blu Ray Disc
 
Applications of java
Applications of javaApplications of java
Applications of java
 
JPC Technologies idea to innovation Presentation
JPC Technologies idea to innovation PresentationJPC Technologies idea to innovation Presentation
JPC Technologies idea to innovation Presentation
 
blue ray ppt
blue ray pptblue ray ppt
blue ray ppt
 
Java tutorial PPT
Java tutorial PPTJava tutorial PPT
Java tutorial PPT
 

Similar to Bd rev 102911

Sales ForecastsFY 2010 Sales Forecast by MonthJanFebMarAprMayJunJu.docx
Sales ForecastsFY 2010 Sales Forecast by MonthJanFebMarAprMayJunJu.docxSales ForecastsFY 2010 Sales Forecast by MonthJanFebMarAprMayJunJu.docx
Sales ForecastsFY 2010 Sales Forecast by MonthJanFebMarAprMayJunJu.docxagnesdcarey33086
 
Spotlight on Media & Entertainment: Box Office Trends
Spotlight on Media & Entertainment: Box Office TrendsSpotlight on Media & Entertainment: Box Office Trends
Spotlight on Media & Entertainment: Box Office TrendsL.E.K. Consulting
 
Cipher car dealership media kit
Cipher car dealership media kitCipher car dealership media kit
Cipher car dealership media kitMikey Jukes
 
Ok Budget Outlook Nov09
Ok Budget Outlook Nov09Ok Budget Outlook Nov09
Ok Budget Outlook Nov09Jack Bewley
 
Organizational overview
Organizational overviewOrganizational overview
Organizational overviewjgrandy99
 
Presentation: Dr Yun - Charlotte
Presentation: Dr Yun - CharlottePresentation: Dr Yun - Charlotte
Presentation: Dr Yun - Charlottehelenadamsadmin
 
Shinjo seminar 0721
Shinjo seminar 0721Shinjo seminar 0721
Shinjo seminar 0721Koji Shinjo
 
Why monsters matter. (Quo Vadis 2012)
Why monsters matter. (Quo Vadis 2012)Why monsters matter. (Quo Vadis 2012)
Why monsters matter. (Quo Vadis 2012)Wooga
 
The new era_of_printing_and_publishing
The new era_of_printing_and_publishingThe new era_of_printing_and_publishing
The new era_of_printing_and_publishingQuestexConf
 

Similar to Bd rev 102911 (9)

Sales ForecastsFY 2010 Sales Forecast by MonthJanFebMarAprMayJunJu.docx
Sales ForecastsFY 2010 Sales Forecast by MonthJanFebMarAprMayJunJu.docxSales ForecastsFY 2010 Sales Forecast by MonthJanFebMarAprMayJunJu.docx
Sales ForecastsFY 2010 Sales Forecast by MonthJanFebMarAprMayJunJu.docx
 
Spotlight on Media & Entertainment: Box Office Trends
Spotlight on Media & Entertainment: Box Office TrendsSpotlight on Media & Entertainment: Box Office Trends
Spotlight on Media & Entertainment: Box Office Trends
 
Cipher car dealership media kit
Cipher car dealership media kitCipher car dealership media kit
Cipher car dealership media kit
 
Ok Budget Outlook Nov09
Ok Budget Outlook Nov09Ok Budget Outlook Nov09
Ok Budget Outlook Nov09
 
Organizational overview
Organizational overviewOrganizational overview
Organizational overview
 
Presentation: Dr Yun - Charlotte
Presentation: Dr Yun - CharlottePresentation: Dr Yun - Charlotte
Presentation: Dr Yun - Charlotte
 
Shinjo seminar 0721
Shinjo seminar 0721Shinjo seminar 0721
Shinjo seminar 0721
 
Why monsters matter. (Quo Vadis 2012)
Why monsters matter. (Quo Vadis 2012)Why monsters matter. (Quo Vadis 2012)
Why monsters matter. (Quo Vadis 2012)
 
The new era_of_printing_and_publishing
The new era_of_printing_and_publishingThe new era_of_printing_and_publishing
The new era_of_printing_and_publishing
 

Recently uploaded

Call Girls Jodhpur Park - [ Cash on Delivery ] Contact 8250192130 Escorts Ser...
Call Girls Jodhpur Park - [ Cash on Delivery ] Contact 8250192130 Escorts Ser...Call Girls Jodhpur Park - [ Cash on Delivery ] Contact 8250192130 Escorts Ser...
Call Girls Jodhpur Park - [ Cash on Delivery ] Contact 8250192130 Escorts Ser...Riya Pathan
 
College Call Girls New Alipore - For 7001035870 Cheap & Best with original Ph...
College Call Girls New Alipore - For 7001035870 Cheap & Best with original Ph...College Call Girls New Alipore - For 7001035870 Cheap & Best with original Ph...
College Call Girls New Alipore - For 7001035870 Cheap & Best with original Ph...anamikaraghav4
 
Kolkata Call Girl Howrah 👉 8250192130 ❣️💯 Available With Room 24×7
Kolkata Call Girl Howrah 👉 8250192130 ❣️💯 Available With Room 24×7Kolkata Call Girl Howrah 👉 8250192130 ❣️💯 Available With Room 24×7
Kolkata Call Girl Howrah 👉 8250192130 ❣️💯 Available With Room 24×7Riya Pathan
 
Call Girls Service Bantala - Call 8250192130 Rs-3500 with A/C Room Cash on De...
Call Girls Service Bantala - Call 8250192130 Rs-3500 with A/C Room Cash on De...Call Girls Service Bantala - Call 8250192130 Rs-3500 with A/C Room Cash on De...
Call Girls Service Bantala - Call 8250192130 Rs-3500 with A/C Room Cash on De...anamikaraghav4
 
↑Top Model (Kolkata) Call Girls Behala ⟟ 8250192130 ⟟ High Class Call Girl In...
↑Top Model (Kolkata) Call Girls Behala ⟟ 8250192130 ⟟ High Class Call Girl In...↑Top Model (Kolkata) Call Girls Behala ⟟ 8250192130 ⟟ High Class Call Girl In...
↑Top Model (Kolkata) Call Girls Behala ⟟ 8250192130 ⟟ High Class Call Girl In...noor ahmed
 
GV'S 24 CLUB & BAR CONTACT 09602870969 CALL GIRLS IN UDAIPUR ESCORT SERVICE
GV'S 24 CLUB & BAR CONTACT 09602870969 CALL GIRLS IN UDAIPUR ESCORT SERVICEGV'S 24 CLUB & BAR CONTACT 09602870969 CALL GIRLS IN UDAIPUR ESCORT SERVICE
GV'S 24 CLUB & BAR CONTACT 09602870969 CALL GIRLS IN UDAIPUR ESCORT SERVICEApsara Of India
 
Beyond Bar & Club Udaipur CaLL GiRLS 09602870969
Beyond Bar & Club Udaipur CaLL GiRLS 09602870969Beyond Bar & Club Udaipur CaLL GiRLS 09602870969
Beyond Bar & Club Udaipur CaLL GiRLS 09602870969Apsara Of India
 
Nayabad Call Girls ✔ 8005736733 ✔ Hot Model With Sexy Bhabi Ready For Sex At ...
Nayabad Call Girls ✔ 8005736733 ✔ Hot Model With Sexy Bhabi Ready For Sex At ...Nayabad Call Girls ✔ 8005736733 ✔ Hot Model With Sexy Bhabi Ready For Sex At ...
Nayabad Call Girls ✔ 8005736733 ✔ Hot Model With Sexy Bhabi Ready For Sex At ...aamir
 
Low Rate Call Girls Gulbarga Anika 8250192130 Independent Escort Service Gulb...
Low Rate Call Girls Gulbarga Anika 8250192130 Independent Escort Service Gulb...Low Rate Call Girls Gulbarga Anika 8250192130 Independent Escort Service Gulb...
Low Rate Call Girls Gulbarga Anika 8250192130 Independent Escort Service Gulb...Riya Pathan
 
Housewife Call Girls Sonagachi - 8250192130 Booking and charges genuine rate ...
Housewife Call Girls Sonagachi - 8250192130 Booking and charges genuine rate ...Housewife Call Girls Sonagachi - 8250192130 Booking and charges genuine rate ...
Housewife Call Girls Sonagachi - 8250192130 Booking and charges genuine rate ...Riya Pathan
 
Private Call Girls Durgapur - 8250192130 Escorts Service with Real Photos and...
Private Call Girls Durgapur - 8250192130 Escorts Service with Real Photos and...Private Call Girls Durgapur - 8250192130 Escorts Service with Real Photos and...
Private Call Girls Durgapur - 8250192130 Escorts Service with Real Photos and...Riya Pathan
 
College Call Girl in Rajiv Chowk Delhi 9634446618 Short 1500 Night 6000 Best ...
College Call Girl in Rajiv Chowk Delhi 9634446618 Short 1500 Night 6000 Best ...College Call Girl in Rajiv Chowk Delhi 9634446618 Short 1500 Night 6000 Best ...
College Call Girl in Rajiv Chowk Delhi 9634446618 Short 1500 Night 6000 Best ...perfect solution
 
Independent Hatiara Escorts ✔ 8250192130 ✔ Full Night With Room Online Bookin...
Independent Hatiara Escorts ✔ 8250192130 ✔ Full Night With Room Online Bookin...Independent Hatiara Escorts ✔ 8250192130 ✔ Full Night With Room Online Bookin...
Independent Hatiara Escorts ✔ 8250192130 ✔ Full Night With Room Online Bookin...Riya Pathan
 
Verified Call Girls Esplanade - [ Cash on Delivery ] Contact 8250192130 Escor...
Verified Call Girls Esplanade - [ Cash on Delivery ] Contact 8250192130 Escor...Verified Call Girls Esplanade - [ Cash on Delivery ] Contact 8250192130 Escor...
Verified Call Girls Esplanade - [ Cash on Delivery ] Contact 8250192130 Escor...anamikaraghav4
 
Book Call Girls in Panchpota - 8250192130 | 24x7 Service Available Near Me
Book Call Girls in Panchpota - 8250192130 | 24x7 Service Available Near MeBook Call Girls in Panchpota - 8250192130 | 24x7 Service Available Near Me
Book Call Girls in Panchpota - 8250192130 | 24x7 Service Available Near Meanamikaraghav4
 
VIP Call Girls Sonagachi - 8250192130 Escorts Service 50% Off with Cash ON De...
VIP Call Girls Sonagachi - 8250192130 Escorts Service 50% Off with Cash ON De...VIP Call Girls Sonagachi - 8250192130 Escorts Service 50% Off with Cash ON De...
VIP Call Girls Sonagachi - 8250192130 Escorts Service 50% Off with Cash ON De...anamikaraghav4
 
(Dipika) Call Girls in Bangur ! 8250192130 ₹2999 Only and Free Hotel Delivery...
(Dipika) Call Girls in Bangur ! 8250192130 ₹2999 Only and Free Hotel Delivery...(Dipika) Call Girls in Bangur ! 8250192130 ₹2999 Only and Free Hotel Delivery...
(Dipika) Call Girls in Bangur ! 8250192130 ₹2999 Only and Free Hotel Delivery...Riya Pathan
 
Call Girls in Barasat | 7001035870 At Low Cost Cash Payment Booking
Call Girls in Barasat | 7001035870 At Low Cost Cash Payment BookingCall Girls in Barasat | 7001035870 At Low Cost Cash Payment Booking
Call Girls in Barasat | 7001035870 At Low Cost Cash Payment Bookingnoor ahmed
 
Air-Hostess Call Girls Shobhabazar | 8250192130 At Low Cost Cash Payment Booking
Air-Hostess Call Girls Shobhabazar | 8250192130 At Low Cost Cash Payment BookingAir-Hostess Call Girls Shobhabazar | 8250192130 At Low Cost Cash Payment Booking
Air-Hostess Call Girls Shobhabazar | 8250192130 At Low Cost Cash Payment BookingRiya Pathan
 
↑Top Model (Kolkata) Call Girls Sonagachi ⟟ 8250192130 ⟟ High Class Call Girl...
↑Top Model (Kolkata) Call Girls Sonagachi ⟟ 8250192130 ⟟ High Class Call Girl...↑Top Model (Kolkata) Call Girls Sonagachi ⟟ 8250192130 ⟟ High Class Call Girl...
↑Top Model (Kolkata) Call Girls Sonagachi ⟟ 8250192130 ⟟ High Class Call Girl...noor ahmed
 

Recently uploaded (20)

Call Girls Jodhpur Park - [ Cash on Delivery ] Contact 8250192130 Escorts Ser...
Call Girls Jodhpur Park - [ Cash on Delivery ] Contact 8250192130 Escorts Ser...Call Girls Jodhpur Park - [ Cash on Delivery ] Contact 8250192130 Escorts Ser...
Call Girls Jodhpur Park - [ Cash on Delivery ] Contact 8250192130 Escorts Ser...
 
College Call Girls New Alipore - For 7001035870 Cheap & Best with original Ph...
College Call Girls New Alipore - For 7001035870 Cheap & Best with original Ph...College Call Girls New Alipore - For 7001035870 Cheap & Best with original Ph...
College Call Girls New Alipore - For 7001035870 Cheap & Best with original Ph...
 
Kolkata Call Girl Howrah 👉 8250192130 ❣️💯 Available With Room 24×7
Kolkata Call Girl Howrah 👉 8250192130 ❣️💯 Available With Room 24×7Kolkata Call Girl Howrah 👉 8250192130 ❣️💯 Available With Room 24×7
Kolkata Call Girl Howrah 👉 8250192130 ❣️💯 Available With Room 24×7
 
Call Girls Service Bantala - Call 8250192130 Rs-3500 with A/C Room Cash on De...
Call Girls Service Bantala - Call 8250192130 Rs-3500 with A/C Room Cash on De...Call Girls Service Bantala - Call 8250192130 Rs-3500 with A/C Room Cash on De...
Call Girls Service Bantala - Call 8250192130 Rs-3500 with A/C Room Cash on De...
 
↑Top Model (Kolkata) Call Girls Behala ⟟ 8250192130 ⟟ High Class Call Girl In...
↑Top Model (Kolkata) Call Girls Behala ⟟ 8250192130 ⟟ High Class Call Girl In...↑Top Model (Kolkata) Call Girls Behala ⟟ 8250192130 ⟟ High Class Call Girl In...
↑Top Model (Kolkata) Call Girls Behala ⟟ 8250192130 ⟟ High Class Call Girl In...
 
GV'S 24 CLUB & BAR CONTACT 09602870969 CALL GIRLS IN UDAIPUR ESCORT SERVICE
GV'S 24 CLUB & BAR CONTACT 09602870969 CALL GIRLS IN UDAIPUR ESCORT SERVICEGV'S 24 CLUB & BAR CONTACT 09602870969 CALL GIRLS IN UDAIPUR ESCORT SERVICE
GV'S 24 CLUB & BAR CONTACT 09602870969 CALL GIRLS IN UDAIPUR ESCORT SERVICE
 
Beyond Bar & Club Udaipur CaLL GiRLS 09602870969
Beyond Bar & Club Udaipur CaLL GiRLS 09602870969Beyond Bar & Club Udaipur CaLL GiRLS 09602870969
Beyond Bar & Club Udaipur CaLL GiRLS 09602870969
 
Nayabad Call Girls ✔ 8005736733 ✔ Hot Model With Sexy Bhabi Ready For Sex At ...
Nayabad Call Girls ✔ 8005736733 ✔ Hot Model With Sexy Bhabi Ready For Sex At ...Nayabad Call Girls ✔ 8005736733 ✔ Hot Model With Sexy Bhabi Ready For Sex At ...
Nayabad Call Girls ✔ 8005736733 ✔ Hot Model With Sexy Bhabi Ready For Sex At ...
 
Low Rate Call Girls Gulbarga Anika 8250192130 Independent Escort Service Gulb...
Low Rate Call Girls Gulbarga Anika 8250192130 Independent Escort Service Gulb...Low Rate Call Girls Gulbarga Anika 8250192130 Independent Escort Service Gulb...
Low Rate Call Girls Gulbarga Anika 8250192130 Independent Escort Service Gulb...
 
Housewife Call Girls Sonagachi - 8250192130 Booking and charges genuine rate ...
Housewife Call Girls Sonagachi - 8250192130 Booking and charges genuine rate ...Housewife Call Girls Sonagachi - 8250192130 Booking and charges genuine rate ...
Housewife Call Girls Sonagachi - 8250192130 Booking and charges genuine rate ...
 
Private Call Girls Durgapur - 8250192130 Escorts Service with Real Photos and...
Private Call Girls Durgapur - 8250192130 Escorts Service with Real Photos and...Private Call Girls Durgapur - 8250192130 Escorts Service with Real Photos and...
Private Call Girls Durgapur - 8250192130 Escorts Service with Real Photos and...
 
College Call Girl in Rajiv Chowk Delhi 9634446618 Short 1500 Night 6000 Best ...
College Call Girl in Rajiv Chowk Delhi 9634446618 Short 1500 Night 6000 Best ...College Call Girl in Rajiv Chowk Delhi 9634446618 Short 1500 Night 6000 Best ...
College Call Girl in Rajiv Chowk Delhi 9634446618 Short 1500 Night 6000 Best ...
 
Independent Hatiara Escorts ✔ 8250192130 ✔ Full Night With Room Online Bookin...
Independent Hatiara Escorts ✔ 8250192130 ✔ Full Night With Room Online Bookin...Independent Hatiara Escorts ✔ 8250192130 ✔ Full Night With Room Online Bookin...
Independent Hatiara Escorts ✔ 8250192130 ✔ Full Night With Room Online Bookin...
 
Verified Call Girls Esplanade - [ Cash on Delivery ] Contact 8250192130 Escor...
Verified Call Girls Esplanade - [ Cash on Delivery ] Contact 8250192130 Escor...Verified Call Girls Esplanade - [ Cash on Delivery ] Contact 8250192130 Escor...
Verified Call Girls Esplanade - [ Cash on Delivery ] Contact 8250192130 Escor...
 
Book Call Girls in Panchpota - 8250192130 | 24x7 Service Available Near Me
Book Call Girls in Panchpota - 8250192130 | 24x7 Service Available Near MeBook Call Girls in Panchpota - 8250192130 | 24x7 Service Available Near Me
Book Call Girls in Panchpota - 8250192130 | 24x7 Service Available Near Me
 
VIP Call Girls Sonagachi - 8250192130 Escorts Service 50% Off with Cash ON De...
VIP Call Girls Sonagachi - 8250192130 Escorts Service 50% Off with Cash ON De...VIP Call Girls Sonagachi - 8250192130 Escorts Service 50% Off with Cash ON De...
VIP Call Girls Sonagachi - 8250192130 Escorts Service 50% Off with Cash ON De...
 
(Dipika) Call Girls in Bangur ! 8250192130 ₹2999 Only and Free Hotel Delivery...
(Dipika) Call Girls in Bangur ! 8250192130 ₹2999 Only and Free Hotel Delivery...(Dipika) Call Girls in Bangur ! 8250192130 ₹2999 Only and Free Hotel Delivery...
(Dipika) Call Girls in Bangur ! 8250192130 ₹2999 Only and Free Hotel Delivery...
 
Call Girls in Barasat | 7001035870 At Low Cost Cash Payment Booking
Call Girls in Barasat | 7001035870 At Low Cost Cash Payment BookingCall Girls in Barasat | 7001035870 At Low Cost Cash Payment Booking
Call Girls in Barasat | 7001035870 At Low Cost Cash Payment Booking
 
Air-Hostess Call Girls Shobhabazar | 8250192130 At Low Cost Cash Payment Booking
Air-Hostess Call Girls Shobhabazar | 8250192130 At Low Cost Cash Payment BookingAir-Hostess Call Girls Shobhabazar | 8250192130 At Low Cost Cash Payment Booking
Air-Hostess Call Girls Shobhabazar | 8250192130 At Low Cost Cash Payment Booking
 
↑Top Model (Kolkata) Call Girls Sonagachi ⟟ 8250192130 ⟟ High Class Call Girl...
↑Top Model (Kolkata) Call Girls Sonagachi ⟟ 8250192130 ⟟ High Class Call Girl...↑Top Model (Kolkata) Call Girls Sonagachi ⟟ 8250192130 ⟟ High Class Call Girl...
↑Top Model (Kolkata) Call Girls Sonagachi ⟟ 8250192130 ⟟ High Class Call Girl...
 

Bd rev 102911

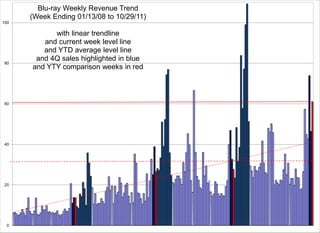
  • 1. Blu-ray Weekly Revenue Trend (Week Ending 01/13/08 to 10/29/11) 100 with linear trendline and current week level line and YTD average level line and 4Q sales highlighted in blue 80 and YTY comparison weeks in red 60 40 20 0
  • 2. 20 40 60 80 0 100 J-08 F-08 M-08 A-08 M-08 J-08 J-08 A-08 S-08 O-08 N-08 D-08 J-09 F-09 M-09 A-09 M-09 J-09 J-09 A-09 S-09 O-09 N-09 D-09 J-10 F-10 M-10 A-10 M-10 J-10 J-10 A-10 S-10 O-10 N-10 D-10 Blu-ray Weekly Revenue Trend ($M) (week ending 1/06/08 thru 10/29/11) J-11 F-11 M-11 A-11 M-11 J-11 J-11 A-11 S-11 O-11
  • 3. Blu-ray Revenue Trend 4 per. Mov. Avg. (Blu-ray Revenue Trend) 100 80 60 40 20 0 J F M A M J J A S O N D J F M A M J J A S O N D J F M A M J J A S O N D J F M A M J J A S O … … … … … … … … … … … … … … … … … … … … … … … … … … … … … … … … … … … … … … … … … … … … … …
  • 4. Blu-ray Revenues 2011 vs 2010 by matching YTY weeks HMM ($M) 2011 2010 $100 $80 $60 $40 $20 $0 1 2 3 4 5 6 7 8 9 10 11 12 13 14 15 16 17 18 19 20 21 22 23 24 25 26 27 28 29 30 31 32 33 34 35 36 37 38 39 40 41 42 43 44 45 46 47 48 49 50 51 52
  • 5. Blu-ray Revenues (Matched Weeks 2008 2009 2010 2011 ) $ M 100 2008 Blu-ray 2009 Blu-ray 2010 Blu-ray 2011 Blu-ray 80 60 40 20 0 January February March April May June July August September October November December
  • 6. 1200 Blu-ray Quarterly Revenue Trend 2008 - 2011 (as of 10/29/11) Cumulative Weekly HMM Published Data 1000 Even 7 Day Mon-Sun Reporting Weeks x 13 Even 7 day Sun - Sat Reporting Week starting 12/18/10 800 600 4Q Week 400 4/13 200 0
  • 7. 1Q 2011 vs 1Q 2010 by matching YTY weeks ($ M) 1Q 2011 1Q 2010 $100 $80 $60 $40 $20 $0 1 2 3 4 5 6 7 8 9 10 11 12 13
  • 8. 2Q 2011 vs 2Q 2010 by matching YTY weeks ($ M) 2Q 2011 2Q 2010 $100 $80 $60 $40 $20 $0 1 2 3 4 5 6 7 8 9 10 11 12 13
  • 9. 3Q 2011 vs 3Q 2010 by matching YTY weeks ($ M) 3Q 2011 3Q 2010 $100 $80 $60 $40 $20 $0 1 2 3 4 5 6 7 8 9 10 11 12 13
  • 10. 4Q 2011 vs 4Q 2010 by matching YTY weeks ($ M) 4Q 2011 4Q 2010 $100 $80 $60 $40 $20 $0 1 2 3 4 5 6 7 8 9 10 11 12 13
  • 11.
  • 12. 1Q 2011 vs 1Q 2010 sorted by relative quarterly revenue performance ($ M) 1Q 2011 1Q 2010 $100 $80 $60 $40 $20 $0
  • 13. 2Q 2011 vs 2Q 2010 sorted by relative quarterly revenue performance ($ M) 2Q 2011 2Q 2010 $100 $80 $60 $40 $20 $0
  • 14. 3Q 2011 vs 3Q 2010 sorted by relative quarterly revenue performance ($ M) 3Q 2011 3Q 2010 $100 $80 $60 $40 $20 $0
  • 15. 4Q 2011 vs 4Q 2010 sorted by relative quarterly revenue performance ($ M) 4Q 2011 4Q 2010 $100 $80 $60 $40 $20 $0
  • 16.
  • 17. 200.00% Blu-ray YTY Change DVD YTY Change Total DVD+BD Change from Previous Year Matching Weeks 150.00% 100.00% 50.00% 0.00% -50.00% 8-Jan 22-Jan 5-Feb 19-Feb 5-Mar 19-Mar 2-Apr 16-Apr 30-Apr 14-May 28-May 11-Jun 25-Jun 9-Jul 23-Jul 6-Aug 20-Aug 3-Sep 17-Sep 1-Oct 15-Oct 29-Oct
  • 18. Blu-ray YTY Change DVD YTY Change Total DVD+BD Change from Previous Year Matching Weeks 90.00% 70.00% 50.00% 30.00% 10.00% -10.00% -30.00% -50.00% 8-Jan 22-Jan 5-Feb 19-Feb 5-Mar 19-Mar 2-Apr 16-Apr 30-Apr 14-May 28-May 11-Jun 25-Jun 9-Jul 23-Jul 6-Aug 20-Aug 3-Sep 17-Sep 1-Oct 15-Oct 29-Oct
  • 19. 30% Blu-ray 2011 Cumulative YTD YoY Gain Trend 25% 20% 15% 10% 5% 0% 8-Jan 22-Jan 5-Feb 19-Feb 5-Mar 19-Mar 2-Apr 16-Apr 30-Apr 14-May 28-May 11-Jun 25-Jun 9-Jul 23-Jul 6-Aug 20-Aug 3-Sep 17-Sep 1-Oct 15-Oct 29-O
  • 20. -10% J-11 J-11 F-11 F-11 M-11 M-11 A-11 A-11 A-11 M-11 M-11 J-11 J-11 J-11 J-11 A-11 A-11 S-11 S-11 O-11 O-11 O-1 DVD+Blu-ray (OD) 2011 Cumulative YTD YoY Gain Trend -12% -14% -16% -18% -20% -22%
  • 21. 30% Blu-ray and OD 2011 Cumulative YTD YoY Gain Trend 20% 10% 0% 8-Jan 22-Jan 5-Feb 19-Feb 5-Mar 19-Mar 2-Apr 16-Apr 30-Apr 14-May 28-May 11-Jun 25-Jun 9-Jul 23-Jul 6-Aug 20-Aug 3-Sep 17-Sep 1-Oct 15-Oct 29-O -10% -20% Cumulative YTD Blu-ray YoY Gain OD YTD Cumulative YoY Gain -30%
  • 22.
  • 23.
  • 24. 800 HMM Reported DVD and Blu-ray Revenue Sales Trends 700 600 500 400 300 200 100 0
  • 25. 700 Blu-ray and DVD Revenues Full Year (Matched Weeks 2008 2009 2010 2011) 600 2008 DVD 2009 DVD 2008 Blu-ray 2009 Blu-ray 2010 DVD 2010 Blu-ray 2010 DVD+BD 2009 DVD+BD 2011 DVD 2011 Blu-ray 2011 Blu-ray+DVD 500 400 300 200 100 0 1 2 3 4 5 6 7 8 9 10 11 12 13 14 15 16 17 18 19 20 21 22 23 24 25 26 27 28 29 30 31 32 33 34 35 36 37 38 39 40 41 42 43 44 45 46 47 48 49 50 51 52
  • 26. 700 HMM reported DVD and Blu-ray Revenue Sales Trends 600 500 400 300 200 100 0
  • 27. 700 DVD Revenues Blu-ray Revenues ($M) (overlaid & non stacked) 600 500 400 300 200 100 0 J-08 F-08M-08 A-08M-08 J-08 J-08 A-08 S-08O-08 N-08 D-08 J-09 F-09M-09 A-09M-09 J-09 J-09 A-09 S-09O-09 N-09D-09 J-10 F-10M-10 A-10M-10 J-10 J-10 A-10 S-10O-10 N-10D-10 J-11 F-11M-11 A-11M-11 J-11 J-11 A-11 S-11O-11
  • 28. 700 DVD Revenues (stacked on top of Blu-ray) Blu-ray Revenues (stacked under DVD) 600 500 400 300 200 100 0 J F M A M J J A S O N D J F M A M J J A S O N D J F M A M J J A S O N D J F M A M J J A S O
  • 29. 700 Blu-ray Revenues DVD Revenues 600 500 400 300 200 100 0 J-08F-08M-08A-08M-08J-08J-08A-08S-08O-08N-08D-08J-09F-09 M-09A-09M-09J-09J-09A-09S-09O-09N-09D-09J-10F-10 M-10A-10M-10J-10J-10A-10S-10O-10N-10D-10J-11F-11 M-11A-11M-11J-11J-11A-11S-11O-11
  • 30. 700 Blu-ray Revenues DVD Revenues DVD+BD Revenues 600 500 400 300 200 100 0 J-08F-08M-08A-08M-08J-08J-08A-08S-08O-08N-08D-08J-09F-09 M-09A-09M-09J-09J-09A-09S-09O-09N-09D-09J-10F-10 M-10A-10M-10J-10J-10A-10S-10O-10N-10D-10J-11F-11 M-11A-11M-11J-11J-11A-11S-11O-11
  • 31.
  • 32. 1800 Cumulative Blu-ray Revenues (Matched Weeks) ($ M) 1600 2008 2009 2010 2011 1400 1200 1000 800 600 400 200 0 1 2 3 4 5 6 7 8 9 10 11 12 13 14 15 16 17 18 19 20 21 22 23 24 25 26 27 28 29 30 31 32 33 34 35 36 37 38 39 40 41 42 43 44 45 46 47 48 49 50 51 52
  • 33. 12000 Cumulative Blu-ray and DVD Revenues (Matched Weeks) 2008 DVD 2009 DVD 2008 Blu-ray 10000 2009 Blu-ray 2010 DVD 2010 Blu-ray 8000 6000 4000 2000 0 1 2 3 4 5 6 7 8 9 10 11 12 13 14 15 16 17 18 19 20 21 22 23 24 25 26 27 28 29 30 31 32 33 34 35 36 37 38 39 40 41 42 43 44 45 46 47 48 49 50 51 52
  • 34. 14000 Cumulative Blu-ray and DVD Revenues (Matched Weeks) 12000 2008 DVD 2008 Blu-ray 2008 DVD+BD 2009 DVD 2009 Blu-ray 2009 DVD+BD 2010 DVD 2010 Blu-ray 10000 8000 6000 4000 2000 0 1 2 3 4 5 6 7 8 9 10 11 12 13 14 15 16 17 18 19 20 21 22 23 24 25 26 27 28 29 30 31 32 33 34 35 36 37 38 39 40 41 42 43 44 45 46 47 48 49 50 51 52
  • 35. 1,700 35,000 Dual Axis Cumulative Blu-ray and DVD Revenues DVD $ M Blu-ray $ M Axis Scale Adjusted to Match DVD and Blu-ray 2008 Seasonal Trend 1,500 (Compares Succesive Blu-ray Seasonal Sales Acceleration Rates to DVD ) 30,000 2008 Blu-ray 2009 Blu-ray 1,300 2010 Blu-ray 2011 Blu-ray 25,000 1,100 2008 DVD 2009 DVD 20,000 900 2010 DVD 2011 DVD 700 15,000 500 10,000 300 5,000 100 -100 0 1 2 3 4 5 6 7 8 9 10 11 12 13 14 15 16 17 18 19 20 21 22 23 24 25 26 27 28 29 30 31 32 33 34 35 36 37 38 39 40 41 42 43 44 45 46 47 48 49 50 51 52
  • 36. 5000 Cumulative Blu-ray Sell Through Revenues $M 4500 4000 3500 3000 2500 2000 1500 1000 500 0 J-08 M-08 M-08 J-08 S-08 N-08 J-09 M-09 M-09 J-09 S-09 N-09 J-10 M-10 M-10 J-10 S-10 N-10 J-11 M-11 M-11 J-11 S-11
  • 37.
  • 38. 40% Blu-ray Revenue Marketshare by Quarter 2008-2011 (HMM published data (weighted average per quarter) 35% 30% 25% 20% 15% 10% 5% 0% E1Q E2Q E3Q E4Q E1Q E2Q E3Q E4Q E1Q E2Q E3Q 4QTD E1Q E2Q E3Q 4QTD 2008 2008 2008 2008 2009 2009 2009 2009 2010 2010 2010 2010 2011 2011 2011 2011
  • 39. 60% Blu-ray Top 20 Sellers Unit Marketshare by Quarter 2008-2011 (HMM published data (non weighted average) 50% 40% 30% 20% 10% 0% E1Q E2Q E3Q E4Q E1Q E2Q E3Q E4Q E1Q E2Q E3Q 4QTD E1Q E2Q E3Q 4QTD 2008 2008 2008 2008 2009 2009 2009 2009 2010 2010 2010 2010 2011 2011 2011 2011
  • 40. 40% Blu-ray Revenue Market Share (BD/(BD+DVD) REVENUE) 35% 30% 25% 20% 15% 10% 5% 0% J-08F-08M-08A-08M-08J-08J-08A-08S-08O-08N-08D-08J-09F-09 M-09A-09M-09J-09J-09A-09S-09O-09N-09D-09J-10F-10 M-10A-10M-10J-10J-10A-10S-10O-10N-10D-10J-11F-11 M-11A-11M-11J-11J-11A-11S-11O-11
  • 41. 40% Blu-Ray Revenue Share Percentage (BD / (BD+DVD)) 35% 30% 25% 20% 15% 10% 5% 2008 2009 2010 2011 0% 1 2 3 4 5 6 7 8 9 10 11 12 13 14 15 16 17 18 19 20 21 22 23 24 25 26 27 28 29 30 31 32 33 34 35 36 37 38 39 40 41 42 43 44 45 46 47 48 49 50 51 52
  • 42. BD Top 20 Sellers Unit % - Blu-ray Unit Marketshare 60% of All Titles on Top 20 Sellers Chart 50% 40% 30% 20% 10% 0% J-08 F-08M-08 A-08 M-08 J-08 J-08 A-08 S-08 O-08 N-08 D-08 J-09 F-09M-09 A-09 M-09 J-09 J-09 A-09 S-09 O-09 N-09 D-09 J-10 F-10M-10 A-10 M-10 J-10 J-10 A-10 S-10 O-10 N-10 D-10 J-11 F-11M-11 A-11 M-11 J-11 J-11 A-11 S-11 O-11
  • 43. BD Top 20 Sellers Unit % - Blu-ray Unit Marketshare Of All Titles on Top 20 Sellers List - YTY Comparison 65% 60% 55% 50% 45% 40% 35% 30% 25% 20% 15% 10% 5% Top 20 Sellers 2010 BD Unit% Top 20 Sellers 2009 BD% After 7/19/09 Total Market Blu-ray Unit Marketshare % Top 20 Sellers BD% 2011 0% 1 2 3 4 5 6 7 8 9 10 11 12 13 14 15 16 17 18 19 20 21 22 23 24 25 26 27 28 29 30 31 32 33 34 35 36 37 38 39 40 41 42 43 44 45 46 47 48 49 50 51 52
  • 44. 100% DVD and Blu-ray Format Revenue Share by Week Blu-ray Contribution DVD Contribution Source: Nielsen Videoscan first alert and Home Media Magazine Research 90% 80% 70% 60% 50% 40% 30% 20% 10% 0% J-08 M-08 M-08 J-08 S-08 N-08 J-09 M-09 M-09 J-09 S-09 N-09 J-10 M-10 M-10 J-10 S-10 N-10 J-11 M-11 M-11 J-11 S-11
  • 45. 100% DVD and Blu-ray Format Nielsen Videoscan Top 20 Unit Share by Week Blu-ray Contribution DVD Contribution Source: Nielsen Videoscan first alert and Home Media Magazine Research 90% 80% 70% 60% 50% 40% 30% 20% 10% 0% J-08 M-08 M-08 J-08 S-08 N-08 J-09 M-09 M-09 J-09 S-09 N-09 J-10 M-10 M-10 J-10 S-10 N-10 J-11 M-11 M-11 J-11 S-11
  • 46. 0% 10% 20% 40% 50% 60% 70% 30% Jan-08 Feb-08 Mar-08 Apr-08 May-08 Jun-08 Jul-08 Aug-08 Sep-08 Oct-08 Nov-08 Dec-08 Jan-09 Feb-09 Mar-09 Apr-09 May-09 Jun-09 Jul-09 Aug-09 Sep-09 2008-2011 Oct-09 Nov-09 Dec-09 Jan-10 Feb-10 Mar-10 Blu-ray Revenue Share (New Pie Chart Since 7/19/09) Apr-10 May-10 Blu-ray Top 20 Sellers Unit % (Old Pie Chart before 7/12/09) Jun-10 Jul-10 Aug-10 Blu-ray Revenue vs Top 20 Sellers Unit Marketshare Growth Sep-10 Oct-10 Nov-10 Dec-10 Jan-11 Feb-11 Mar-11 Apr-11 May-11 Jun-11 Jul-11 Aug-11 Sep-11 Oct-11
  • 47. 70% Blu-ray Revenue vs Top 20 Sellers Unit Marketshare Growth 2009-2011 60% 50% 40% 30% 20% 10% Blu-ray Revenue Share Blu-ray Top 20 Sellers Unit Marketshare % 0% Jan-09 Mar-09 May-09 Jul-09 Sep-09 Nov-09 Jan-10 Mar-10 May-10 Jul-10 Sep-10 Nov-10 Jan-11 Mar-11 May-11 Jul-11 Sep-11 Nov-11
  • 48. 70% Blu-ray revenue vs Top 20 Sellers Unit Marketshare Growth 2010-2011 60% 50% 40% 30% 20% 10% Blu-ray Revenue Share Blu-ray Top 20 Sellers Unit Marketshare % 0% Jan-10 Feb-10 Mar-10 Apr-10 May-10 Jun-10 Jul-10 Aug-10 Sep-10 Oct-10 Nov-10 Dec-10 Jan-11 Feb-11 Mar-11 Apr-11 May-11 Jun-11 Jul-11 Aug-11 Sep-11 Oct-11
  • 49. 70% Blu-ray revenue vs Top 20 Sellers Unit Marketshare Growth 2011 60% 50% 40% 30% 20% 10% Blu-ray Revenue Share Blu-ray Top 20 Sellers Unit Marketshare % 0%
  • 50.
  • 51. 7,000,000,000 DVD New Release Revenue Trends 2007- 2010 Top 100 DVD Titles The-Numbers 6,000,000,000 5,000,000,000 4,000,000,000 3,000,000,000 2,000,000,000 1,000,000,000 - 2007 2008 2009 2010
  • 52. 7,000,000,000 New Release Revenue Trends 2007 - 2011 80% of Blu-ray Total Sell Through Revenues (HMM) DVD New Release Revenues (Top 100 Titles The-Numbers) 6,000,000,000 5,000,000,000 4,000,000,000 3,000,000,000 2,000,000,000 1,000,000,000 - 2007 2008 2009 2010
  • 53. 7,000,000,000 New Release Revenue Trends 2007- 2011 DVD New Release Revenues (Top 100 Titles The-Numbers) Blu-ray Total Sell Through Revenues (HMM) 6,000,000,000 5,000,000,000 4,000,000,000 3,000,000,000 2,000,000,000 1,000,000,000 - 2007 2008 2009 2010
  • 54.
  • 55. 7,000,000,000 DVD New Release Revenue Trends 2007- 2011 Top 100 DVD Titles (The-Numbers) 6,000,000,000 5,000,000,000 4,000,000,000 3,000,000,000 2,000,000,000 1,000,000,000 - 2007 2008 2009 2010 2011 (Q1-Q3)*2 (Q1-Q3 2011)
  • 56. 7,500,000,000 80% of Blu-ray Revenue Trends 2007 - 2011 (Assumed New Release Revenue Contribution) 6,500,000,000 5,500,000,000 4,500,000,000 3,500,000,000 2,500,000,000 1,500,000,000 500,000,000 2007 2008 2009 2010 2011 (Q1-Q3)*2 (Q1-Q3 2011) (500,000,000)
  • 57. 7,000,000,000 New Release Revenue Trends 2007 - 2011 80% of Blu-ray Total Sell Through Revenues (HMM) DVD New Release Revenues (Top 100 Titles The-Numbers) 6,000,000,000 5,000,000,000 4,000,000,000 3,000,000,000 2,000,000,000 1,000,000,000 - 2007 2008 2009 2010 2011 (Q1-Q3)*2 (Q1-Q3 2011)
  • 58. 7,000,000,000 New Release Revenue Trends 2007 - 2011 DVD New Release Revenues (Top 100 Titles The-Numbers) 80% of Blu-ray Total Sell Through Revenues (HMM) 6,000,000,000 5,000,000,000 4,000,000,000 3,000,000,000 2,000,000,000 1,000,000,000 - 2007 2008 2009 2010 2011 (Q1-Q3)*2 (Q1-Q3 2011)
  • 59.
  • 60. 7,000,000,000 DVD New Release Revenue Trends 2007- 2011 Top 100 DVD Titles The-Numbers 6,000,000,000 5,000,000,000 4,000,000,000 3,000,000,000 2,000,000,000 1,000,000,000 - 2007 2008 2009 2010 2011 (Q1-Q3)*2 (Q1-Q3 2011)
  • 61. 7,000,000,000 Total Blu-ray Sell Through Revenue Trends 2007 - 2011 6,000,000,000 5,000,000,000 4,000,000,000 3,000,000,000 2,000,000,000 1,000,000,000 - 2007 2008 2009 2010 2011 (Q1-Q3)*2 (Q1-Q3 2011)
  • 62. 7,000,000,000 New Release Revenue Trends 2007- 2011 DVD New Release Revenues (Top 100 Titles The-Numbers) Blu-ray Total Sell Through Revenues (HMM) 6,000,000,000 5,000,000,000 4,000,000,000 3,000,000,000 2,000,000,000 1,000,000,000 - 2007 2008 2009 2010 2011 (Q1-Q3)*2 (Q1-Q3 2011)
  • 63. 7,000,000,000 New Release Revenue Trends 2007 - 2011 Blu-ray Total Sell Through Revenues (HMM) DVD New Release Revenues (Top 100 Titles The-Numbers) 6,000,000,000 5,000,000,000 4,000,000,000 3,000,000,000 2,000,000,000 1,000,000,000 - 2007 2008 2009 2010 2011 (Q1-Q3)*2 (Q1-Q3 2011)
  • 64. 800 Blu-ray Quarterly Revenue Trend 2008 - 2011 (as of 10/22/11) 700 Cumulative Weekly HMM Published Data Even 7 Day Mon-Sun Reporting Weeks x 13 Even 7 day Sun - Sat Reporting Week starting 12/18/10 600 500 400 300 4Q Week 3/13 200 100 0
  • 65. 800 Blu-ray Quarterly Revenue Trend 2008 - 2011 (as of 10/22/11) 700 Cumulative Weekly HMM Published Data Even 7 Day Mon-Sun Reporting Weeks x 13 Even 7 day Sun - Sat Reporting Week starting 12/18/10 600 500 400 300 4Q Week 3/13 200 100 0
  • 66. 700 Blu-ray Quarterly Revenue Trend 2008 - 2011 (as of 10/31/11) 600 Rentrak / DEG Data by Quarter 500 400 300 200 100 0