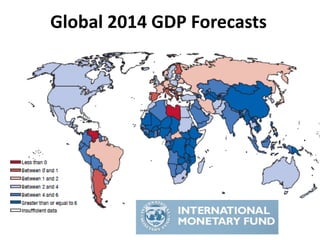
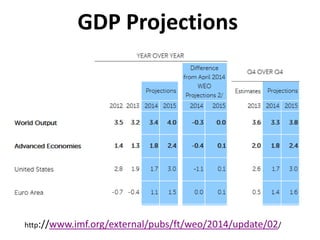
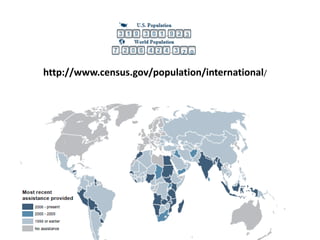
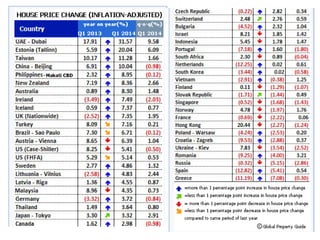
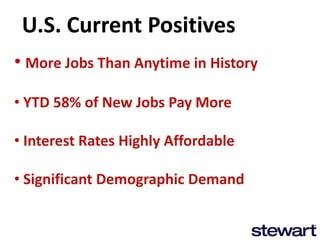
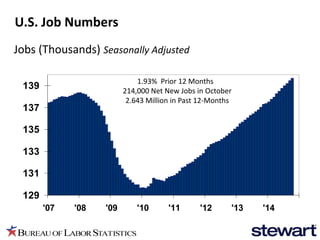
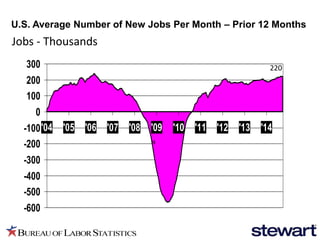
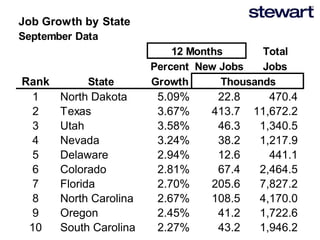
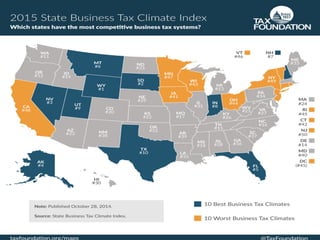
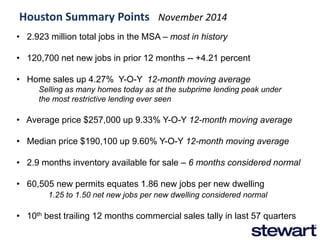
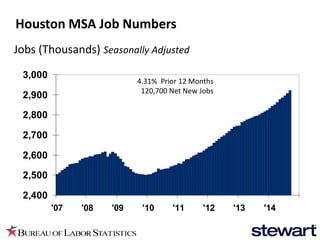
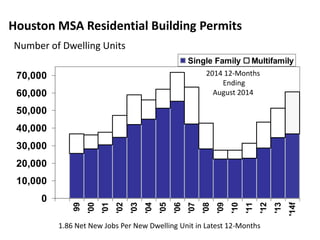
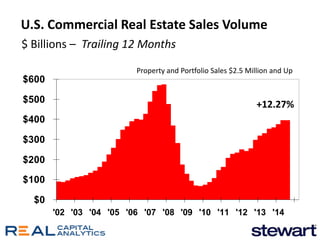
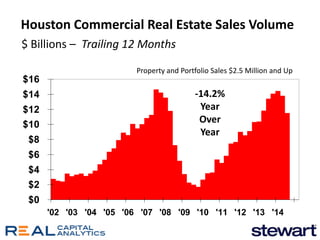
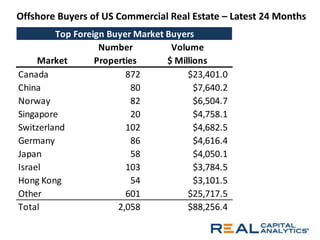
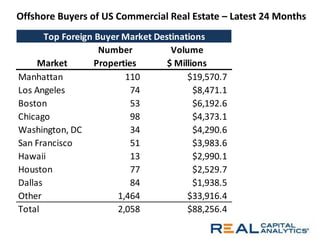
The document discusses global and US economic trends and statistics. It provides GDP forecasts for various countries from the IMF and notes current positive factors in the US economy like job and employment growth. Specific data is given on job growth and numbers in various US states and metro areas like Houston which is shown to be experiencing strong growth in jobs, home sales, prices and construction permits. Charts show trends in economic indicators over time. Offshore buyers of US commercial real estate are also summarized with top countries and destination metro areas.
13. New Zealand Transaction Costs
http://www.globalpropertyguide.com/faq/guide-transaction-costs
14. U.S. Current Positives
• More Jobs Than Anytime in History
• YTD 58% of New Jobs Pay More
• Interest Rates Highly Affordable
• Significant Demographic Demand
15. 129
131
133
135
137
139
'07 '08 '09 '10 '11 '12 '13 '14
Jobs (Thousands) Seasonally Adjusted
1.93% Prior 12 Months
214,000 Net New Jobs in October
2.643 Million in Past 12-Months
U.S. Job Numbers
16. U.S. Average Number of New Jobs Per Month – Prior 12 Months
-600
-500
-400
-300
-200
-100
0
100
200
300
'04 '05 '06 '07 '08 '09 '10 '11 '12 '13 '14
15
Jobs - Thousands
220
17. Job Growth by State
September Data
Total
Percent New Jobs Jobs
Rank State Growth
1 North Dakota 5.09% 22.8 470.4
2 Texas 3.67% 413.7 11,672.2
3 Utah 3.58% 46.3 1,340.5
4 Nevada 3.24% 38.2 1,217.9
5 Delaware 2.94% 12.6 441.1
6 Colorado 2.81% 67.4 2,464.5
7 Florida 2.70% 205.6 7,827.2
8 North Carolina 2.67% 108.5 4,170.0
9 Oregon 2.45% 41.2 1,722.6
10 South Carolina 2.27% 43.2 1,946.2
12 Months
Thousands
18.
19. • 2.923 million total jobs in the MSA – most in history
• 120,700 net new jobs in prior 12 months -- +4.21 percent
• Home sales up 4.27% Y-O-Y 12-month moving average Selling as many homes today as at the subprime lending peak under the most restrictive lending ever seen
• Average price $257,000 up 9.33% Y-O-Y 12-month moving average
• Median price $190,100 up 9.60% Y-O-Y 12-month moving average
• 2.9 months inventory available for sale – 6 months considered normal
• 60,505 new permits equates 1.86 new jobs per new dwelling 1.25 to 1.50 net new jobs per new dwelling considered normal
• 10th best trailing 12 months commercial sales tally in last 57 quarters
Houston Summary Points November 2014
20. 2,400
2,500
2,600
2,700
2,800
2,900
3,000
'07 '08 '09 '10 '11 '12 '13 '14
Jobs (Thousands) Seasonally Adjusted
4.31% Prior 12 Months
120,700 Net New Jobs
Houston MSA Job Numbers
21. Houston Existing Home Prices
$0
$25
$50
$75
$100
$125
$150
$175
$200
$225
'02 '03 '04 '05 '06 '07 '08 '09 '10 '11 '12 '13 '14
Median Price $ Thousands
Houston Association of REALTORS®
22. Houston MSA Residential Building Permits
0
10,000
20,000
30,000
40,000
50,000
60,000
70,000
99
'00
'01
'02
'03
'04
'05
'06
'07
'08
'09
'10
'11
'12
'13
'14f
Single Family Multifamily
Number of Dwelling Units
2014 12-Months
Ending
August 2014
1.86 Net New Jobs Per New Dwelling Unit in Latest 12-Months
23. $0
$100
$200
$300
$400
$500
$600
'02 '03 '04 '05 '06 '07 '08 '09 '10 '11 '12 '13 '14
U.S. Commercial Real Estate Sales Volume
$ Billions – Trailing 12 Months
+12.27%
Property and Portfolio Sales $2.5 Million and Up
24. $0
$2
$4
$6
$8
$10
$12
$14
$16
'02 '03 '04 '05 '06 '07 '08 '09 '10 '11 '12 '13 '14
Houston Commercial Real Estate Sales Volume
$ Billions – Trailing 12 Months
-14.2%
Year
Over
Year
Property and Portfolio Sales $2.5 Million and Up
25. Number Volume
Market Properties $ Millions
Canada 872 $23,401.0
China 80 $7,640.2
Norway 82 $6,504.7
Singapore 20 $4,758.1
Switzerland 102 $4,682.5
Germany 86 $4,616.4
Japan 58 $4,050.1
Israel 103 $3,784.5
Hong Kong 54 $3,101.5
Other 601 $25,717.5
Total 2,058 $88,256.4
Top Foreign Buyer Market Buyers
Offshore Buyers of US Commercial Real Estate – Latest 24 Months
26. Offshore Buyers of US Commercial Real Estate – Latest 24 Months
NumberVolumeMarketProperties$ MillionsManhattan110$19,570.7Los Angeles74$8,471.1Boston53$6,192.6Chicago98$4,373.1Washington, DC34$4,290.6San Francisco51$3,983.6Hawaii13$2,990.1Houston77$2,529.7Dallas84$1,938.5Other1,464$33,916.4Total2,058$88,256.4Top Foreign Buyer Market Destinations
27. Ted C. Jones, PhD Chief Economist
Stewart Title Guaranty Company
1980 Post Oak Blvd., Suite 300
Houston, Texas 77056
United States of America
Email: ted@stewart.com
Office 713.625.8014
Twitter – DrTCJ
blog.stewart.com/ted
stewart.com