SlideShare a Scribd company logo
1 of 5
Download to read offline
Residential Sales Trends
          December 2010
  Price     Number     Original List   Final List   Sold Price    Avg.     Cost Per   Original   Final to     Days on   Pending
($1000s)     Sold         (Avg.)         (Avg.)       (Avg.)     Sq. Ft.    Sq. Ft.   to Sold     Sold        Market     Sales

 $0-$150      80        $124,535       $111,225     $102,803     1,225       $84       83%         92%         133        141

$151-$200     43        $199,883       $183,212     $179,095     1,625      $110       90%         98%         137        87

$201-$250     25        $249,184       $231,635     $222,551     1,865      $119       89%         96%         122        42

$251-$300     16        $314,803       $286,309     $278,094     1,969      $141       88%         97%         198        30

$301-$350     7         $408,343       $343,771     $326,714     2,455      $133       80%         95%         143        25

$351-$400     4         $389,225       $386,225     $367,063     2,521      $146       94%         95%          111       12

$401-$450     3         $443,667       $443,667     $432,333     2,302      $188       97%         97%          66         6

$451-$500     7         $525,257       $510,257     $478,007     3,641      $131       91%         94%          115        6

$651-$700     2         $823,500       $749,000     $682,000     3,663      $186       83%         91%         231         1

$701-$750     2         $772,500       $762,500     $737,500     3,660      $201       95%         97%         360         0

$851-$900     1         $874,900       $874,900     $874,900     7,100      $123       100%       100%          49         0

TOTAL        190                                                                                                          353


                     Results compiled from Shasta County MLS on 1/6/11, deemed reliable but not guaranteed.
Listing to Sales Comparison
      December 2010
                        Price       Number         Active        % of           % of        Absorption
                      ($1000s)       Sold         Listings       Sold*       Listings**       Rate

                      $0-$150          80           370          42.1%         28.7%        4.6 months

                     $151-$200         43           262          22.6%         20.3%        6.1 months

                     $201-$250         25           173          13.2%         13.4%        6.9 months

                     $251-$300         16           151           8.4%         11.7%        9.4 months

                     $301-$350          7            86           3.7%         6.7%        12.2 months

                     $351-$400          4            70           2.1%         5.4%        17.5 months

                     $401-$450          3            40           1.6%         3.1%        13.3 months

                     $451-$500          7            26           3.7%         2.0%         3.7 months

                     $651-$700          2            9            1.0%         0.7%         4.5 months

                     $701-$750          2            5            1.0%         0.4%         2.5 months

                     $851-$900          1            6            0.5%         0.5%         6.0 months

                      TOTAL           190          1291

 * The percentage of overall sales for the month in each price range. ** The percentage of active listings in each price range.
                Results compiled from Shasta County MLS on 1/6/11, deemed reliable but not guaranteed.
Residential Sales Trends
             Calendar Year 2010
              (Up to $600,000)
  Price     Number    Original List   Final List   Sold Price    Avg.     Cost Per   Original   Final to   Days on
($1000s)     Sold        (Avg.)         (Avg.)       (Avg.)     Sq. Ft.    Sq. Ft.   to Sold     Sold      Market

 $0-$150     804       $126,630       $114,200     $107,643     1,252       $86       85%         94%        119

$151-$200    530       $196,418       $182,204     $176,536     1,562      $113       90%         97%       131

$201-$250    288       $251,463       $233,468     $226,240     1,802      $125       89%         97%       142

$251-$300    173       $299,404       $283,647     $274,384     2,044      $134       91%         97%       173

$301-$350     99       $368,413       $342,259     $329,747     2,265      $145       90%         96%       153

$351-$400     59       $404,415       $384,187     $374,433     2,549      $147       93%         97%       152

$401-$450     40       $492,589       $446,295     $425,095     2,867      $148       86%         95%       145

$451-$500     28       $559,112       $499,754     $474,038     3,180      $149       85%         95%       205

$501-$550     9        $610,761       $560,206     $530,744     3,169      $167       87%         95%       147

$551-$600     9        $670,100       $627,200     $586,444     3,474      $169       88%         94%       263

TOTAL*       2,057


                                       * Total is for all price ranges in MLS.
              Results compiled from Shasta County MLS on 1/6/11, deemed reliable but not guaranteed.
Residential Sales Trends
            Calendar Year 2010
            ($601,000 and Up)
   Price     Number    Original List   Final List   Sold Price    Avg.     Cost Per   Original   Final to   Days on
 ($1000s)     Sold        (Avg.)         (Avg.)       (Avg.)     Sq. Ft.    Sq. Ft.   to Sold     Sold      Market

$601-$650      1        $800,000       $749,000     $650,000     3,617      $179       81%         87%       249

$651-$700      3        $806,475       $761,725     $684,750     3,716      $184       85%         90%       208

$701-$750      5        $760,790       $752,989     $733,990     3,737      $196       96%         97%       107

$751-$800      1        $898,000       $869,000     $765,000     3,650      $210       85%         88%        90

$801-$850      2        $824,950       $824,950     $827,500     4,986      $166       100%       100%        67

$851-$900      2        $864,950       $864,950     $864,950     3,002      $288       100%       100%        73

$901-$950      0             -             -            -           -         -          -             -       -

$951-$1000     1       $1,159,000      $1,159,000   $1,000,000   5,287      $189       86%         86%       130

 $1001+        3       $1,633,000      $1,964,667   $1,641,667   5,625      $292       100%        84%        72

TOTAL*        2,057


                                       * Total is for all price ranges in MLS.
              Results compiled from Shasta County MLS on 1/6/11, deemed reliable but not guaranteed.
Sales Volume
   December 2010

                          Our December sales volume was more
                           than double our closest competitor.


                                                                                     CB C&C Properties
                                                                                     Keller Williams
                                                                                     Real Estate 1
                                                                                     Real Estate Group
                                                                                     Real Living


$18,909,885
                    7
                 23


                                  0
                              90


                                                0
               1,


                                            15


                                                             0
                            5,


                                                          80
                9


                                          0,
             ,5


                              9


                                                        1,
                           ,4


                                            1
           $8


                                         ,4


                                                         2
                        $6


                                                      ,3
                                      $6


                                                    $3


   Results compiled from Shasta County MLS on 12/9/10, deemed reliable but not guaranteed.

More Related Content

What's hot

January 2011 Austin Real Estate Market Stats
January 2011 Austin Real Estate Market StatsJanuary 2011 Austin Real Estate Market Stats
January 2011 Austin Real Estate Market Stats
Kristee Leonard
 
Chicago Real Estate Market Data - Broken Down by City
Chicago Real Estate Market Data - Broken Down by CityChicago Real Estate Market Data - Broken Down by City
Chicago Real Estate Market Data - Broken Down by City
bethrepta
 
Toronto Real Estate Statistics October 2010
Toronto Real Estate Statistics October 2010Toronto Real Estate Statistics October 2010
Toronto Real Estate Statistics October 2010
John Helfrich
 
February 2011 Austin Real Estate Stats
February 2011 Austin Real Estate StatsFebruary 2011 Austin Real Estate Stats
February 2011 Austin Real Estate Stats
Kristee Leonard
 
Hexter Fair Economic Forecast 021909 Allen
Hexter Fair Economic Forecast 021909 AllenHexter Fair Economic Forecast 021909 Allen
Hexter Fair Economic Forecast 021909 Allen
SheriStinson
 

What's hot (20)

Hhaf Defaultprob
Hhaf DefaultprobHhaf Defaultprob
Hhaf Defaultprob
 
Lake Elsinore EWDC 2-21-13
Lake Elsinore EWDC 2-21-13Lake Elsinore EWDC 2-21-13
Lake Elsinore EWDC 2-21-13
 
January 2011 Austin Real Estate Market Stats
January 2011 Austin Real Estate Market StatsJanuary 2011 Austin Real Estate Market Stats
January 2011 Austin Real Estate Market Stats
 
Dr. Mike Woltman - Using $LOT to Determine Best Market Weight and Quantify Ha...
Dr. Mike Woltman - Using $LOT to Determine Best Market Weight and Quantify Ha...Dr. Mike Woltman - Using $LOT to Determine Best Market Weight and Quantify Ha...
Dr. Mike Woltman - Using $LOT to Determine Best Market Weight and Quantify Ha...
 
The 99% Tax Plan Taxation Schedules
The 99% Tax Plan Taxation SchedulesThe 99% Tax Plan Taxation Schedules
The 99% Tax Plan Taxation Schedules
 
H W 2010 Q1 De 12 Mo
H W 2010 Q1 De 12 MoH W 2010 Q1 De 12 Mo
H W 2010 Q1 De 12 Mo
 
Chicago Real Estate Market Data - Broken Down by City
Chicago Real Estate Market Data - Broken Down by CityChicago Real Estate Market Data - Broken Down by City
Chicago Real Estate Market Data - Broken Down by City
 
Wag Report 2009 Q4 De 12 Mo
Wag Report 2009 Q4 De 12 MoWag Report 2009 Q4 De 12 Mo
Wag Report 2009 Q4 De 12 Mo
 
Dalkeith
DalkeithDalkeith
Dalkeith
 
Toronto Real Estate Statistics October 2010
Toronto Real Estate Statistics October 2010Toronto Real Estate Statistics October 2010
Toronto Real Estate Statistics October 2010
 
February 2011 Austin Real Estate Stats
February 2011 Austin Real Estate StatsFebruary 2011 Austin Real Estate Stats
February 2011 Austin Real Estate Stats
 
Federal Budget Outlays
Federal Budget OutlaysFederal Budget Outlays
Federal Budget Outlays
 
Hexter Fair Economic Forecast 021909 Allen
Hexter Fair Economic Forecast 021909 AllenHexter Fair Economic Forecast 021909 Allen
Hexter Fair Economic Forecast 021909 Allen
 
November 2015 the woodlands market report
November 2015 the woodlands market reportNovember 2015 the woodlands market report
November 2015 the woodlands market report
 
Global Taxation Arbitrage
Global Taxation ArbitrageGlobal Taxation Arbitrage
Global Taxation Arbitrage
 
Leslie Appleton-Young Year-end presentation
Leslie Appleton-Young Year-end presentationLeslie Appleton-Young Year-end presentation
Leslie Appleton-Young Year-end presentation
 
2019 Economic & Market Forecast
2019 Economic & Market Forecast2019 Economic & Market Forecast
2019 Economic & Market Forecast
 
October 2016 the woodlands market report
October 2016 the woodlands market reportOctober 2016 the woodlands market report
October 2016 the woodlands market report
 
Member tours closing %
Member tours closing %Member tours closing %
Member tours closing %
 
Website jan-apr 2012 florida keys real estate market
Website   jan-apr 2012 florida keys real estate marketWebsite   jan-apr 2012 florida keys real estate market
Website jan-apr 2012 florida keys real estate market
 

Viewers also liked (6)

Side getting started - tutorial
Side getting started - tutorialSide getting started - tutorial
Side getting started - tutorial
 
Twitter Channel Presentation
Twitter Channel PresentationTwitter Channel Presentation
Twitter Channel Presentation
 
All By Myself
All By MyselfAll By Myself
All By Myself
 
This Is My Power Point
This Is My Power PointThis Is My Power Point
This Is My Power Point
 
Social Media Nightmares
Social Media NightmaresSocial Media Nightmares
Social Media Nightmares
 
Study: The Future of VR, AR and Self-Driving Cars
Study: The Future of VR, AR and Self-Driving CarsStudy: The Future of VR, AR and Self-Driving Cars
Study: The Future of VR, AR and Self-Driving Cars
 

Similar to Coldwell Banker C&C Properties Sales Dec 2010

Total Market Overview 106 Island Bridge Dr
Total Market Overview 106 Island Bridge DrTotal Market Overview 106 Island Bridge Dr
Total Market Overview 106 Island Bridge Dr
waltdowdy
 
Houston marketreport sep12_sf
Houston marketreport sep12_sfHouston marketreport sep12_sf
Houston marketreport sep12_sf
Toni Moss
 
Stores 549 Report
Stores 549 ReportStores 549 Report
Stores 549 Report
Anna Hamill
 
年金終值計算
年金終值計算年金終值計算
年金終值計算
5045033
 
39348363 google-earnings-slides-q3-2010
39348363 google-earnings-slides-q3-201039348363 google-earnings-slides-q3-2010
39348363 google-earnings-slides-q3-2010
Pranav Bhatnagar
 
Realogics Urbnlivn Presentation
Realogics Urbnlivn PresentationRealogics Urbnlivn Presentation
Realogics Urbnlivn Presentation
urbnlivn
 
pitney bowes Monahan_2
pitney bowes  Monahan_2pitney bowes  Monahan_2
pitney bowes Monahan_2
finance47
 
pitney bowes Monahan_2
pitney bowes  Monahan_2pitney bowes  Monahan_2
pitney bowes Monahan_2
finance47
 
Digital everywhere 2% growth with debt
Digital everywhere 2% growth with debtDigital everywhere 2% growth with debt
Digital everywhere 2% growth with debt
Bea Morales
 

Similar to Coldwell Banker C&C Properties Sales Dec 2010 (20)

Total Market Overview 106 Island Bridge Dr
Total Market Overview 106 Island Bridge DrTotal Market Overview 106 Island Bridge Dr
Total Market Overview 106 Island Bridge Dr
 
Market Report for August 2017 - Residential Resale
Market Report for August 2017 - Residential ResaleMarket Report for August 2017 - Residential Resale
Market Report for August 2017 - Residential Resale
 
Fraser Valley Stats Package 2019
Fraser Valley Stats Package 2019 Fraser Valley Stats Package 2019
Fraser Valley Stats Package 2019
 
Houston marketreport sep12_sf
Houston marketreport sep12_sfHouston marketreport sep12_sf
Houston marketreport sep12_sf
 
Stores 549 Report
Stores 549 ReportStores 549 Report
Stores 549 Report
 
Feb 20 package fvreb
Feb 20 package fvrebFeb 20 package fvreb
Feb 20 package fvreb
 
TREB January 2017 Market Watch
TREB January 2017 Market WatchTREB January 2017 Market Watch
TREB January 2017 Market Watch
 
Toronto Real Estate Board's MARKET WATCH - JANUARY 2017
Toronto Real Estate Board's MARKET WATCH - JANUARY 2017Toronto Real Estate Board's MARKET WATCH - JANUARY 2017
Toronto Real Estate Board's MARKET WATCH - JANUARY 2017
 
Toronto Real Estate Board's MARKET WATCH - JANUARY 2017
Toronto Real Estate Board's MARKET WATCH - JANUARY 2017Toronto Real Estate Board's MARKET WATCH - JANUARY 2017
Toronto Real Estate Board's MARKET WATCH - JANUARY 2017
 
年金終值計算
年金終值計算年金終值計算
年金終值計算
 
Jan Tmo
Jan TmoJan Tmo
Jan Tmo
 
39348363 google-earnings-slides-q3-2010
39348363 google-earnings-slides-q3-201039348363 google-earnings-slides-q3-2010
39348363 google-earnings-slides-q3-2010
 
2010 q3 google_earnings_slides
2010 q3 google_earnings_slides2010 q3 google_earnings_slides
2010 q3 google_earnings_slides
 
Realogics Urbnlivn Presentation
Realogics Urbnlivn PresentationRealogics Urbnlivn Presentation
Realogics Urbnlivn Presentation
 
Fraser Valley Real Estate Board June 2020
Fraser Valley Real Estate Board June 2020 Fraser Valley Real Estate Board June 2020
Fraser Valley Real Estate Board June 2020
 
pitney bowes Monahan_2
pitney bowes  Monahan_2pitney bowes  Monahan_2
pitney bowes Monahan_2
 
pitney bowes Monahan_2
pitney bowes  Monahan_2pitney bowes  Monahan_2
pitney bowes Monahan_2
 
FVREB October 2022 Statistics.pdf
FVREB October 2022 Statistics.pdfFVREB October 2022 Statistics.pdf
FVREB October 2022 Statistics.pdf
 
Digital everywhere 2% growth with debt
Digital everywhere 2% growth with debtDigital everywhere 2% growth with debt
Digital everywhere 2% growth with debt
 
Financial Forecasting
Financial ForecastingFinancial Forecasting
Financial Forecasting
 

Recently uploaded

Call Girls in Karkardooma Delhi +91 84487779280}Woman Seeking Man in Delhi NCR
Call Girls in Karkardooma Delhi +91 84487779280}Woman Seeking Man in Delhi NCRCall Girls in Karkardooma Delhi +91 84487779280}Woman Seeking Man in Delhi NCR
Call Girls in Karkardooma Delhi +91 84487779280}Woman Seeking Man in Delhi NCR
asmaqueen5
 
Call Girls In Gandhi Nagar↬Delhi NCR (Call Us) 8447779280 }Escorts in Delhi NcR
Call Girls In Gandhi Nagar↬Delhi NCR (Call Us) 8447779280 }Escorts in Delhi NcRCall Girls In Gandhi Nagar↬Delhi NCR (Call Us) 8447779280 }Escorts in Delhi NcR
Call Girls In Gandhi Nagar↬Delhi NCR (Call Us) 8447779280 }Escorts in Delhi NcR
asmaqueen5
 
9990771857 Call Girls in Dwarka Sector 1 Delhi (Call Girls) Delhi
9990771857 Call Girls in Dwarka Sector 1 Delhi (Call Girls) Delhi9990771857 Call Girls in Dwarka Sector 1 Delhi (Call Girls) Delhi
9990771857 Call Girls in Dwarka Sector 1 Delhi (Call Girls) Delhi
delhimodel235
 
9990771857 Call Girls Dwarka Sector 9 Delhi (Call Girls ) Delhi
9990771857 Call Girls Dwarka Sector 9 Delhi (Call Girls ) Delhi9990771857 Call Girls Dwarka Sector 9 Delhi (Call Girls ) Delhi
9990771857 Call Girls Dwarka Sector 9 Delhi (Call Girls ) Delhi
delhimodel235
 
9990771857 Call Girls in Dwarka Sector 6 Delhi (Call Girls) Delhi
9990771857 Call Girls in Dwarka Sector 6 Delhi (Call Girls) Delhi9990771857 Call Girls in Dwarka Sector 6 Delhi (Call Girls) Delhi
9990771857 Call Girls in Dwarka Sector 6 Delhi (Call Girls) Delhi
delhimodel235
 
9990771857 Call Girls in Dwarka Sector 2 Delhi (Call Girls) Delhi
9990771857 Call Girls in Dwarka Sector 2 Delhi (Call Girls) Delhi9990771857 Call Girls in Dwarka Sector 2 Delhi (Call Girls) Delhi
9990771857 Call Girls in Dwarka Sector 2 Delhi (Call Girls) Delhi
delhimodel235
 
9990771857 Call Girls in Dwarka Sector 6 Delhi (Call Girls) Delhi
9990771857 Call Girls in Dwarka Sector 6 Delhi (Call Girls) Delhi9990771857 Call Girls in Dwarka Sector 6 Delhi (Call Girls) Delhi
9990771857 Call Girls in Dwarka Sector 6 Delhi (Call Girls) Delhi
delhimodel235
 
Cheap Rate ✨➥9711108085▻✨Call Girls In Chandni Chowk (Delhi)
Cheap Rate ✨➥9711108085▻✨Call Girls In Chandni Chowk (Delhi)Cheap Rate ✨➥9711108085▻✨Call Girls In Chandni Chowk (Delhi)
Cheap Rate ✨➥9711108085▻✨Call Girls In Chandni Chowk (Delhi)
delhi24hrs1
 
MEQ Mainstreet Equity Corp Q2 2024 Investor Presentation
MEQ Mainstreet Equity Corp Q2 2024 Investor PresentationMEQ Mainstreet Equity Corp Q2 2024 Investor Presentation
MEQ Mainstreet Equity Corp Q2 2024 Investor Presentation
MEQ - Mainstreet Equity Corp.
 
9990771857 Call Girls Dwarka Sector 8 Delhi (Call Girls ) Delhi
9990771857 Call Girls  Dwarka Sector 8 Delhi (Call Girls ) Delhi9990771857 Call Girls  Dwarka Sector 8 Delhi (Call Girls ) Delhi
9990771857 Call Girls Dwarka Sector 8 Delhi (Call Girls ) Delhi
delhimodel235
 
Call Girls in Anand Vihar Delhi +91 8447779280}Call Girls In Delhi Best in D...
Call Girls in Anand Vihar Delhi +91 8447779280}Call Girls In Delhi Best  in D...Call Girls in Anand Vihar Delhi +91 8447779280}Call Girls In Delhi Best  in D...
Call Girls in Anand Vihar Delhi +91 8447779280}Call Girls In Delhi Best in D...
asmaqueen5
 
Call Girls In Seelampur Delhi ↬8447779280}Seelampur Escorts Service In Delhi...
Call Girls In Seelampur  Delhi ↬8447779280}Seelampur Escorts Service In Delhi...Call Girls In Seelampur  Delhi ↬8447779280}Seelampur Escorts Service In Delhi...
Call Girls In Seelampur Delhi ↬8447779280}Seelampur Escorts Service In Delhi...
asmaqueen5
 

Recently uploaded (20)

Mahindra Happinest Tathawade Pune Brochure.pdf
Mahindra Happinest Tathawade Pune Brochure.pdfMahindra Happinest Tathawade Pune Brochure.pdf
Mahindra Happinest Tathawade Pune Brochure.pdf
 
Rohan Harita Tathawade Pune Brochure.pdf
Rohan Harita Tathawade Pune Brochure.pdfRohan Harita Tathawade Pune Brochure.pdf
Rohan Harita Tathawade Pune Brochure.pdf
 
Call Girls in Karkardooma Delhi +91 84487779280}Woman Seeking Man in Delhi NCR
Call Girls in Karkardooma Delhi +91 84487779280}Woman Seeking Man in Delhi NCRCall Girls in Karkardooma Delhi +91 84487779280}Woman Seeking Man in Delhi NCR
Call Girls in Karkardooma Delhi +91 84487779280}Woman Seeking Man in Delhi NCR
 
Call Girls In Gandhi Nagar↬Delhi NCR (Call Us) 8447779280 }Escorts in Delhi NcR
Call Girls In Gandhi Nagar↬Delhi NCR (Call Us) 8447779280 }Escorts in Delhi NcRCall Girls In Gandhi Nagar↬Delhi NCR (Call Us) 8447779280 }Escorts in Delhi NcR
Call Girls In Gandhi Nagar↬Delhi NCR (Call Us) 8447779280 }Escorts in Delhi NcR
 
9990771857 Call Girls in Dwarka Sector 1 Delhi (Call Girls) Delhi
9990771857 Call Girls in Dwarka Sector 1 Delhi (Call Girls) Delhi9990771857 Call Girls in Dwarka Sector 1 Delhi (Call Girls) Delhi
9990771857 Call Girls in Dwarka Sector 1 Delhi (Call Girls) Delhi
 
9990771857 Call Girls Dwarka Sector 9 Delhi (Call Girls ) Delhi
9990771857 Call Girls Dwarka Sector 9 Delhi (Call Girls ) Delhi9990771857 Call Girls Dwarka Sector 9 Delhi (Call Girls ) Delhi
9990771857 Call Girls Dwarka Sector 9 Delhi (Call Girls ) Delhi
 
9990771857 Call Girls in Dwarka Sector 6 Delhi (Call Girls) Delhi
9990771857 Call Girls in Dwarka Sector 6 Delhi (Call Girls) Delhi9990771857 Call Girls in Dwarka Sector 6 Delhi (Call Girls) Delhi
9990771857 Call Girls in Dwarka Sector 6 Delhi (Call Girls) Delhi
 
9990771857 Call Girls in Dwarka Sector 2 Delhi (Call Girls) Delhi
9990771857 Call Girls in Dwarka Sector 2 Delhi (Call Girls) Delhi9990771857 Call Girls in Dwarka Sector 2 Delhi (Call Girls) Delhi
9990771857 Call Girls in Dwarka Sector 2 Delhi (Call Girls) Delhi
 
9990771857 Call Girls in Dwarka Sector 6 Delhi (Call Girls) Delhi
9990771857 Call Girls in Dwarka Sector 6 Delhi (Call Girls) Delhi9990771857 Call Girls in Dwarka Sector 6 Delhi (Call Girls) Delhi
9990771857 Call Girls in Dwarka Sector 6 Delhi (Call Girls) Delhi
 
Cheap Rate ✨➥9711108085▻✨Call Girls In Chandni Chowk (Delhi)
Cheap Rate ✨➥9711108085▻✨Call Girls In Chandni Chowk (Delhi)Cheap Rate ✨➥9711108085▻✨Call Girls In Chandni Chowk (Delhi)
Cheap Rate ✨➥9711108085▻✨Call Girls In Chandni Chowk (Delhi)
 
Shapoorji Pallonji Joyville Vista Pune | Spend Your Family Time Together
Shapoorji Pallonji Joyville Vista Pune | Spend Your Family Time TogetherShapoorji Pallonji Joyville Vista Pune | Spend Your Family Time Together
Shapoorji Pallonji Joyville Vista Pune | Spend Your Family Time Together
 
MEQ Mainstreet Equity Corp Q2 2024 Investor Presentation
MEQ Mainstreet Equity Corp Q2 2024 Investor PresentationMEQ Mainstreet Equity Corp Q2 2024 Investor Presentation
MEQ Mainstreet Equity Corp Q2 2024 Investor Presentation
 
Vanam At Purva Soukhyam Guduvanchery.pdf.pdf
Vanam At Purva Soukhyam Guduvanchery.pdf.pdfVanam At Purva Soukhyam Guduvanchery.pdf.pdf
Vanam At Purva Soukhyam Guduvanchery.pdf.pdf
 
9990771857 Call Girls Dwarka Sector 8 Delhi (Call Girls ) Delhi
9990771857 Call Girls  Dwarka Sector 8 Delhi (Call Girls ) Delhi9990771857 Call Girls  Dwarka Sector 8 Delhi (Call Girls ) Delhi
9990771857 Call Girls Dwarka Sector 8 Delhi (Call Girls ) Delhi
 
Call Girls in Anand Vihar Delhi +91 8447779280}Call Girls In Delhi Best in D...
Call Girls in Anand Vihar Delhi +91 8447779280}Call Girls In Delhi Best  in D...Call Girls in Anand Vihar Delhi +91 8447779280}Call Girls In Delhi Best  in D...
Call Girls in Anand Vihar Delhi +91 8447779280}Call Girls In Delhi Best in D...
 
Call Girls In Seelampur Delhi ↬8447779280}Seelampur Escorts Service In Delhi...
Call Girls In Seelampur  Delhi ↬8447779280}Seelampur Escorts Service In Delhi...Call Girls In Seelampur  Delhi ↬8447779280}Seelampur Escorts Service In Delhi...
Call Girls In Seelampur Delhi ↬8447779280}Seelampur Escorts Service In Delhi...
 
Greater Vancouver Realtors Statistics Package April 2024
Greater Vancouver Realtors Statistics Package April 2024Greater Vancouver Realtors Statistics Package April 2024
Greater Vancouver Realtors Statistics Package April 2024
 
Kolte Patil Kharadi Pune E Brochure.pdf
Kolte Patil Kharadi Pune E  Brochure.pdfKolte Patil Kharadi Pune E  Brochure.pdf
Kolte Patil Kharadi Pune E Brochure.pdf
 
Enjoy Night ≽ 8448380779 ≼ Call Girls In Huda City Centre (Gurgaon)
Enjoy Night ≽ 8448380779 ≼ Call Girls In Huda City Centre (Gurgaon)Enjoy Night ≽ 8448380779 ≼ Call Girls In Huda City Centre (Gurgaon)
Enjoy Night ≽ 8448380779 ≼ Call Girls In Huda City Centre (Gurgaon)
 
Bridge & Elliot Ladner Floor Plans May 2024.pdf
Bridge & Elliot Ladner Floor Plans May 2024.pdfBridge & Elliot Ladner Floor Plans May 2024.pdf
Bridge & Elliot Ladner Floor Plans May 2024.pdf
 

Coldwell Banker C&C Properties Sales Dec 2010

  • 1. Residential Sales Trends
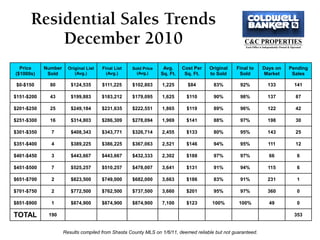
 December 2010 Price Number Original List Final List Sold Price Avg. Cost Per Original Final to Days on Pending ($1000s) Sold (Avg.) (Avg.) (Avg.) Sq. Ft. Sq. Ft. to Sold Sold Market Sales $0-$150 80 $124,535 $111,225 $102,803 1,225 $84 83% 92% 133 141 $151-$200 43 $199,883 $183,212 $179,095 1,625 $110 90% 98% 137 87 $201-$250 25 $249,184 $231,635 $222,551 1,865 $119 89% 96% 122 42 $251-$300 16 $314,803 $286,309 $278,094 1,969 $141 88% 97% 198 30 $301-$350 7 $408,343 $343,771 $326,714 2,455 $133 80% 95% 143 25 $351-$400 4 $389,225 $386,225 $367,063 2,521 $146 94% 95% 111 12 $401-$450 3 $443,667 $443,667 $432,333 2,302 $188 97% 97% 66 6 $451-$500 7 $525,257 $510,257 $478,007 3,641 $131 91% 94% 115 6 $651-$700 2 $823,500 $749,000 $682,000 3,663 $186 83% 91% 231 1 $701-$750 2 $772,500 $762,500 $737,500 3,660 $201 95% 97% 360 0 $851-$900 1 $874,900 $874,900 $874,900 7,100 $123 100% 100% 49 0 TOTAL 190 353 Results compiled from Shasta County MLS on 1/6/11, deemed reliable but not guaranteed.
  • 2. Listing to Sales Comparison December 2010 Price Number Active % of % of Absorption ($1000s) Sold Listings Sold* Listings** Rate $0-$150 80 370 42.1% 28.7% 4.6 months $151-$200 43 262 22.6% 20.3% 6.1 months $201-$250 25 173 13.2% 13.4% 6.9 months $251-$300 16 151 8.4% 11.7% 9.4 months $301-$350 7 86 3.7% 6.7% 12.2 months $351-$400 4 70 2.1% 5.4% 17.5 months $401-$450 3 40 1.6% 3.1% 13.3 months $451-$500 7 26 3.7% 2.0% 3.7 months $651-$700 2 9 1.0% 0.7% 4.5 months $701-$750 2 5 1.0% 0.4% 2.5 months $851-$900 1 6 0.5% 0.5% 6.0 months TOTAL 190 1291 * The percentage of overall sales for the month in each price range. ** The percentage of active listings in each price range. Results compiled from Shasta County MLS on 1/6/11, deemed reliable but not guaranteed.
  • 3. Residential Sales Trends Calendar Year 2010 (Up to $600,000) Price Number Original List Final List Sold Price Avg. Cost Per Original Final to Days on ($1000s) Sold (Avg.) (Avg.) (Avg.) Sq. Ft. Sq. Ft. to Sold Sold Market $0-$150 804 $126,630 $114,200 $107,643 1,252 $86 85% 94% 119 $151-$200 530 $196,418 $182,204 $176,536 1,562 $113 90% 97% 131 $201-$250 288 $251,463 $233,468 $226,240 1,802 $125 89% 97% 142 $251-$300 173 $299,404 $283,647 $274,384 2,044 $134 91% 97% 173 $301-$350 99 $368,413 $342,259 $329,747 2,265 $145 90% 96% 153 $351-$400 59 $404,415 $384,187 $374,433 2,549 $147 93% 97% 152 $401-$450 40 $492,589 $446,295 $425,095 2,867 $148 86% 95% 145 $451-$500 28 $559,112 $499,754 $474,038 3,180 $149 85% 95% 205 $501-$550 9 $610,761 $560,206 $530,744 3,169 $167 87% 95% 147 $551-$600 9 $670,100 $627,200 $586,444 3,474 $169 88% 94% 263 TOTAL* 2,057 * Total is for all price ranges in MLS. Results compiled from Shasta County MLS on 1/6/11, deemed reliable but not guaranteed.
  • 4. Residential Sales Trends Calendar Year 2010 ($601,000 and Up) Price Number Original List Final List Sold Price Avg. Cost Per Original Final to Days on ($1000s) Sold (Avg.) (Avg.) (Avg.) Sq. Ft. Sq. Ft. to Sold Sold Market $601-$650 1 $800,000 $749,000 $650,000 3,617 $179 81% 87% 249 $651-$700 3 $806,475 $761,725 $684,750 3,716 $184 85% 90% 208 $701-$750 5 $760,790 $752,989 $733,990 3,737 $196 96% 97% 107 $751-$800 1 $898,000 $869,000 $765,000 3,650 $210 85% 88% 90 $801-$850 2 $824,950 $824,950 $827,500 4,986 $166 100% 100% 67 $851-$900 2 $864,950 $864,950 $864,950 3,002 $288 100% 100% 73 $901-$950 0 - - - - - - - - $951-$1000 1 $1,159,000 $1,159,000 $1,000,000 5,287 $189 86% 86% 130 $1001+ 3 $1,633,000 $1,964,667 $1,641,667 5,625 $292 100% 84% 72 TOTAL* 2,057 * Total is for all price ranges in MLS. Results compiled from Shasta County MLS on 1/6/11, deemed reliable but not guaranteed.
  • 5. Sales Volume December 2010 Our December sales volume was more than double our closest competitor. CB C&C Properties Keller Williams Real Estate 1 Real Estate Group Real Living $18,909,885 7 23 0 90 0 1, 15 0 5, 80 9 0, ,5 9 1, ,4 1 $8 ,4 2 $6 ,3 $6 $3 Results compiled from Shasta County MLS on 12/9/10, deemed reliable but not guaranteed.