Download as PDF, PPTX


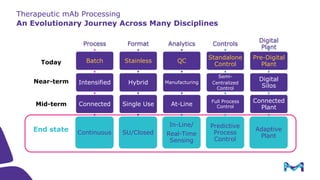
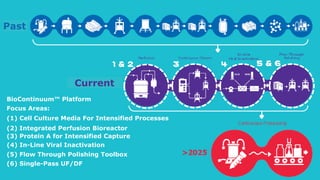


The document discusses advancements in therapeutic monoclonal antibody (mAb) processing, emphasizing market trends towards intensified capture processing and continuous operations. Key technologies introduced include continuous multi-column chromatography and in-line virus inactivation, which aim to enhance productivity, reduce costs, and streamline purification processes. The adoption of flow-through polishing techniques is highlighted for improving product yield while minimizing facility footprints and buffer requirements.