Download as PDF, PPTX


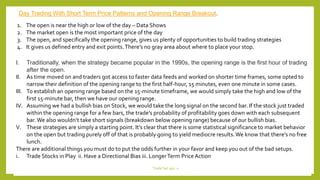
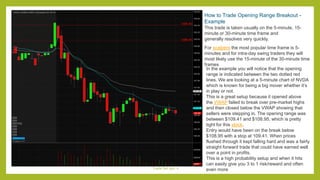

The document discusses strategies for trading opening range breakouts. It defines the opening range as the high and low prices established within the first hour, 30 minutes, 15 minutes, or even one minute after the market opens. It recommends taking long signals if the price breaks above the high of the opening range or short signals if the price breaks below the low of the opening range. Additional factors like volume, daily chart trends, and catalysts can improve the odds of a successful trade. An example trade is presented to illustrate how to profit from an opening range breakout.


![제 23회 보아즈(BOAZ) 빅데이터 컨퍼런스 - [MBOAX] : ABSA를 활용한 소비자 반응 분석 기반 운영 효율화 대시보드 설계](https://cdn.slidesharecdn.com/ss_thumbnails/3-1boaz23rdconferencemboax-260203102709-9d519923-thumbnail.jpg?width=640&height=640&fit=bounds)


