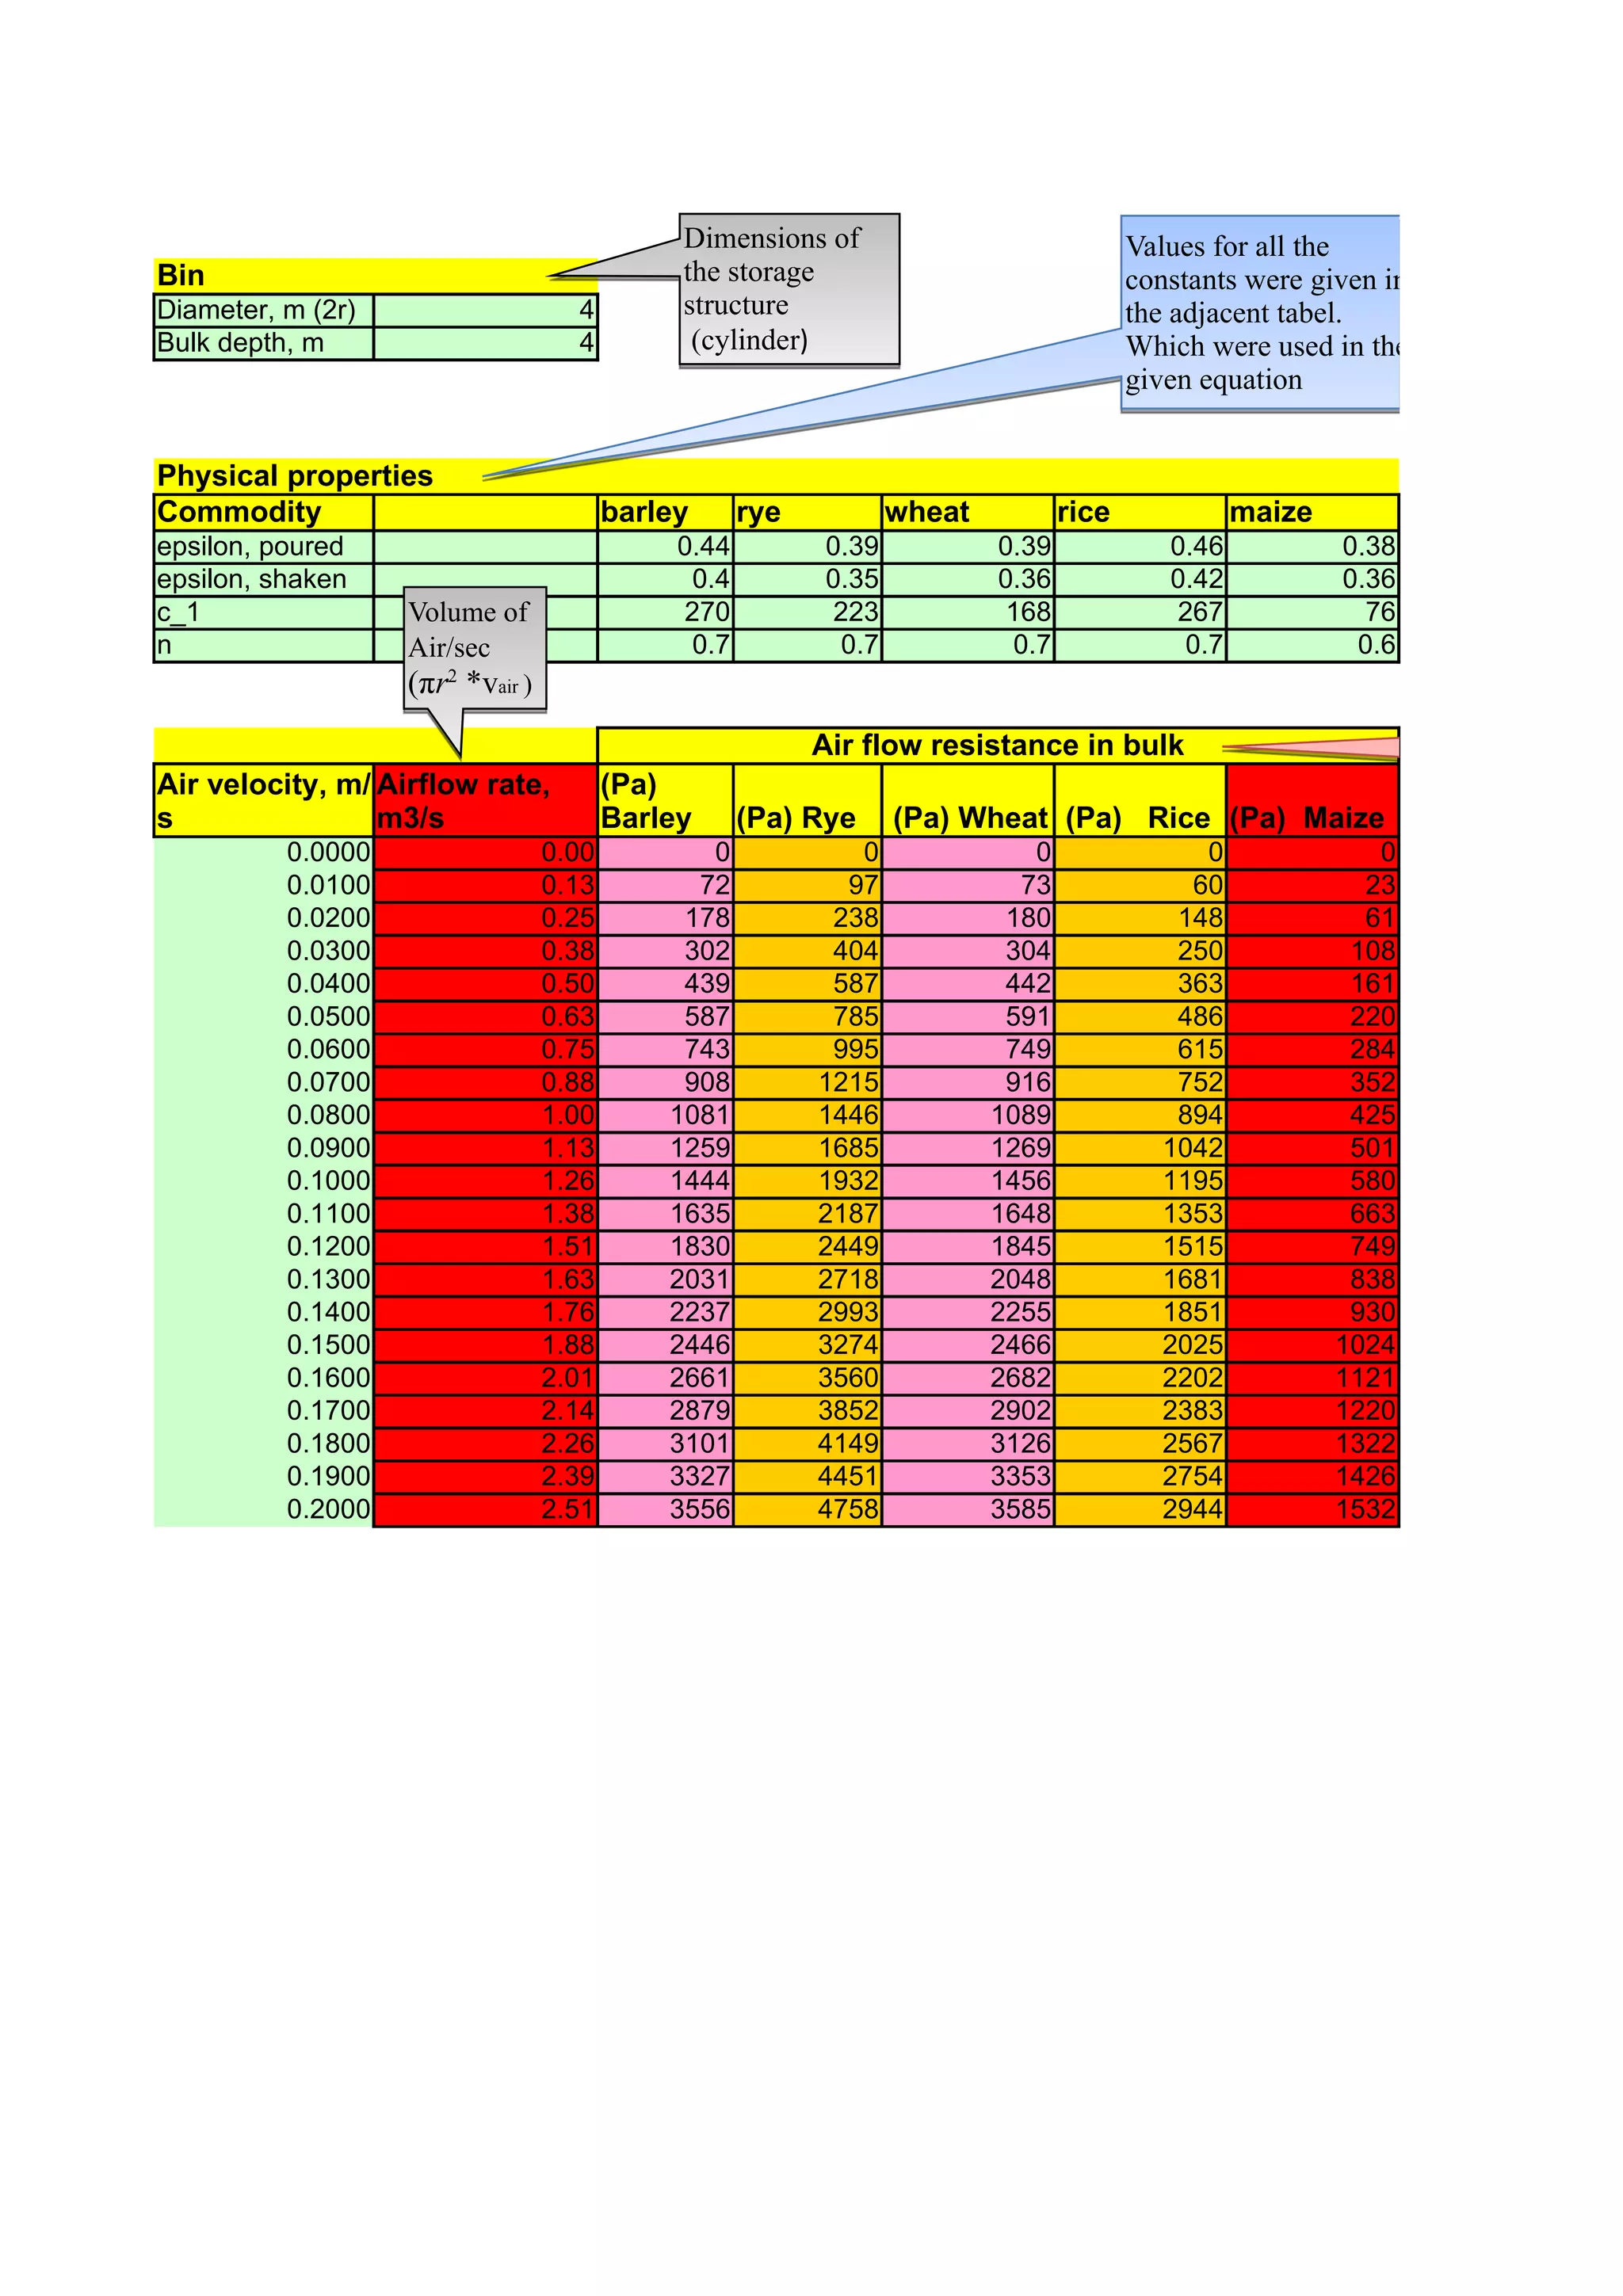
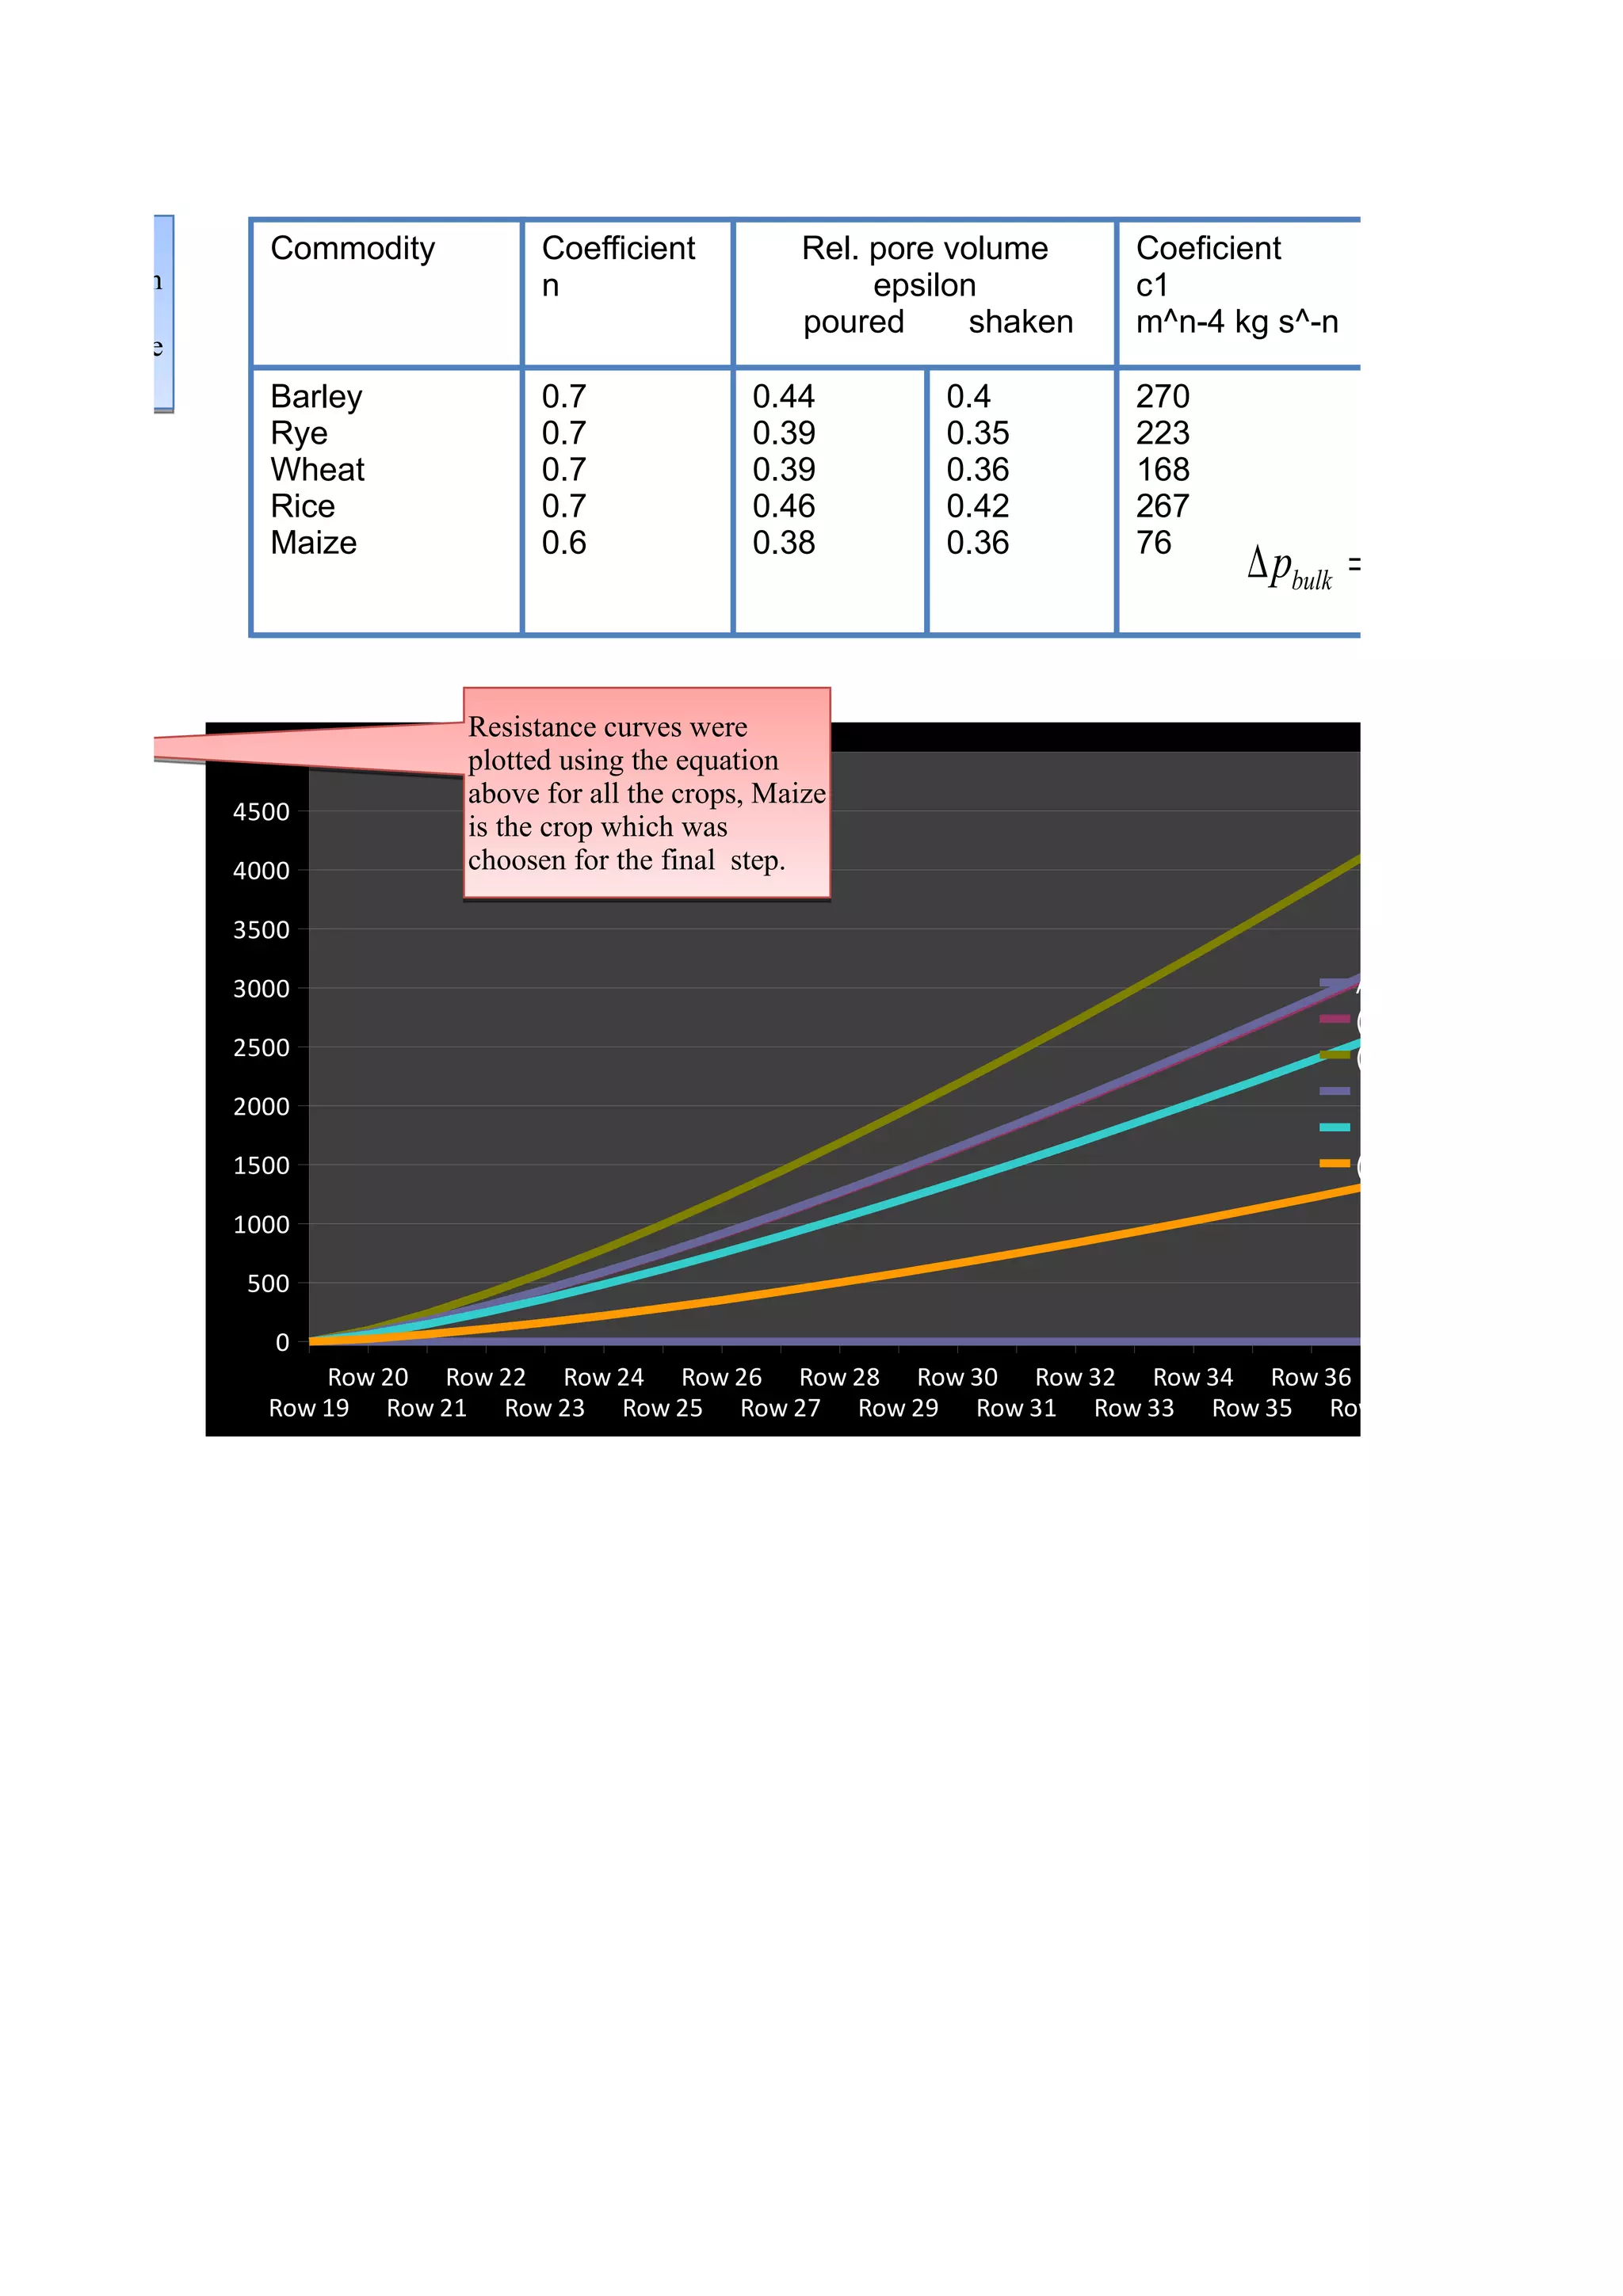
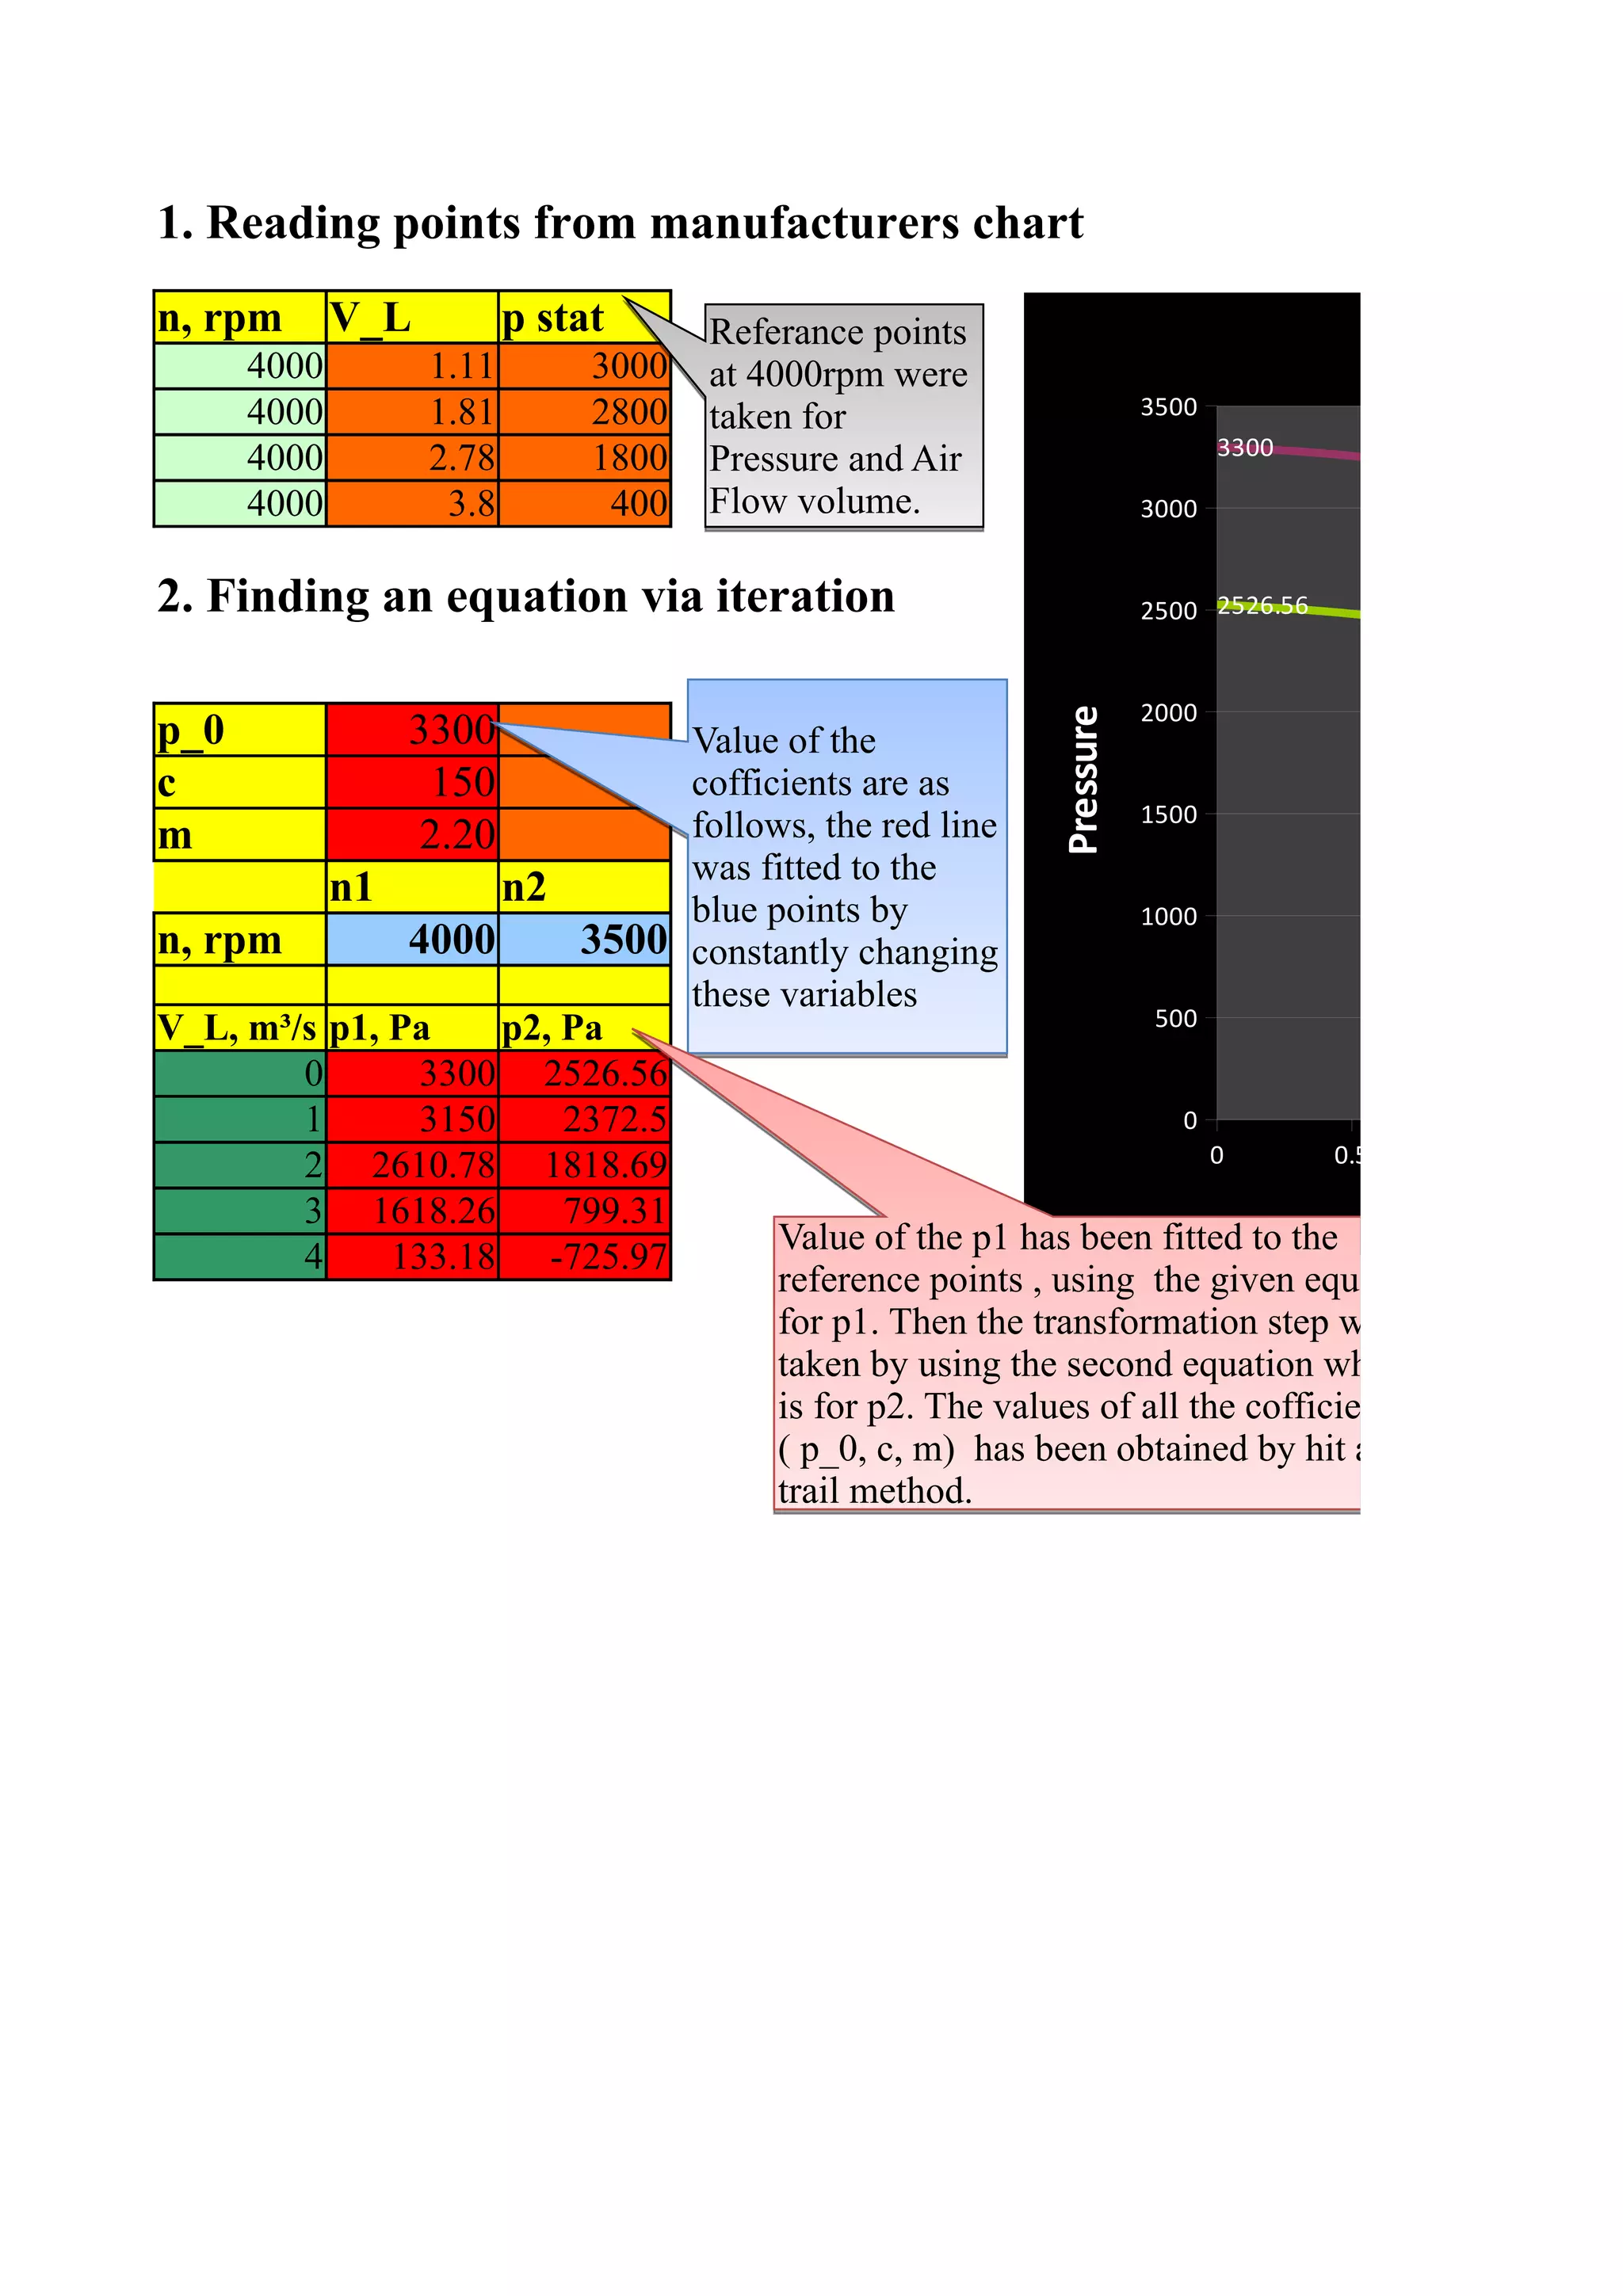
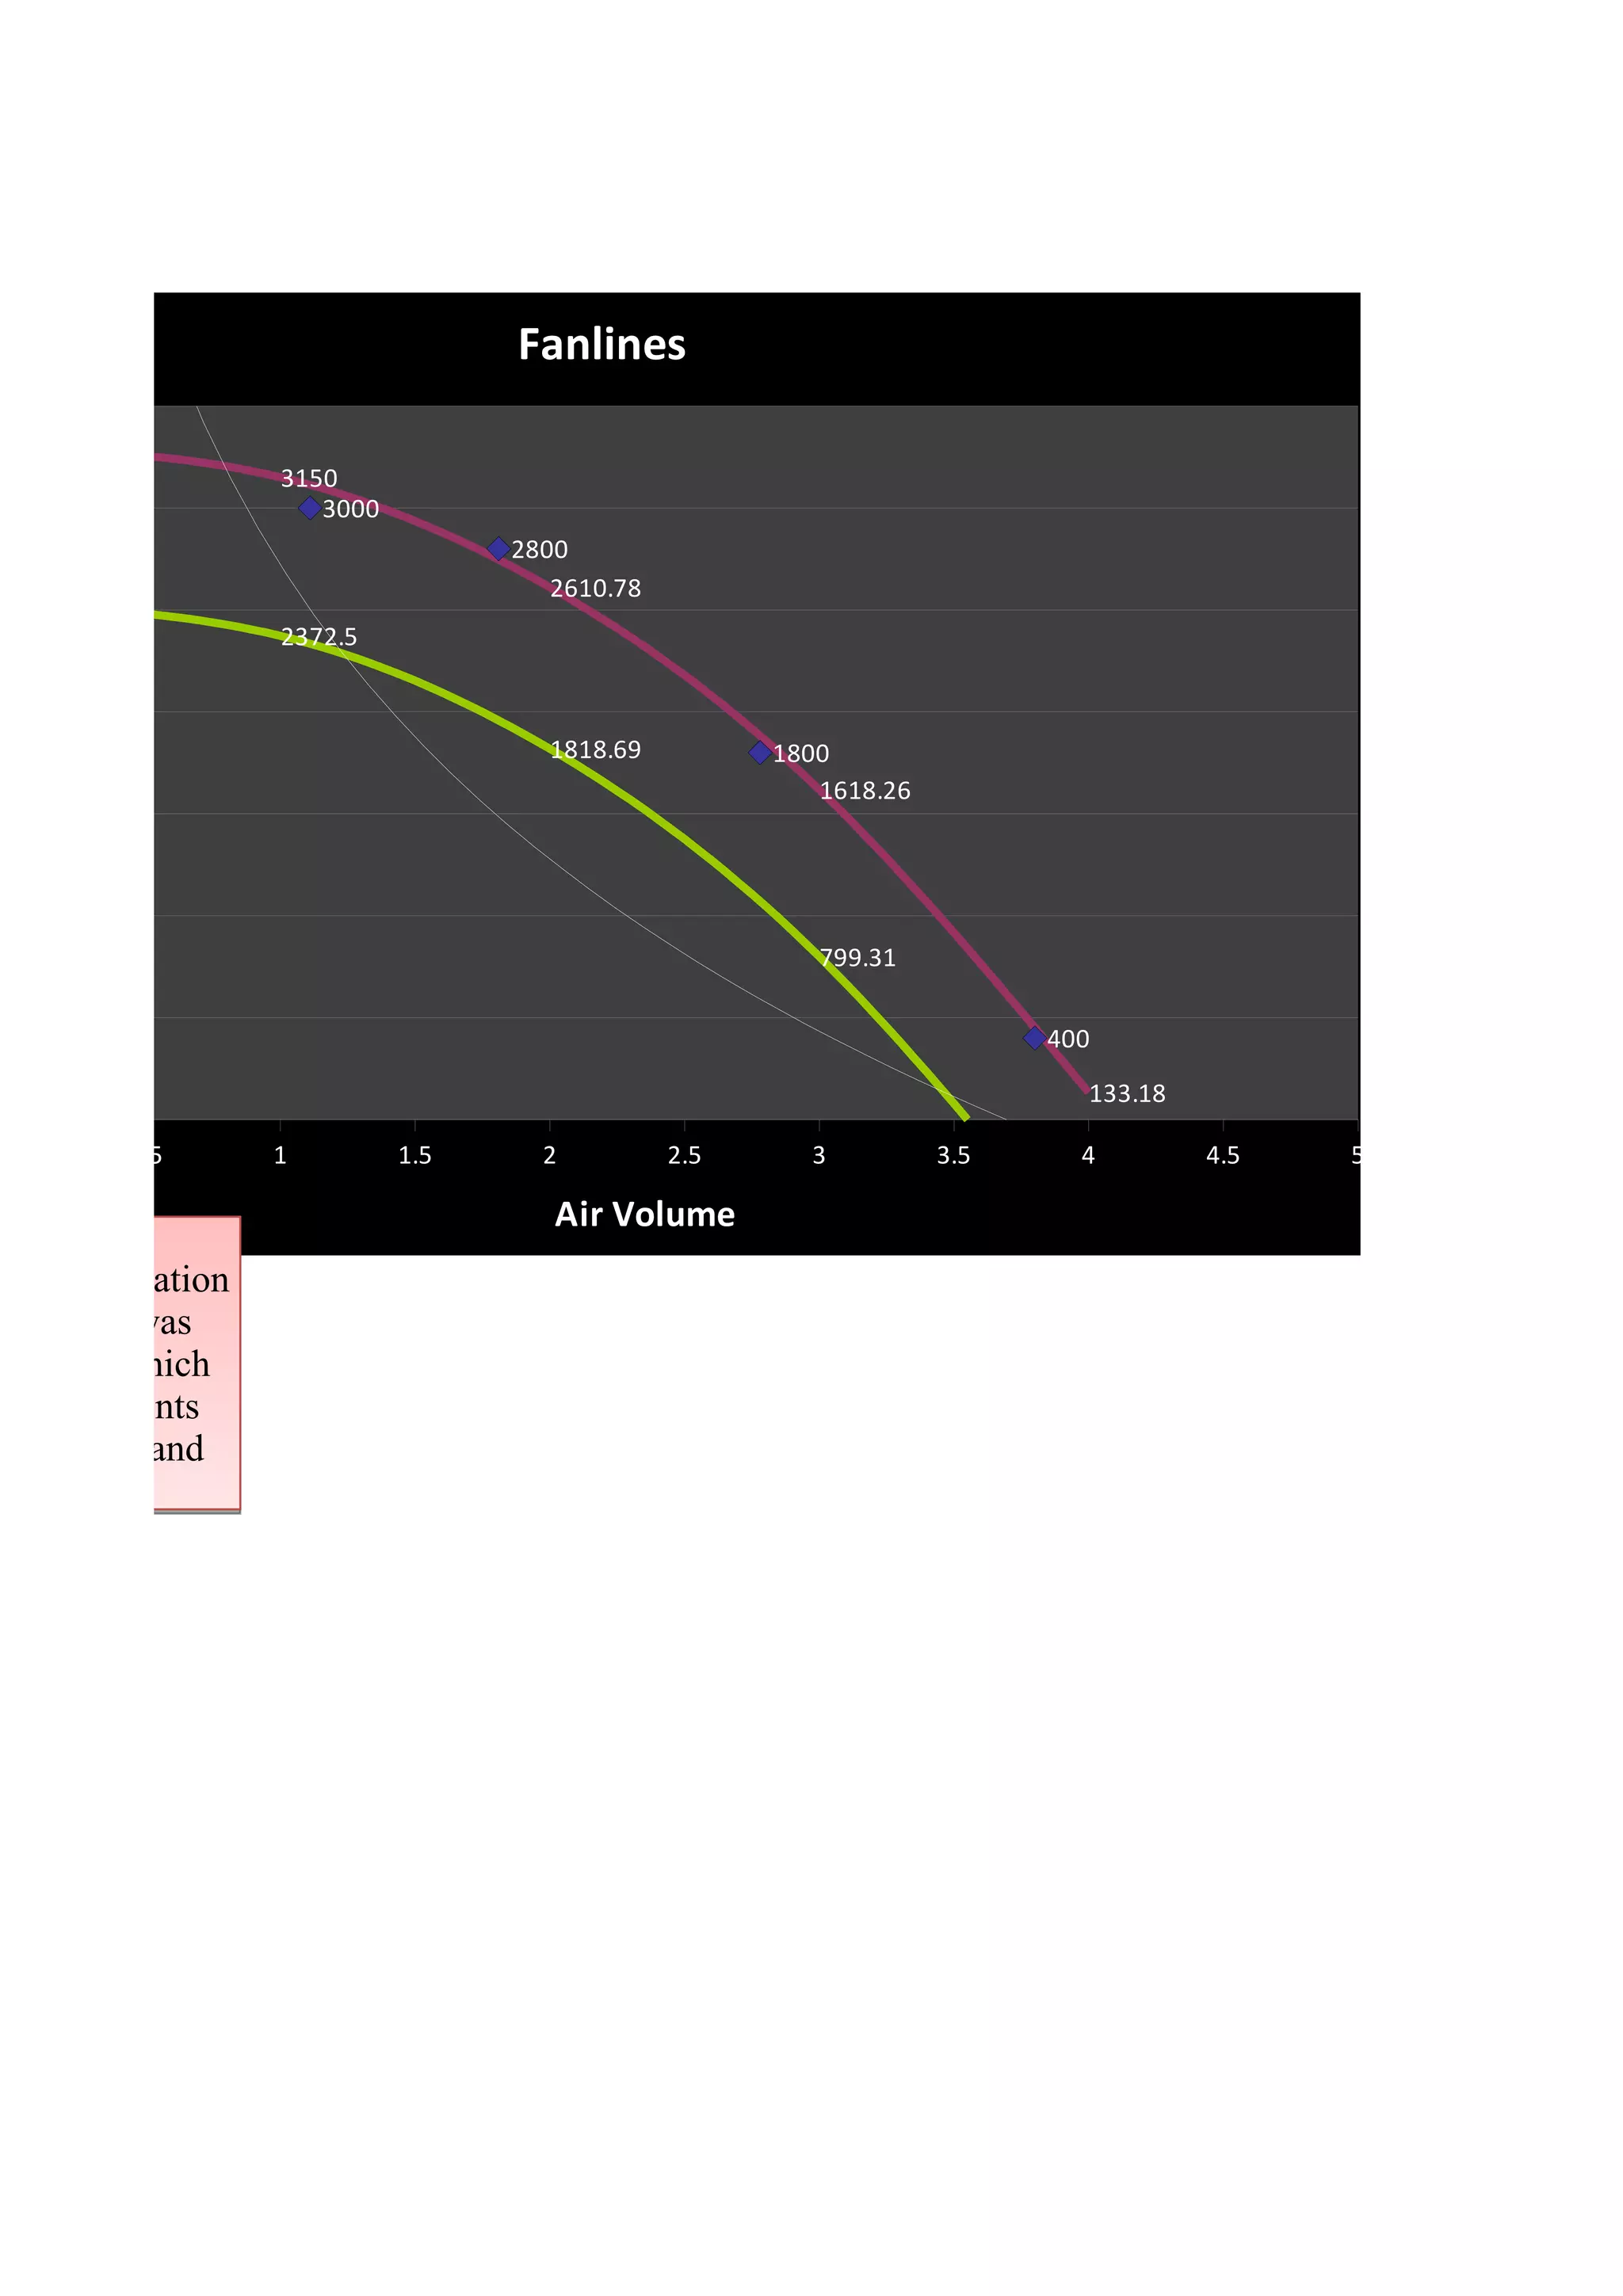
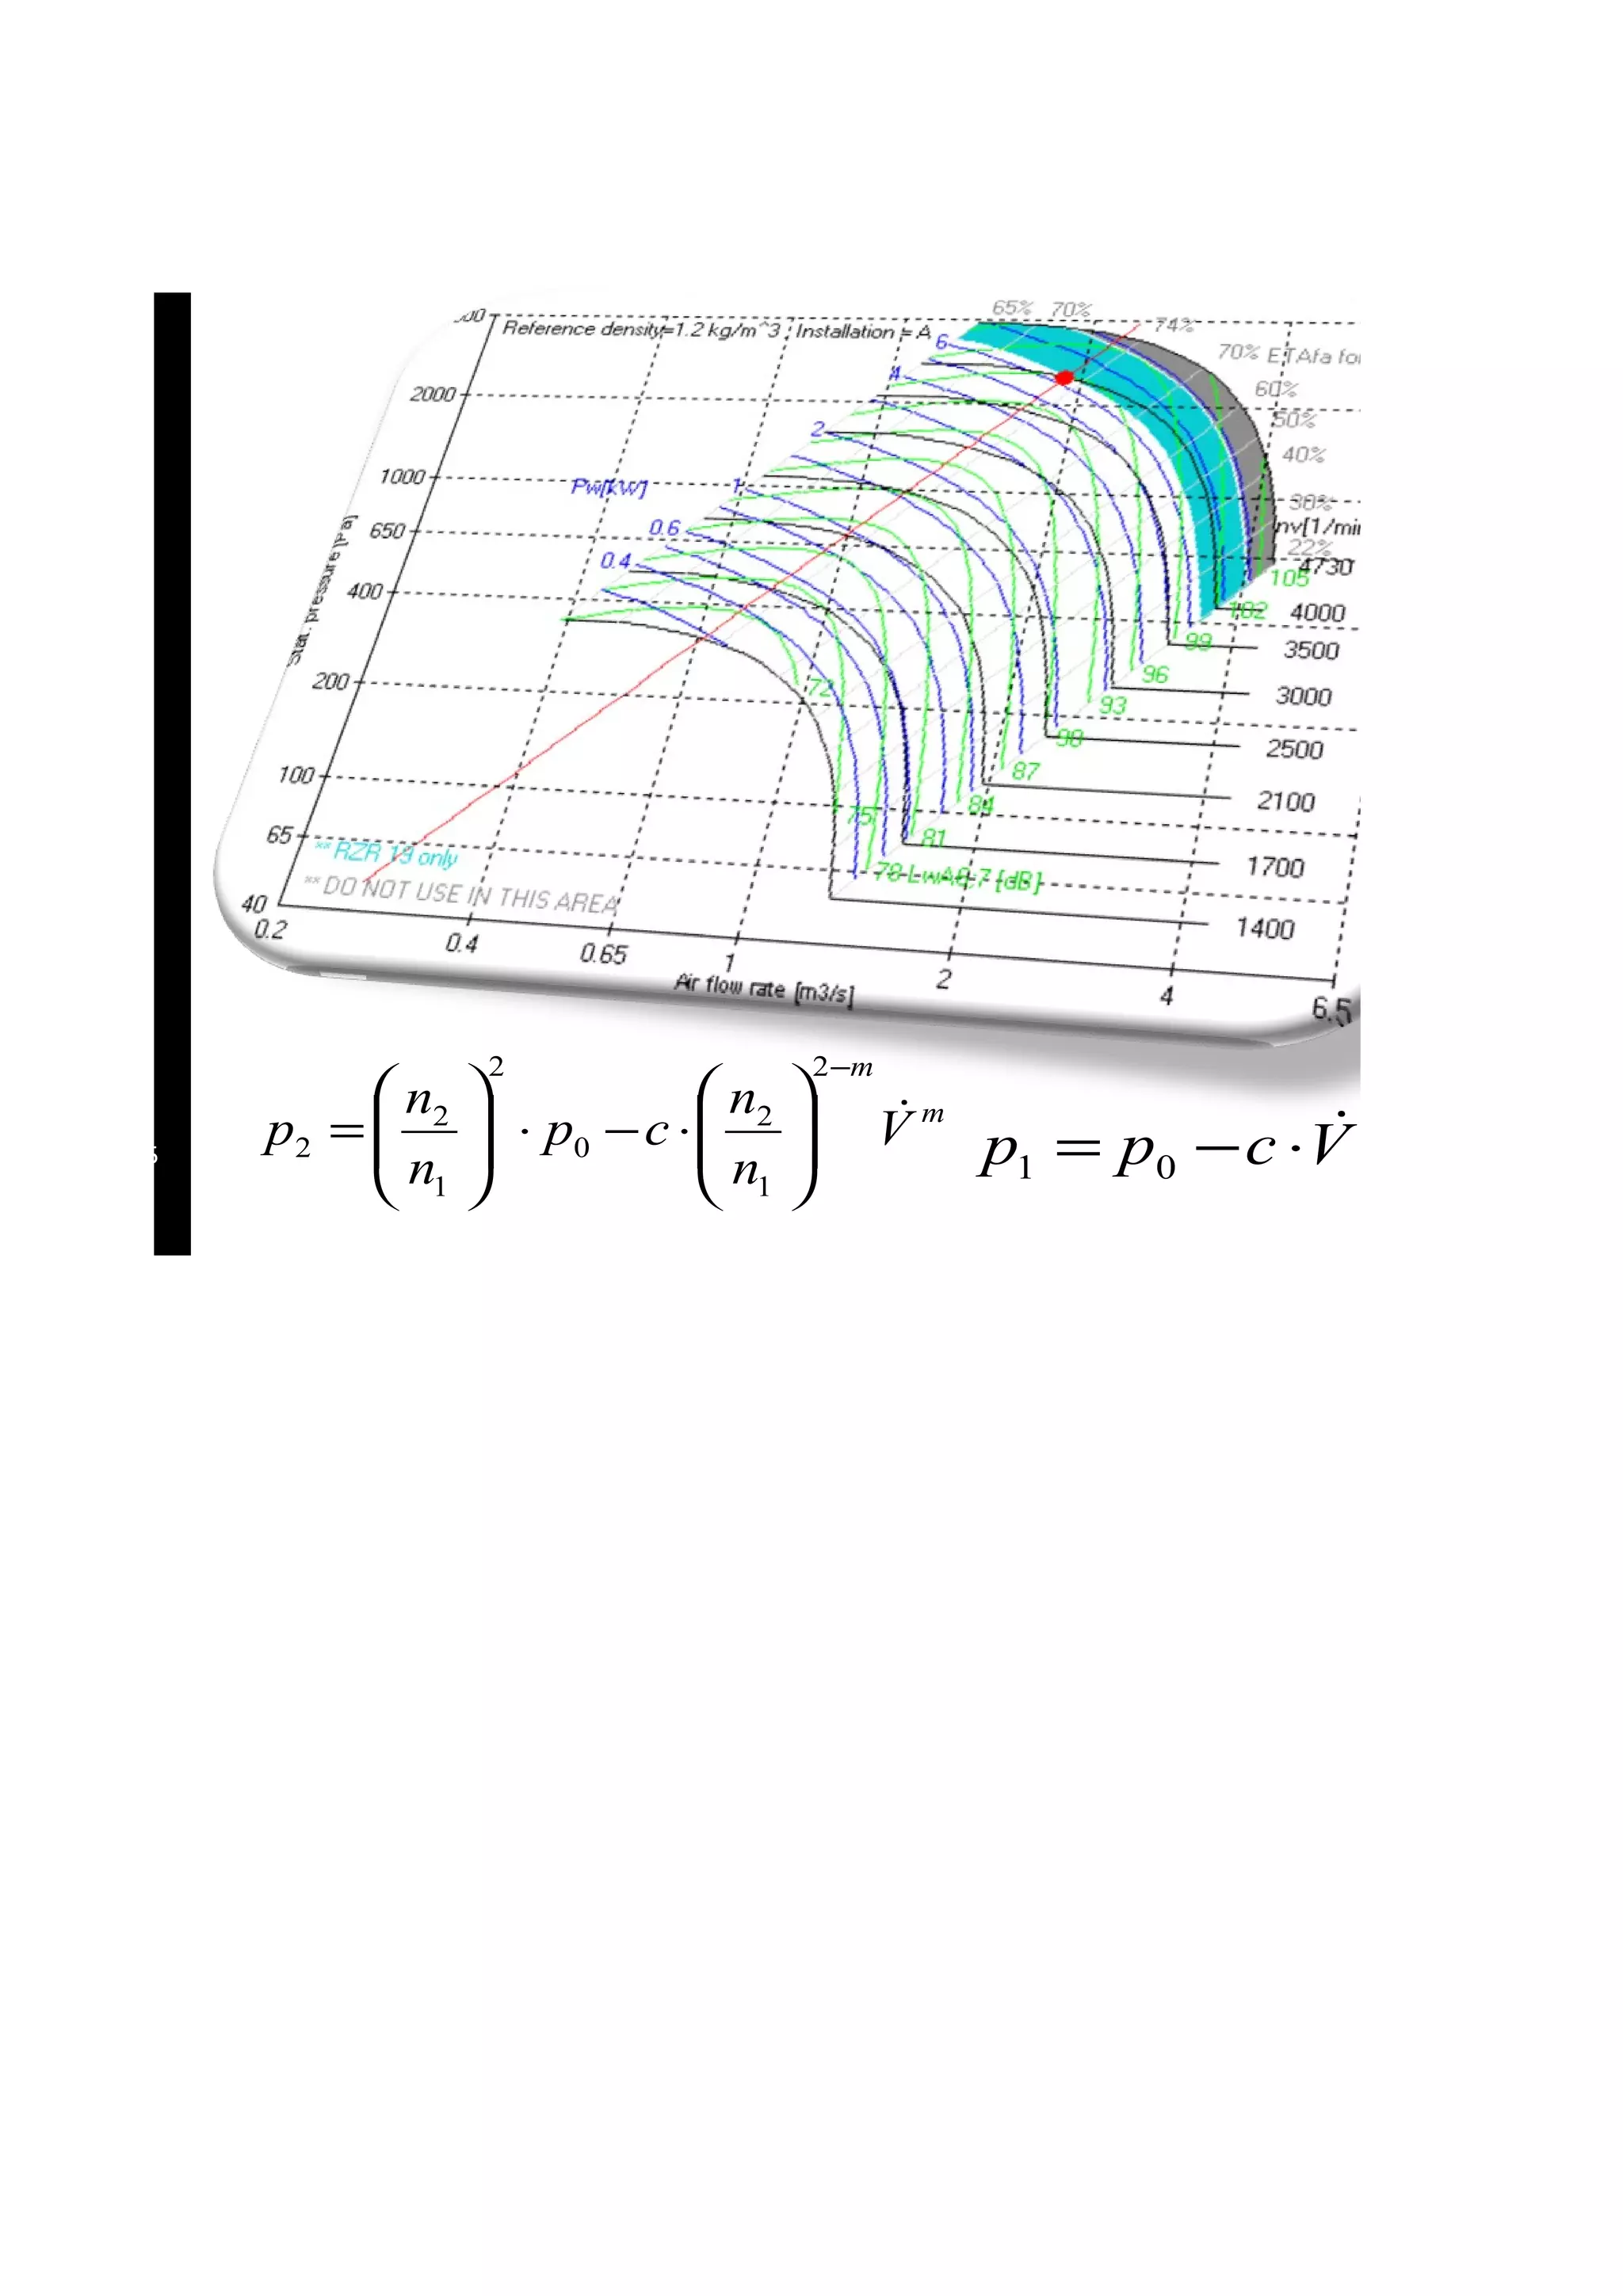
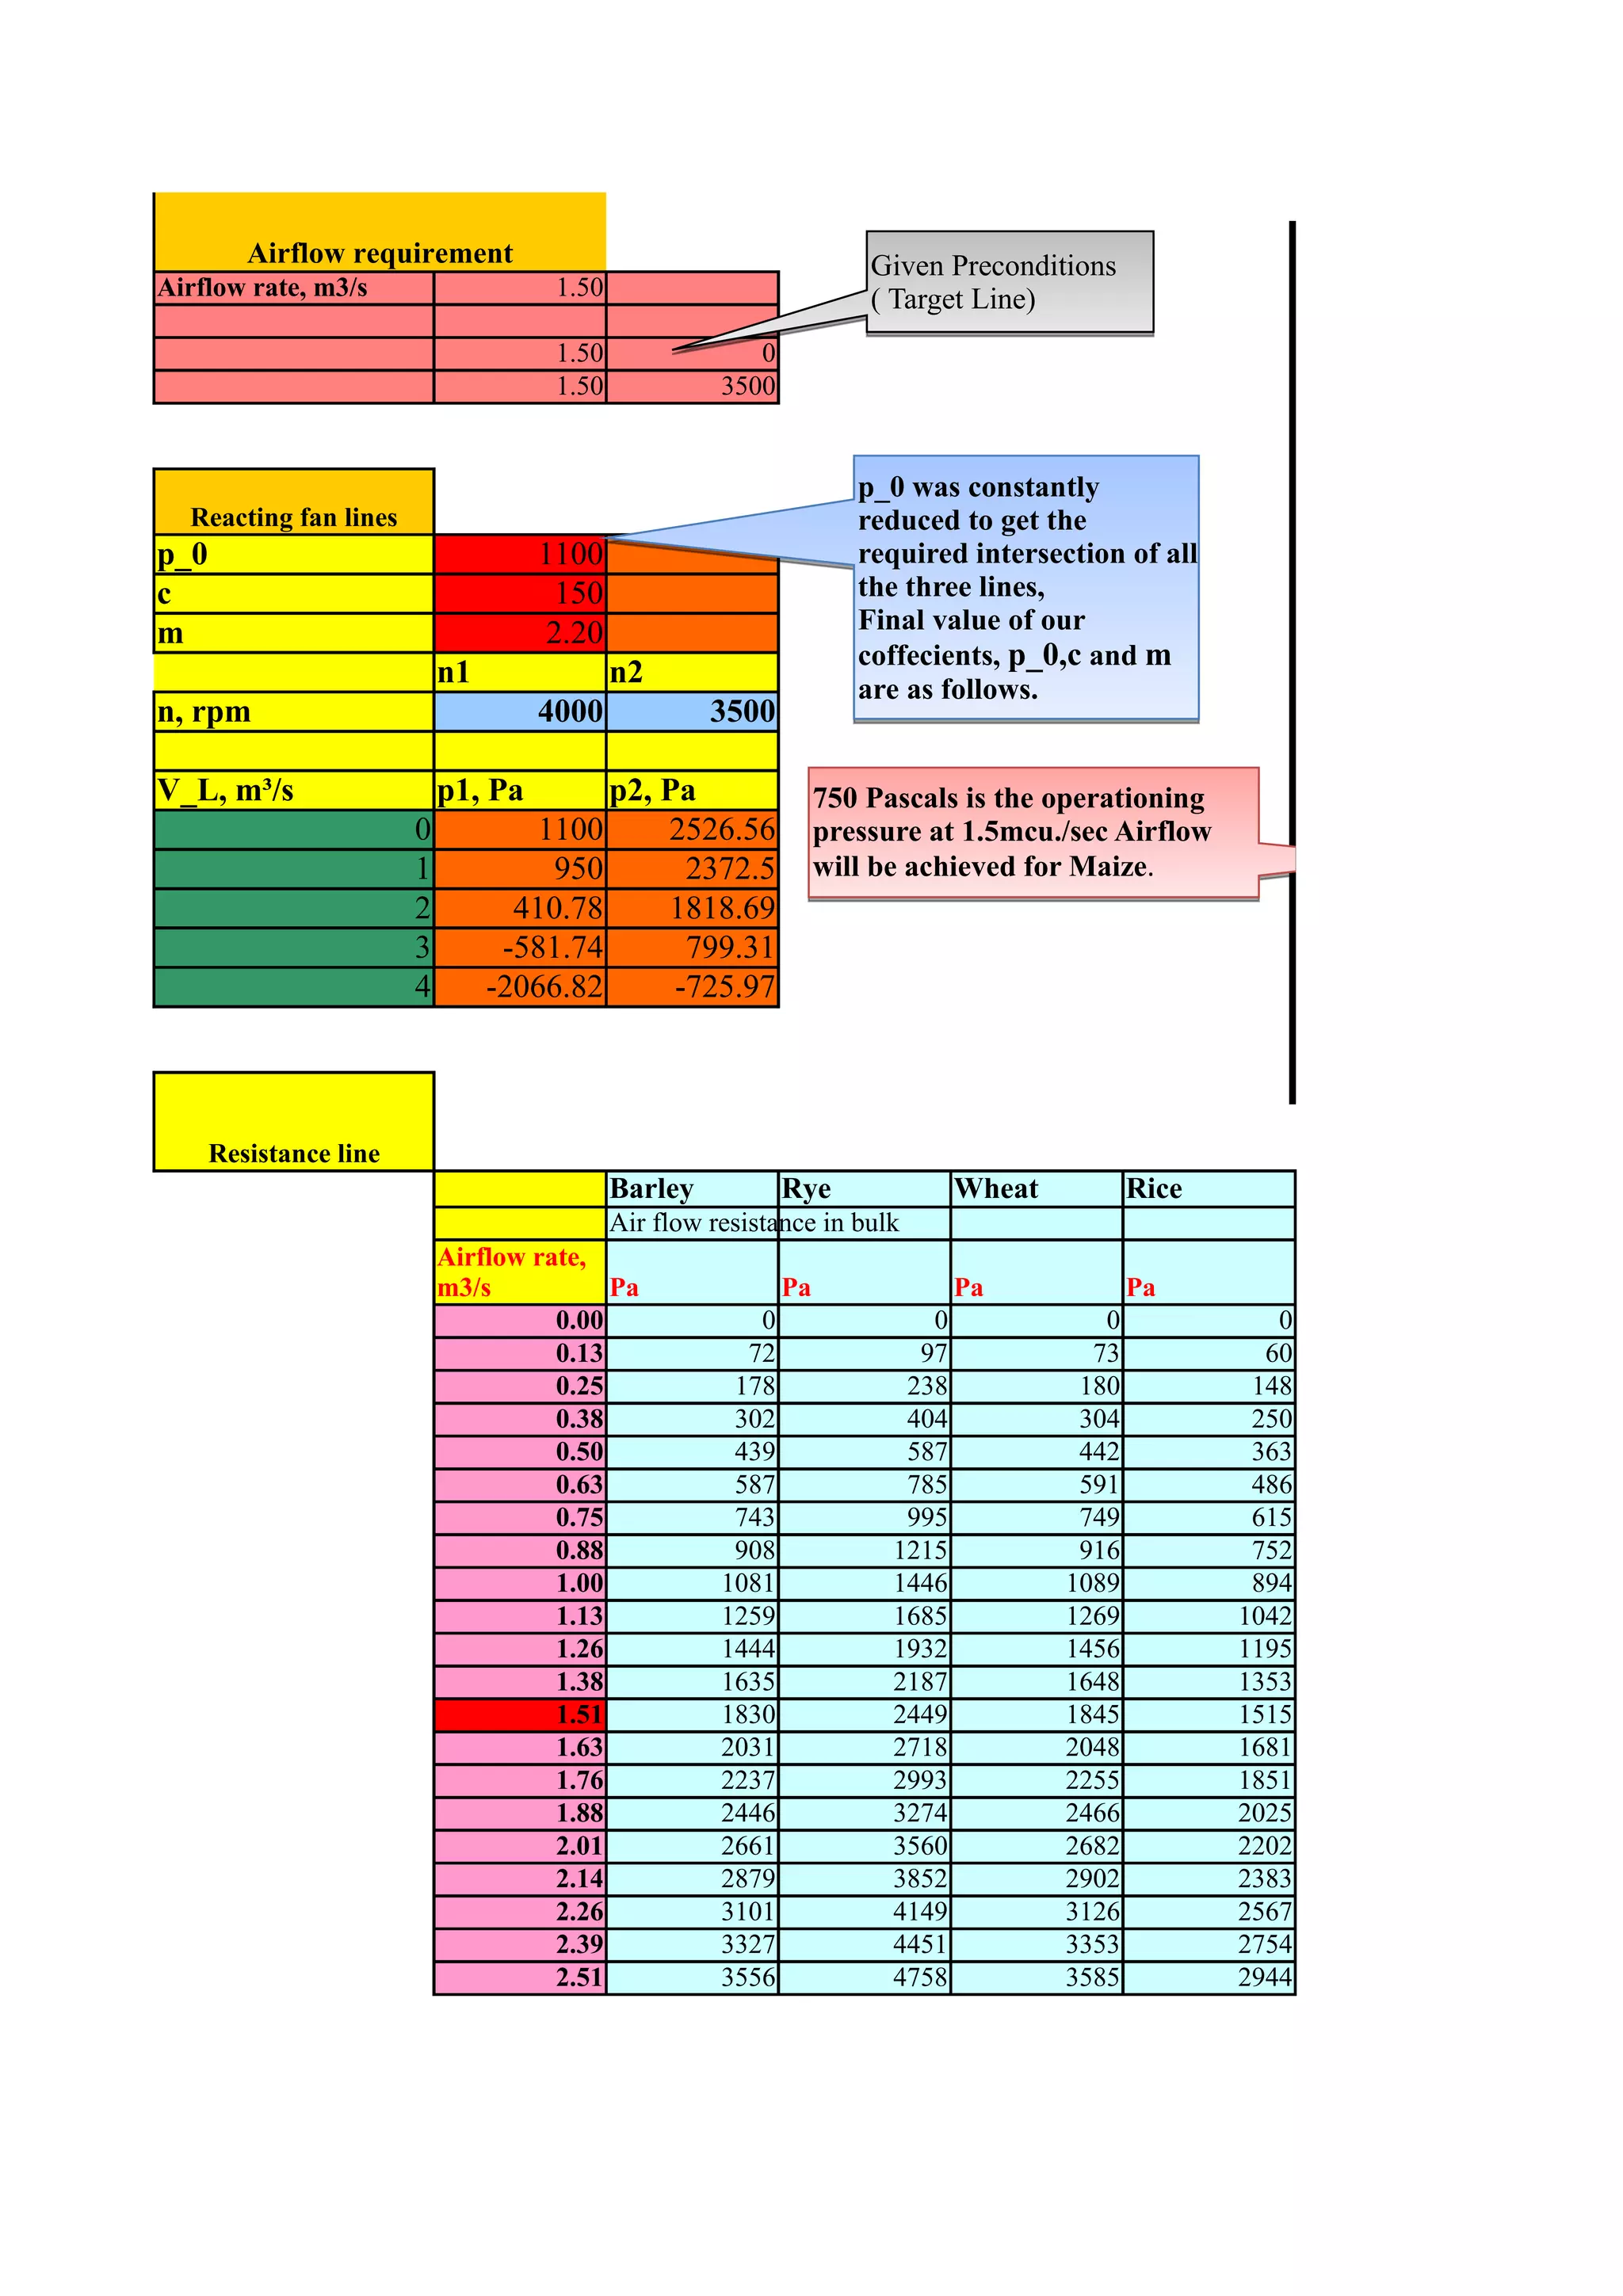
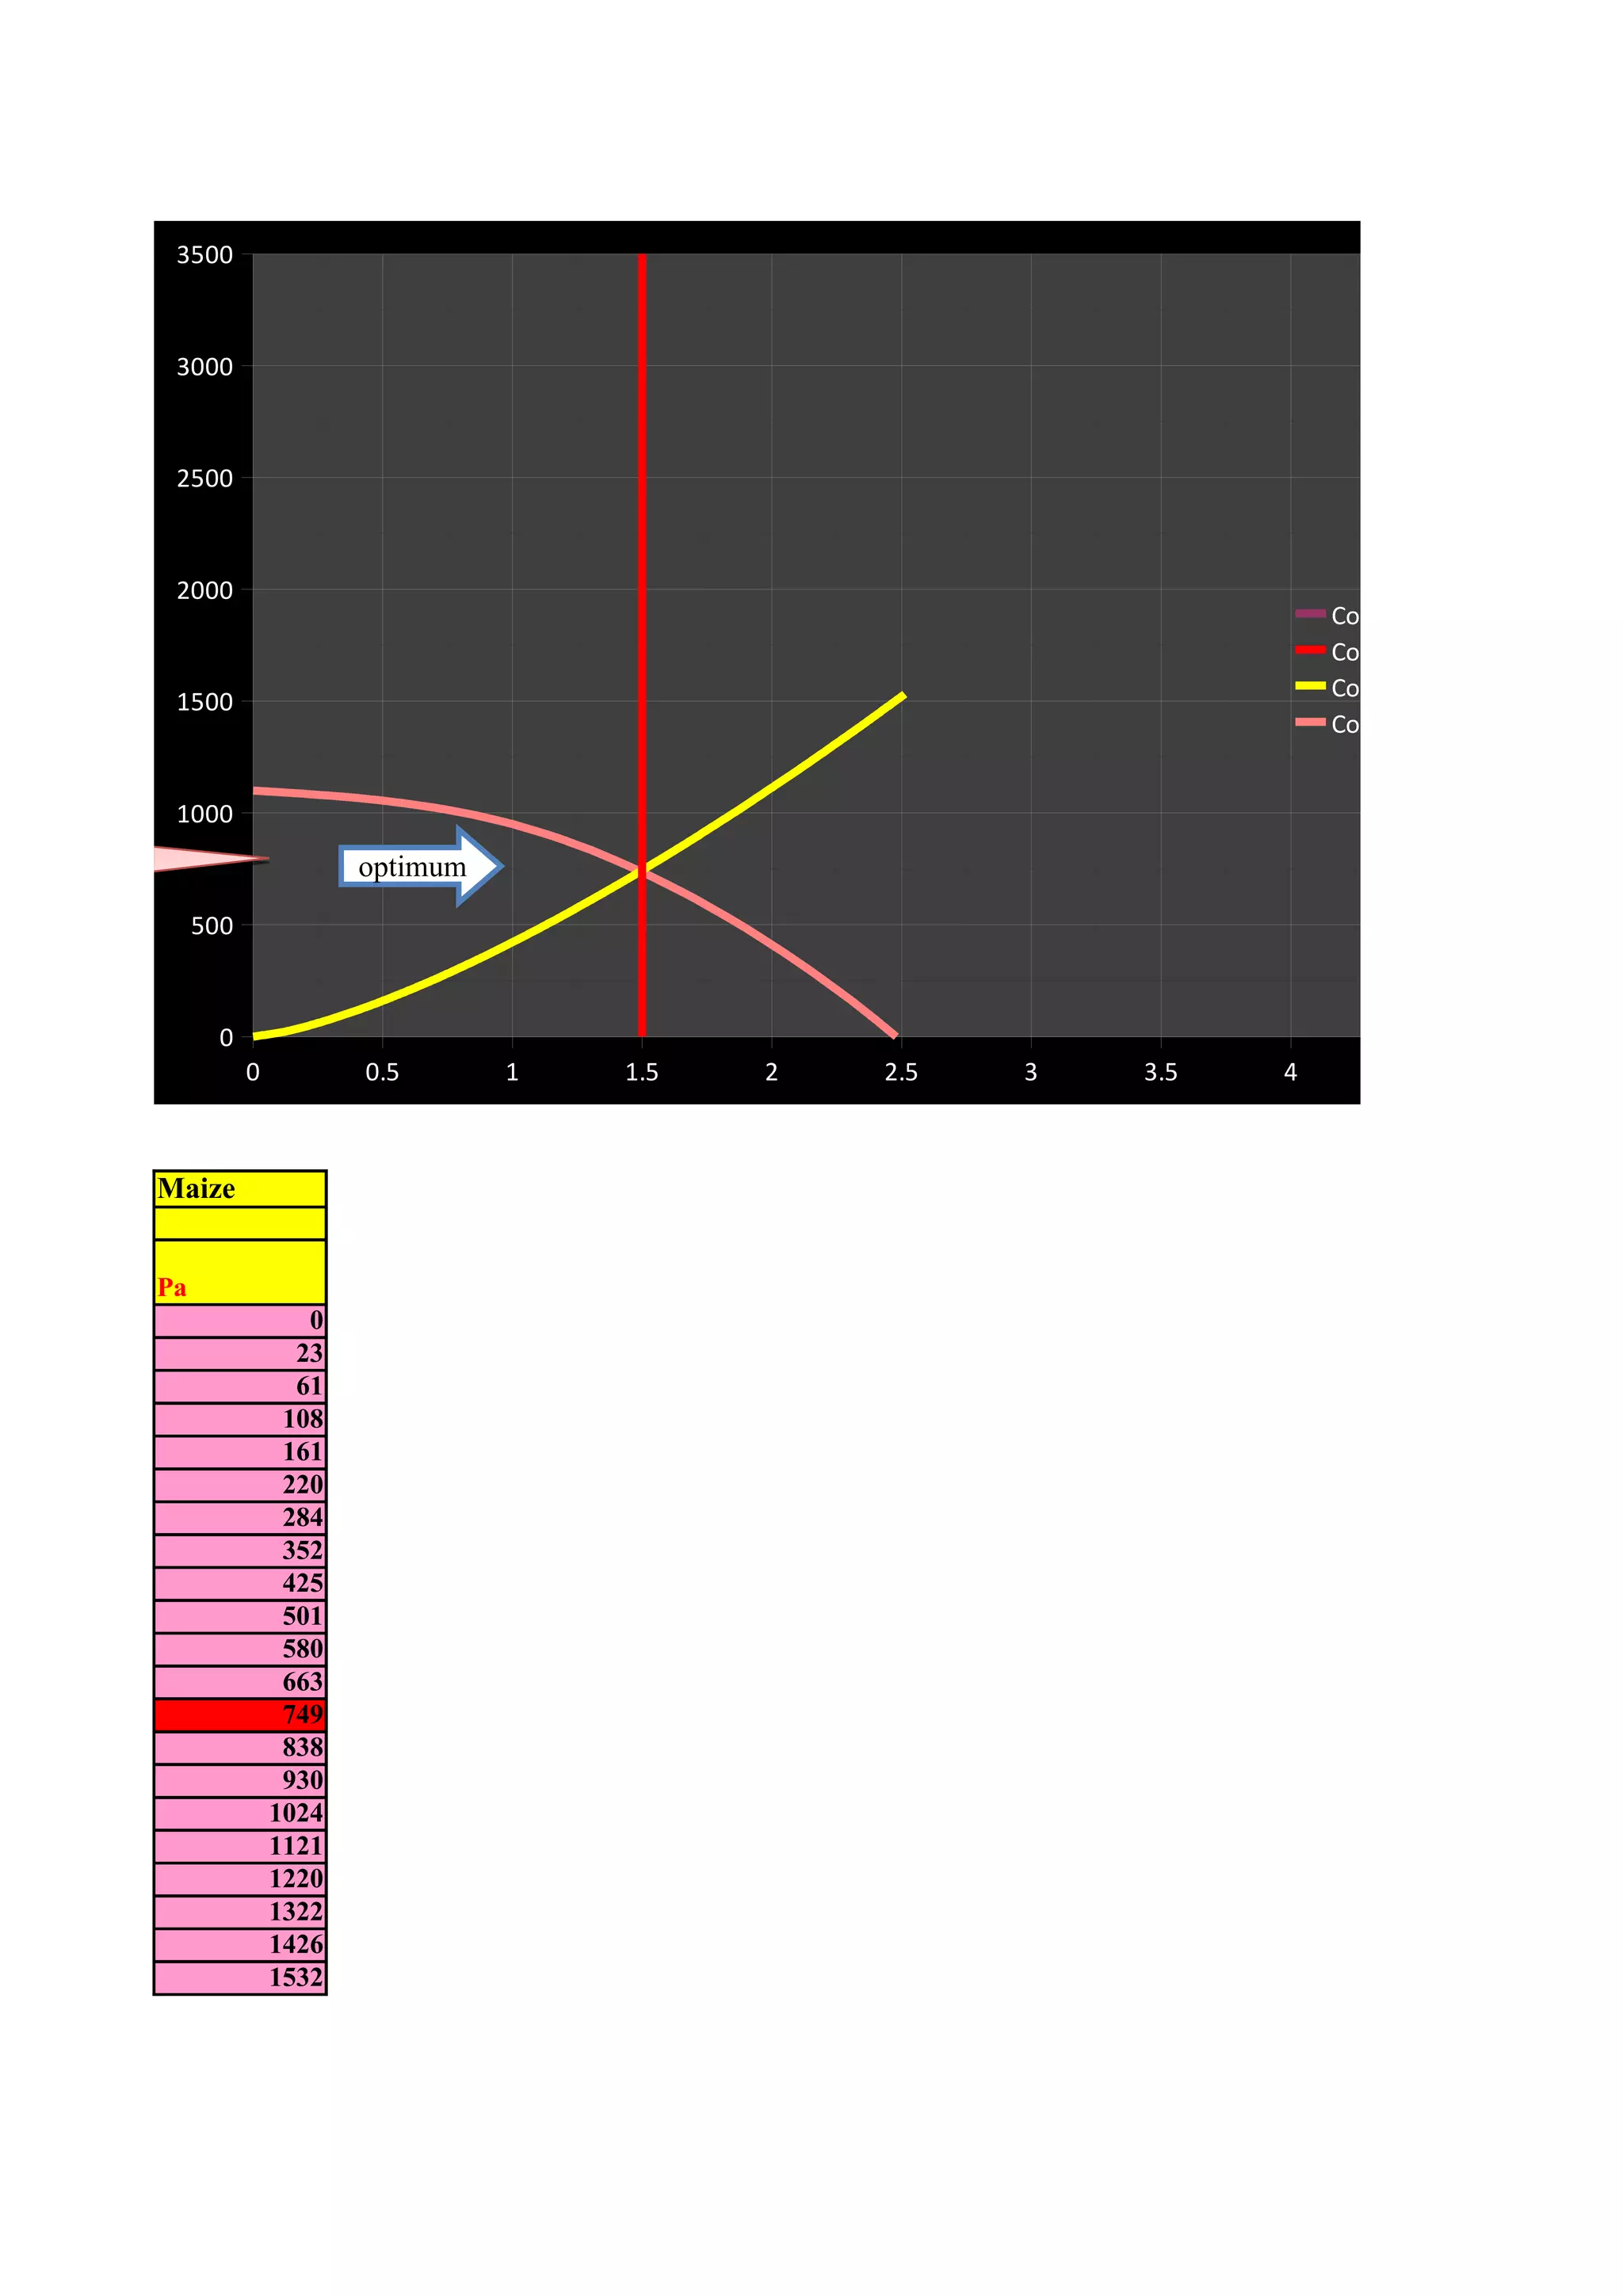
Dimensions of                                Values for all the
Bin                                           the storage                                  constants were given in
Diameter, m (2r)                    4         structure                                    the adjacent tabel.
Bulk depth, m                       4          (cylinder)                                  Which were used in the
                                                                                           given equation


Physical properties
Commodity                                barley      rye            wheat           rice             maize
epsilon, poured                               0.44          0.39            0.39              0.46           0.38
epsilon, shaken                                0.4          0.35            0.36              0.42           0.36
c_1                Volume of                  270            223             168              267              76
n                  Air/sec                     0.7            0.7             0.7              0.7            0.6
                   (πr2 *vair )
                                                           Air flow resistance in bulk
Air velocity, m/ Airflow rate,           (Pa)
s                m3/s                    Barley      (Pa) Rye       (Pa) Wheat (Pa) Rice (Pa) Maize
          0.0000                  0.00          0             0                0                 0              0
          0.0100                  0.13         72            97               73                60             23
          0.0200                  0.25        178           238              180               148             61
          0.0300                  0.38        302           404              304               250            108
          0.0400                  0.50        439           587              442               363            161
          0.0500                  0.63        587           785              591               486            220
          0.0600                  0.75        743           995              749               615            284
          0.0700                  0.88        908          1215              916               752            352
          0.0800                  1.00       1081          1446             1089               894            425
          0.0900                  1.13       1259          1685             1269              1042            501
          0.1000                  1.26       1444          1932             1456              1195            580
          0.1100                  1.38       1635          2187             1648              1353            663
          0.1200                  1.51       1830          2449             1845              1515            749
          0.1300                  1.63       2031          2718             2048              1681            838
          0.1400                  1.76       2237          2993             2255              1851            930
          0.1500                  1.88       2446          3274             2466              2025           1024
          0.1600                  2.01       2661          3560             2682              2202           1121
          0.1700                  2.14       2879          3852             2902              2383           1220
          0.1800                  2.26       3101          4149             3126              2567           1322
          0.1900                  2.39       3327          4451             3353              2754           1426
          0.2000                  2.51       3556          4758             3585              2944           1532
r all the           Commodity         Coefficient          Rel. pore volume     Coeficient
 were given in                        n                         epsilon         c1
ent tabel.                                                 poured      shaken   m^n-4 kg s^-n
ere used in the
 ation
                    Barley            0.7              0.44         0.4         270
                    Rye               0.7              0.39         0.35        223
                    Wheat             0.7              0.39         0.36        168
                    Rice              0.7              0.46         0.42        267
                    Maize             0.6              0.38         0.36        76                           1 2− n
                                                                                       ∆ pbulk = c1 ⋅ h ⋅       ⋅v
                                                                                                            ε 4


                                Resistance curves were
                  5000          plotted using the equation
                                above for all the crops, Maize
                  4500
                                is the crop which was
                  4000          choosen for the final step.

                  3500

                  3000                                                                          Air velocity, m/s
                                                                                                (Pa) Barley
                  2500                                                                          (Pa) Rye
                  2000                                                                           (Pa) Wheat
                                                                                                 (Pa) Rice
                  1500                                                                          (Pa) Maize

                  1000

                  500

                     0
                        Row 20 Row 22 Row 24 Row 26 Row 28 Row 30 Row 32 Row 34 Row 36 Row 38
                    Row 19 Row 21 Row 23 Row 25 Row 27 Row 29 Row 31 Row 33 Row 35 Row 37 Row 39
icient

-4 kg s^-n


                         1 2− n
   ∆ pbulk = c1 ⋅ h ⋅       ⋅v
                        ε 4


             Air velocity, m/s
             (Pa) Barley
             (Pa) Rye
              (Pa) Wheat
              (Pa) Rice
             (Pa) Maize


34 Row 36 Row 38
Row 35 Row 37 Row 39
1. Reading points from manufacturers chart
n, rpm       V_L          p stat      Referance points
      4000         1.11        3000   at 4000rpm were
      4000         1.81        2800   taken for                     3500
                                                                           3300
      4000         2.78        1800   Pressure and Air                               3150
      4000          3.8         400   Flow volume.                  3000                3000


2. Finding an equation via iteration                                2500 2526.56
                                                                                     2372.5

                                                                    2000
p_0             3300


                                                         Pressure
                                Value of the
c                150            cofficients are as
                                                               1500
m                2.20           follows, the red line
                                was fitted to the
          n1         n2         blue points by                 1000
n, rpm         4000       3500 constantly changing
                                these variables
V_L, m³/s p1, Pa     p2, Pa                                     500

        0       3300 2526.56
        1       3150     2372.5                                   0
                                                                     0       0.5     1         1.
        2 2610.78 1818.69
        3 1618.26        799.31
                                      Value of the p1 has been fitted to the
        4     133.18 -725.97
                                      reference points , using the given equation
                                      for p1. Then the transformation step was
                                      taken by using the second equation which
                                      is for p2. The values of all the cofficients
                                      ( p_0, c, m) has been obtained by hit and
                                      trail method.
Fanlines
 3300
                  3150
                     3000
                                  2800
                                     2610.78
 2526.56
                  2372.5


                                    1818.69          1800
                                                        1618.26


                                                        799.31

                                                                        400

                                                                          133.18

 0         0.5    1         1.5     2          2.5     3          3.5     4        4.5   5

                                     Air Volume
ted to the
 given equation
tion step was
quation which
he cofficients
ned by hit and
2                     2 −m
               n                n    
4.5   5
          p2 =  2
               n     ⋅ p0 − c ⋅  2
                                 n    
                                        
                                                    
                                                   V m p = p − c ⋅V m
                                                                   
                1                1                  1   0

− c ⋅V m
Airflow requirement                                           Given Preconditions                   3500
Airflow rate, m3/s                    1.50                             ( Target Line)
                                      1.50                0                                                  3000
                                      1.50             3500


                                                                      p_0 was constantly                     2500
  Reacting fan lines                                                  reduced to get the
p_0                                  1100                             required intersection of all
c                                      150                            the three lines,                       2000
m                                     2.20                            Final value of our
                                                                      coffecients, p_0,c and m
                            n1               n2                       are as follows.                        1500
n, rpm                               4000             3500

V_L, m³/s                   p1, Pa           p2, Pa                750 Pascals is the operationing           1000
                        0            1100        2526.56           pressure at 1.5mcu./sec Airflow
                        1             950          2372.5          will be achieved for Maize.
                        2          410.78        1818.69                                                     500
                        3         -581.74          799.31
                        4        -2066.82         -725.97
                                                                                                                0
                                                                                                                    0   0.5


      Resistance line
                                             Barley           Rye               Wheat          Rice
                                             Air flow resistance in bulk
                            Airflow rate,
                            m3/s           Pa                 Pa                Pa             Pa
                                      0.00                0                 0              0             0
                                      0.13               72                97             73            60
                                      0.25              178               238            180           148
                                      0.38              302               404            304           250
                                      0.50              439               587            442           363
                                      0.63              587               785            591           486
                                      0.75              743               995            749           615
                                      0.88              908              1215            916           752
                                      1.00             1081              1446           1089           894
                                      1.13             1259              1685           1269          1042
                                      1.26             1444              1932           1456          1195
                                      1.38             1635              2187           1648          1353
                                      1.51             1830              2449           1845          1515
                                      1.63             2031              2718           2048          1681
                                      1.76             2237              2993           2255          1851
                                      1.88             2446              3274           2466          2025
                                      2.01             2661              3560           2682          2202
                                      2.14             2879              3852           2902          2383
                                      2.26             3101              4149           3126          2567
                                      2.39             3327              4451           3353          2754
                                      2.51             3556              4758           3585          2944
3500


          3000


          2500


          2000
                                                                           Column D
                                                                           Column C
                                                                           Column G
          1500
                                                                           Column B

oning     1000
irflow
e.                             optimum
              500


                0
                    0          0.5       1   1.5   2   2.5   3   3.5   4        4.5   5


         Maize


         Pa
                           0
                          23
                          61
                         108
                         161
                         220
                         284
                         352
                         425
                         501
                         580
                         663
                         749
                         838
                         930
                        1024
                        1121
                        1220
                        1322
                        1426
                        1532
Column D
    Column C
    Column G
    Column B


4        4.5   5

Task 2 fan selection

  • 1.
    Dimensions of Values for all the Bin the storage constants were given in Diameter, m (2r) 4 structure the adjacent tabel. Bulk depth, m 4 (cylinder) Which were used in the given equation Physical properties Commodity barley rye wheat rice maize epsilon, poured 0.44 0.39 0.39 0.46 0.38 epsilon, shaken 0.4 0.35 0.36 0.42 0.36 c_1 Volume of 270 223 168 267 76 n Air/sec 0.7 0.7 0.7 0.7 0.6 (πr2 *vair ) Air flow resistance in bulk Air velocity, m/ Airflow rate, (Pa) s m3/s Barley (Pa) Rye (Pa) Wheat (Pa) Rice (Pa) Maize 0.0000 0.00 0 0 0 0 0 0.0100 0.13 72 97 73 60 23 0.0200 0.25 178 238 180 148 61 0.0300 0.38 302 404 304 250 108 0.0400 0.50 439 587 442 363 161 0.0500 0.63 587 785 591 486 220 0.0600 0.75 743 995 749 615 284 0.0700 0.88 908 1215 916 752 352 0.0800 1.00 1081 1446 1089 894 425 0.0900 1.13 1259 1685 1269 1042 501 0.1000 1.26 1444 1932 1456 1195 580 0.1100 1.38 1635 2187 1648 1353 663 0.1200 1.51 1830 2449 1845 1515 749 0.1300 1.63 2031 2718 2048 1681 838 0.1400 1.76 2237 2993 2255 1851 930 0.1500 1.88 2446 3274 2466 2025 1024 0.1600 2.01 2661 3560 2682 2202 1121 0.1700 2.14 2879 3852 2902 2383 1220 0.1800 2.26 3101 4149 3126 2567 1322 0.1900 2.39 3327 4451 3353 2754 1426 0.2000 2.51 3556 4758 3585 2944 1532
  • 2.
    r all the Commodity Coefficient Rel. pore volume Coeficient were given in n epsilon c1 ent tabel. poured shaken m^n-4 kg s^-n ere used in the ation Barley 0.7 0.44 0.4 270 Rye 0.7 0.39 0.35 223 Wheat 0.7 0.39 0.36 168 Rice 0.7 0.46 0.42 267 Maize 0.6 0.38 0.36 76 1 2− n ∆ pbulk = c1 ⋅ h ⋅ ⋅v ε 4 Resistance curves were 5000 plotted using the equation above for all the crops, Maize 4500 is the crop which was 4000 choosen for the final step. 3500 3000 Air velocity, m/s (Pa) Barley 2500 (Pa) Rye 2000 (Pa) Wheat (Pa) Rice 1500 (Pa) Maize 1000 500 0 Row 20 Row 22 Row 24 Row 26 Row 28 Row 30 Row 32 Row 34 Row 36 Row 38 Row 19 Row 21 Row 23 Row 25 Row 27 Row 29 Row 31 Row 33 Row 35 Row 37 Row 39
  • 3.
    icient -4 kg s^-n 1 2− n ∆ pbulk = c1 ⋅ h ⋅ ⋅v ε 4 Air velocity, m/s (Pa) Barley (Pa) Rye (Pa) Wheat (Pa) Rice (Pa) Maize 34 Row 36 Row 38 Row 35 Row 37 Row 39
  • 4.
    1. Reading pointsfrom manufacturers chart n, rpm V_L p stat Referance points 4000 1.11 3000 at 4000rpm were 4000 1.81 2800 taken for 3500 3300 4000 2.78 1800 Pressure and Air 3150 4000 3.8 400 Flow volume. 3000 3000 2. Finding an equation via iteration 2500 2526.56 2372.5 2000 p_0 3300 Pressure Value of the c 150 cofficients are as 1500 m 2.20 follows, the red line was fitted to the n1 n2 blue points by 1000 n, rpm 4000 3500 constantly changing these variables V_L, m³/s p1, Pa p2, Pa 500 0 3300 2526.56 1 3150 2372.5 0 0 0.5 1 1. 2 2610.78 1818.69 3 1618.26 799.31 Value of the p1 has been fitted to the 4 133.18 -725.97 reference points , using the given equation for p1. Then the transformation step was taken by using the second equation which is for p2. The values of all the cofficients ( p_0, c, m) has been obtained by hit and trail method.
  • 5.
    Fanlines 3300 3150 3000 2800 2610.78 2526.56 2372.5 1818.69 1800 1618.26 799.31 400 133.18 0 0.5 1 1.5 2 2.5 3 3.5 4 4.5 5 Air Volume ted to the given equation tion step was quation which he cofficients ned by hit and
  • 6.
    2 2 −m n  n  4.5 5 p2 =  2 n  ⋅ p0 − c ⋅  2  n    V m p = p − c ⋅V m   1   1  1 0
  • 7.
  • 8.
    Airflow requirement Given Preconditions 3500 Airflow rate, m3/s 1.50 ( Target Line) 1.50 0 3000 1.50 3500 p_0 was constantly 2500 Reacting fan lines reduced to get the p_0 1100 required intersection of all c 150 the three lines, 2000 m 2.20 Final value of our coffecients, p_0,c and m n1 n2 are as follows. 1500 n, rpm 4000 3500 V_L, m³/s p1, Pa p2, Pa 750 Pascals is the operationing 1000 0 1100 2526.56 pressure at 1.5mcu./sec Airflow 1 950 2372.5 will be achieved for Maize. 2 410.78 1818.69 500 3 -581.74 799.31 4 -2066.82 -725.97 0 0 0.5 Resistance line Barley Rye Wheat Rice Air flow resistance in bulk Airflow rate, m3/s Pa Pa Pa Pa 0.00 0 0 0 0 0.13 72 97 73 60 0.25 178 238 180 148 0.38 302 404 304 250 0.50 439 587 442 363 0.63 587 785 591 486 0.75 743 995 749 615 0.88 908 1215 916 752 1.00 1081 1446 1089 894 1.13 1259 1685 1269 1042 1.26 1444 1932 1456 1195 1.38 1635 2187 1648 1353 1.51 1830 2449 1845 1515 1.63 2031 2718 2048 1681 1.76 2237 2993 2255 1851 1.88 2446 3274 2466 2025 2.01 2661 3560 2682 2202 2.14 2879 3852 2902 2383 2.26 3101 4149 3126 2567 2.39 3327 4451 3353 2754 2.51 3556 4758 3585 2944
  • 9.
    3500 3000 2500 2000 Column D Column C Column G 1500 Column B oning 1000 irflow e. optimum 500 0 0 0.5 1 1.5 2 2.5 3 3.5 4 4.5 5 Maize Pa 0 23 61 108 161 220 284 352 425 501 580 663 749 838 930 1024 1121 1220 1322 1426 1532
  • 10.
    Column D Column C Column G Column B 4 4.5 5