Orifice and Venturi Meter Calibration Data Analysis
•Download as DOC, PDF•
0 likes•241 views

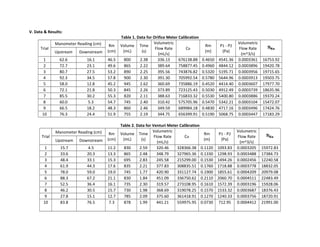
The document contains data from calibration tests of an orifice meter and a venturi meter. Table 1 shows data from 10 trials of the orifice meter calibration including upstream and downstream manometer readings, volume measured, time, calculated volumetric flow rates, and coefficient of discharge. Table 2 shows similar data from 10 venturi meter calibration trials. Figure 1 plots the orifice meter's coefficient of discharge against Reynolds number while Figure 2 plots its pressure drop against volumetric flow rate. Figures 3 and 4 show the same relationships for the venturi meter.

Recommended
More Related Content
Similar to Orifice and Venturi Meter Calibration Data Analysis
Similar to Orifice and Venturi Meter Calibration Data Analysis (20)
Orifice and Venturi Meter Calibration Data Analysis
- 1. V. Data & Results: Table 1. Data for Orifice Meter Calibration Manometer Reading (cm) Volumetric Volumetric Rm Volume Time Rm P1 - P2 Trial Flow Rate Co Flow Rate Upstream Downstream (cm) (mL) (s) (m) (Pa) (mL/s) (m^3/s) 1 62.6 16.1 46.5 800 2.38 336.13 676138.88 0.4650 4541.36 0.0003361 16753.92 2 72.7 23.1 49.6 865 2.22 389.64 758877.45 0.4960 4844.12 0.0003896 19420.78 3 80.7 27.5 53.2 890 2.25 395.56 743876.82 0.5320 5195.71 0.0003956 19715.65 4 92.3 34.5 57.8 900 2.30 391.30 705992.54 0.5780 5644.96 0.0003913 19503.75 5 58.0 12.8 45.2 945 2.62 360.69 735886.19 0.4520 4414.40 0.0003607 17977.70 6 72.1 21.8 50.3 845 2.26 373.89 723125.43 0.5030 4912.49 0.0003739 18635.96 7 85.5 30.2 55.3 820 2.11 388.63 716833.32 0.5530 5400.80 0.0003886 19370.24 8 60.0 5.3 54.7 745 2.40 310.42 575705.96 0.5470 5342.21 0.0003104 15472.07 9 66.5 18.2 48.3 860 2.46 349.59 689984.18 0.4830 4717.16 0.0003496 17424.76 10 76.3 24.4 51.9 755 2.19 344.75 656399.91 0.5190 5068.75 0.0003447 17183.29 Table 2. Data for Venturi Meter Calibration Manometer Reading (cm) Volumetric Volumetric Rm Volume Time Rm P1 - P 2 Trial Flow Rate Co Flow Rate Upstream Downstream (cm) (mL) (s) (m) (Pa) (mL/s) (m^3/s) 1 15.7 4.5 11.2 830 2.59 320.46 328366.38 0.1120 1093.83 0.0003205 15972.83 2 33.6 20.3 13.3 865 2.48 348.79 327965.36 0.1330 1298.93 0.0003488 17384.73 3 48.4 33.1 15.3 695 2.83 245.58 215299.00 0.1530 1494.26 0.0002456 12240.58 4 61.9 44.3 17.6 835 2.21 377.83 308835.51 0.1760 1718.88 0.0003778 18832.05 5 78.0 59.0 19.0 745 1.77 420.90 331127.74 0.1900 1855.61 0.0004209 20979.08 6 88.3 67.2 21.1 830 1.84 451.09 336750.62 0.2110 2060.70 0.0004511 22483.49 7 52.5 36.4 16.1 735 2.30 319.57 273108.95 0.1610 1572.39 0.0003196 15928.06 8 46.2 30.5 15.7 730 1.98 368.69 319078.25 0.1570 1533.32 0.0003687 18376.43 9 27.8 15.1 12.7 785 2.09 375.60 361418.91 0.1270 1240.33 0.0003756 18720.91 10 83.8 76.5 7.3 878 1.99 441.21 559975.95 0.0730 712.95 0.0004412 21991.00
- 2. Figure 1. Plot of the relationship of coefficient of discharge Figure 2. Plot of the relationship of pressure drop using orifice meter of orifice meter and Reynold’s number and volumetric flo w rate Figure 3. Plot of the relationship of coefficient of discharge Figure 4. Plot of the relationship of pressure drop using venturi meter of venturi meter and Reynold’s number and volumetric flo w rate