Download to read offline
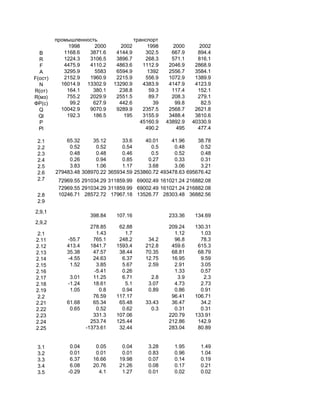


The document appears to contain statistical data in tables across multiple years (1998, 2000, 2002). The data seems to cover topics like transportation, industry, resources, and more. Specifically, it includes metrics like production amounts, transportation amounts, resources amounts, percentages, and population. The data is broken down by category and year.


