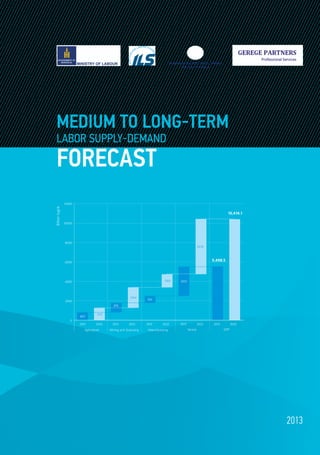
The document forecasts Mongolia's labor supply and demand from 2013 to 2022. It projects that the total labor force will increase from 1.8 million in 2012 to 2.1 million in 2022, with the largest growth in the 30-54 age group. Employment is forecasted to rise fastest in the services sector, increasing from 567,800 jobs in 2012 to 1,360,400 in 2022. Unemployment is expected to remain steady between 6-7% during the forecast period.
One of the most pressing problems facing the Kenyan economy is the high rates of unemployment,
which has been erratic over the past few years. To examine the existing relationship between unemployment and
economic growth, this paper employed Johansen Cointegration, error correction mechanism (ECM),
This study evaluates the role of capital accumulation on labour productivity growth in Nigeria. Endogenous growth and efficiency wage theories are employed in explaining the determinants of labour productivity. The ordinary least squares method of estimation employed to evaluate the effect of capital accumulation on labour productivity and employment generation in Nigeria over the time frame of 1970-2014. The findings of this study include: education expenditure and capital formation’s impact on labour productivity growth is time dependent; health expenditure positively impacts labour productivity growth; compensation to employee negatively impacts productivity growth in Nigeria.
Determinants of Total Asset Growth in Micro and Small-Scale Enterprise in Gon...Premier Publishers
This study assessed the determinants of total asset growth of micro and small-scale enterprises in Gondar city of Amhara regional state, and more specifically; to find out the major constraints which affect the total asset growth of the sector. In this study, both primary and secondary sources were employed to gather the data. The primary data were collected by questionnaire. These methods were helpful in collecting information from operators of micro and small-scale enterprise in the organization of the sector. The secondary data had been collected from published and unpublished documents and also collected from bureau of MSE in Gondar city. For this study, simple random sampling technique was employed to select kebeles administrations in the study area. In addition, stratification sampling technique was employed based on types of micro and small-scale enterprises (construction, trade, associations, service and manufacturing). In this study the data was analyzed by using descriptive statistics and econometric model (multiple linear regression models). The result this study education, interest and working premise are most significant factors that affect the total asset growth of MSEs in the study area. Finally, the study suggesting that any interventions designed to increase the total asset growth of micro and small-scale enterprises in the study area.
The National Human Resource Development Planning Framework For Uganda DeborahAyebare
This framework provides for mechanisms to guide the
assessment of the current and future human resource (HR) requirements and trends in the different sectors of the economy. This is in a bid to meet the country’s short-term, medium term and long-term HR requirements.
In this white paper, we talk about the century-old trade and cultural relationships between United Kingdom and Telangana which makes these 2 regions natural allies for fostering trade. United kingdom’s knowledge centric, research industries specifically in the pharmaceutical sector, should aim to capitalize the impetus provided by the Telangana state to promote life science industries, “Pharma city” and “Pharma University”.
The organized sector in India created 704,800 jobs between January 2011 and June 2011 and 369,200 more jobs are expected to be created by September 2011, according to the latest findings of Ma Foi Randstad Employment Trends Survey – Wave2.
The survey was conducted among 690 companies across 13 industry segments panning 8 Indian cities. The respondents included members of senior management and HR professionals who were questioned on specific areas relating to hiring plans across various timelines, manpower requirements for the current quarter vis-à-vis the last two quarters, and their views on how they see the job market to be in the year 2011. While the Indian economy is passing through a delicate phase with certain sectors looking at a bleak market in the near future, there are others who have performed well and continue to perform as per predictions made in the beginning of the year, thus reflecting buoyancy among employers.
According to the survey, the Healthcare sector has remained the largest employment generator with 1, 15,000 jobs created in H1, followed by the Hospitality sector with 94,000 jobs created during the same period. The IT/ITeS sector, which witnessed a turnaround in 2010-11 by posting a double digit growth, continues to grow at the same pace and has added 91,000 jobs in H1. In the cities, New Delhi, Mumbai and Chennai continue to lead the job market job generating 1,39,700 jobs between January and June 2011, as predicted earlier this year
This study aims to analyze the effect of foreign direct investment (FDI) on new job creation, and pays attention to factors interrelated to employment by using the case of Afghanistan. Using time series data form 2003 to 2017, this paper explore the driving forces and reduction potentials of employment in Afghanistan with consideration for dynamic changes within the traditional OLS and standardize OLS model. The results show that exchange rate plays a dominant role in increasing employment in Afghanistan. And exports and inflation rate plays a dominant role in decreasing employment in Afghanistan. All variables are co-integrated and the analysis of the impulse response function and variance decomposition turns out to be synchronous. Furthermore, in the short run export and inflation rate are more critical in reduction potentials of employment in Afghanistan. Policies should be advised to control inflation rate and illegal export and improve the investment projects to attract more FDI into the economy for quick adjustment purpose in case of the shock to the system.
Impact of Commercial Banking on Nigeria Industrial Sectorijtsrd
This study examines the impact of commercial banking on Nigeria industrial sector using secondary data covering the period of 1980 2018 that were obtained from the Central Bank of Nigeria. The model's estimates were estimated via multiple econometric model of the ordinary least square to determine the effect of commercial bank credit to industrial sector, inflation, infrastructure, exchange rate, interest rate, labour force and bank capital on industrial sector proxied by industrial output. The results show that commercial bank credits to industrial sector, infrastructure, inflation, labour and bank capital have a positive impact on industrial sector while exchange rate has a negative impact on industrial sector but conforms to the a priori expectation. The study also found out that only commercial bank credits to industrial sector and infrastructure were significant in explaining industrial sector growth while other variables used in the study were all found to be non significant in explaining the growth rate of the industrial sector. The study concludes that adequate commercial banks credit intermediation in the industrial sector and government expenditure on the needed infrastructure will enhance the sector performance. Onwuteaka, Ifeoma Cecilia PhD | Molokwu, Ifeoma Mirian | Aju Gregory. C. ""Impact of Commercial Banking on Nigeria Industrial Sector"" Published in International Journal of Trend in Scientific Research and Development (ijtsrd), ISSN: 2456-6470, Volume-3 | Issue-3 , April 2019, URL: https://www.ijtsrd.com/papers/ijtsrd23140.pdf
Paper URL: https://www.ijtsrd.com/management/-/23140/impact-of-commercial-banking-on-nigeria-industrial-sector/onwuteaka-ifeoma-cecilia-phd
An Econometric Modeling of Development Process using Artificial Neural Networ...IJERDJOURNAL
Abstract: In developing nations GDP is not considered an adequate proxy of development. The per capita income, the quality of life , level of education are considered more relevant parameters of overall development. Economists, planners and researchers have been deliberating on this issue until in 1990 UNDP published Human Development Index [HDI] for all nations in its HDR report [6]. Although there have been several studies in this regard, however a machine learning based econometric model is not yet available which can establish the inter-relationship amongst these two variables in a quantified manner. This paper is an attempt in this direction to develop a model using machine learning approach .The model is implemented using Neural Network toolbox on MATLAB platform[10] with statistical data available from Planning Commission ,India and HDR report of UNDP. The model implementation result is found to be satisfactory. The methodology shown in this paper will be useful in preparing economic planning of India and other developing countries.
Analysing the impact MGNREGA has had on the lives of some poor indigenous tribal families of Gujarat; income, employment and migration pattern that epitones their economic life.
This report investigates student awareness, interests and aspirations around general and vocational education. Using a survey administered to students from class 10 to undergraduate students in four town of four district of Odisha (Khurdha-Bhubaneswar, Cuttack, Bhadrak and Jajpur), we attempt to gain a better understanding of student aspirations, awareness levels, sources of information, key stakeholders and factors that influence their education and career choices. We then map student interests against sectors that are slated to experience the highest growth in terms of job creation. Our results indicate aspirations of students are largely misaligned with the needs of the Indian economy. It is important to create opportunities, generate awareness about various career options and the respective pathways available to realize career goals. The report outlines the key strategic options that can be considered to bolster the country’s response towards creating a skill development system that is responsive both to the aspirations of the youth and needs of industry.
Human Resource Training and Employee Performances in Enugu State, Nigeriaiosrjce
This research examined human resource development, employee Performances and training (HRTD)
in Enugu State Public Service with a focus on five ministries. Its relevance was based on the importance of
human resource training and development towards employee’s effective and efficient performances. This is with
the view that in Enugu State, the government set four (4) Point Agenda and Economic Programmes (EN: Vision
4:2020) which has to be achieved through the efforts of Employees in Ministries, Departments and Agencies
(MDAs). The rationale for this research was also based on the fact that HRTD has lot of effect/implication on
employee job performance for which its lack can be very devastating on organizations (MDAs) total
productivity. Summarily “a nation’s greatest asset is its Human Resource’’. Total population of the various
MDAs used for the survey was 780, while 264 was the sample size and questionnaires were distributed to the
264 sample in the study area. Two hundred and fifty (250) questionnaires were collected back and analyzed.
The data was presented in tabular form under frequencies and percentages were adopted as statistical tool, also
both secondary and primary data were utilized for analysis. The data analyzed revealed that human resource
development and training programme exists in Enugu State Public Service and Employees performances are
positively affected by these HRTD. That is to say there is an effect on employee job performance. Also that these
HRTD programmes available for employees job enhancement has also improved ministerial output, thereby,
enabling the state government to achieve their set economic and social objectives.
International Journal of Humanities and Social Science Invention (IJHSSI)inventionjournals
International Journal of Humanities and Social Science Invention (IJHSSI) is an international journal intended for professionals and researchers in all fields of Humanities and Social Science. IJHSSI publishes research articles and reviews within the whole field Humanities and Social Science, new teaching methods, assessment, validation and the impact of new technologies and it will continue to provide information on the latest trends and developments in this ever-expanding subject. The publications of papers are selected through double peer reviewed to ensure originality, relevance, and readability. The articles published in our journal can be accessed online.
Abstract
Performance of firms either public or private sector largely depends on employees’ satisfaction hence their satisfaction need to be taken with utmost seriousness if firms’ immediate and strategic objectives must be attained. This study titled integrated personnel payroll and information system and employees’ satisfaction is carried out to examine the impact of integrated personnel payroll and information system on employees’ satisfaction. The research adopts research survey design and respondents were reached using a structured questionnaire. The population of the study is 1100 who are employees of the Federal Polytechnic Idah, Kogi state. The study adopts Godden sample size statistical formula which generated a sample size of 285. However, out of the total of 285 questionnaires distributed only 242 were duly completed and returned giving a retrieval rate of 85%. The data were analyzed using a five point’s likert scale and the analytical tool is linear regression analysis. The finding revealed that adoption of integrated personnel payroll and information system has serve as a veritable tool in enshrining accountability but has threatened employees’ satisfaction owing to its non-domestication to carter for the peculiarity of the Polytechnic sector. Thus, the study recommends that adoption of the payroll system be reviewed and all critical stakeholders be consulted so as to enhanced and sustained employees satisfaction.
Keywords: Personnel, payroll, employee, satisfaction.
RPD Bites is a monthly scan covering issues and trends surfaced in various local mainstream media sources that would be of relevance to the Malay/Muslim community.
It is compiled by the Research and Planning Department (RPD) of Yayasan MENDAKI.
The key highlights for this month are:
• The Education Ministry has announced measures to facilitate the rollout of new Primary School Leaving Examination (PSLE) Scoring system that takes effect in 2021. To familiarise parents and pupils with the new PSLE scoring system, Primary 5 pupils will be graded using the new scoring system from 2020.
• By October 2019, more Singaporeans will benefit from healthcare subsidies under the revised income criteria. The Health Ministry will raise the income ceilings for various schemes like MediShield Life premiums and drug subsidies.
• In line with Deputy Prime Minister Heng Swee Keat's vision for the Government to partner Singaporeans to design and implement policies together, Minister-in-charge of Muslim Affairs Masagos Zulkifli announced the launch of the Co-creation@M³ / CiptaSama@M³ series of engagements. This is a platform for Malay/Muslims to share their views on national issues in a forward-looking way.
A look at the Contingent Workforce Environment in AsiaSameer Srivastava
Shares overview of the current contingent workforce scenario in China, India, Indonesia, Malaysia, Japan, Singapore and South Korea. Has details on Contingent Workforce Regulations and demographic details which include legal, GDP, languages and information on the major industries.
Evaluation of Human Resource Management Practices on the Productivity and Per...IOSR Journals
The objective of any organization or firm is to achieve higher productivity. The concept of Human Resources within organizations is very vital in the management and survival of any organization; this is because their performance is influenced by a set of human resource practices. The main focus of this study is to determine if human resources management practices (Human resources (HR) Planning, training and development) affect productivity and performance of Transport Organizations. The human resource management practices or HRM practices have to be addressed in this position, in order to examine productivity and performance of the organization. In analyzing the data, both descriptive and inferential statistics were used. A total of 75 questionnaires was distributed out of which 60 was returned. Result of analysis showed that training and development enhances productivity of transport organizations and also adequate human resources planning promotes employee productivity and organizational performance. It is therefore recommended that all level of employees receive adequate training and proper human resource planning should be in place to promote productivity and performance of the Transport industry in Nigeria.
Wage System Manufacturing Company: Normative and ExpectationsHendra Gunawan
The study determine the wages models applied by the company in Batam which is expected to provide a wide range of reference models in different strata of wage and cluster companies. It is also expected to help the local government as a factor in determining the minimum wage policy making through recommendations wages models are ideal in Batam. Data was collected using interview techniques to the manufacturing industry in three related units in a company that is human resource, administrative staff and production staff. The results of the study were analyzed qualitatively to explore models that have been applied and the desire of employees. The model has been applied to remuneration in accordance with the general models that already exist, but there are still some wishes of the employees on the compensation of employees in the company they both administrative and production employees. Researchers also analyzed employee satisfaction with the existing system and the results are most of the employees did not feel satisfed with the remuneration system.
Progressive India in Output and Employmentectijjournal
Keeping in view, the limitations present in literature, we try to analyze for, the pattern of growth of output and employment and its determinants in Organised Manufacturing Sector in India. States which contribute to more than eighty percent of the total output and employment in India are considered. We use Gross Value Added and Total Output for the indicator measuring for Output. Total persons engaged and Labour Index are the indicators for Employment. This is one of our major contributions to literature. The research design of the study is based on secondary data. The findings reveal the impact of New Economic Policy across India as a whole and the impact of Global financial crisis across selected states. Liberalization has been able to make a significant positive impact while Global financial crisis had no effective impact. Employment growth has been positive after liberalization. This has also been observed through structural breaks. Over the period of Study, there has been increase in the number of states with a rising growth rate. Output Elasticity of employment has proved the job creating capability of each state as of India as a whole. In addition to these, we have observed the effect of determinants of output and employment growth across States. Thus, our work is a concise study on the two main parameters of the Indian economy which shall enrich the existing literature as well as policy makers for progressive development and a sustainable development of our nation.
How to Make a Field invisible in Odoo 17Celine George
It is possible to hide or invisible some fields in odoo. Commonly using “invisible” attribute in the field definition to invisible the fields. This slide will show how to make a field invisible in odoo 17.
2024.06.01 Introducing a competency framework for languag learning materials ...Sandy Millin
http://sandymillin.wordpress.com/iateflwebinar2024
Published classroom materials form the basis of syllabuses, drive teacher professional development, and have a potentially huge influence on learners, teachers and education systems. All teachers also create their own materials, whether a few sentences on a blackboard, a highly-structured fully-realised online course, or anything in between. Despite this, the knowledge and skills needed to create effective language learning materials are rarely part of teacher training, and are mostly learnt by trial and error.
Knowledge and skills frameworks, generally called competency frameworks, for ELT teachers, trainers and managers have existed for a few years now. However, until I created one for my MA dissertation, there wasn’t one drawing together what we need to know and do to be able to effectively produce language learning materials.
This webinar will introduce you to my framework, highlighting the key competencies I identified from my research. It will also show how anybody involved in language teaching (any language, not just English!), teacher training, managing schools or developing language learning materials can benefit from using the framework.
The Roman Empire A Historical Colossus.pdfkaushalkr1407
The Roman Empire, a vast and enduring power, stands as one of history's most remarkable civilizations, leaving an indelible imprint on the world. It emerged from the Roman Republic, transitioning into an imperial powerhouse under the leadership of Augustus Caesar in 27 BCE. This transformation marked the beginning of an era defined by unprecedented territorial expansion, architectural marvels, and profound cultural influence.
The empire's roots lie in the city of Rome, founded, according to legend, by Romulus in 753 BCE. Over centuries, Rome evolved from a small settlement to a formidable republic, characterized by a complex political system with elected officials and checks on power. However, internal strife, class conflicts, and military ambitions paved the way for the end of the Republic. Julius Caesar’s dictatorship and subsequent assassination in 44 BCE created a power vacuum, leading to a civil war. Octavian, later Augustus, emerged victorious, heralding the Roman Empire’s birth.
Under Augustus, the empire experienced the Pax Romana, a 200-year period of relative peace and stability. Augustus reformed the military, established efficient administrative systems, and initiated grand construction projects. The empire's borders expanded, encompassing territories from Britain to Egypt and from Spain to the Euphrates. Roman legions, renowned for their discipline and engineering prowess, secured and maintained these vast territories, building roads, fortifications, and cities that facilitated control and integration.
The Roman Empire’s society was hierarchical, with a rigid class system. At the top were the patricians, wealthy elites who held significant political power. Below them were the plebeians, free citizens with limited political influence, and the vast numbers of slaves who formed the backbone of the economy. The family unit was central, governed by the paterfamilias, the male head who held absolute authority.
Culturally, the Romans were eclectic, absorbing and adapting elements from the civilizations they encountered, particularly the Greeks. Roman art, literature, and philosophy reflected this synthesis, creating a rich cultural tapestry. Latin, the Roman language, became the lingua franca of the Western world, influencing numerous modern languages.
Roman architecture and engineering achievements were monumental. They perfected the arch, vault, and dome, constructing enduring structures like the Colosseum, Pantheon, and aqueducts. These engineering marvels not only showcased Roman ingenuity but also served practical purposes, from public entertainment to water supply.
Honest Reviews of Tim Han LMA Course Program.pptxtimhan337
Personal development courses are widely available today, with each one promising life-changing outcomes. Tim Han’s Life Mastery Achievers (LMA) Course has drawn a lot of interest. In addition to offering my frank assessment of Success Insider’s LMA Course, this piece examines the course’s effects via a variety of Tim Han LMA course reviews and Success Insider comments.
Unit 8 - Information and Communication Technology (Paper I).pdfThiyagu K
This slides describes the basic concepts of ICT, basics of Email, Emerging Technology and Digital Initiatives in Education. This presentations aligns with the UGC Paper I syllabus.
Instructions for Submissions thorugh G- Classroom.pptxJheel Barad
This presentation provides a briefing on how to upload submissions and documents in Google Classroom. It was prepared as part of an orientation for new Sainik School in-service teacher trainees. As a training officer, my goal is to ensure that you are comfortable and proficient with this essential tool for managing assignments and fostering student engagement.
Acetabularia Information For Class 9 .docxvaibhavrinwa19
Acetabularia acetabulum is a single-celled green alga that in its vegetative state is morphologically differentiated into a basal rhizoid and an axially elongated stalk, which bears whorls of branching hairs. The single diploid nucleus resides in the rhizoid.
The French Revolution, which began in 1789, was a period of radical social and political upheaval in France. It marked the decline of absolute monarchies, the rise of secular and democratic republics, and the eventual rise of Napoleon Bonaparte. This revolutionary period is crucial in understanding the transition from feudalism to modernity in Europe.
For more information, visit-www.vavaclasses.com
Model Attribute Check Company Auto PropertyCeline George
In Odoo, the multi-company feature allows you to manage multiple companies within a single Odoo database instance. Each company can have its own configurations while still sharing common resources such as products, customers, and suppliers.
Embracing GenAI - A Strategic ImperativePeter Windle
Artificial Intelligence (AI) technologies such as Generative AI, Image Generators and Large Language Models have had a dramatic impact on teaching, learning and assessment over the past 18 months. The most immediate threat AI posed was to Academic Integrity with Higher Education Institutes (HEIs) focusing their efforts on combating the use of GenAI in assessment. Guidelines were developed for staff and students, policies put in place too. Innovative educators have forged paths in the use of Generative AI for teaching, learning and assessments leading to pockets of transformation springing up across HEIs, often with little or no top-down guidance, support or direction.
This Gasta posits a strategic approach to integrating AI into HEIs to prepare staff, students and the curriculum for an evolving world and workplace. We will highlight the advantages of working with these technologies beyond the realm of teaching, learning and assessment by considering prompt engineering skills, industry impact, curriculum changes, and the need for staff upskilling. In contrast, not engaging strategically with Generative AI poses risks, including falling behind peers, missed opportunities and failing to ensure our graduates remain employable. The rapid evolution of AI technologies necessitates a proactive and strategic approach if we are to remain relevant.
How libraries can support authors with open access requirements for UKRI fund...
Medium to long-term labor supply-demand forecast
1. human resources development
service of korea
Medium to Long-term
LABOR SUPPLY-DEMAND
FORECAST
Billion tugrik
12000
10,414.1
10000
8000
5678
5,498.5
6000
1360
4000
2104
2000
3010
705
976
807
1272
0
2012
2022
Agriculture
2012
2022
Mining and Quarrying
2012
2022
Manufacturing
2012
2022
Service
2012
2022
GDP
2013
2. Medium to Long-term LABOR SUPPLY-DEMAND FORECAST
Foreword
We have developed a medium to long-term
labor market forecasting (pilot) model for
Mongolia for the first time. The timing of this
model development coincides with the structural
changes in population and the rapid economic
growth expected in the country which require
changes in labor policies on the labor force
participation rate and labor productivity.
We have forecasted major changes in the labor
market until 2022 in terms of 19 industries and
10 major occupational groups using the model.
One of the major objectives of labor policies is
to promote inclusive growth by developing the
national labor force. It implies to improve the
higher and vocational education system, and
labor productivity in industries.
On the other hand, labor studies provide
school leavers and the current labor force with
information on the choices of occupation and
directions to enhance their skills.
We will be working to promote the forecast
results for policy making and information
purposes. In 2014, we have two objectives to
improve the forecast. First, the forecast will be
based on the sub-classifications of industries
and sub-groups of occupations. As a result,
there will be more detailed information for a
policy making purpose. Second, we will consider
various policy scenarios so that we will be able to
forecast the effects of proposed policy changes
on the labor market outcomes.
During the period in which we publicized
the results of the pilot model, the President
of Mongolia initiated the manifesto on the
principles of a smart government and the
government reported that it would keep a policy
not to increase the number of government
employees. When we introduce these policy
changes in the model, the forecast results would
be quite different as the additional employees
in the government sector forecasted by the pilot
model would have to be allocated across the
other industries.
It is important to maintain the capacity building
taking place in the modelling and forecasting
sector at the Institute of Labour Studies and
develop its cooperation with other advisory
organizations.
I would like to thank the officials at the
Ministry of Labour of Mongolia and Ministry of
Employment and Labor of the Republic of Korea
who supported our work.
1
3. Medium to Long-term LABOR SUPPLY-DEMAND FORECAST
I would also like to congratulate to Human
Resources Development Services of Korea
and “Gerege Partners” LLC on their successful
collaborations with us.
I hope that you will find the forecast results
useful for the purposes of policy making and
information providing leading to the efficient
allocation of national human recourses.
CHIMEDDORJ MUNKHJARGAL
Director of Institute for Labour Studies
2
4. Medium to Long-term LABOR SUPPLY-DEMAND FORECAST
Table of Contents
Chapter 1. Medium to Long-term Labor Supply-Demand Forecast
Introduction and Method
1.
2.
3.
4.
Significance of labor supply-demand forecasting.............................................................. 5
Forecasting procedure and method.................................................................................... 5
Statistical data used for forecasting....................................................................................7
Work required to be undertaken further............................................................................7
Chapter 2. Major Results of the 2013-2022 Medium to Long-term Forecast
1.
2.
3.
4.
Labor force forecast........................................................................................................... 9
Employment forecast by industries................................................................................... 16
Employment forecast by occupation................................................................................. 21
Unemployment rate forecast.............................................................................................25
3
5. Medium to Long-term LABOR SUPPLY-DEMAND FORECAST
Chapter 1
Medium to Long-term Labor
Supply-Demand Forecast
Introduction and Method
4
6. Medium to Long-term LABOR SUPPLY-DEMAND FORECAST
1
Significance of labor supply-demand
forecasting
Labor supply-demand forecasting acts as a signal
that prevents and alleviates likely imbalances in
the labor market. One type of an imbalance in
the labor market is labor force with a university
degree is unable to find suitable employment
opportunities for an extended period of
time. The main reason for such a situation is
asymmetric employment information between
labor providers and employers. In this case,
the supply-demand forecast acts as a signal
that contributes to the efficient development
and allocation of national human resources. In
general, the forecast performs both a policy
function and an information function. The policy
function: the forecast acts as the main data for
the government policies on employment, industry
and education (human resources development).
The information function: the data provided
by the forecast is used for decision making
2
on career or occupation selection. Through its
information function, the forecast assists the
labor market entrants to reach rational decisions
which improve the efficiency of the labor
market.
In this respect, a need to develop a labor market
projection system for Mongolia has arisen. The
development of this system has been initiated
by the Institute of Labor Studies of the Ministry
of Labor and the first pilot model of the labor
market and its results are presented in this report.
On the pilot model, two consultancy teams have
participated as well. The national consultant is a
team of economists from Gerege Partners LLC
the main role of which was to carry out the
model simulations. The international consultant
is a team of labor market experts of HRD Korea
advised on the model development.
Forecasting procedure and method
The medium to long-term forecast consists of
the following two parts:
§ labor supply forecasting (labor force
forecasting)
§ labor demand forecasting (employment
forecasting).
Figure 1-1 shows the sequence of steps to carry
out the medium to long-term forecast. This
is the simplified version of the Korean labor
supply-demand forecasting system.
1 The Korean model is the adaptation of the US Bureau of Labor Statistics model.
5
7. Medium to Long-term LABOR SUPPLY-DEMAND FORECAST
Figure 1-1. Medium to long-term labor market forecasting system
Working age population forecasting
GDP by industries
Labor force participation rate forecasting
Employment coefficient forecasting
(by industries)
Economically active population forecasting
(Labor supply)
Employment forecasting by industries and
in aggregate (Labor demand)
Labor supply-demand forecasting
“Industry-occupation” matrix forecasting
Based on the population forecast, the labor
supply forecasting initially projects 1) the
working age population (15 and older), 2)
the labor force participation rate, and 3) the
economically active population. In particular, the
working age population and the economically
active population are determined by age (age
strata in five-year increments) and gender
(male, female). The forecast period is 10 years.
The employment forecasting calculates 1) the
employment size in aggregate and by industries
by using projected industry growth rates and
the employment coefficients (the inverse of
6
labor productivity) by industries. Next, 2)
the employment by industries is converted to
employment by occupations using the forecast
of the industry-occupation matrix. Finally, 3) the
labor force forecast and employment forecast
results are used to calculate the economy’s total
unemployment rate and employment rate. The
employment forecast is disaggregated by 19
industries as well as by 10 major occupational
groups of National Statistical Office (NSO)
of Mongolia. The forecast period for the
employment is 10 years, the same as that for the
labor force forecast.
8. Medium to Long-term LABOR SUPPLY-DEMAND FORECAST
3
Statistical data used for forecasting
Basic statistical data used for the forecasting
includes the International Monetary Fund
(IMF)’s GDP projections for Mongolia, the NSO’s
population growth projection, the NSO’s labor
force survey and the NSO’s GDP by industries
(for a detailed description, refer to Table 1-1).
The NSO’s population growth projections, in
particular, the Medium Fertility Scenario (2B) is
used for the labor supply forecast. The working
age population is the total number of people
who are aged 15 years of age and over and
is determined by using the NSO’s labor force
survey (LFS). The economically active population
is also derived from the LFS and is the sum of
employed and unemployed population.
The IMF’s GDP projections, the share of each
industry’s GDP in the country’s aggregate GDP in
the NSO’s statistical reports and the data on the
number of employees in each industry in the LFS
reports are used for the employment forecast.
Table 1-1. Statistical data used for the forecasting
Indicators
Population projection
Working age population
Economically active population
GDP by industries
Employment by industries
Employment by occupations
by major groups
4
Source
Renewed population growth
projection /2010-2040/
Labor force survey
Labor force survey
National income
GDP projections
Labor force survey
Labor force survey
Prepared by
Comment
NSO
by age and gender
NSO
NSO
NSO
IMF
NSO
NSO
by age and gender
by age and gender
by main industries
in total
by main industries
ҮАМАТ-08 /ISCO-08/
Work required to be undertaken
further
As mentioned above, the pilot model for the
medium to long-term labor supply-demand
forecast of Mongolia has been developed through
this project. From the experience of the Korean
labor market studies, the extension of this model
is possible as well as required. For example, the
employment forecast by sub-industries and sub-
occupational groups will generate more detailed
information. Also, by determining labor supply
by each occupational group and forecasting
the labor market for each occupational group,
the entrants in the labor market and school
leavers will have an opportunity to choose their
occupations rationally.
7
9. Medium to Long-term LABOR SUPPLY-DEMAND FORECAST
Chapter 2
Major Results of the 2013-2022
Medium to Long-term Forecast
8
10. Medium to Long-term LABOR SUPPLY-DEMAND FORECAST
1
Labor force forecast
The labor force (or labor supply) forecast has been carried out in accordance with the following
three steps.
Figure 2-1. Process for aggregate labor supply forecast
Population Trend and
Projection
(by age, 15 and older)
Participation Rate
Projection
We forecast the labor force (or the economically
active population) of Mongolia until 2022 by
using the historical data on the economically
active population and the working age (15 and
older) population and labor force participation
rates.
A. Working age population forecast
The annual “labor force survey” (LFS) reports
the actual working age population who are 15
years of age and older. However LFS does not
forecast the working age population. To forecast
the working age population, we use the NSO’s
population growth projection 2010-2040. The
projection is based on “Population and Housing
Census - 2010” and has six scenarios for each
age group because of different projections of
Economically Active
Population (Labor Force)
Projection
fertility rate, mortality rate and net migration.
The projected 15 and older population until 2022
from the Medium Fertility Scenario or 2B – the
most suitable scenario of the population growth
projections - has been used in this study. The
projected 15 and older population from the NSO’s
projected population growth could not be taken
and used straight away due to methodological
difference of the LFS - the size of the working
age population in the LFS tends to be smaller
than the population of 15 and older reported
in the statistical yearbooks. Therefore, it was
required to adjust the forecast of the 15 and
older population until 2022 by forecasting this
difference.
9
11. Medium to Long-term LABOR SUPPLY-DEMAND FORECAST
Figure 2-2. Projected 15+ population (by gender, age groups, 1000 people, 2000-2022)
Male
Female
Male
Female
65+
50-54
45-49
45-49
40-44
40-44
35-39
35-39
30-34
30-34
25-29
25-29
20-24
20-24
15-19
50
55-59
50-54
50
60-64
55-59
150
65+
60-64
15-19
150
150
50
2000*
Male
50
150
2012**
Female
Male
Female
65+
40-44
35-39
35-39
30-34
30-34
25-29
25-29
20-24
20-24
15-19
150
45-49
40-44
50
50-54
45-49
2017***
55-59
50-54
50
60-64
55-59
150
65+
60-64
15-19
150
50
50
150
2022***
* Source: “Annual Population Employment Reports” submitted by aimags and UB offices of NSO.
** Source: NSO’s labor force survey
*** Projections
10
12. Medium to Long-term LABOR SUPPLY-DEMAND FORECAST
Table 2-1. Projected 15+ population (by age groups, 2002-2022) (unit: 1000 people, %)
Population
(1000)
(%)
Growth
/Decline
(1000)
Annual average
growth rate
(%)
2007
2012
2017
2022
2007
2012
2017
2022
‘07-’12
‘12-’17
‘17-’22
‘07-’12
‘12-’17
‘17-’22
Total
15+
15-64
1632
1529
1812
1700
1982
1872
2139
1993
100.0
93.7
100.0
93.8
100.0
94.5
100.0
93.2
180
171
169
173
157
121
2.1
2.1
1.8
2.0
1.5
1.3
The age group of 30-54 years, which has the
highest employment rate, is forecasted to
increase by 2.3 percent in the first half and by
2.2 in the second half of the projected period.
This group will be expanded by 21,900 people
annually in the period of 2012-2022.
Table 2-1 shows that the 15-64 population will
have a roughly constant share of 93-94 percent
in the total population in 2007-2022. The share
of young people of 15-29 years of age in the
total population has been declining constantly
in the last ten years and this trend is likely to
continue until 2022.
15-29
664
670
693
642
40.7
36.9
35.0
30.0
6
23
-51
0.2
0.7
-1.5
30-54
758
881
989
1100
46.4
48.6
49.9
51.4
123
108
111
3.1
2.3
2.2
55+
210
261
301
397
12.9
14.4
15.2
18.5
52
39
96
4.5
2.8
5.7
Table 2-2 shows the 15 and older population by
gender. It is evident that the share of women
is much higher compared to men and this
trend is likely to continue in the next ten years.
Approximately 48 percent of the population of
this age group is men and 52 percent is women.
In the first five years, it is estimated that the
number of men will increase by 2.1 percent but
decline to 1.4 percent annually in the last five
years of the projected period. In contrast, the
increase in numbers of women will be relatively
steady around 1.6 percent.
11
13. Medium to Long-term LABOR SUPPLY-DEMAND FORECAST
Table 2-2. Projected 15+ population (by gender, 2002-2022) (unit: 1000 people, %)
Total
Population
(1000)
(%)
Growth/
Decline
(1000)
Annual average
growth rate
(%)
2007
2012
2017
2022
2007
2012
2017
2022
‘07-’12
‘12-’17
‘17-’22
‘07-’12
‘12-’17
‘17-’22
B. Labor force participation rate forecast
The labor force participation rate is determined
by the ratio of the economically active population
to the working age (15 and older) population.
Based on the data of labor force participation
rate for 2006 to 2012, we forecast the labor
force participation rate by gender and age
groups until 2022 (Table 2-3).
From Table 2-3, one can see that the general
labor force participation rate which was 63.5
percent in 2012 will increase slightly to 63.7
percent in 2017 and will decline to 62.5 percent
in 2022. With respect to age groups, the labor
force participation rate has the biggest decline in
the age group of 15-29 which may be linked to
12
Male
1632
1812
1983
2139
100.0
100.0
100.0
100.0
180
170
156
2.1
1.8
1.5
Female
786
870
965
1036
48.2
48.0
48.7
48.4
84
95
71
2.1
2.1
1.4
846
942
1018
1103
51.8
52.0
51.3
51.6
96
75
86
2.2
1.6
1.6
the desire to attain education. The participation
rate is the highest in the age group of 30-49
– over 80 percent. However, disaggregation
by gender shows that men’s participation rate
is the highest between 25-49 years of age
while for women it occurs later between 3049 years of age. Men’s labor force participation
rate will increase by 1.4 percent until 2017 and
thereafter it will decline. Meanwhile women’s
labor participation rate will decline between 1544 years of age. However, with the family life
becoming relatively stable between the ages of
45-54, women’s labor force participation rate
will increase.
15. Medium to Long-term LABOR SUPPLY-DEMAND FORECAST
Total
58.4
57.2
55.9
-1.2
-1.3
-2.5
15~19
42.3
25.0
17.3
17.8
-7.8
0.5
-7.3
20~24
55.4
46.7
42.7
41.3
-4.0
-1.4
-5.4
25~29
63.9
68.8
66.7
65.7
-2.1
-1.0
-3.1
30~34
67.8
74.9
73.2
72.2
-1.6
-1.0
-2.7
35~39
65.8
81.4
80.9
81.1
-0.5
0.2
-0.3
40~44
68.2
84.5
83.6
83.6
-0.9
-0.1
-1.0
45~49
66.7
80.6
80.6
80.8
0.0
0.2
0.2
50~54
Female
61.0
56.6
66.5
68.5
69.9
2.0
1.4
3.5
-0.9
0.2
-0.6
55~59
38.5
37.6
37.9
60~64
18.8
20.0
18.9
1.2
-1.1
0.1
65+
12.2
9.0
8.7
-3.2
-0.3
-3.5
* Source: Annual population employment report (NSO)
C. Economically active population forecast
The forecasts of the 15 and older population and
labor force participation rate are used for the
estimation of the economically active population
forecast by age group and gender (Table 2-4),
which determines the total labor supply.
Table 2-4 shows that while the economically
active population was 1,151 thousand in 2012 it
will increase by 186 thousand people reaching
1,337 thousand in 2022. By gender, the number
of men is higher than women and this trend is
likely to continue in the next 10 years. In the
last five years the annual average growth rate
14
of the male labor force was 3.2 percent, this
number is forecasted to decline to 2.5 percent in
the first half of the projected period and drop
further to 1.2 percent in the second half of the
projected period. This latter reduction is associated with both the reduction of men’s labor
force participation rate in the final five years of
the projected period (2018-2022) and the steep
decline in the number of men of 15 years of age
and over in the same period. Women’s annual
average growth rate is relatively stable around
1.1-1.2 percent over the projected period.
17. Medium to Long-term LABOR SUPPLY-DEMAND FORECAST
The economically active population forecast
by age groups is shown in the Table 2-5. The
population aged 15-29 was 354 thousand in 2012
and is forecasted to increase to 359 thousand
in 2017 but decline to 318 thousand in 2022.
While in the first half of the projected period
the annual average growth rate of this age
group is 0.3 percent, in the second half it will
2
Employment forecast by industries
In order to forecast the labor demand, we project
the value added of each of 19 industries of the
Mongolian economy as well as the employment
coefficient (the inverse of labor productivity) of
each industry.
A. Industry value added forecast
In Mongolia, there is no medium to long-term
forecast for GDP by industries. The reason could
be that it depends on many factors and putting
them together requires complicated techniques.
In this study, we simply extrapolate the observed
share of each industry’s value added in the
aggregate GDP by using data for 2000 to 2012.
Next, we adjust IMF’s projection for Mongolian
GDP*2.
2 According to the IMF, the unemployment rate in
Mongolia would decrease continuously and reach 3
percent by 2018 (source: World Economic Outlook
(October 2013)). We think that it is debatable
to consider it as the long-term (natural) rate of
unemployment. Instead, we assume that the
natural rate of unemployment is about 6 percent.
16
have a sharp decline and drop to -2.4 percent.
However, the population aged 30-54, which
forms the significant portion of the economically
active population, is forecasted to grow but with
a diminishing rate. The annual average growth
rate of the population aged 55 and over, that
has the smallest share in the economically active
population, is likely to increase.
* To forecast GDP by industries, we first used
IMF’s projections of Mongolian GDP until 2018
carried out in October 2012. However, we
found that with these projections, the unemployment rate is likely to be lower than its assumed long-term (natural) rate of 6 percent.
Other things being equal (such as the trend of
foreign labor import), it means overheating in
the labor market hence could have an adverse
impact on the growth rate by increasing the
wage rate to adjust to the long-term equilibrium. For this reason, we revise down the IMF’s
GDP projections in our forecasting.
18. Medium to Long-term LABOR SUPPLY-DEMAND FORECAST
We forecast that real GDP growth 7.1 percent
until 2017 and 6.6 percent for 2018 to 20223. In
the next five years, industries will experience the
highest growth rates are mining and quarrying
(I2), transportation and storage (I8), information
and communication (I10). In the final five years,
however, the growth rate of these industries
tend to decline (see Table 2-6).
Table 2-6. Real GDP by industries (million MNT, at 2005 constant prices)
Growth (%)
Industries*
2007
2012
2017p
2022p
I1
732,275
807,208
947,449
1,170,091
2.0
3.3
4.3
3.8
I2
691,862
976,400
1,579,082
2,127,438
7.1
10.1
6.1
8.1
I3
328,067
383,449
637,422
846,806
3.2
10.7
5.8
8.2
I4
84,994
104,469
141,928
172,519
4.2
6.3
4.0
5.1
I5
18,459
22,676
32,969
42,854
4.2
7.8
5.4
6.6
I6
118,078
194,570
226,370
312,802
0.5
3.1
6.7
4.9
I7
534,378
1,199,157
1,504,011
2,109,736
17.5
4.6
7.0
5.8
I8
361,745
576,071
941,601
1,333,769
9.8
10.3
7.2
8.8
I9
28,998
64,930
69,752
96,008
17.5
1.4
6.6
4.0
I10
149,735
240,099
394,010
556,910
9.9
10.4
7.2
8.8
I11
128,635
280,834
347,503
491,645
16.9
4.4
7.2
5.8
I12
167,681
222,886
331,329
423,442
5.9
8.3
5.0
6.6
I13
18,470
63,400
76,357
110,696
28.0
3.8
7.7
5.7
I14
43,622
100,195
145,685
209,313
18.1
7.8
7.5
7.6
20072012
2012- 2017p2017p 2022p
20122022p
I15
69,847
75,198
107,878
127,897
1.5
7.5
3.5
5.5
I16
89,203
101,097
111,978
106,312
2.5
2.1
-1.0
0.5
I17
45,480
45,265
74,587
92,952
-0.1
10.5
4.5
7.5
I18
9,896
13,447
20,910
28,495
6.3
9.2
6.4
7.8
18,561
27,130
40,121
54,397
7.9
8.1
6.3
7.2
7,730,943 10,414,084
8.6
7.1
6.1
6.6
I19
Total
3,639,988 5,498,482
* see Annex for the meaning of the abbreviations.
3 According to the IMF’s projections, the average GDP growth is 8.5 percent until 2017 and 7.7 percent for 2018
to 2022.
17
19. Medium to Long-term LABOR SUPPLY-DEMAND FORECAST
B. Employment coefficient forecast
The employment coefficient is an indicator
measuring the required employment or the
number of workers to produce value added
worth 1 million MNT. In other words, this is the
inverse of labor productivity. Data on the value
added and employment of all 19 industries of the
economy for 2000 to 2012 are used to forecast
this coefficient at an industry level.
C. Employment forecast by industries
The total number of employees was 1.05 million
in 2012 and it is forecasted to increase to 1.18
million in 2017 and further by 205,446 to 1.26
million in 2022. The annual average growth rate
of employment is forecasted to be 2.3 percent
in 2012-2017 but decline to 1.3 percent in 20172022. In the entire projected period (20122022), the total employment tends to increase
on average by 1.8 percent or 20,545 employees
annually.
The forecast indicates that employment in the
Agriculture, Forestry and Fishing Sector (I1)
18
will decline by 51,706 employees by 2022. The
employment in the Construction Sector (I6)
is likely to increase with a relatively constant
annual average growth rate of 6 percent. The
Arts, Entertainment and Recreation Sector (I18)
has the highest annual growth rate of 12.3
percent in the first five years. Compared to this,
the employment in the Other Services Activities
Sector (I19) will have a slight annual growth in
the next 2 years but decline on average by 3.1
percent annually until 2022.
The employment in sectors such as Mining and
Quarrying (I2), Water Supply, Sewerage, Waste
Management and Remediation Activities (I5),
Professional, Scientific and Technical Activities
(I13), Public Administration and Defence,
Compulsory Social Security (I15), Human Health
and Social Work Activities (I17) are projected to
have a relatively high annual average growth rate
of 5-8 percent by 2022. Figure 2-3 compared
the weight of each sector’s employment in total
employment in 2012 and 2022.
20. Medium to Long-term LABOR SUPPLY-DEMAND FORECAST
Table 2-7. Employment forecast by industries (persons, 2012-2022, %)
Change
Sectors
2012
2017p
2022p
Growth (%)
20122017p
2017p2022p
20122022p
20122017p
2017p2022p
20122022p
I1
369,960
330,890
318,254
-39,070
-12,636
-51,706
-2.2
-0.8
-1.5
I2
46,696
71,848
91,480
25,152
19,632
44,784
9.0
4.9
7.0
I3
64,897
81,600
88,754
16,703
7,154
23,857
4.7
1.7
3.2
I4
14,497
15,546
16,265
1,050
719
1,768
1.4
0.9
1.2
I5
6,681
9,891
12,856
3,210
2,965
6,175
8.2
5.4
6.8
I6
59,204
79,230
109,481
20,025
30,251
50,276
6.0
6.7
6.3
I7
131,340
147,710
128,148
16,370
-19,562
-3,192
2.4
-2.8
-0.2
I8
56,091
65,704
65,585
9,613
-119
9,494
3.2
0.0
1.6
I9
30,235
31,986
38,341
1,751
6,355
8,106
1.1
3.7
2.4
I10
14,740
19,262
23,433
4,522
4,171
8,693
5.5
4.0
4.7
I11
17,376
21,832
22,882
4,456
1,050
5,506
4.7
0.9
2.8
I12
1,208
1,301
1,659
93
358
451
1.5
5.0
3.2
I13
11,341
17,036
24,734
5,695
7,698
13,393
8.5
7.7
8.1
I14
13,334
14,483
11,772
1,150
-2,711
-1,562
1.7
-4.1
-1.2
I15*
62,919
89,184
108,962
26,265
19,779
46,043
7.2
4.1
5.6
I16
86,269
95,865
94,793
9,596
-1,072
8,524
2.1
-0.2
0.9
I17
37,529
59,184
73,829
21,655
14,645
36,300
9.5
4.5
7.0
I18
7,357
13,123
16,181
5,766
3,058
8,824
12.3
4.3
8.2
I19
Total
19,783
18,507
14,477
-1,276
-4,030
-5,306
-1.3
-4.8
-3.1
1,051,4571
1,184,181
1,261,886
127,740
77,705
205,446
2.3
1.3
1.8
* I15 represents “Public administration and defence; compulsory social security”. The increase projected in the
number of employees in this industry reflects the historical pattern only in a sense that it does not reflect policies
that the government intends to implement such as the “From the bureaucratic government to a smart government” manifesto.
19
21. Medium to Long-term LABOR SUPPLY-DEMAND FORECAST
Figure 2-3. Observed and forecasted employment by industries (%)
Other service activities
2022p
Arts, entertainment and rec
2012*
Human health and social work activities
Education
Public administration and defence;..
Administrative and support service activitie
Professional, scientific and technical activities
Real estate activities
Financial and insurance
Information, communication
Accommodation and food service activitie
Transportation and storage
Wholesale and retail trade, repair of motor..
Construction
Water supply, sewerage, waste..
Electricity, gas, steam and air conditioning..
Manufacturing
Mining and quarring
Agriculture, Forestry, Fishing and Hunting
0
It can be seen that 35 percent of employees of
15 and older were employed by the Agriculture,
Forestry and Fisheries (I1) in 2012 tends to decline to 25.2 percent by 2022. Also the employment share in the sectors such as Wholesale and
Retail Trade, Repair Motor Vehicle and Motor-
20
10 20 30 40
cycles (I7), Administrative and Support Service
Activities (I14), Education (I16) and Other Service
Activities (I19) is likely to lower in 2022 compared to 2012. In contrast, the shares of other
sectors are likely to increase.
22. Medium to Long-term LABOR SUPPLY-DEMAND FORECAST
3
Employment forecast by occupation
In Mongolia, ISCO-08 occupational classification
groups are used and we carry out the
employment forecast for 2013 to 2022 for
each of the ten major groups (1-digit). In doing
so, we use the “industry-occupation” matrices
for 2007 to 2012. This matrix divides the total
employment size in a given year into industries
and occupational groups. For each industry,
by extrapolating the observed share of the
employment in each occupational group in the
total industry employment, we forecast the
“industry-occupation” matrix for 2013 to 2022
(see Tables 2-9, 2-10). Summing up across the
industries, we derive the total (economy-wide)
employment size in each occupational group
(Table 2-8).
Table 2-8. Employment forecast by 10 major occupational groups (number, %)
Major occupational
groups
M1
M2
M3
M4
M5
M6
M7
M8
M9
M10
Total
Growth (%)
2007-08*
41,646
114,433
44,044
16,840
110,567
363,511
90,479
70,029
48,254
899,802
2012*
2017p
2022p
58,429
161,560
37,069
27,064
162,105
362,750
93,241
78,240
70,734
5,250
1,056,441
76,423
196,699
52,135
30,022
177,769
319,927
127,043
101,578
96,987
5,600
1,184,181
87,788
227,045
57,916
34,177
173,289
306,790
145,660
110,298
112,027
6,897
1,261,886
20122017p
5.5
4.0
7.1
2.1
1.9
-2.5
6.4
5.4
6.5
1.3
2.3
2017p2022p
2.8
2.9
2.1
2.6
-0.5
-0.8
2.8
1.7
2.9
4.3
1.3
20122022p
4.2
3.5
4.6
2.4
0.7
-1.7
4.6
3.5
4.7
2.8
1.8
* NSO’s labor force survey /only domestic workers/
p Projected results /the sum of domestic and foreign workers/
For the period of 2012-2022, the fastest growing
occupations are М1 (manager), М3 (technicians
and associated professionals), М7 (craft and
related trades workers) and М9 (elementary
occupation)4. The average growth of the
employment in these occupations is over 4
percent. On the other hand, the demand for M6
(skilled agriculture, forestry, and fishery workers)
4 М2 is for professionals, М4 is for clerical support workers, М5 is for service and sales workers, М8 is for
plant and machine operators and assemblers.
21
23. Medium to Long-term LABOR SUPPLY-DEMAND FORECAST
tends to decrease. The decrease in M6 tends to
contribute to the increase in employment in the
most occupational groups.
The following figure compares the observed
share of the employment in each occupational
group in the total employment in 2012 with its
projected in 2022. In 2012, М6 (skilled agriculture,
forestry, and fishery workers) accounted for
34.3 percent of the total employment while in
2022, it tends to account for 24.3 percent. The
share of М10 (armed force occupation) tends
to remain roughly the same around 0.5 percent.
Figure 2-4. Observed and projected employment by 10 major occupational groups (%)
M10
M9
M8
M7
M6
M5
M4
M3
M2
M1
0.0
5.0
10.0
15.0
20.0
2022p
25.0 30.0 35.0 40.0
2012*
Below we show the projected “industry-occupation” matrices as of 2017 and 2022.
22
26. Medium to Long-term LABOR SUPPLY-DEMAND FORECAST
4
Unemployment rate forecast
We derive the unemployment rate forecast by
using the labor force (labor supply) forecast and
the employment (labor demand) forecast.
In 2012, the unemployment rate was 8.2
percent and we assume that the long-term
unemployment rate is around 6 percent (± 0.5
percentage points) to derive the results in the
forecasting model. In other words, we assume
that the natural (or structural, NAIRU) rate of
unemployment is about 6 percent. We revise
down the growth of GDP projected by IMF and
derive the labor demand such that the economy
will experience the natural rate of unemployment
in the long-term.
Table 2-11. Unemployment rate forecast (number, %, 2012-2022)
Labor demand
Labor supply
Unemployment rate (%)
2012*
1,056,441
1,151,146
8.2
2013
1,110,160
1,180,712
6.0
2014
1,137,663
1,203,672
5.5
2015
1,150,724
1,224,913
6.1
2016
1,168,275
1,244,381
6.1
2017
1,184,181
1,262,139
6.2
2018
1,198,089
1,278,435
6.3
2019
1,211,819
1,293,652
6.3
2020
1,229,756
1,308,260
6.0
2021
1,244,758
1,322,684
5.9
2022
1,261,886
1,337,189
5.6
* Source: NSO’s labor force survey
25
27. Medium to Long-term LABOR SUPPLY-DEMAND FORECAST
Annex: Abbreviated words
I1
Agriculture, Forestry, Fishing and Hunting
I2
Mining and quarrying
I3
Manufacturing
I4
Electricity, gas, steam and air conditioning supply
I5
Water supply, sewerage, waste management and remediation activities
I6
Construction
I7
Wholesale and retail trade, repair of motor vehicles and motorcycles
I8
Transportation and storage
I9
Accommodation and food service activitie
I10
Information, communication
I11
Financial and insurance activities
I12
Real estate activities
I13
Professional, scientific and technical activities
I14
Administrative and support service activities
I15
Public administration and defence; compulsory social security
I16
Education
I17
Human health and social work activities
I18
Arts, entertainment and recreation
I19
Other service activities
М1
Manager
М2
Professionals
М3
Technicians and associate professionals
М4
Clerical support workers
М5
Service and sales workers
М6
Skilled agriculture, forestry and fishery workers
М7
Craft and related trades workers
М8
Plant and machine operators and assemblers
М9
Elementary occupation
М10
Armed forces occupation
26