2. Abstract
This research explores the effect of tax and expenditure limitations, especially the Taxpayer’s
Bill of Rights (TABOR), on school finance in Colorado. It quantifies the distributional and
equity effects of property tax burdens on the median household in each of Colorado’s school
districts. Through regression analysis and descriptive statistics we find that property taxes have
become more unequal and less progressive as a result of TABOR induced distortions in school
finance. Through a simulation we find that just over 80 percent of Colorado taxpayers are paying
more in school property tax because of TABOR-caused drastic mill levy reductions in certain
districts.
3. About the Authors
Phyllis Resnick, PhD, is the lead economist at the Colorado Futures Center at Colorado State
University. Her work at the center focuses largely on state and local fiscal sustainability and she
was the lead analyst in the center’s award winning research Financing Colorado’s Future: An
Analysis of the Fiscal Sustainability of State Government. Her dissertation research, supported by
the Lincoln Institute of Land Policy, was a 50 state evaluation of the relationship between tax
and expenditure limitations and tax reform.
Lead Economist, Colorado Futures Center
Colorado State University
CSU Denver Center
475 17th
Street
Denver, CO 80202
phyllis.resnick@colostate.edu
Charles Brown is the director of the Colorado Futures Center at Colorado State University.
Prior to becoming the Center’s director, he was a tax and school finance analyst for the Colorado
General Assembly, an assistant commissioner of education supervising all aspects of the
distribution of state school funds, and director of the Colorado General Assembly’s Legislative
Council staff for nearly two decades. After retiring from Colorado state government, he directed
the research team that produced the award winning Financing Colorado’s Future: An Analysis of
the Fiscal Sustainability of State Government. He also serves as the vice-chair of the Colorado
State Board of Equalization, which oversees the work of Colorado’s county assessors.
Director, Colorado Futures Center
Colorado State University
CSU Denver Center
475 17th
Street
Denver, CO 80202
charles.brown@colostate.edu
Deborah Godshall is the lead school finance analyst at the Colorado Futures Center at Colorado
State University. She served the Colorado General Assembly’s Legislative Council staff as its
lead school finance analyst for 25 years, and was the Council’s assistant director. After retiring
from state government she was a member of the research team that produced the award winning
Financing Colorado’s Future: An Analysis of the Fiscal Sustainability of State Government.
Lead School Finance Analyst, Colorado Futures Center
Colorado State University
CSU Denver Center
475 17th
Street
Denver, CO 80202
godshallsinger@aol.com
4. Acknowledgements
The authors thank the Lincoln Institute of Land Policy for financial support for this research. We
also thank Jennifer Newcomer for her help with creating the maps included throughout this
document.
5. Table of Contents
Introduction....................................................................................................................................1
The Literature................................................................................................................................2
TELs and School Finance in Colorado ........................................................................................4
School Finance in Colorado.................................................................................................4
So What Happened? First Gallagher Affected Local Property Tax Bases ........................10
Second, TABOR Caused School Finance Mill Levies to Plummet...................................14
Impacts of TABOR, the Gallagher Amendment, and Amendment 23 on School Finance
Policy Over Time...............................................................................................................21
Since 2000, Amendment 23 Further Distorted State and Local Shares.............................24
The Mill Levy Freeze, Enacted in 2007.............................................................................24
Findings: This History Has Resulted in Multiple Distortions in Colorado............................25
Distortions to Household Tax Burden ...............................................................................25
Distortions Across Districts...............................................................................................28
The Ultimate Question of Distortions Caused by TABOR – What Would Tax Burdens Be
Had It Not Passed?.............................................................................................................32
School Finance and TELS in Colorado: Lessons Learned ......................................................37
Recognize That Statutory Enactments Allow for Necessary Revision; Constitutional
Enactments Generally Do Not ...........................................................................................38
Acknowledge the Unique State/Local Relationships Embodied in School Finance .........38
Consider the Varied Impacts of Tax Rate Limits ..............................................................38
Take Care When Exempting New Taxable Value from Limits.........................................39
Anticipate Perverse Incentives...........................................................................................40
Don’t Enact Static Solutions in a Dynamic World............................................................40
Conclusion ....................................................................................................................................41
References.....................................................................................................................................43
6. Table of Figures
Figure 1: Changing Shares of School Finance Act Funding......................................................7
Figure 2: School Finance Act Funding Components..................................................................8
Figure 3: The Gallagher Amendment’s Effect on Tax Base....................................................11
Figure 4: Actual and Assessed Value Shares Under Gallagher...............................................13
Figure 5: Changes in Assessed Value, School Finance Total Program, and School Finance
Property Taxes .............................................................................................................................14
Figure 6: Agate, Funded Pupils and Mill Levies.......................................................................16
Figure 7: Agate, State Share and Assessed Value.....................................................................17
Figure 8: Primero, Change in Assessed Value vs. Property Tax Revenue Limit...................18
Figure 9: Primero, Change in Assessed Value vs. Mill Levy ...................................................19
Figure 10: Primero, Percentage State Share Since the Passage of TABOR...........................19
Figure 11: Gilpin County, Taxable Value and State Share .....................................................20
Figure 12: Mill Levy vs. State Share..........................................................................................22
Figure 13: Change in Tax Burden and State Share in Districts Currently Levying Fewer
than 10 Mills, 1993-1994 to 2014-2015.......................................................................................23
Figure 14: Graphical Representation of the Change in Effective Rates: 2000 to 2014 ........26
Figure 15: Median Taxpayer Effective Tax Rates – PSFA Mills ............................................27
Figure 16: Progressivity of Mills ................................................................................................28
Figure 17: Stepwise Regression Results on the Use of Override Levies .................................30
Figure 18: Geographic Representation of the Use of Override Levies Statewide..................31
Figure 19: State Share vs. Modeled Uniform Levy...................................................................34
Figure 20: Logit Model Predicting Characteristics of Winner and Loser Districts Under
TABOR .........................................................................................................................................35
7. Figure 21: Geographical Representation of Change in Taxes Paid Under TABOR vs. No-
TABOR Analysis, 2014................................................................................................................36
Figure 22: Geographical Representation of Effective Rate Spread........................................36
8. Measuring the Impacts of Tax and Expenditure Limits on Public School Finance in
Colorado
Introduction
Limitations … are shaping the [public] sector in unintended ways. … While the effects
are often asymmetrical, they are not random. They produce both general and varied
effects. Effects vary by type of government and service subgroup, and by the
demographics of resident populations. These constraints are producing systematic
effects which are reshaping the local public sector, distorting fiscal and service delivery
structures (Mullins 2004, 146-147).
Tax and expenditure limitations (TEL) matter. While research is inconclusive as to whether they
consistently result in their stated effect of reducing the size and scope of government (Resnick
2008), it is universally agreed that they have unintended consequences. Many of these
consequences are distributional, and among the more significant distributional impacts is that on
school finance. In Colorado, these impacts are myriad. They affect the source of funding for
schools as well as inter-district and inter-taxpayer tax burden equity. It is largely the taxpayer
burden impacts that are the subject of this report, particularly as they relate to the impacts on
property tax burdens across taxpayers in Colorado’s 178 school districts.
Over the years, Colorado has become increasing less reliant on the local property tax and
increasingly more reliant on state aid for the funding of public schools. On its face, Colorado’s
experience is not all that different from other states in the country. “…court ordered [school]
finance reforms have undoubtedly played a role in bringing about the observed decreased
reliance on local property taxes and increased reliance on state funding of education (Blankenau
and Skidmore 2002, 52). However, while Colorado’s outcome mirrors those of the nation, its
path to this outcome differs greatly. As we acknowledge below, court ordered reform in other
states undoubtedly influenced education finance policy in Colorado. However, and more
significantly, the continuing shift in Colorado has been locked into the state constitution by a
series of somewhat independent but certainly interrelated policy actions begun in the 1980s and
continuing through the early 2000s. Specifically, it was the interaction of Colorado’s most recent
public school finance act, its TELs, and interaction with other constitutional mandates that
resulted in the ever increasing funding shift in Colorado.
In Colorado the funding shift is only the start of the story. The shift for funding schools from
property tax and onto state funding is as well documented in Colorado as elsewhere. However,
our deeper exploration reveals that not only did the interaction of the state’s TELs and its school
finance act result in a funding shift, but that interaction also resulted in a myriad of distortions
and perverse outcomes in the system of funding K-12 education. These distortions, which are the
focus of this research, range from household and district equity disparities to situations in which
taxpayers in demographically similar districts are facing property tax burdens that are
significantly different. In addition, under the Taxpayers Bill of Rights (TABOR), the TEL
designed to place a limit on all taxes paid in Colorado, taxpayers in 74 of the state’s 178 school
1
9. districts currently pay more in school property taxes than they would if TABOR were never
enacted. These 74 districts contain 81% of the state’s population.
The following analysis is composed of four major sections:
• The literature is not silent on the impacts of TELs on school finance. The first section of
this paper reviews a sample of the existing research.
• The literature review is followed by a history and chronology of Colorado’s experience
with TELs with a specific emphasis on how they have impacted school finance. TELs
have introduced distortions, particularly with respect to the use of the property tax as a
source of local funding for schools.
• The next section of this paper presents our research findings, with a specific emphasis on
the distortions at the taxpayer rather than the jurisdictional level. While district level
funding distortions have been studied previously in Colorado and elsewhere, the impact
of TELs and school finance on tax burdens for households and other taxpayers largely
has been ignored by previous studies.
• Finally, we conclude with key learnings, both for Colorado and for other states. While
each state differs in its school finance formula, its existing TELs, and the specifics of any
proposed TELs, findings from Colorado suggest that the interactions between limits,
particularly on the property tax, and school finance schemes are likely to result in
distributional impacts that serve to distort a system of school finance designed to exist in
the absence of TELs.
The Literature
Researchers have been examining the effects of TELs almost since the beginning of the modern
tax revolt in 1978. And while the literature is replete with studies of many aspects of TELs, the
specific impact of TELs and school finance on taxpayer burdens is an area that has received very
little attention. To the extent research has examined the interaction of school finance and TELs,
it has predominantly focused on a political economy exploration of why TELs pass and a public
finance exploration of the fiscal impacts of TELs on school finance, education spending,
jurisdictional revenue and expenditure capacity, and student performance. To the extent the
research has explored distributional effects, it has primarily focused on governments and not on
households or other taxpayers.
In an early study, Merriman (1986) identified that TELs had distributional or distortionary
effects. In his study of New Jersey, he found that not all communities1
were equally affected by
the imposition of that state’s TEL. Specifically, low-density, high-tax capacity jurisdictions were
found to be more adversely affected by the TEL than other jurisdictions. However, as Merriman
notes, this finding is in conflict with the findings from studies of other states, leading to the
conclusion that “the design of a TEL may have important distributional consequences”
(Merriman 1986, 360). An earlier study of Colorado showed similar findings. “Even though the
1
A community level analysis in New Jersey is germane to our work here on school districts as the majority of
school districts in NJ are contiguous with and funded through the municipalities.
2
10. comprehensive TABOR amendment was applicable to all governments uniformly, the resulting
consequences were not uniform to all governments. Municipalities of smaller population have
been more constrained than municipalities of larger population” (Brown 2000, 46). Further
distributional impacts of TELs were found by Mullins and Joyce (1996), this time between state
and local government. Their research demonstrates increased centralization at the state level,
increased use of nontax sources of revenue at the local level, and an increasing lack of capacity
for local governments to respond to the needs of certain populations, leading to potential equity
distortions in the jurisdictions covered by the TEL. In later studies perhaps the most germane for
this research, Mullins (2004) showed that limits had a significant impact on revenue and
expenditure disparity across a nationwide panel of 38,804 general purpose governments,
including school districts, and Green and Weiss (2009) provide a framework for quantifying the
equity and distributional impacts of property tax expenditures in Wisconsin.
Researchers have also explored K-12 service level disparities in the presence of TELs. Figlio
(1998) explores the effects of local TELs on the provision of school services in Oregon under
Measure 5. Oregon’s TEL was shown to have two specific impacts: it adversely affected the
provision of school services by raising student-teacher ratios and this same effect did not extend
to administrative expenditures. The ratio of administrative to instructional expenditures did not
decline in the presence of the TEL, suggesting that TELs in Oregon resulted in direct impact to
the level of service provided in the classroom. At the district level, Figlio also found
distributional effects; not all districts were affected equally by the TEL. “…my analysis of the
distributional effects of Measure 5 suggests that some school districts have been affected much
more than others” (Figlio 1998, 58).
From a political economy perspective, Blankenau and Skidmore, in their 2002 and 2004
research, explore the interrelationships between TELs and school finance, with a particular
emphasis on court ordered reform. In 2002, they explore the impact of education reform on TELs
but not the opposite relationship. Building on the argument by Fischel (1989) that the Serrano
decision disrupted a political equilibrium and ultimately facilitated the passage of Proposition 13
in California, the authors extend Fischel’s California finding by studying all referendum states
for the period 1978-1990 and conclude that court ordered education reform does, in fact, increase
the chance that a state will successfully enact a TEL.
In their later work, Blankenau and Skidmore (2004) examine the joint relationship of education
reform and TELs on education spending. They find that TELs and court ordered reform cannot
be considered separately when examining school finance. Specifically, their findings indicate
that in states with court ordered reform but no local TELs, the mandated reform has no effect on
local school funding. However, in states with court ordered reform and local TELs, the mandate
serves to reduce local own-source school funding. Furthermore, and of direct interest for our
work because of its suggestion that TELs introduce distributional effects and distortions into
existing systems of school finance, the authors find that “court-ordered reform absent TELs has
no effect on aggregate own-source spending, a positive effect on state aid, and a positive net
effect on total expenditures. However, reform in the presence of TELs has no effect on total
education spending but reduces own-source spending and increases state aid. Thus the findings
suggest that if increased state aid has been allocated primarily to poorer districts, … the cost has
3
11. been that wealthier districts have reduced overall spending when TELs are present” (Blankenau
and Skidmore 2004, 141).
The literature supports the contention that TELs introduce distortions into the system of funding
and the provision of public education services. However, the level of analysis in each of these
studies is the jurisdiction. With the exception of early analyses of California in the wake of
Proposition 13 (O’Sullivan, et al, 1995), little has been written on distortions to taxpayer
burdens. And, in California the impacts to horizontal equity under the provisions of Proposition
13 were somewhat transparent; acquisition value systems always affect horizontal and perhaps
vertical equity. In this sense, one might reasonably argue that Proposition 13 was designed to
distort. In Colorado, the distortions were not immediately obvious; it is only with more than 20
years of hindsight that the multiple distortions are presenting themselves.
TELs and School Finance in Colorado
The imposition of tax and expenditure limitations on the local public sector is likely to
result in local structural adjustments in fiscal and service delivery responsibility as
governments attempt to evolve mechanisms to continue to satisfy demands for local
public services. This may have serious implications for the ability of local populations
to exercise voice and control over the totality of the public service/tax package made
available to them and, thus, the accountability and responsiveness of government. It is
also likely that the effect across local jurisdictions is not uniform. Some governments
may be constrained more than others, resulting in a relative reduction in the ability to
meet the needs of populations in more constrained settings. The outcome with regard
to local discretion may be one of an asymmetric truncation of the ability to exercise
local choice, such that the variation in service availability across jurisdictions
increases. While this increased variation may superficially appear as Tiebout
inspired, it will be driven not by responsiveness to local desires, but by a
reinforcement of differential abilities to respond (Mullins 2004, 118, emphasis added).
In 1956, Tiebout argued that people vote with their feet and select communities with the package
of tax burdens and services that best suits them. “Just as the consumer may be visualized as
walking to a private market place to buy his goods, the prices of which are set, we place him in
the position of walking to a community where the prices (taxes) of community services are set.
Both trips take the consumer to market” (Tiebout 1956, 422). But, as Tiebout also argues, and
Mullins highlights, this model holds when the tax burden and service level differences between
communities are a result of the quasi-market interaction between buyers (citizen residents) and
sellers (the manager of the community).
As demonstrated in this section, the core district level disparities in Colorado did not result from
the quasi-market interactions between residents and their government (school district in this
case) but rather as a consequence of the specific interactions of statewide policies of school
finance and constitutional limitations. An explanation of Colorado’s school finance system and
its constitutional TELs and spending mandate is helpful in seeing the dynamics that are driving
the distortions in property tax support for schools.
School Finance in Colorado
4
12. As is the case with many other states, Colorado’s primary role in the state funding of K-12 public
education is framed by two original provisions of the Colorado Constitution. The first provision,
found in Article IX, Section 2, directs that:
The general assembly shall, as soon as practicable, provide for the establishment and
maintenance of a thorough and uniform system of free public schools throughout the
state, wherein all residents of the state, between the ages of six and twenty-one years,
may be educated gratuitously. [Emphasis added.]
The second provision, Article IX, Section 15, requires that:
The general assembly shall, by law, provide for organization of school districts of
convenient size, in each of which shall be established a board of education, to consist of
three or more directors to be elected by the qualified electors of the district. Said
directors shall have control of instruction in the public schools of their respective
districts. [Emphasis added.]
From one perspective, these provisions appear to be contradictory. After all, how can a system be
“uniform” if control over each component of the system is vested in (currently 178) locally
elected school boards? Over the course of Colorado’s history, the General Assembly has
resolved this apparent contradiction by determining that its primary role is providing school
districts equalized access to financial capacity, while the role of local school boards is largely
administrative, supervisory, and curricular. For this reason, the primary aim of the state’s school
finance acts throughout its history has been to guarantee the revenue-raising capacity of the
state’s very disparate school districts through a variety of financial mechanisms. In addition, over
the past four decades, the state has also attempted to equalize the total per-pupil spending of
districts based on enrollment characteristics and other factors. At the same time, each district
makes local determinations about the delivery of educational services and whether to exceed the
level of funding provided by law by imposing additional local taxes.
The diversity of property tax base characteristics among the 178 school districts in Colorado,
however, has resulted in tax base disparities among Colorado’s school districts that have been
too large for the state to overcome through any financing formula. In FY 2014-2015, for
example, the assessed value per pupil ranged from a high of $3,722,144 in Pawnee (Weld
County) to a low of $16,028 in Edison (El Paso County). In other words, Pawnee’s tax base per
pupil was 232 times higher than Edison’s. While districts with low property wealth per pupil
receive almost their entire school finance act funding from the state, little or no state support is
provided to districts with high property wealth per pupil. Historically, districts with very high
property wealth per pupil have received a set minimum amount of state aid.
Over the past 40 years, Colorado has used three basic mechanisms to determine the local and
state shares of school funding. From 1973 to 1988, the school finance act employed a “modified
power equalization” formula in which the state guaranteed the ability of each district to generate
a specified revenue amount per mill for each pupil every year. Districts with low property wealth
per pupil were backfilled by state aid up to the state guaranteed amount, while districts with high
wealth per pupil were provided a “minimum guarantee.” The 1973 act also set an amount of total
combined state and local revenue per pupil that each district was authorized to receive each year.
Because the state controlled both the total amount of funding per pupil and the state-guaranteed
5
13. amount that the tax base of each district could generate per pupil, it was able to control the
growth of the local and state shares each year. The percentage shares of school finance act
funding provided by state aid and the property tax were determined annually in each year’s
school finance bills enacted by the legislature and the Governor. Under the formula, districts that
wanted to raise and spend more property taxes than permitted under the formula were allowed to
levy additional mills either by a state board or by a local election. These additional mills are
considered override levies and will be referred to as such in the remainder of this analysis.
Although in 1982 Colorado’s Supreme Court found the state’s school finance act to be
constitutional, the threat of pending litigation and mounting pressure from school districts
motivated the General Assembly to replace the 1973 school finance law in 1988. The Public
School Finance Act of 1988 determined total funding for school districts by calculating district
costs per classroom unit, which varied with each school district’s “setting category.” Setting
categories were intended to provide largely similar amounts of funding to similar districts that
shared the same geographical and enrollment characteristics. The local share of funding for each
district was to be provided, in most cases, by a uniform statewide mill levy. At the time the act
was passed, some districts’ levies were substantially above the uniform rate and others were
substantially below. The levies of many districts were forced to migrate to the uniform rate over
a phase-in period. By controlling the dollar-amount increases associated with classroom units in
each district, as well as the uniform mill levy and phase-in period, the legislature was able to
control the growth of the state and local shares of school finance act funding.
The 1988 act allowed the state to maintain its flexibility in determining the property tax and state
aid shares of school funding. Under this construct, the state could have transferred burden to the
local property tax, resulting in an acceleration of the local share and allowing the state to protect
the General Fund from an increasing responsibility to fund schools. However, the state chose to
do just the opposite. In the late 1970s, surplus General Fund money was appropriated to reduce
local property taxes throughout Colorado. In the late 1980s and again in the early 1990s, the state
increased its share in order to hold down local property taxes. Statewide property taxes for
schools were held below the 1989 nominal levels for five years through 1994.
School districts became increasingly dissatisfied with the 1988 act after a relatively short
lifespan. The 1988 act was repealed and replaced in 1994 with the school finance law that is still
in effect today, which calculates total funding for districts using a per-pupil base amount that is
uniform throughout the state but adjusted for the enrollment size of each district, the number of
“at-risk” children, and a factor intended to recognize the diverse costs of living in different parts
of the state. As with prior acts, school finance funding is a shared responsibility of the state
General Fund and local school district property taxes with a small share coming from the local
school districts’ allocation of specific ownership (motor vehicle) tax receipts. The 1994 act
continued the uniform levy concept embedded in the 1988 act, but levy increases for districts
below the uniform rate were stalled by the mill levy limit imposed by TABOR. Again, local
districts were allowed to levy additional override mills to enrich their educational programs if
authorized through an election, but the overrides were initially limited to a variance of 20% of
total program funding initially, increased to 25% during the 2009 legislative session.
6
14. For the decade and a half after passage of the Public School Finance Act (PSFA) of 1994, the
state’s percentage share of funding began to rise steadily. This was not due to any specific
provisions of the act itself, but rather as a result of limits placed in Colorado’s constitution. The
change in state and local shares over this period is shown in Figure 1. The local share, provided
mostly by property taxes, slowly declined, putting the state in the position of paying for its
portion of school spending increases while also having to provide state funding to make up for
the amount of school funding that property taxes could not provide.
Figure 1: Changing Shares of School Finance Act Funding
Source: Colorado Department of Education
Over the period shown in Figure 2, the total school finance program rose by 147 percent. School
district property taxes rose by 83 percent, so state funding was forced to grow by 200 percent.
0%
10%
20%
30%
40%
50%
60%
70%
80%
90%
100%
93-94
94-95
95-96
96-97
97-98
98-99
99-00
00-01
01-02
02-03
03-04
04-05
05-06
06-07
07-08
08-09
09-10
10-11
11-12
12-13
13-14
14-15
PercentageShare
Fiscal Year
Changing Shares of School Finance Act Funding
FY 1993–1994 to FY 2014–2015
State Share Property Tax Share Specific Ownership Tax
7
15. Figure 2: School Finance Act Funding Components
Source: Colorado Department of Education
In previous school finance acts, Colorado’s General Assembly and Governor made
straightforward policy decisions regarding the appropriate balance between state and local
funding proportions. But the state’s power to make this determination under the 1994 act has
been dramatically impacted by a trio of constitutional amendments: the Gallagher Amendment
(1982) and TABOR (1992), which have held down local property taxes, and Amendment 23
(2000), which put additional pressure on the state to finance annual funding increases for
schools.
The Gallagher Amendment
The Gallagher Amendment (Gallagher) was one provision of a comprehensive constitutional
property tax reform measure referred to voters by the General Assembly at the 1982 general
election. This provision set the assessment ratio2
for most nonresidential property at 29 percent
of actual value and the assessment ratio for residential property at 21 percent of actual value. It
also required that the residential ratio be reset during each biennial reassessment cycle to ensure
that residential property would not grow as a percentage of the total taxable valuation base
statewide. Beginning in 1987 and over the following two decades, as population growth and
2
In Colorado, the assessment ratio determines the percentage of a property’s value subject to property tax. So under
the 1982 ratios set forth originally in the law, the property was valued for tax purposes in the following way: For a
$100,000 valued residential property with an assessment ratio of 21%, $21,000 of value would be subject to the
property tax mill levy. For an equally valued $100,000 nonresidential property with an assessment ratio of 29%,
$29,000 of value would be subject to the property tax mill levy. As discussed later in this section, since the 1982
enactment of Gallagher, the residential assessment ratio has fallen to a current 7.96% while the non-residential rate
remained at 29%. Today, for those same $100,000 properties, the residential property would be taxed on a value of
$7,960 while the nonresidential property would still be taxed on $29,000 of value.
$0
$1,000
$2,000
$3,000
$4,000
$5,000
MillionsofDollars
Fiscal Year
School Finance Act Funding Components
FY 1993-1994 to FY 2014-2015
State Share Property Tax Share Specific Ownership Tax
Linear (State Share) Linear (Property Tax Share)
8
16. rising home values led to stronger growth in residential properties relative to the rest of the tax
base, the residential assessment rate was reduced in order to comply with the Gallagher
requirements.
TABOR
TABOR was initiated to the Constitution by voters in 1992. It contains four provisions affecting
the calculation of total funding entitlements and the state and local shares of each school
district’s funding:
• A prohibition on assessment ratio increases without statewide voter approval resulting
in the continued reduction of the residential assessment ratio even during periods when it
would have otherwise been increased due to market conditions (Article X, section
20(4)(a)).
• An overall spending limit for each district, consisting of the district’s prior year
spending base plus enrollment and inflation. This restricts annual growth in total program
support for each district (Article X, section 20(7)(b)).
• A property tax revenue limit of each district’s prior year property tax collections plus
enrollment growth and inflation (Article X, section 20(7)(c)).
• A provision prohibiting mill levy increases without voter approval (Article X, section
20(4)(a)).
Amendment 23
Amendment 23, an amendment to the Colorado Constitution that originated through the initiative
process in 2000, contains four major provisions that require:
• Increases in statewide base per-pupil funding of at least inflation (as measured by the
Consumer Price Index for Denver-Boulder-Greeley) plus 1 percent for 10 years from FY
2001–2002 to FY 2010–2011, and by the rate of inflation after that (Article IX, section
17(1)).
• Increases in funding for categorical programs of at least the minimum rates of
increase set for the per-pupil funding base (Article IX, section 17(1)).
• Transfers of an amount equivalent to one-third of 1 percent of federal taxable
income (about 7.2 percent of state income tax collections) to a State Education Fund,
which the amendment created outside the TABOR and General Fund appropriations
limits (Article IX, section (4)).
• Restrictions on the state from using the newly created State Education Fund to
supplant General Fund appropriations by creating a maintenance-of-effort
requirement. This mandates an increase in General Fund appropriations by a minimum of
9
17. 5 percent per year for the first 10 years as long as state personal income growth in each
year was 4.5 percent or more (Article IX, section 17(5)).
So What Happened? First Gallagher Affected Local Property Tax Bases
Under the Gallagher Amendment, the residential assessment rate was reduced from 21 percent to
18 percent in 1987 and subsequently adjusted downward six times to a rate of 9.74 percent in
1997. The rate remained constant until 2001, when it was reduced to 9.15 percent. It was lowered
to its current level of 7.96 percent in 2003. Studies conducted by the state Division of Property
Taxation determined that, absent the assessment-ratio increase prohibition in TABOR, the rate
would have climbed four times between 1998 and 2009. Figure 3 compares the percentage
distribution between actual and assessed values for residential and nonresidential property, along
with the applicable residential assessment rate for 1984 through 2014. The table shows that by
2014 actual residential values make up a little more than 75 percent of total property values, but
only 42.6 percent of the tax base.
10
18. Figure 3: The Gallagher Amendment’s Effect on Tax Base
Year
Share:
Residential
Actual Value
Share:
Non-
Residential
Actual
Value
Residential
Assessment
Rate
Share:
Residential
Assessed
(Taxable)
Value
Share: Non-
Residential
Assessed
(Taxable)
Value
1984 54.1% 45.9% 21.00% 44.2% 55.8%
1985 54.4% 45.6% 21.00% 44.5% 55.5%
1986 54.8% 45.2% 21.00% 45.0% 55.0%
1987 60.8% 39.2% 18.00% 48.4% 51.6%
1988 61.4% 38.6% 16.00% 46.0% 54.0%
1989 62.5% 37.5% 15.00% 45.5% 54.5%
1990 63.1% 36.9% 15.00% 46.1% 53.9%
1991 63.7% 36.3% 14.34% 45.6% 54.4%
1992 64.7% 35.3% 14.34% 46.5% 53.5%
1993 67.1% 32.9% 12.86% 46.4% 53.6%
1994 67.5% 32.5% 12.86% 46.8% 53.2%
1995 71.8% 28.2% 10.36% 46.7% 53.3%
1996 72.0% 28.0% 10.36% 47.0% 53.0%
1997 72.3% 27.7% 9.74% 45.9% 54.1%
1998 72.6% 27.4% 9.74% 45.9% 54.1%
1999 72.6% 27.4% 9.74% 46.3% 53.7%
2000 72.9% 27.1% 9.74% 46.6% 53.4%
2001 74.8% 25.2% 9.15% 47.1% 52.9%
2002 75.3% 24.7% 9.15% 47.7% 52.3%
2003 77.5% 22.5% 7.96% 47.7% 52.3%
2004 77.7% 22.3% 7.96% 47.1% 52.9%
2005 77.8% 22.2% 7.96% 46.9% 53.1%
2006 77.8% 22.2% 7.96% 46.1% 53.9%
2007 77.6% 22.4% 7.96% 46.2% 53.8%
2008 77.6% 22.4% 7.96% 46.2% 53.8%
2009 76.1% 23.9% 7.96% 43.3% 56.7%
2010 77.0% 23.0% 7.96% 46.1% 53.9%
2011 76.3% 23.7% 7.96% 44.3% 55.7%
2012 76.2% 23.8% 7.96% 43.9% 56.2%
2013 75.6% 24.4% 7.96% 43.4% 56.6%
2014 75.5% 24.5% 7.96% 42.6% 57.4%
Source: Colorado Department of Local Affairs, Division of Property Taxation
The pie charts contained in Figure 4 further demonstrate how Gallagher has distorted the
property tax base in Colorado since the early 1980s. The difference between the percentage
shares of actual and assessed values indicates the amount of the residential tax base that is no
11
19. longer available to support the local share of school funding. We estimate that statewide
residential assessed values would have been $63.88 billion higher in 2014 if the original
assessment rate for residential property had remained at 21 percent.
12
20. Figure 4: Actual and Assessed Value Shares Under Gallagher
Source: Colorado Department of Local Affairs, Division of Property Taxation
The distortion in property tax base caused by Gallagher manifests itself, district by district, in the
specific circumstances surrounding the productivity of the local property tax in supporting the
local share of school funding. This is further complicated by the fact that the residential
assessment rate is set statewide. Each of Colorado’s 178 school districts must accept the
statewide calculation of the assessment rate for residential property without regard for the
specific split between residential and nonresidential property in the district.
Figure 5 compares the cumulative growth rates of statewide assessed values, statewide total
program funding for schools and total school district property tax collections from FY 1994–
1995 to FY 2014–2015. At first glance it appears that the property tax base is sufficient to fund
the local share of the school finance act. However, in actuality property taxes are levied locally
by each of the state’s 178 school districts, their tax bases vary dramatically, and the economic
dynamics affecting the various components of each district’s tax base cause even greater
variability over time. In addition to tax base variations, enrollment variations also significantly
impact the property tax mill levies needed to sustain the local share.
54.1%
45.9%
1984 Actual Value Shares
Residential Non-Residential
44.2%55.8%
1984 Assessed Value Shares
Residential Non-Residential
75.2%
24.5%
2014 Actual Value Shares
Residential Non-Residential
42.6%
57.4%
2014 Assessed Value Shares
Residential Non-Residential
13
21. For example, in districts with very high growth rates in components of their tax bases and
relatively slower growth in enrollments, the growing tax base per pupil drives levies3
downward,
reducing the rate of property tax collections relative to the district’s tax base. Districts with high
concentrations of residential property also have diminished tax bases resulting from the fact that,
under the Gallagher Amendment, for every $100 of actual residential value, property is assessed
at only $7.96, less than one-third of the $29 rate assessed for $100 of actual value for most
classes of nonresidential property.
Figure 5: Changes in Assessed Value, School Finance Total Program, and School Finance
Property Taxes
Source: Colorado Department of Education and Colorado Department of Local Affairs, Division of Property
Taxation
Second, TABOR Caused School Finance Mill Levies to Plummet
The history of falling school mill levies dates to the 1992 passage of TABOR. Several of
TABOR’s provisions (outlined above) apply: TABOR’s property tax revenue limit allows
district property taxes to change each year only by the rate of growth in enrollment and inflation
for each district, TABOR’s limits prohibit mill levies from increasing without a vote, and
TABOR provides that valuation for assessment ratios (controlled by the Gallagher amendment)
also cannot increase without a popular vote.
3
It is important to note that by referring to levies here and in the remainder of this section, we are referring only to
the base school program levy. As discussed later in findings, many districts have received approval from their voters
for other levy components including those to pay debt service on district bonds and to augment base program
expenditures with what are called override levies.
0%
50%
100%
150%
200%
250%
CummulativePercentageIncrease
Fiscal Year
Changes in Assessed Value, School Finance Total Program and School
Finance Property Taxes
Assessed Value School Finance Program School Finance Property Tax
14
22. In addition, the provisions of Amendment 23 required that base per-pupil funding in Colorado
increase faster than allowed by the limits in TABOR by specifying that funding be increased by
statewide enrollment growth plus inflation plus 1% for the first 10 years of the amendment’s
implementation, and by enrollment growth and inflation each year thereafter.
The combination of these limits and spending mandates has resulted in a further shift of the
funding burden for the state equalization program from the local property tax to state aid. This
happens primarily due to the multiple assessed value and enrollment circumstances that occur
across the state’s very diverse 178 school districts over time. Some illustrations and case studies
are helpful.
Illustration 1
Some districts have fluctuating enrollments which increase in some years but decline in others.
During periods of decline the TABOR property tax revenue limit is correspondingly reduced, so
the district mill levy must be reduced in order to avoid violating the district’s property tax limit.
Once the mill levy is reduced, it cannot be increased without a vote even if the district
experiences enrollment increases in subsequent years. In subsequent years, shortfalls in per-pupil
funding are made up with state aid.
Case Study 1: Enrollment fluctuations in the Agate School District leave district with
permanently reduced mill levies and elevated state aid.
Agate is a small, rural school district in eastern Colorado that experienced fluctuations in its
enrollment in the late 1990s, as illustrated in Figure 6. In FY 1996-1997, Agate's enrollment was
at its highest level in several years. The district was levying 41.8 mills and receiving slightly less
than two-thirds of its funding from the state. Over the next two years, Agate's enrollment
dropped by about 25 percent. To comply with the revenue-raising limit in TABOR, the district
reduced its levy by nine mills in FY 1997-1998 and by a total of 9.9 mills over the course of two
years. Thus, the district did not have as much capacity to support new students when, in FY
1999-2000, the district's enrollment began increasing again, a trend that lasted four years.
15
23. Figure 6: Agate, Funded Pupils and Mill Levies
Source: Colorado Department of Education
In FY 2002-2003, the district's enrollment began trending downward, resulting in five
consecutive years of levy reductions until the tax rate for the levy freeze4
was established at just
under 17 mills. Figure 7 shows the state share and assessed value for the Agate school district.
4
In 2007, the legislature passed Senate Bill 07-199 which declared that TABOR’s property tax revenue limit was no
longer in force for 174 school districts. These districts had received prior voter approval for an exception from
TABOR in order to receive the increased funding provided by the passage of the Public School Finance Act of 1994.
This legislation is commonly referred to as the levy freeze. More specifics on the levy freeze legislation are
presented later in the paper.
0
20
40
60
80
100
120
140 1992
1993
1994
1995
1996
1997
1998
1999
2000
2001
2002
2003
2004
2005
2006
2007
2008
2009
2010
2011
2012
2013
2014
2015
MillsandPupils
Agate: Funded Pupils and Mill Levies
Mill Levy Funded Pupils
pupil decrease
levy decrease
16
24. Figure 7: Agate, State Share and Assessed Value
Source: Colorado Department of Education
By way of background, Agate entered the TABOR era with a levy for school finance that was 29
percent higher than the prevailing levy among school districts. Agate was required to levy mills
in addition to the uniform rate to pay for funding above the foundation amount provided in the
act. This type of additional funding is not uncommon after a significant change in a school
finance law and is frequently referred to as a hold harmless provision. When the 1994 act was
passed, Agate no longer qualified as a hold harmless district, but by then state law mirrored the
provisions of TABOR with respect to mill levies. State policymakers were concerned about
eroding tax rates. However, in FY 1995-1996, the rates for high-levy districts were reduced. This
reduction is apparent in both Figures 6 and 7.
Illustration 2
Another illustration focuses primarily on assessed value increases. In some districts, for example,
mineral, oil, and gas production fluctuates. In years when production is increasing, the district’s
mill levy must be reduced to comply with the TABOR property tax revenue limit. In years when
production declines and assessed value decreases, the mill levy cannot be increased due to the
mill levy limit in TABOR. Once again, when the mill levy is reduced, it is permanently
“ratcheted” down and any subsequent shortfalls are made up by state aid.
Case Study 2: Oil and gas development in the Primero School District drives mill levies down
The Primero School District provides an example of such a phenomenon. Primero is a small
school district in south central Colorado, just north of the New Mexico border. In the year
preceding the implementation of TABOR, the district levied the uniform rate of 40 mills on
$17.1 million of assessed value, and received 44.6 percent of its total funding from the state.
Even at that time, 88.5 percent of the district's tax base was made up of nonresidential property.
$0
$2
$4
$6
$8
$10
$12
$14
$16
0%
10%
20%
30%
40%
50%
60%
70%
80% 1994
1995
1996
1997
1998
1999
2000
2001
2002
2003
2004
2005
2006
2007
2008
2009
2010
2011
2012
2013
2014
2015
AssessedValueinMillionsof$
StateShare
Agate: State Share and Assessed Value
State Share Assessed Value
17
25. Almost immediately thereafter, in FY 1993-1994, the district experienced a decline in assessed
value that pushed its state share to 62.7 percent. In the years that followed, through FY 2006-
2007 when the property tax revenue limit was discontinued5
, the district's assessed value
generally increased at a greater rate than the its property tax revenue limit as oil and gas
production in the district surged. As a result, Primero's levy continually dropped so that property
tax collections did not exceed those permitted under TABOR's revenue limit. By FY 2006-2007,
the district's levy had fallen to its current, frozen level of 1.68 mills. Figure 8 compares
Primero’s change in assessed value to its property tax revenue limit under TABOR for 1993
through 2007.
Figure 8: Primero, Change in Assessed Value vs. Property Tax Revenue Limit
Source: Colorado Department of Education
Since FY 2006-2007, oil and gas production, which is the mainstay of the district's assessed
value, has been extremely volatile. In the eight years since the district's levy was frozen, oil and
gas abstract assessed value ranged from $501.3 million to $130.6 million. In these two years, the
district's total abstract assessed value was $523.8 million and $163.6 million, respectively.
Figure 9 depicts the percentage change in the Primero's assessed value compared to its mill levy
over the entire time period since the passage of TABOR; the volatility in recent years is
particularly high.
With the freeze on the district's levy, the state's contribution to the district's school finance
funding changes as assessed value changes. In FY 2014-2015, the Primero School District
received 81.8 percent of its school finance funding from the state. The proportion was a decrease
from the FY 2013-2014 rate of 82.7 percent, but an increase from the FY 2012-2013 rate of 75.1
percent. Figure 10 shows the percentage state shares for the district since the passage of TABOR.
5
For most districts the property tax limit was discontinued with the levy freeze legislation passed in 2007. See the
section on levy freeze below.
-60%
-40%
-20%
0%
20%
40%
60%
80%
100%
93 94 95 96 97 98 99 00 01 02 03 04 05 06 07
Primero: Change in Assessed Value vs. Property Tax Revenue
Limit
Assessed Value Increase Property Tax Revenue Limit
18
26. Figure 9: Primero, Change in Assessed Value vs. Mill Levy
Source: Colorado Department of Education
Figure 10: Primero, Percentage State Share Since the Passage of TABOR
Source: Colorado Department of Education
The district's levy of 1.68 mills is just one-twelfth of the state average mill levy for the school
finance act. Homeowners in the Primero school district pay $13.37 per $100,000 of market value
for the support of schools and the median residential taxpayer pays $28.70 per year in base
school property taxes.
Illustration 3
A final illustration concerns districts that have significant economic development not associated
with enrollment increases (which would allow the property tax limit to increase), such as the
enactment of limited stakes gaming in Gilpin and Teller Counties, construction of new major
-80%
-60%
-40%
-20%
0%
20%
40%
60%
80%
100%
0
5
10
15
20
25
30
35
40
45
1993
1994
1995
1996
1997
1998
1999
2000
2001
2002
2003
2004
2005
2006
2007
2008
2009
2010
2011
2012
2013
2014
2015
PercentChangeinAssessedValue
Mills
Primero: Change in Assessed Value vs. Mill Levy
Percent Change Assessed Value Mills
0%
20%
40%
60%
80%
100%
1992
1993
1994
1995
1996
1997
1998
1999
2000
2001
2002
2003
2004
2005
2006
2007
2008
2009
2010
2011
2012
2013
2014
2015
Primero: Percentage State Share Since the Passage of TABOR
19
27. public utilities, new oil and gas facilities, and recreational developments in mountain
communities. In most cases, the precipitous growth of assessed value from these activities forces
mill levies to be reduced to a fraction of the rates paid by other districts.
Case Study 3: In Gilpin County School District increases in taxable value did not reduce state
aid.
In 1990, two years before the adoption of TABOR, state voters approved an initiative to permit
limited gaming in three Colorado cities, beginning October 1, 1991. Two of these cities are
located in Gilpin County, also the headquarters of the Gilpin County School District. In the year
during which the gambling initiative was adopted, the taxable value of property located in the
school district totaled $20.4 million. Two years later, and the first year the district's property
taxes were subject to the revenue restrictions of TABOR, the district's taxable value quintupled.
The increase in district property taxes, however, was limited to inflation plus the percentage
change in enrollment, a minor change given the substantial increase in taxable value. As a result,
the district's levy to support the school finance act plummeted from 40 mills to 8 mills in one
year. The proportion of the district's funding from the state, at about 49 percent in the year prior
to TABOR's enactment, originally began to fall but as school district per pupil funding began
increasing at a rate greater than inflation, the state share of school district funding also began
increasing. Today, the state pays 63 percent of the school finance cost in Gilpin County, while
the district's levy of four mills is one of the lowest levies in the state and one-fifth of the
statewide average levy. If the uniform levy concept that preceded TABOR were still in effect
today, Gilpin County's levy, at about 13 mills, would still be low relative to the majority of
school districts, but the district would fully fund its base school budget. State sales and income
taxes would not be subsidizing low property tax rates in that district. Figure 11 shows this
relationship for Gilpin County.
Figure 11: Gilpin County, Taxable Value and State Share
Source: Colorado Department of Education
$0
$50
$100
$150
$200
$250
$300
$350
$400
0%
10%
20%
30%
40%
50%
60%
70%
1992
1993
1994
1995
1996
1997
1998
1999
2000
2001
2002
2003
2004
2005
2006
2007
2008
2009
2010
2011
2012
2013
2014
2015
TaxableValueinMillions
PercentStateShare
Gilpin County: Taxable Value and State Share
Assessed Value Percent State Share
levy freeze takes effect
20
28. The decrease in the tax rate is reflected in what homeowners pay in property taxes to support the
school finance act. Before gambling, Gilpin County homeowners paid about $575 in property
taxes per $100,000 of market value; today they pay $32. On average, homeowners statewide pay
$163 per $100,000 of market value to support the school finance act.
Impacts of TABOR, the Gallagher Amendment, and Amendment 23 on School Finance
Policy Over Time
When combined over time, the implications of TABOR’s multiple limits, Amendment 23, and
the Gallagher amendment are four fold. First, there has been constant downward pressure on mill
levies in many districts that has resulted in a growing disparity in tax burden to support public
education. Second, the local school property tax has been unable to reap the benefit of economic
growth resulting in weaker growth of local support for schools. Third, the irreversible nature of
the weakening local share and mandated spending increases is driving up the state share of
school funding at a faster rate than the growth of state revenue, so school finance appropriations
are consuming an ever increasing share of the state’s revenue growth. Finally, with the guarantee
of state aid to backfill reductions in local mill levies, school districts face no incentive to ask the
voters to maintain their levies at a constant level for the base public school equalization program.
Instead, districts with reduced levies gain some “breathing room” on their general operating
levies providing them the opportunity to ask voters for special “override levies” for added
general support, or for capital levies for facilities and controlled maintenance. As discussed later
in the findings section, this dynamic may open the door to wealth-related spending disparities
among districts.
This dynamic began to happen almost immediately. Initially, the School Finance Act of 1994
provided additional funding for most Colorado school districts. For most districts, the amounts
authorized by the new funding formula increased by more than their spending limits allowed
under the restrictions of TABOR, so they needed voter approval to retain the extra money.
Because the additional funding came from the state share at no cost to district taxpayers and
because local mill levies were not increased, nearly all of Colorado’s 176 (at that time) school
districts sought and received voter approval during the 1990s. Since school district spending
limits were eased by these elections, the overall spending limits imposed by TABOR ceased to
be a significant factor in the state’s formation of school finance policies.
However, TABOR also separately limits both the rate and revenue derived from the property tax.
Despite the easing of overall school district spending limits, TABOR’s mill levy and property tax
revenue limits began to force local levies downward, as described in the illustrations above, and
to play a significant role in both the shift in the division of funding between state and local
property taxes and inter-local tax burden disparities.
In FY 1993–1994, 12 districts had mill levies above the uniform rate of 40 mills, 64 districts had
levies below the uniform rate and 99 districts were at the uniform rate. By FY 2014–2015, only
39 districts were at the maximum rate of 27 mills and 139 districts were below this rate.
Consistent with the illustrations above, the data from Colorado show that since the 1992 passage
of TABOR the assessed value of some districts grew dramatically faster than their enrollments
21
29. plus inflation. These districts were forced to lower their levies, in many cases to a level below 10
mills, to avoid violating TABOR’s property tax revenue limit. Many of these same districts
continued to enjoy having the majority of their funding come from the state. Generally, this
phenomenon occurred in districts with significant commercial and energy production activities
which serve to dramatically increase the property tax base without placing upward pressure on
public school enrollments. Since future levy increases are subject to a vote under TABOR, and
since the school finance formula essentially holds districts harmless in times of declining or more
slowly growing valuations, shortfalls in financing program costs for schools in the districts with
permanently reduced levies came from the state General Fund in the form of increasing state
share.
Figures 12 and 13 depict this phenomenon over a more than twenty-year period. In FY 1993–
1994, only three districts had levies of 10 mills or less, and two of the three received very little
state aid. In FY 2014–2015, 21 districts had levies of fewer than 10 mills. Of those 21 districts,
13 received at least half of their total program funding from the state, four received between 15
percent and 50 percent of their funding from the state, and four received little or no funding from
the state.
In the districts currently levying less than 10 mills for school programs, residential taxpayers
have enjoyed property tax reductions from 59.05% to 97.41% since 1993-1994. Of the 21
districts currently taxing at a base levy of 10 mills or less, all but four have seen their state share
increase and nine are in the top quartile for household income in the state. In essence, Colorado
taxpayers are subsidizing extremely low levies in a small sample of districts, many of which are
quite wealthy. The equity distortions caused by these phenomena are the subject of the analytic
findings presented later in this paper.
Figure 12: Mill Levy vs. State Share
Source: Colorado Department of Education
0
10
20
30
40
50
60
0% 20% 40% 60% 80% 100%
1993-1994Mills
Percent State Share
1993-1994
0
10
20
30
40
50
60
0% 20% 40% 60% 80% 100%
2014-2015Mills
Percent State Share
2014-2015
22
31. Since 2000, Amendment 23 Further Distorted State and Local Shares
At the same time per-pupil base funding was growing by inflation plus 1 percent, it was
generally thought that the per-pupil local share of the school finance act could only grow by the
rate of inflation due to TABOR’s property tax revenue limit. This 1 percentage-point difference
between the amount the local share could grow and the rate of total program growth required by
Amendment 23 placed an increasing burden on the state share. In the six years before
Amendment 23 took effect, the state share increased from 54.3 percent of total program costs to
57.1 percent, a rise of 2.8 percentage points. In the first six years after Amendment 23 took
effect, the state share grew from 57.1 percent to 63.9 percent, an increase of 6.8 percentage
points.
The Mill Levy Freeze, Enacted in 2007
In an effort to curtail the continual erosion of the local property tax and the local share of school
funding despite the constitutional hurdles of TABOR, the legislature acted during the 2007
session. Senate Bill 07-199 declared that TABOR’s property tax revenue limit was no longer in
force for 174 school districts because they had received prior voter approval for an exception
from TABOR in order to receive the increased funding provided by the passage of the Public
School Finance Act of 1994.
Under this legislation, districts were required to freeze their levies at the number of mills
imposed in the year prior to passage of the legislation (mills levied in 2006 for payment in 2007).
The law also capped all districts’ levies at 27 mills, reducing the rate in districts with higher mill
levies. Four districts, however, were not affected by the legislation. Of the four, two districts had
not previously sought voter approval, one district sought voter approval but its election was
unsuccessful, and one district’s ballot language did not provide for an exception from TABOR’s
property tax revenue limit. The four districts are Cherry Creek in Arapahoe County, Colorado
Springs and Harrison in El Paso County, and Steamboat Springs in Routt County. In FY 2014-
2015, the four districts comprised 8.99 percent of the assessed valuation of all school districts
statewide and 10.18 percent of all school finance act property taxes collected throughout the
state. They received 11.7 percent of total state equalization payments made that year.
Some districts continued to be required to reduce their levies after passage of the mill levy freeze
legislation, but these reductions occurred in high property wealth districts that received little or
no state aid so that they would not exceed the total funding entitlements specified by the school
finance act. In those cases, the levy reductions were attributable to the school finance act’s total
funding formula, not to TABOR’s property tax revenue limit. There is little doubt that the mill
levy freeze has required school districts to collect more school property taxes, stabilizing the
local and state shares of school funding since 2007. The mill levy freeze and the levy cap of 27
mills resulted in a net increase in statewide property tax collections of about $118 million and
$130 million respectively for the two fiscal years immediately succeeding the passage of the levy
freeze.
24
32. For most districts, the mill levy freeze will result in property tax collections increasing at the
same pace as assessed valuation growth. However, on a statewide basis, this relationship breaks
down over time for one or more of several reasons:
• The levies of the four districts still governed by TABOR’s property tax revenue limits are
likely to keep or perhaps increase the percentage of state aid they currently receive.
• Some districts have experienced or will experience strong assessed valuation growth that
will require levy reductions so they do not collect more in property taxes than the total
funding they are entitled to receive under the act.
• Some districts will experience enrollment declines that will reduce their total program
funding, triggering a reduction in their mill levies so they do not collect more in property
taxes than the total funding they are entitled to receive.
• Some districts will experience rapid enrollment increases, boosting their total program
funding without a corresponding increase in assessed values, so their state aid
distributions will increase.
For these reasons and perhaps others, the levy freeze is an incomplete solution and the distortions
will continue to mount. The next section presents the findings from our research into the specific
taxpayer and district-level distortions introduced into the system since the passage of TABOR.
Findings: This History Has Resulted in Multiple Distortions in Colorado
As the literature demonstrates, TELs have been shown to result in district or jurisdictional
distortions. However, these effects do not end at the district level. In Colorado, there are
distortional, equity, and most importantly distributional impacts at the taxpayer level. These
previously unstudied Colorado effects are the subject of the next sections of this paper.
Distortions to Household Tax Burden
It is easy and obvious to highlight the extremes. In Colorado, the Primero School District is the
most extreme case with the lowest base levy in the state. In 1990 (before TABOR and the 1994
Act) the program levy in Primero was 37.66. Currently Primero levies 1.68 mills, a 95.54 percent
decrease in mills without a commensurate increase in assessed value. The median residential
taxpayer6
in the Primero School District now pays $28.70 per year in school property taxes and
is taxed at an effective rate of 0.05 percent. This is a drop from an effective rate of 1.2 percent in
1990 when the median taxpayer paid $189.92. If school property taxes had grown with inflation
between 1990 and 2014, taxpayers in Primero would have paid $369.82 in 2014. Furthermore, in
6
For the remainder of this analysis, the median taxpayer is defined at the taxpayer with both a median priced house
and the median household income for the district. Medians for the districts for 2010 and 2014 are from the five year
American Community Survey data for the five-year period ending in the analysis year. Medians for the years 1990
and 2000 are from the SF3 data collected from the long form census survey.
25
33. this environment of declining nominal and real taxes, the Primero School District currently
receives 82 percent of its base funding from the state General Fund.
However, the experience of one district does not provide evidence of distortion. If a similar
dynamic occurred in all districts in the state, then the combination of Colorado’s limits and its
school finance act simply served to reduce the tax burden universally. However, as the following
sections demonstrate, the effect was not universal. The best way to measure the effect on tax
burden across Colorado’s households and to understand the distortions introduced in the wake of
1992 is to examine the changes in the effective rates paid by the median taxpayer in each school
district.
While the effective tax rates for the majority of median residential taxpayers fell between 2000
and 2014, the median taxpayers in 27 of the state’s districts saw their effective tax rates increase
over that same period. Figure 14 shows the distribution of the change in effective rates on the
median taxpayer.
Figure 14: Graphical Representation of the Change in Effective Rates: 2000 to 20147
While the passage of the 1994 Act appears initially to have brought down rates and inequality
across districts, over time maximum effective rates across the districts have generally increased
while minimum effective rates have continually decreased. This has resulted in a generally
widening variation, as measured by both the spread and the standard deviation of effective rates
as shown in Figure 15. Since 2000, the school property tax burden across Colorado has become
more unequal as subsets of districts have had their levies driven down by TABOR. It is
7
In 2000, Colorado had only 176 school districts. So we cannot calculate change in effective rates for those districts.
They are coded white in this map.
26
34. important to note that the mill levy freeze does appear to be mitigating some of this inequality.
However, as outlined above, the levy freeze remains an incomplete solution.
Figure 15: Median Taxpayer Effective Tax Rates – PSFA Mills
Source: Author’s calculation from ACS, Colorado Department of Education data
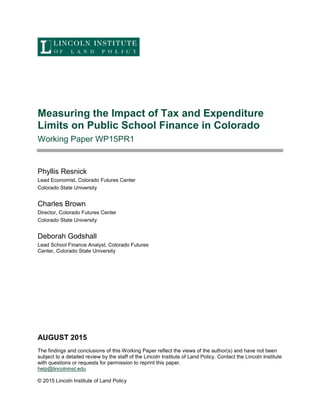
While property taxes for the base school program became more unequal in the wake of
TABOR’s impact on the 1994 Act, they also became less progressive. Figure 16 below shows
the coefficient on household income for a series of equations that regressed effective tax rates on
household income in 1990, 2000, 2009, and 2014. If the system were gaining progressivity, there
would be a larger positive relationship between effective rates and household income over time.
Or, the coefficient of a regression of effective rates on income would be getting larger. Instead,
for the base levy, that coefficient has fallen since 1990. Total school levies, which represent the
totality of levies and include the sometimes large override levies for school programs and bond
levies for debt service on capital, also became steadily less progressive. And progressivity
matters if, as is the case in many districts in Colorado, decreasing progressivity is accompanied
by an increasing and unequal (across districts) reliance on state aid.
0.00%
0.50%
1.00%
1.50%
2.00%
2.50%
3.00%
3.50%
4.00%
Maximum Effective Rate Minimum Effective Rate Spread Standard Deviation
Median Taxpayer Effective Tax Rates - PSFA mills
1990 2000 2009 2014
27
35. Figure 16: Progressivity of Mills8
It is notable that the only levy that became increasingly progressive over this time period was the
override levy. Override levies were a seldom used option under the 1988 Act. In 1990, only 12
districts had approved override levies. However, since the passage of the 1994 Act they have
become a far more common element of the system of school finance in Colorado. As described
above, an override levy is a locally approved mill levy which supplements the base program
expenditures in a district.
The impact of the override levies will be further covered below in the analysis of district
distortions. But the increasing progressivity of this component of school finance leads to the
hypothesis that wealthier districts are more likely to approve such levies. Some of these
wealthier districts were beneficiaries of falling base levies under TABOR, allowing for more
“room” to approve other taxes. Generally progressivity is viewed as an equity enhancing
component of a tax system. However, in this case where the only component exhibiting increases
in progressivity is the override levy, it suggests greater funding disparity across districts and
perhaps decreasing equity.
Distortions Across Districts
It is reasonable to hypothesize that the TABOR-caused distortions to household tax burdens, as
described above, would also extend to school districts. The logical supposition is as follows:
falling base levies made “room” in the property tax in those districts which were the
beneficiaries of the very low base levies, and for those districts, because of the low base property
tax burden, it would be easier to gain approval9
for override levies. If this were the case, districts
8
In 1990, only 12 districts assessed override levies. For 164 districts, the override levy was zero. With such
minimal use of this levy in 1990, it was not possible to meaningfully calculate a progressivity coefficient.
9
Remember, all levy increases in Colorado are subject to a vote.
Progressivity Coefficient of the
PSFA Mill levy
Progressivity Coefficient of the
override mill levies
Progressivity Coefficientof total
school mill levies
1990 0.009 0.022
2000 0.005 0.003 0.014
2009 0.002 0.003 0.010
2014 0.001 0.004 0.008
0.000
0.005
0.010
0.015
0.020
0.025
Progressivity of Mills
1990 2000 2009 2014
28
36. with the largest decrease in base levies should be the heaviest users of override levies, suggesting
that the distortions to school funding forced by TABOR and very directly acting on household
equity would extend to district equity by increasing the variation in per pupil spending across
districts.
It is further reasonable to hypothesize that Gallagher’s shift of relative tax burden to
nonresidential taxpayers would lead to district level distortions in the use of override levies.
Since most nonresidential taxpayers pay 3.64 times the amount of property tax on a property of
the same value10
, and since most nonresidential taxpayers don’t vote in local elections, the
logical supposition with respect to Gallagher is that districts that are more heavily nonresidential
would more likely be heavier users of override levies.
In order to test these hypotheses, we ran a stepwise regression testing for the relationship
between eight explanatory variables and the level of override levies in effect in 2014. The
explanatory variables may be characterized as variables related to TABOR, variables related to
Gallagher, and demographic variables and are as follows:
• TABOR related/affected variables
o Base program mills in 2014
o The change in base program mills between 1990 and 2014
o The effective rate paid for the base levy in 2014
o The change in the effective rate for the base levy between 1990 and 2014
o The change in state share between 1990 and 2014
• Gallagher related/affected variable
o Residential share of total valuation in 2014
• Demographic variables
o Median household income
o Educational attainment of the head of household (as measured by the share of
households in the districts headed by someone with a bachelor’s degree or higher)
o Population in the district
o Assessed valuation per pupil in 2014
All demographic variables except for assessed valuation per pupil in 2014 are from the five-year
American Community Survey sample period ending in 2013. Significant coefficients on some or
all of the TABOR and/or Gallagher related variables would support our hypotheses that TABOR
and/or Gallagher are contributing to district level distortions as well as individual taxpayer level
ones. Figure 17 shows the results of the stepwise regression.
10
The assessment rate on most nonresidential property is 29%. For residential property, the rate is 7.96%. The ratio
of 29% to 7.96% is 3.64.
29
37. Figure 17: Stepwise Regression Results on the Use of Override Levies
Dependent Variable: MILLS_OR_2014
Method: Stepwise Regression
Date: 05/14/15 Time: 10:28
Sample (adjusted): 1 176
Included observations: 170 after adjustments
Number of always included regressors: 1
Number of search regressors: 10
Selection method: Stepwise forwards
Stopping criterion: p-value forwards/backwards = 0.1/0.1
Variable Coefficient Std. Error t-Statistic Prob.*
C -1.273874 1.187191 -1.073015 0.2848
POP 2.68E-05 4.35E-06 6.146960 0.0000
ED_ATT 13.43090 2.786070 4.820733 0.0000
AV_PER_PUPIL_14 -2.81E-06 8.72E-07 -3.228421 0.0015
PSFA_MILL_CHG 0.205758 0.063091 3.261279 0.0013
CHG_EFF_RATE -250.3092 104.5744 -2.393598 0.0178
R-squared 0.370895 Mean dependent var 4.091959
Adjusted R-squared 0.351715 S.D. dependent var 5.171445
S.E. of regression 4.163850 Akaike info criterion 5.725413
Sum squared resid 2843.373 Schwarz criterion 5.836089
Log likelihood -480.6601 Hannan-Quinn criter. 5.770324
F-statistic 19.33753 Durbin-Watson stat 1.498900
Prob(F-statistic) 0.000000
Selection Summary
Added POP
Added ED_ATT
Added AV_PER_PUPIL_14
Added PSFA_MILL_CHG
Added CHG_EFF_RATE
Note: p-values and subsequent tests do not account for stepwise selection.
Our findings demonstrate variation in the use of overrides across districts, suggesting that there
is an impact to district equity. See Figure 18 for a geographic representation of the use of
overrides across the 178 school districts. And, we find that both TABOR related and
demographic variables explain the variation in the level of 2014 override levies.
30
38. Figure 18: Geographic Representation of the Use of Override Levies Statewide
Source: Colorado Department of Education
Two of the TABOR driven variables are significant in explaining the level of override levies: the
change in base program mills between 1990 and 2014 and the change in base levy effective tax
rates on the median household between 1990 and 2014. However, in somewhat of a contradiction
they have opposite signs. We would expect larger declines in both effective tax rates and mill
levies to be correlated with use of override levies. Since larger declines are represented by bigger
negative (and thus smaller) numbers, we would expect both of these TABOR variables to have
negative signs. By this reasoning, the change in effective tax rates has the correct sign while the
change in mill levies does not.
Effective tax rates are the best measure of household tax burdens since they relate taxes paid to
household income. So, the negative sign on this variable provides strong support to the “room in
the levy” hypothesis. Households are demonstrating that as their effective tax burdens fall, at
least in part due to declines in base school mill levies, they are more likely to approve override
levies.
The positive sign on the change in the level of the mill levy appears inconsistent with the “room
in the levy” hypothesis. However, one might argue that households do not react as strongly to the
change in the absolute level of the mill levy since it is not a direct measure of tax burden. For
example, a relatively large change in a high mill levy may still leave a household with a
significant property tax effective rate and thus still result in the defeat of override levies. So,
while the two TABOR related variables carry different signs, we conclude that significant
negative coefficient on the change in effective tax rate variable provides some evidence that
31
39. overrides are more heavily used in districts in which declines in base levies have taken pressure
off household tax burdens, thus providing “room” to gain approval for override levies.
In addition to the TABOR related variables, most of the demographic factors were significant in
this regression. Spending variations by district are also a function of the size, tax base and
educational attainment of those living in the district. In 2014, Colorado districts with higher
override levies were larger in population, had a higher share of households headed by someone
with a bachelor’s degree or higher, and had lower assessed value per pupil11
. It may seem
initially that assessed value per pupil has the wrong sign in this regression. If assessed value per
pupil were a measure of wealth, one would expect that wealthier districts would be more likely
to have higher override levies. However, if assessed value per pupil is interpreted as a measure of
tax base, the negative sign is plausible. Residents may be willing to compensate for lower tax
base with override levies to enhance school funding, even in light of the state equalization
support.
Interestingly, while the assumptions of the Tiebout hypothesis are violated in Colorado with
respect to program funding for schools, override levies appear to demonstrate “voting with your
feet” behavior. While variations in base levies are largely out of the control of the citizens or the
school district officials because of TABOR’s property tax limit and its effect on the 1994 Act,
override levies are very much subject to the quasi market whose players are the district officials
and the citizens. Our regression results support the proposition that Coloradans are sorting
themselves into school districts by preferences for a level of school services. Overrides are
correlated with socio demographic variables such as wealth, size and educational attainment of
the head of household in the district as well as with the TABOR related variables. This suggests
that in addition to the “room in the tax base” hypothesis, override behavior also reflects “voting
with your feet” behavior to express preferences for education. In fact, Coloradans aren’t just
voting with their feet…override levies are subject to an actual vote. It is beyond the scope of this
research but worth considering whether the override mechanism, particularly with respect to the
extent it is distorted by TABOR, is creating a level of wealth related spending disparity that
could be constitutionally unacceptable to the courts.
There is evidence that TELs in Colorado, particularly TABOR, are distorting base school
property tax burdens across households and districts. In addition to the distortional and equity
impacts outlined above, there are further impacts. While there is no real world counterfactual,
our models demonstrate that there are significant distributional impacts from TABOR. Not
everyone in Colorado has experienced a limiting effect on their property taxes because of
TABOR. In fact, as the following section describes, the majority of Coloradans are paying more
in local property taxes for schools than they would if TABOR had never passed.
The Ultimate Question of Distortions Caused by TABOR – What Would Tax Burdens Be
Had It Not Passed?
11
It is possible that assessed value per pupil is a Gallagher affected variable. One way a district will have lower
assessed value per pupil is if it is more highly residential and thus has a larger share of property assessed at the
residential rate of 7.96%. However, there are other reasons for lower assessed value per pupil as well. It was outside
the scope of our research to determine the reason for the lower assessed value per pupil in each of the 178 districts.
32
40. It is reasonable to consider what would have happened had TABOR not been adopted and the
uniform levy requirements from the 1994 Act had remained in effect and unaffected by the
property tax and mill levy limits imposed by TABOR. Admittedly, TABOR's passage is more
than two decades in the past. No one can know what would have happened to school finance
during the periods of economic growth and recession in the years since TABOR’s enactment, as
decisions would have been left to state policymakers. However, it is possible to make reasonable
assumptions and model the local share of school finance funding without TABOR’s property tax
revenue limit and prohibition on tax rate increases without a vote.
In a simulation, we modeled a uniform levy for FY 2014-2015 using the state revenues that were
actually appropriated in that year. This approach allowed us to isolate the effects of the property
tax and mill levy limits contained in TABOR on individual districts and statewide under neutral
assumptions concerning the total amount of state and local funding in the system of school
finance. That is, we remained agnostic on the question of whether the funding dedicated to
schools was too high or too low and instead took the current level as given.
The findings from our simulation reveal that TABOR forced fairly significant redistributional
effects on school funding in Colorado. The model indicates that in FY 2014-2015 a uniform levy
framework similar to the one in effect immediately preceding the enactment of TABOR would
have resulted in a uniform rate of 22.888 mills compared with today's maximum levy of 27 mills.
Without any change in total funding, property owners in 74 districts would have paid a combined
$160.2 million less in school property taxes than they did under the current mill levy framework
and in 104 districts, property owners would have paid a combined $160.2 million more. 12
The 74 districts that would have paid less in property taxes account for about 41.5 percent of the
178 school districts. However, these districts educate four out of every five pupils funded under
the school finance act and contain 81 percent of the state’s population. One of the primary
reasons for the property tax reduction is the decrease from the current maximum levy of 27 mills
to the simulated uniform rate of 22.888. In contrast, the 104 districts that would contribute more
to the funding of the school finance act through increased property taxes represent approximately
20 percent of students statewide and approximately one-third of the tax base.
The dynamics of the estimated uniform levy and the resulting district state shares are illustrated
in Figure 19. Twenty-five districts have levies less than the uniform rate of 22.888 mills, but
these districts receive no state aid. For the remaining districts, the proportion of state aid depends
on the property tax revenue generated by the uniform levy.
12
In recent years, state budget constraints resulted in a state policy decision to prorate funding under the finance act.
This proration is referred to as the negative factor. The negative factor reduces state aid in proportion to each
district’s total program funding per pupil. However, if districts can pay for the full amount of their funding within
the restrictions on local tax rates, they are not subject to the negative factor proration. In our modeling of a uniform
levy, we permitted district levies to float up to capture all allowable funding, even the amount attributable to the
negative factor, as long as the levy did not exceed the uniform rate. This methodology, which is consistent with
current law, allowed 26 districts to capture more funding, totaling $28 million in property taxes, than is currently
provided to them. We note, however, that the result of this methodology is to increase funding to districts based
solely on property wealth, an idea that is antithetical to most school finance theory.
33
41. Figure 19: State Share vs. Modeled Uniform Levy
Source: Colorado Department of Education
At first pass, it seems counterintuitive that a limit such as TABOR could result in 81 percent of
Coloradans paying more in school property taxes than they would absent the limit. However, this
result must be analyzed in the context of how a fixed pie of resources for schools gets divided
and distributed among the state’s 178 districts.
Because of the dynamics around levies described above, TABOR is essentially forcing the state
share to disproportionally support districts whose base levies have been driven dramatically low.
As demonstrated previously in Figure 13, many of these districts with very low levies are
recipients of high levels of state aid. During the years between the passage of TABOR and the
2007 levy freeze, in most of these districts state aid increased as local mill levies fell due to
TABOR. When viewed from this redistributional perspective, it is no longer counterintuitive that
the majority of the state’s population is paying more under TABOR than if the amendment had
never passed. In essence, since most of the larger districts in Colorado were not the ones whose
levies were driven down by TABOR, the 81 percent of the state’s population living in these
districts were left subsidizing low levies in a subset of the state’s smaller districts whose levies
were driven down.
Which Are the Winner and Loser Districts, and What Do They Look Like?
TABOR has created winners and losers when it comes to tax burden from the base school levy.
In order to better understand the characteristics of the winner and loser districts, we estimated a
logit model with the dependent variable “TABOR_HIGHER”. The 74 districts paying more
under TABOR were coded as “1”; all other districts were coded as “0”. The results of this
estimation are shown below in Figure 20.
0
5
10
15
20
25
30
0% 10% 20% 30% 40% 50% 60% 70% 80% 90% 100%
2014-2015ModeledMills
Percent State Share
State Share vs. Modeled Uniform Levy, 2014-2015
34
42. Figure 20: Logit Model Predicting Characteristics of Winner and Loser Districts Under
TABOR
Dependent Variable: TABOR_HIGHER
Method: ML - Binary Logit (Quadratic hill climbing)
Date: 05/14/15 Time: 10:32
Sample: 1 178
Included observations: 178
Convergence achieved after 9 iterations
Covariance matrix computed using second derivatives
Variable Coefficient Std. Error z-Statistic Prob.
C 12.26353 3.079821 3.981896 0.0001
ASSD_VAL_PER_PUP_14 -3.95E-05 9.11E-06 -4.331712 0.0000
PUPILS_14 3.81E-05 3.01E-05 1.264249 0.2061
STATE_SHARE_15 -11.67008 3.115460 -3.745861 0.0002
McFadden R-squared 0.420436 Mean dependent var 0.415730
S.D. dependent var 0.494238 S.E. of regression 0.368830
Akaike info criterion 0.831848 Sum squared resid 23.67015
Schwarz criterion 0.903349 Log likelihood -70.03450
Hannan-Quinn criter. 0.860844 Restr. log likelihood -120.8400
LR statistic 101.6110 Avg. log likelihood -0.393452
Prob(LR statistic) 0.000000
Obs with Dep=0 104 Total obs 178
Obs with Dep=1 74
Districts paying more under TABOR share the following characteristics: as measured by the
number of pupils, they are large (although this variable is only weakly significant), they receive
smaller state share, and they have lower assessed value per pupil. Perhaps the most interesting
finding here is related to assessed value per pupil.
Taxpayers in districts with higher assessed value per pupil are likely to be paying less property
tax under TABOR than they would if TABOR had never passed. It is difficult to justify this as
good tax policy. First of all, if taken as a measure of tax capacity or tax base, higher assessed
value per pupil districts should have more capacity to support property taxes, not less. Instead
these districts have seen TABOR erode their property taxes by forcing levies downward.
Not all, but many of these districts are resource wealthy. As described above in the case study
about the Primero School District, it is the very existence of this resource wealth that would have
forced the district to reduce levies in order to comply with the TABOR property tax limit.
However, as was the case with Primero, in some of these resource-rich districts state share of
school funding continued to rise. TABOR is forcing all Coloradans to subsidize low levies in
select districts through both higher property taxes in the remaining districts and increased levels
of state share (financed by all Coloradans through statewide taxes).
In Colorado, the distribution of oil, gas, and other resource deposits is not uniform across the
state. Some school districts have the good fortune of being located in areas of significant
35
43. resource wealth. It is generally accepted that this mineral resources translate into a wealthier tax
base and in an undistorted property tax system unevenly benefits some districts over others.
However, it is difficult to argue that it is good tax policy to reduce local tax burdens in those
districts and then use the statewide contributions to the state General Fund to essentially
subsidize the low tax burdens in these high wealth districts, regardless of the source of the
property wealth. Our assessment of TABOR’s winners and losers demonstrates that this is
precisely what is happening in Colorado.
The maps below show, by school district, the change in property taxes and the effective tax rate
spread the median taxpayer in each district is bearing as a result of TABOR. A positive number
means the median taxpayer is facing a higher tax bill and effective tax burden under TABOR
than if TABOR had never passed. Districts with negative spreads are experiencing TABOR
driven reductions in their effective tax rates.
Figure 21: Geographical Representation of Change in Taxes Paid Under TABOR vs. No-
TABOR Analysis, 2014
Source: Author calculation from ACS, Colorado Department of Education data
Figure 22: Geographical Representation of Effective Rate Spread Map of Effective Rate
with TABOR Less Effective Rate without TABOR, 2014
36
44. Source: Author calculation from ACS, Colorado Department of Education data
In 2014, the Cheyenne Mountain School District, in El Paso County, experienced the greatest
increase in effective property tax rates from TABOR. The median taxpayer in Cheyenne
Mountain is paying an effective rate 0.18 percentage points higher than if TABOR had never
passed. The district receiving the most benefit is the Durango School District (La Plata County)
where the median taxpayer is paying an effective rate 0.83 percentage points lower.
In terms of dollars, the district most adversely affected by TABOR’s limits is once again
Cheyenne Mountain where the median taxpayer is paying an additional $135.97 in property taxes
for schools. At the other extreme, the largest beneficiary is the Steamboat Springs School District
(Routt County) where the median taxpayer saved $525.20 because of TABOR. Steamboat
Springs is one of the four districts not covered by the levy freeze and is the 28th
wealthiest
district in the state as measured by median household income.
School Finance and TELS in Colorado: Lessons Learned
We believe that other states can learn a great deal from Colorado’s long experience with TELs as
they impact school finance. In many ways, Colorado policymakers and voters have created a
“perfect storm” of overlapping and conflicting constitutional provisions. Individual actions, each
of which appeared to Colorado citizens to make sense in a vacuum, combine to create a toxic
formula for very confused tax policy. The ability of policymakers and citizens to achieve
predictable outcomes when making policy is greatly reduced by the unpredictable ways TELs
and the school finance law interact. The situation is made more difficult by the fact that
Colorado’s TELs are all constitutional, so addressing them requires voters to understand
37