Downloaded 134 times
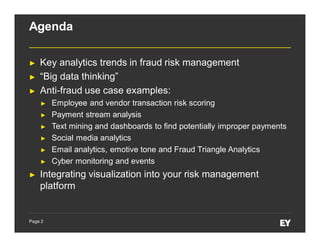

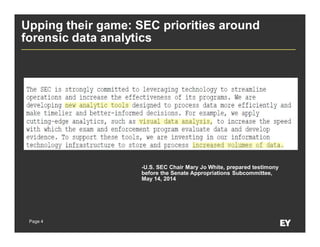
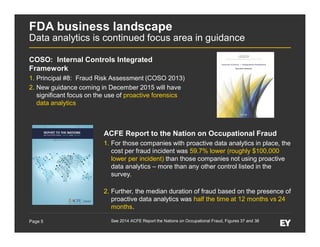


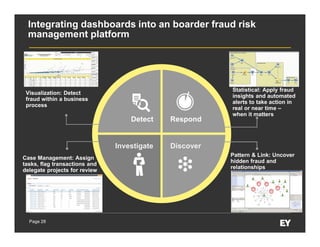
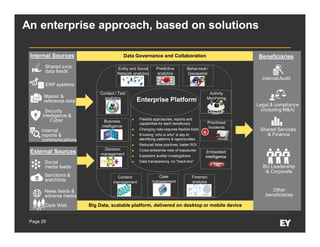


This document discusses forensic data analytics and its use in fraud risk management. It begins with an agenda on key analytics trends, "big data thinking," and examples of anti-fraud use cases like employee and vendor transaction risk scoring. The document then covers the forensic data analytics landscape, increasing regulatory focus on advanced monitoring, and how analytics can help improve compliance efficiency. It discusses challenges of forensic data analytics and integrating visualization into risk management platforms. The document concludes with success factors for deploying forensic data analytics like focusing on priority projects and gaining leadership support.


![[DSC Europe 25] Ivica Milaric - The Future of Gaming and AI Tools.pptx](https://cdn.slidesharecdn.com/ss_thumbnails/tijgzsmgse2kj2y5pzzp-5-ivica-milaric-the-future-of-gaming-x-ai-tools-260114111931-87c2b3ac-thumbnail.jpg?width=640&height=640&fit=bounds)


![[DSC Europe 25] Stefan Brankovic - #ResumeIsDead. AI-Powered Interviews and C...](https://cdn.slidesharecdn.com/ss_thumbnails/qnmbsv0xq3uysdrq3sev-2-stefan-brankovic-job-bolt-260114111931-a065aa3d-thumbnail.jpg?width=640&height=640&fit=bounds)


