Download to read offline

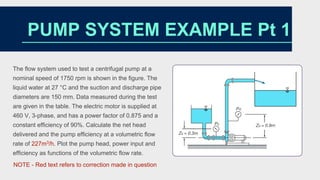
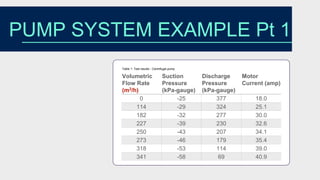
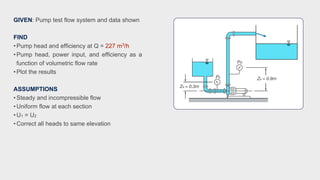
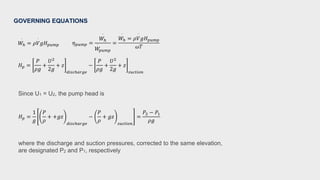
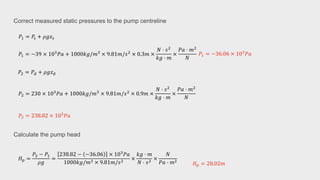
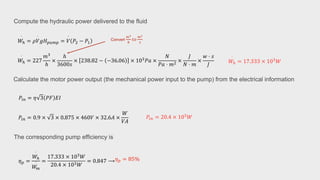
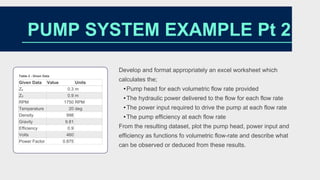
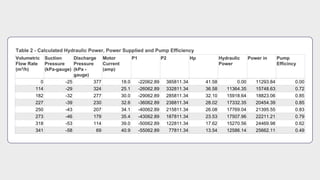
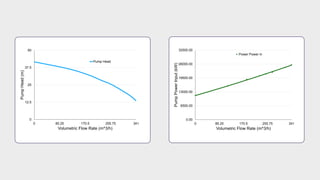
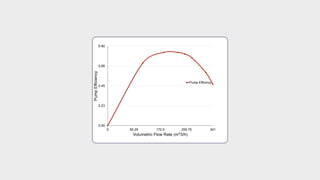
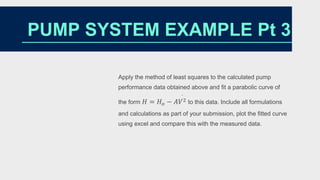
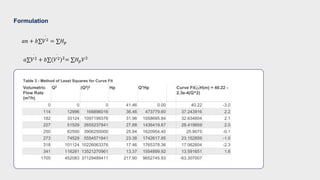
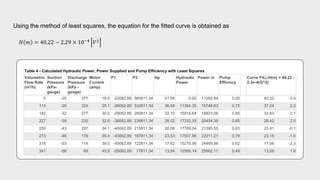
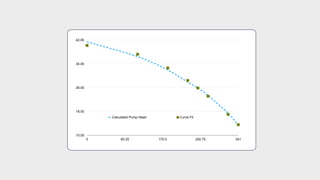

The document summarizes a test of a centrifugal pump. Key details include: - The pump was tested at 1750 rpm with water at 27°C flowing through 150 mm pipes. - Test data on flow rate, suction/discharge pressures, and motor current were provided. - Calculations were shown to determine the pump head and efficiency at 227 m3/h flow. - Additional calculations fitted the performance data to a curve and compared to measurements.