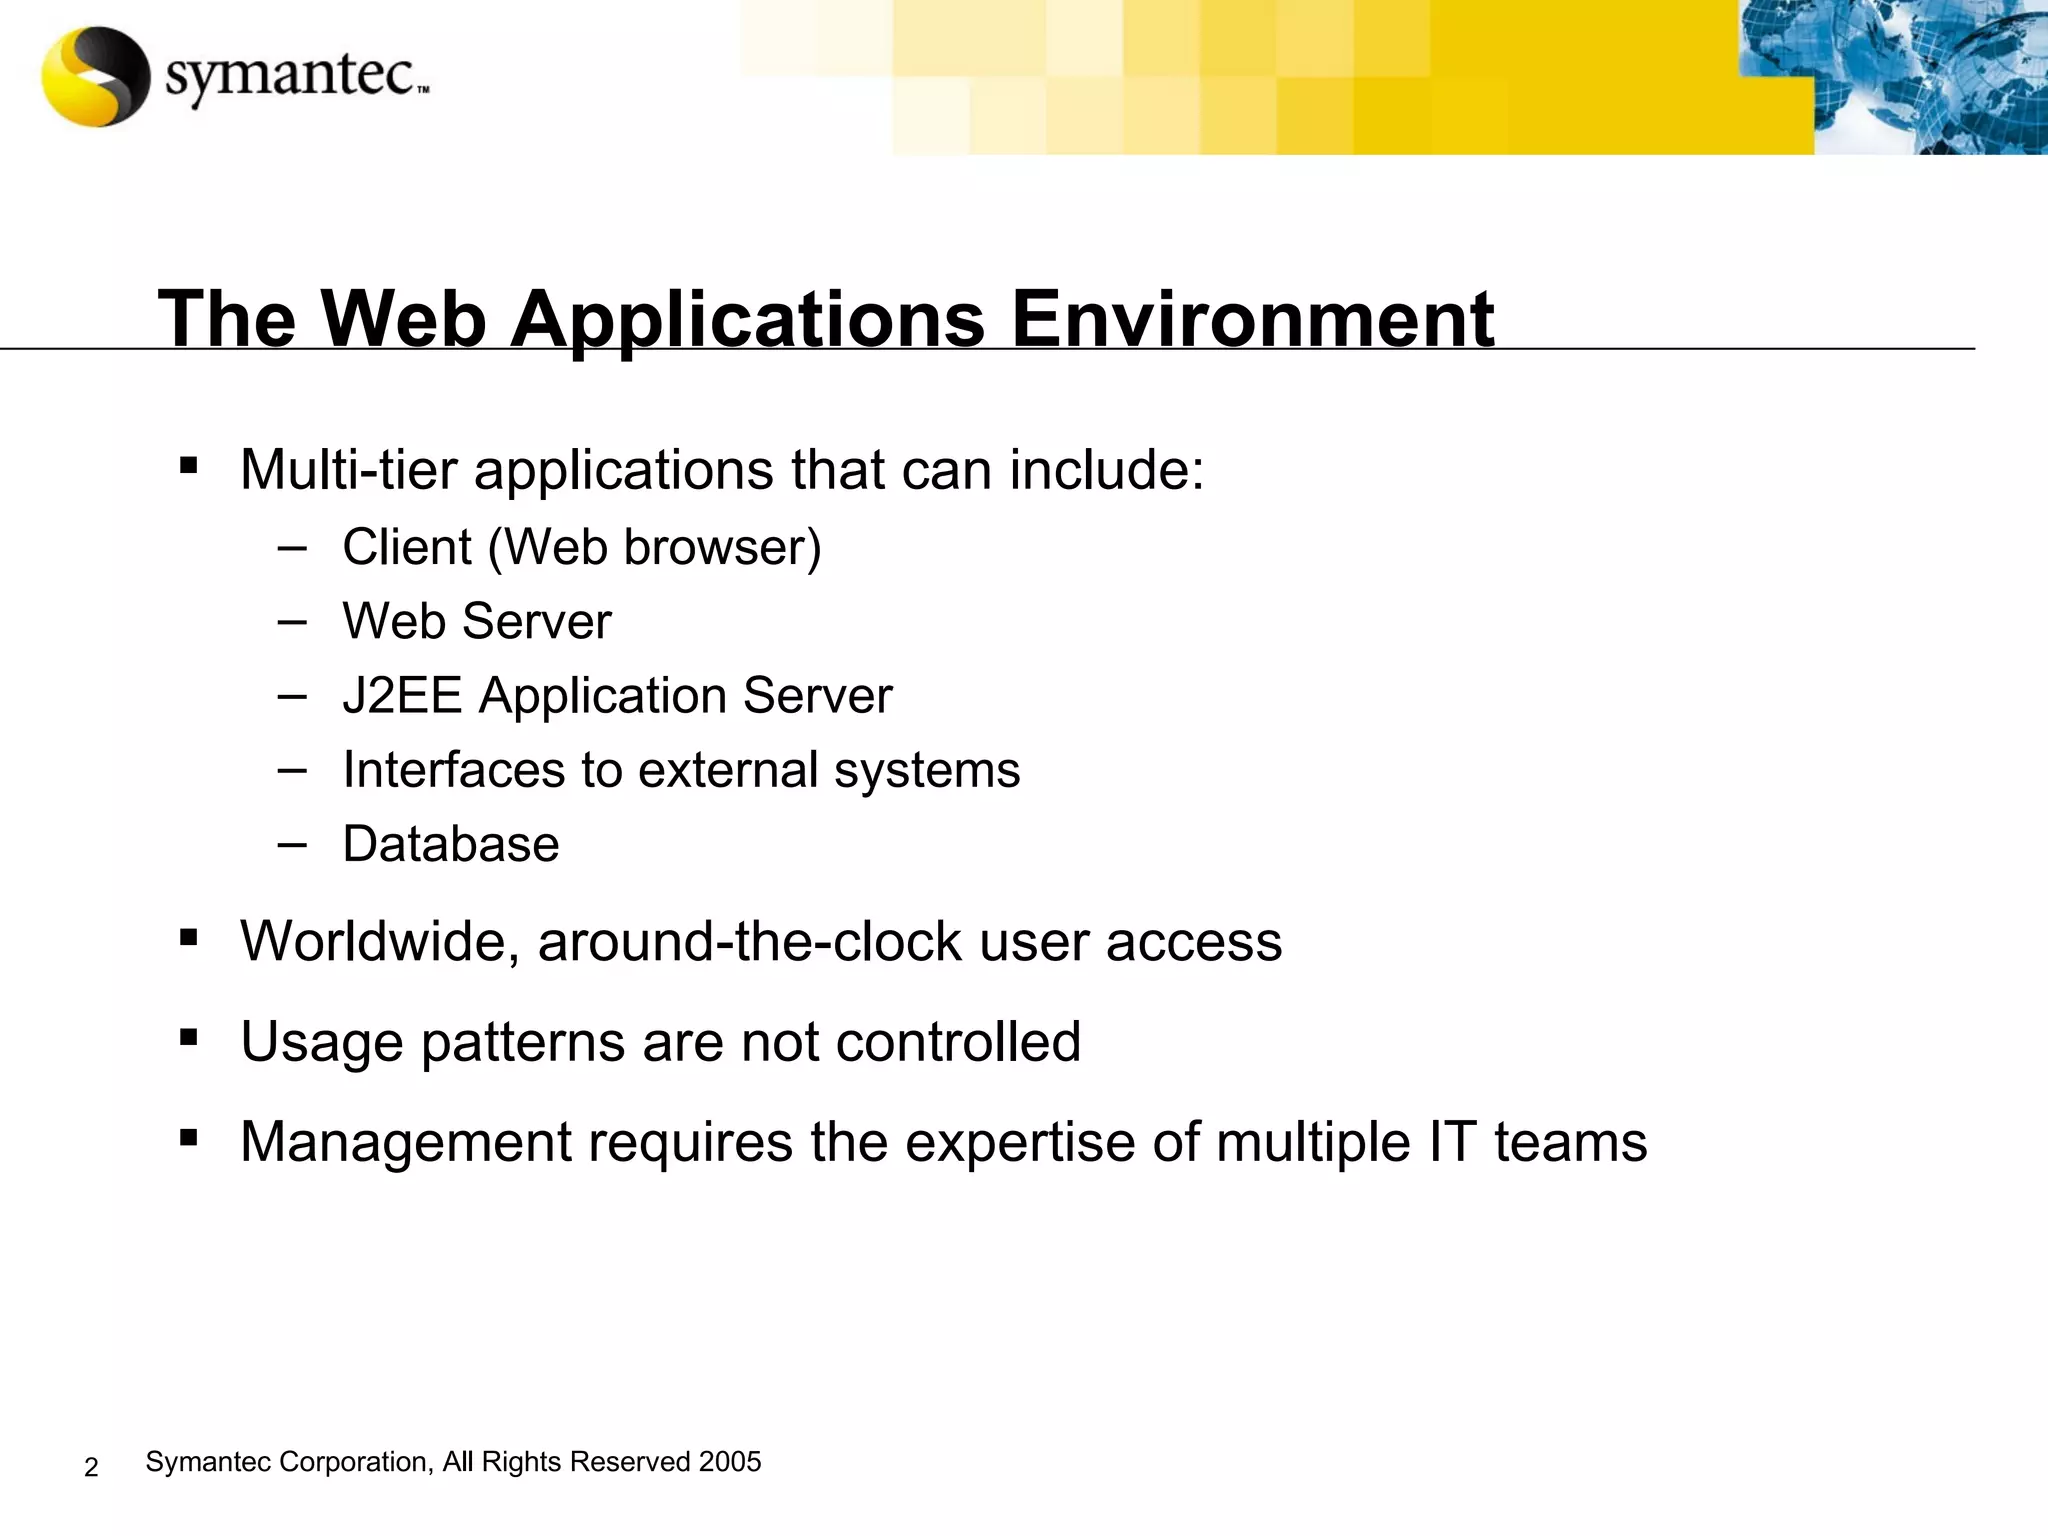
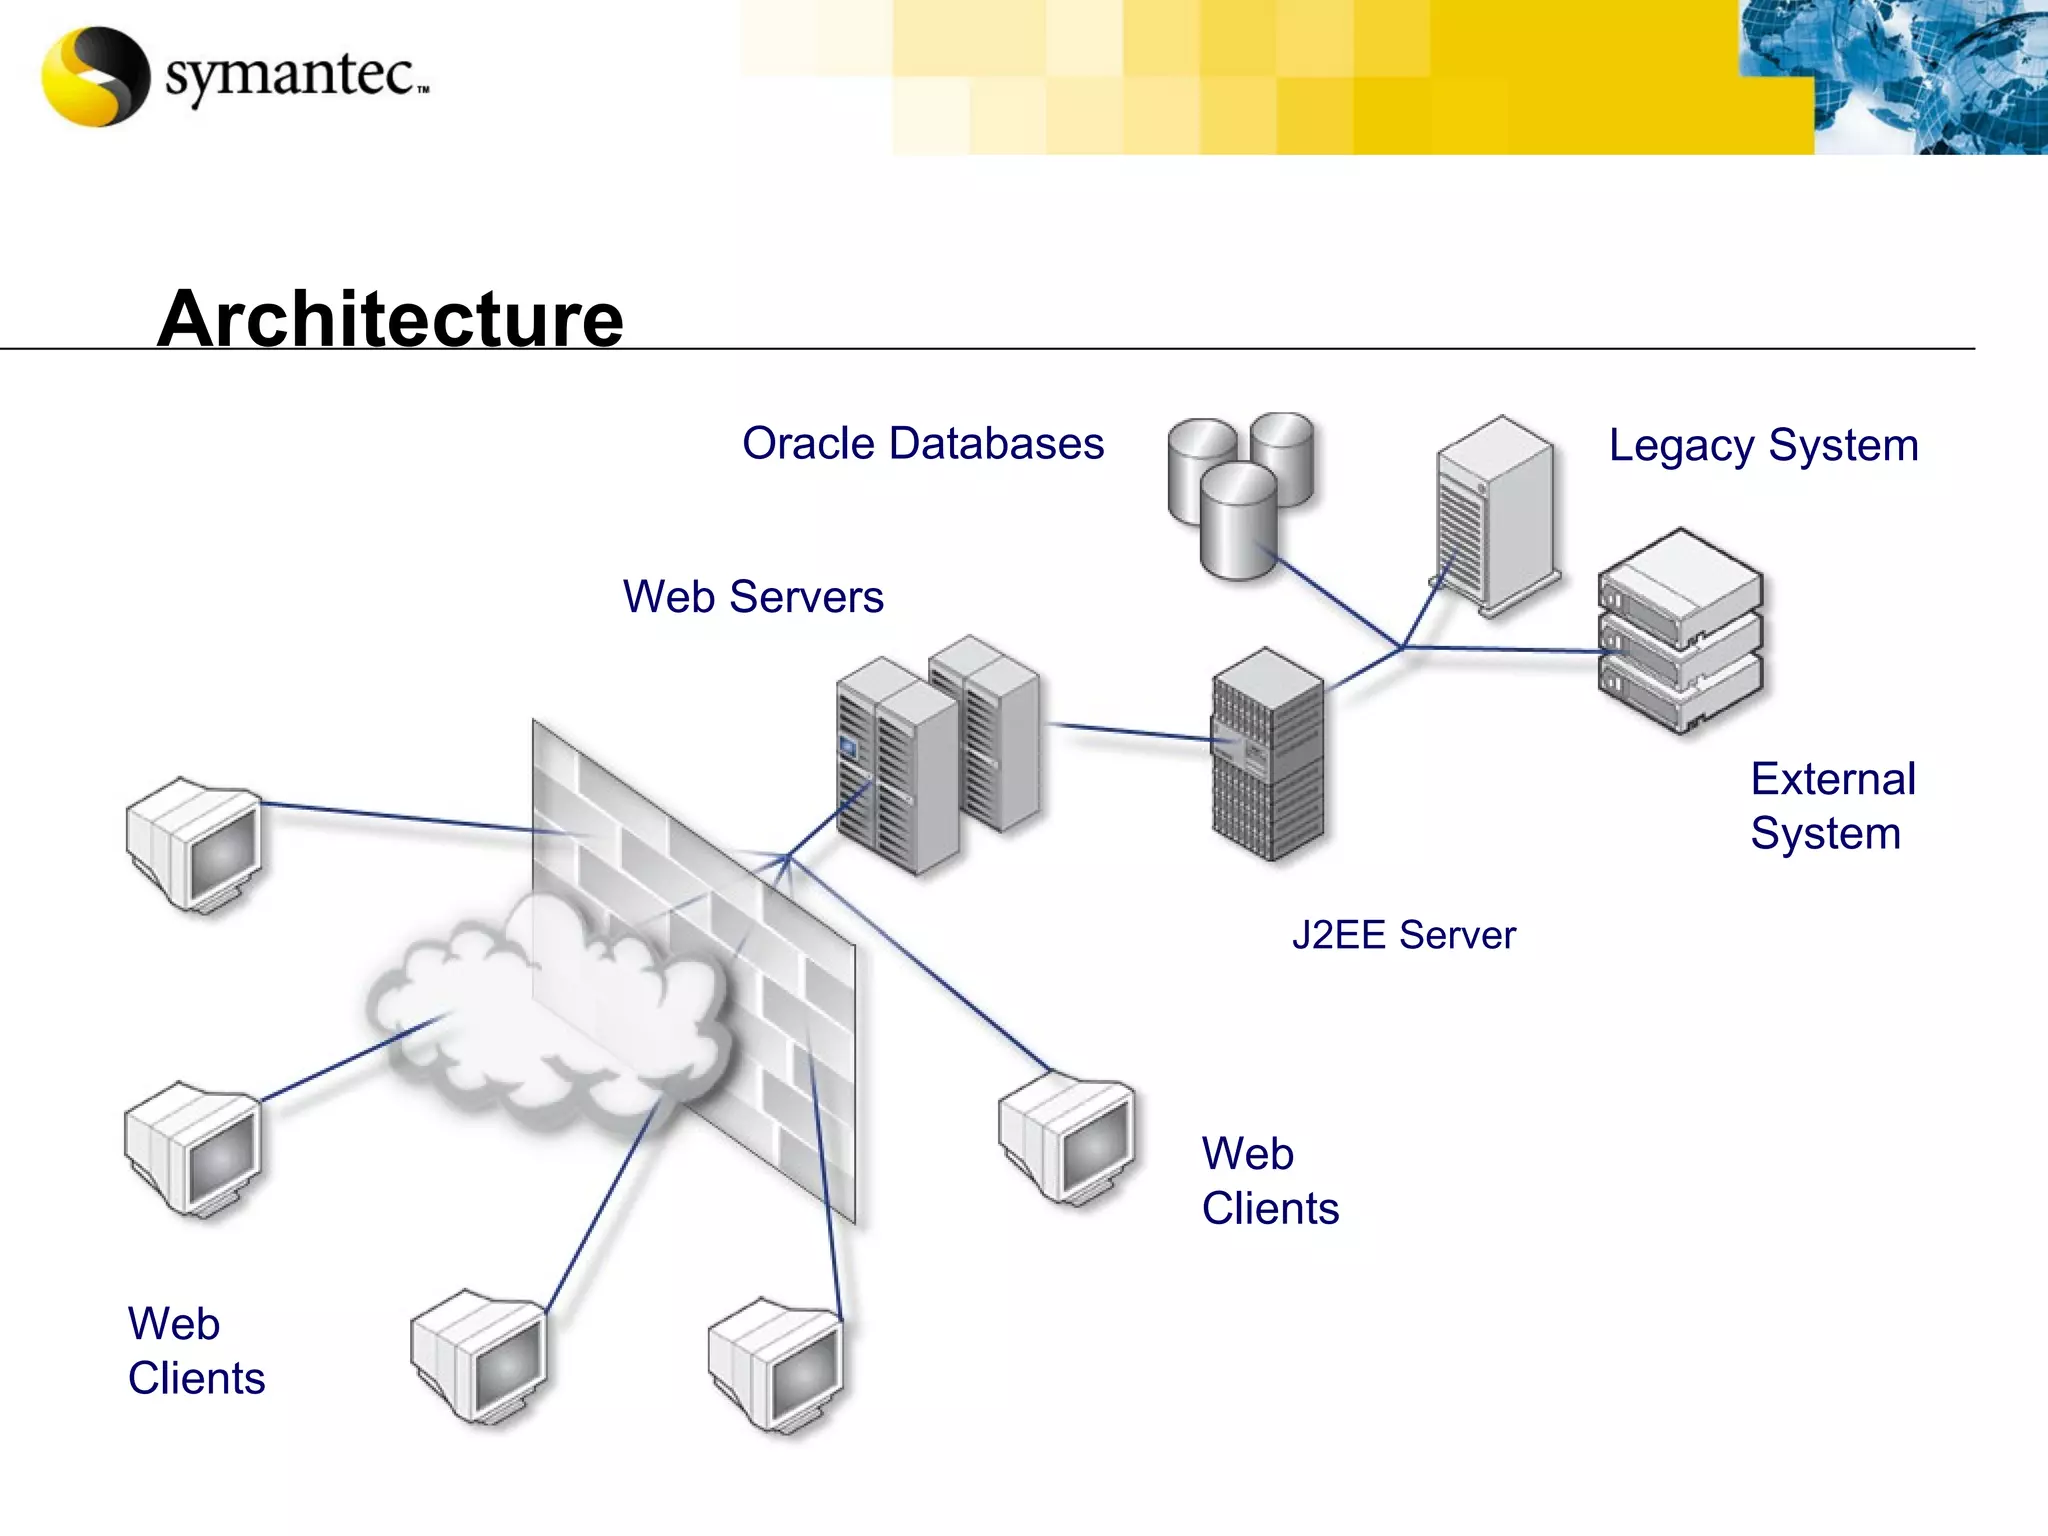
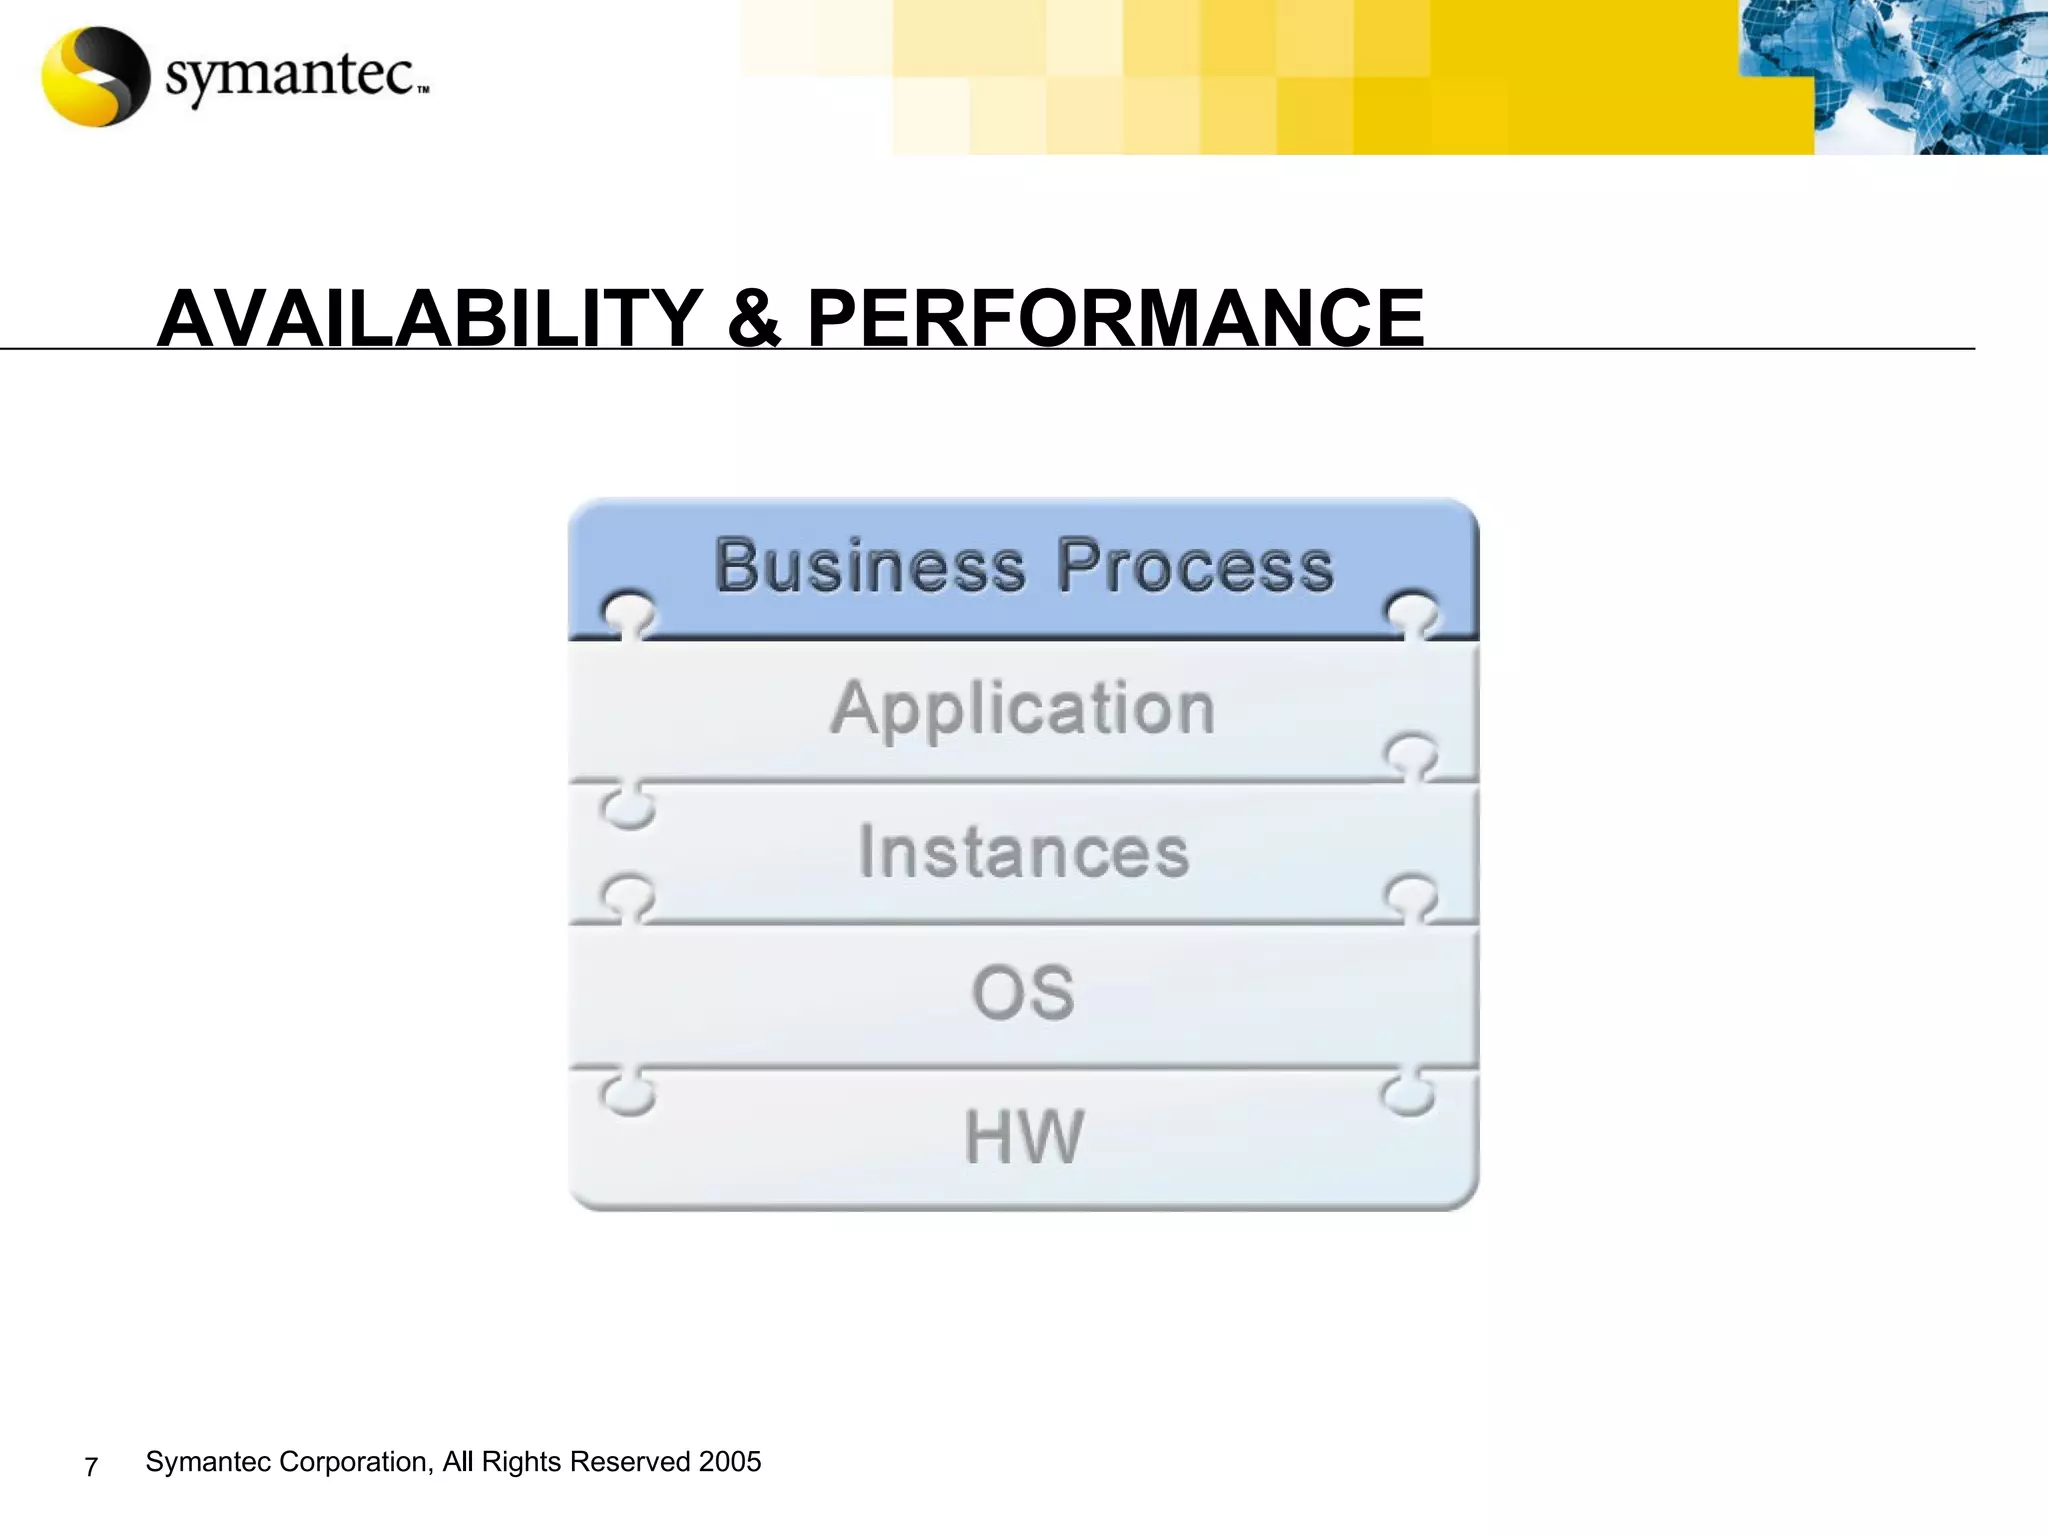
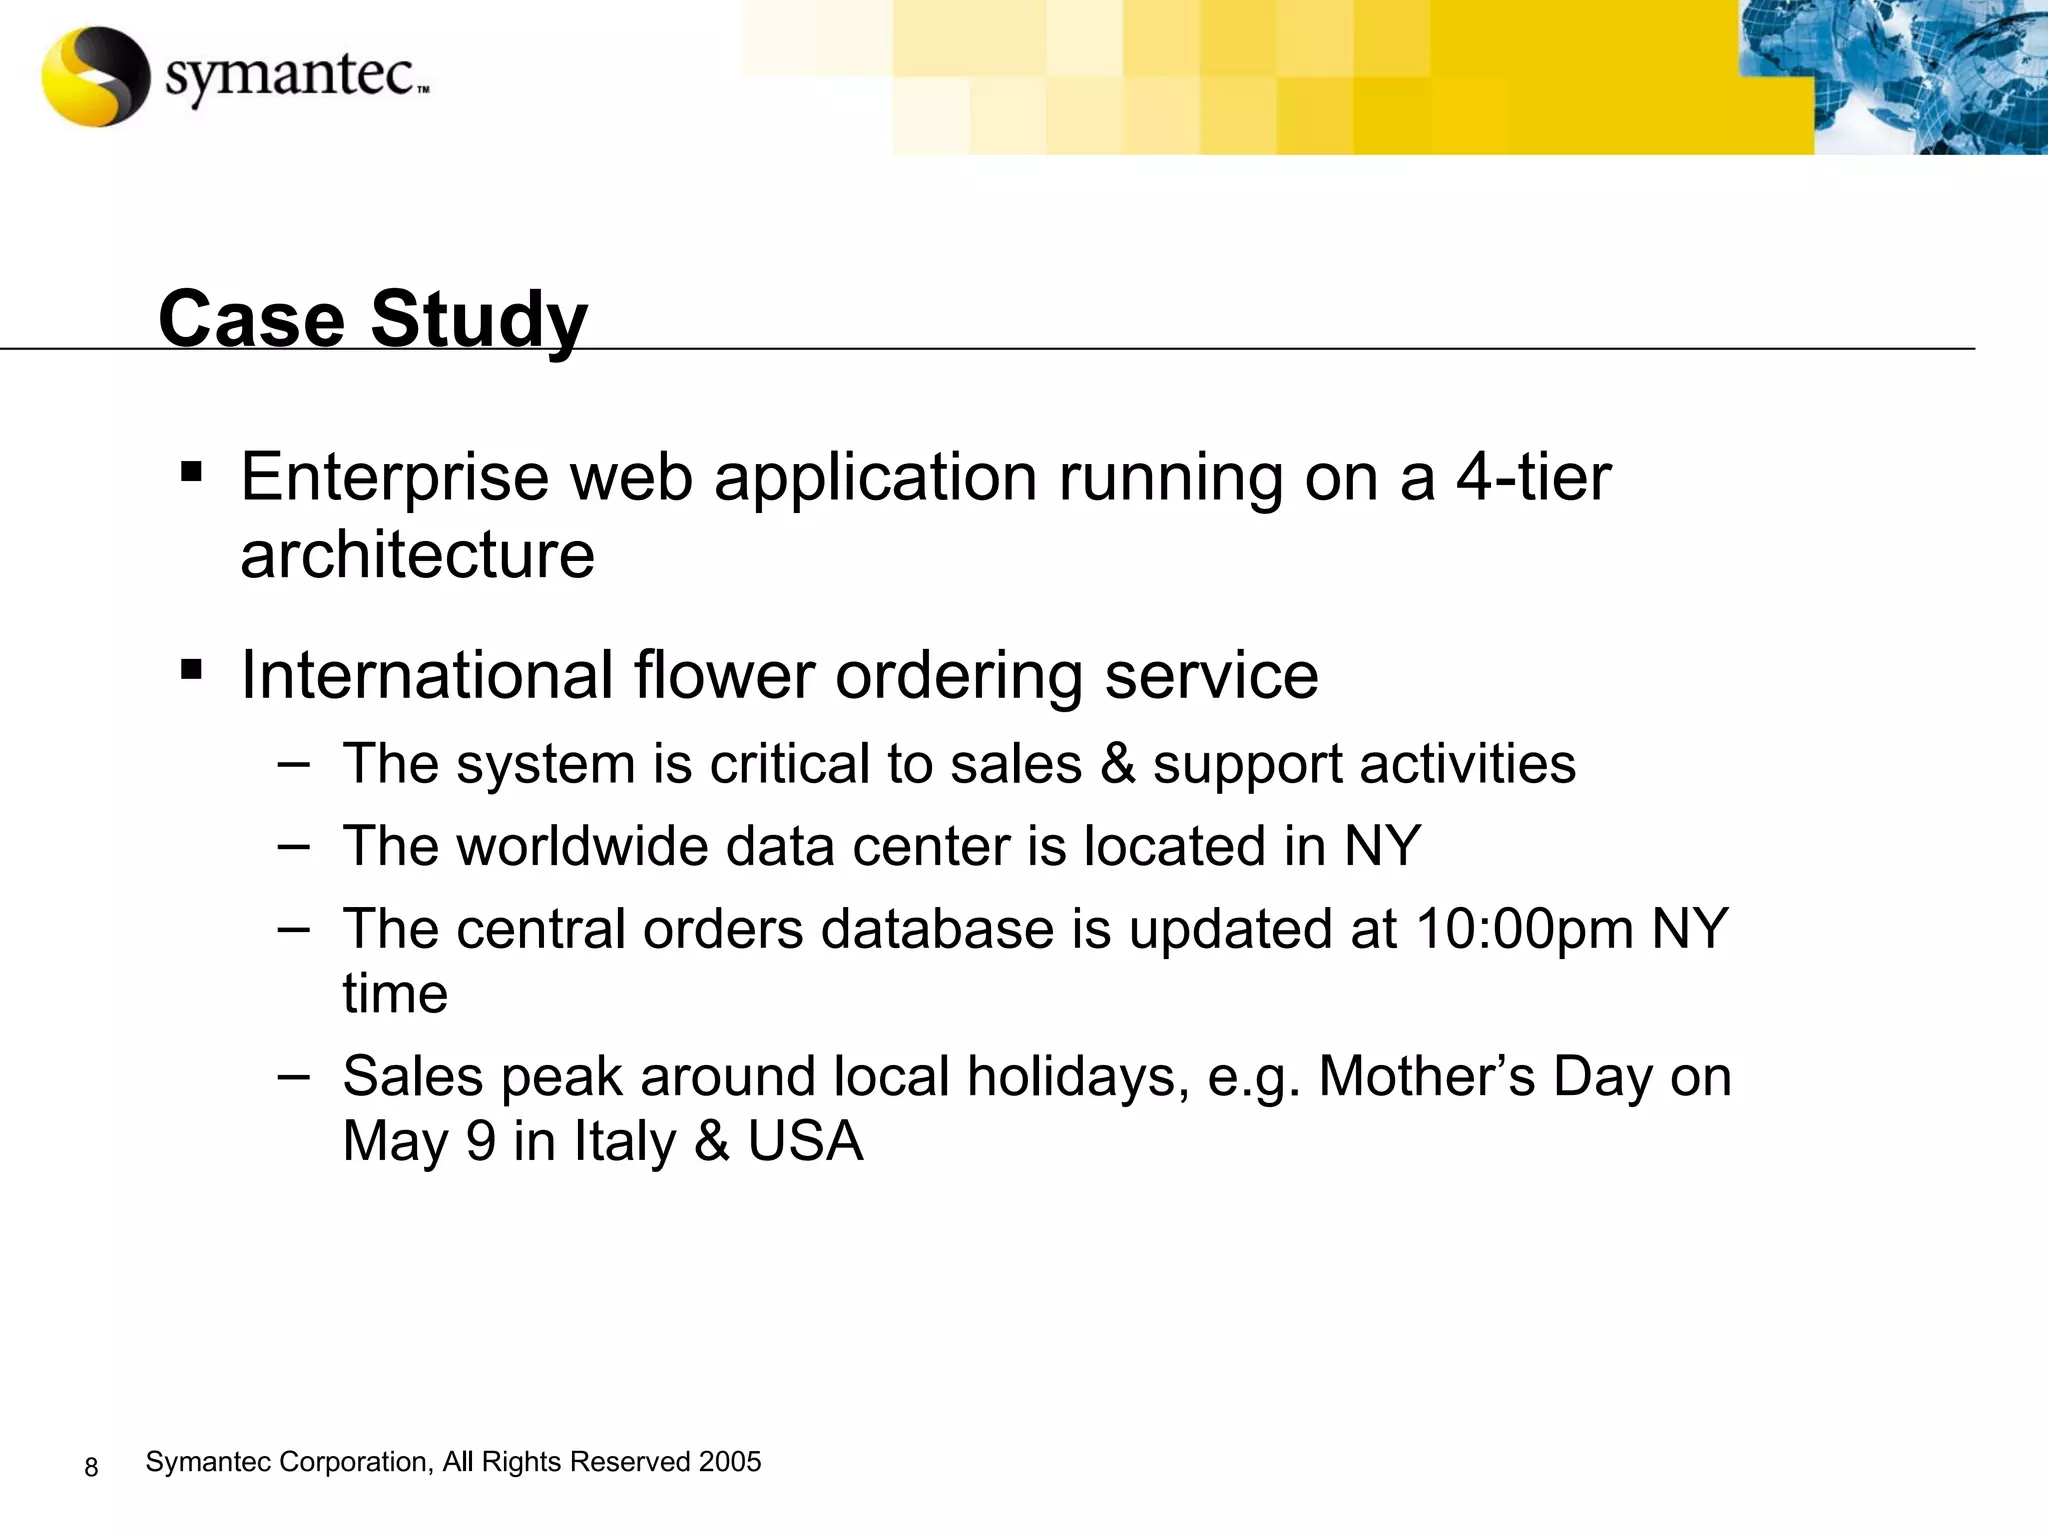
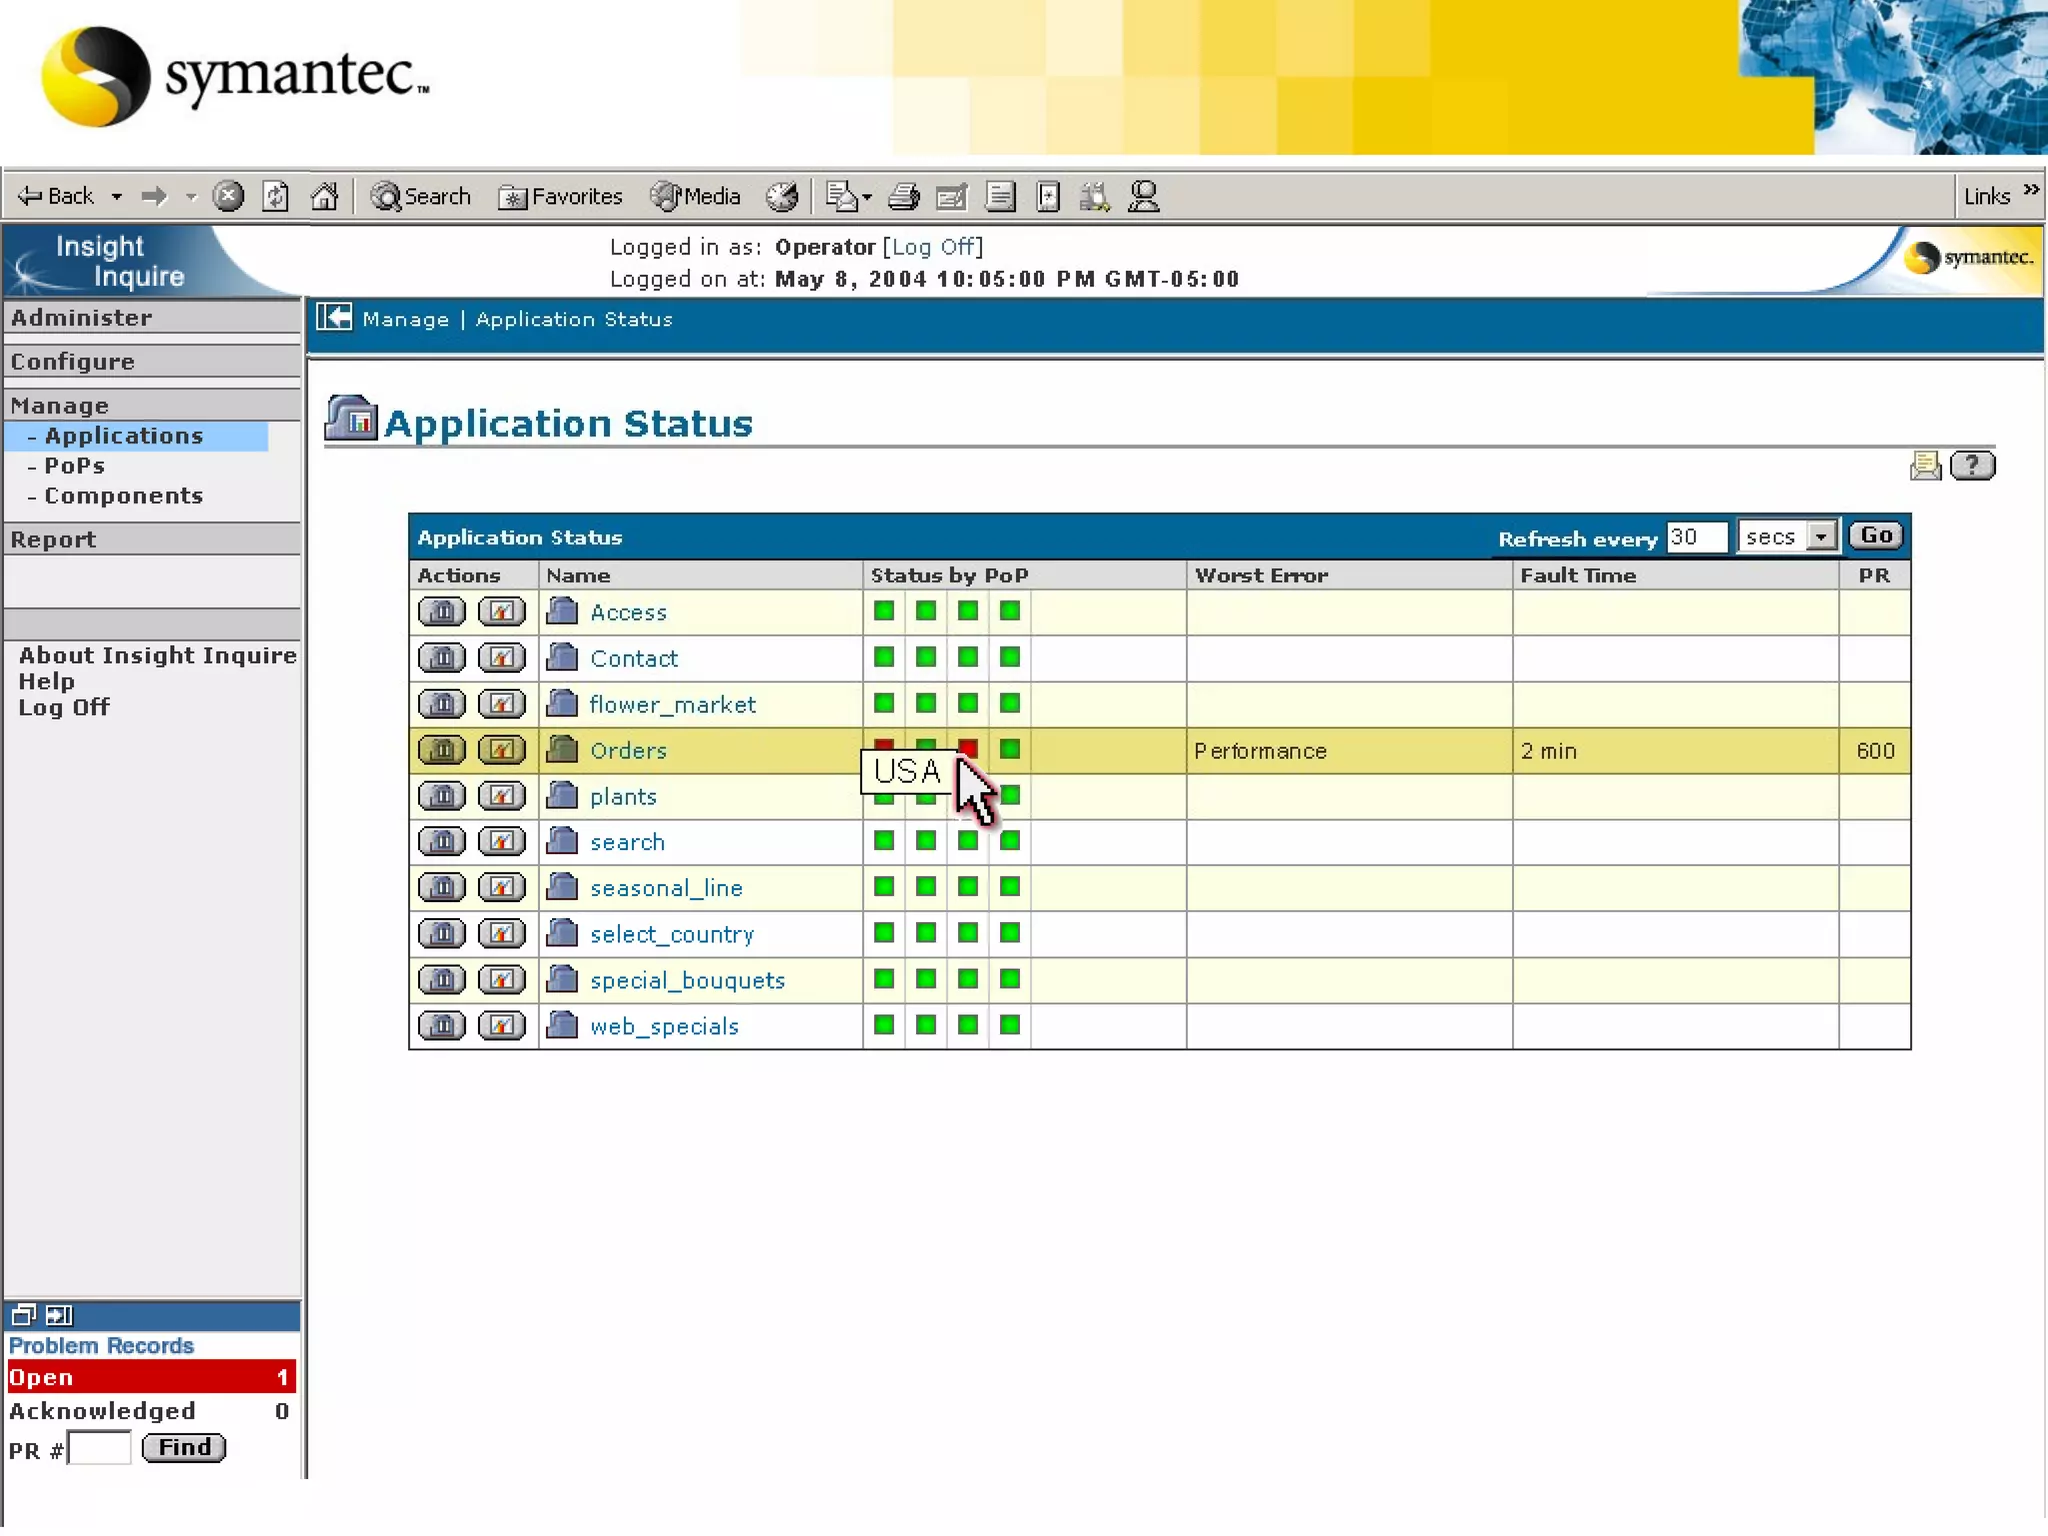
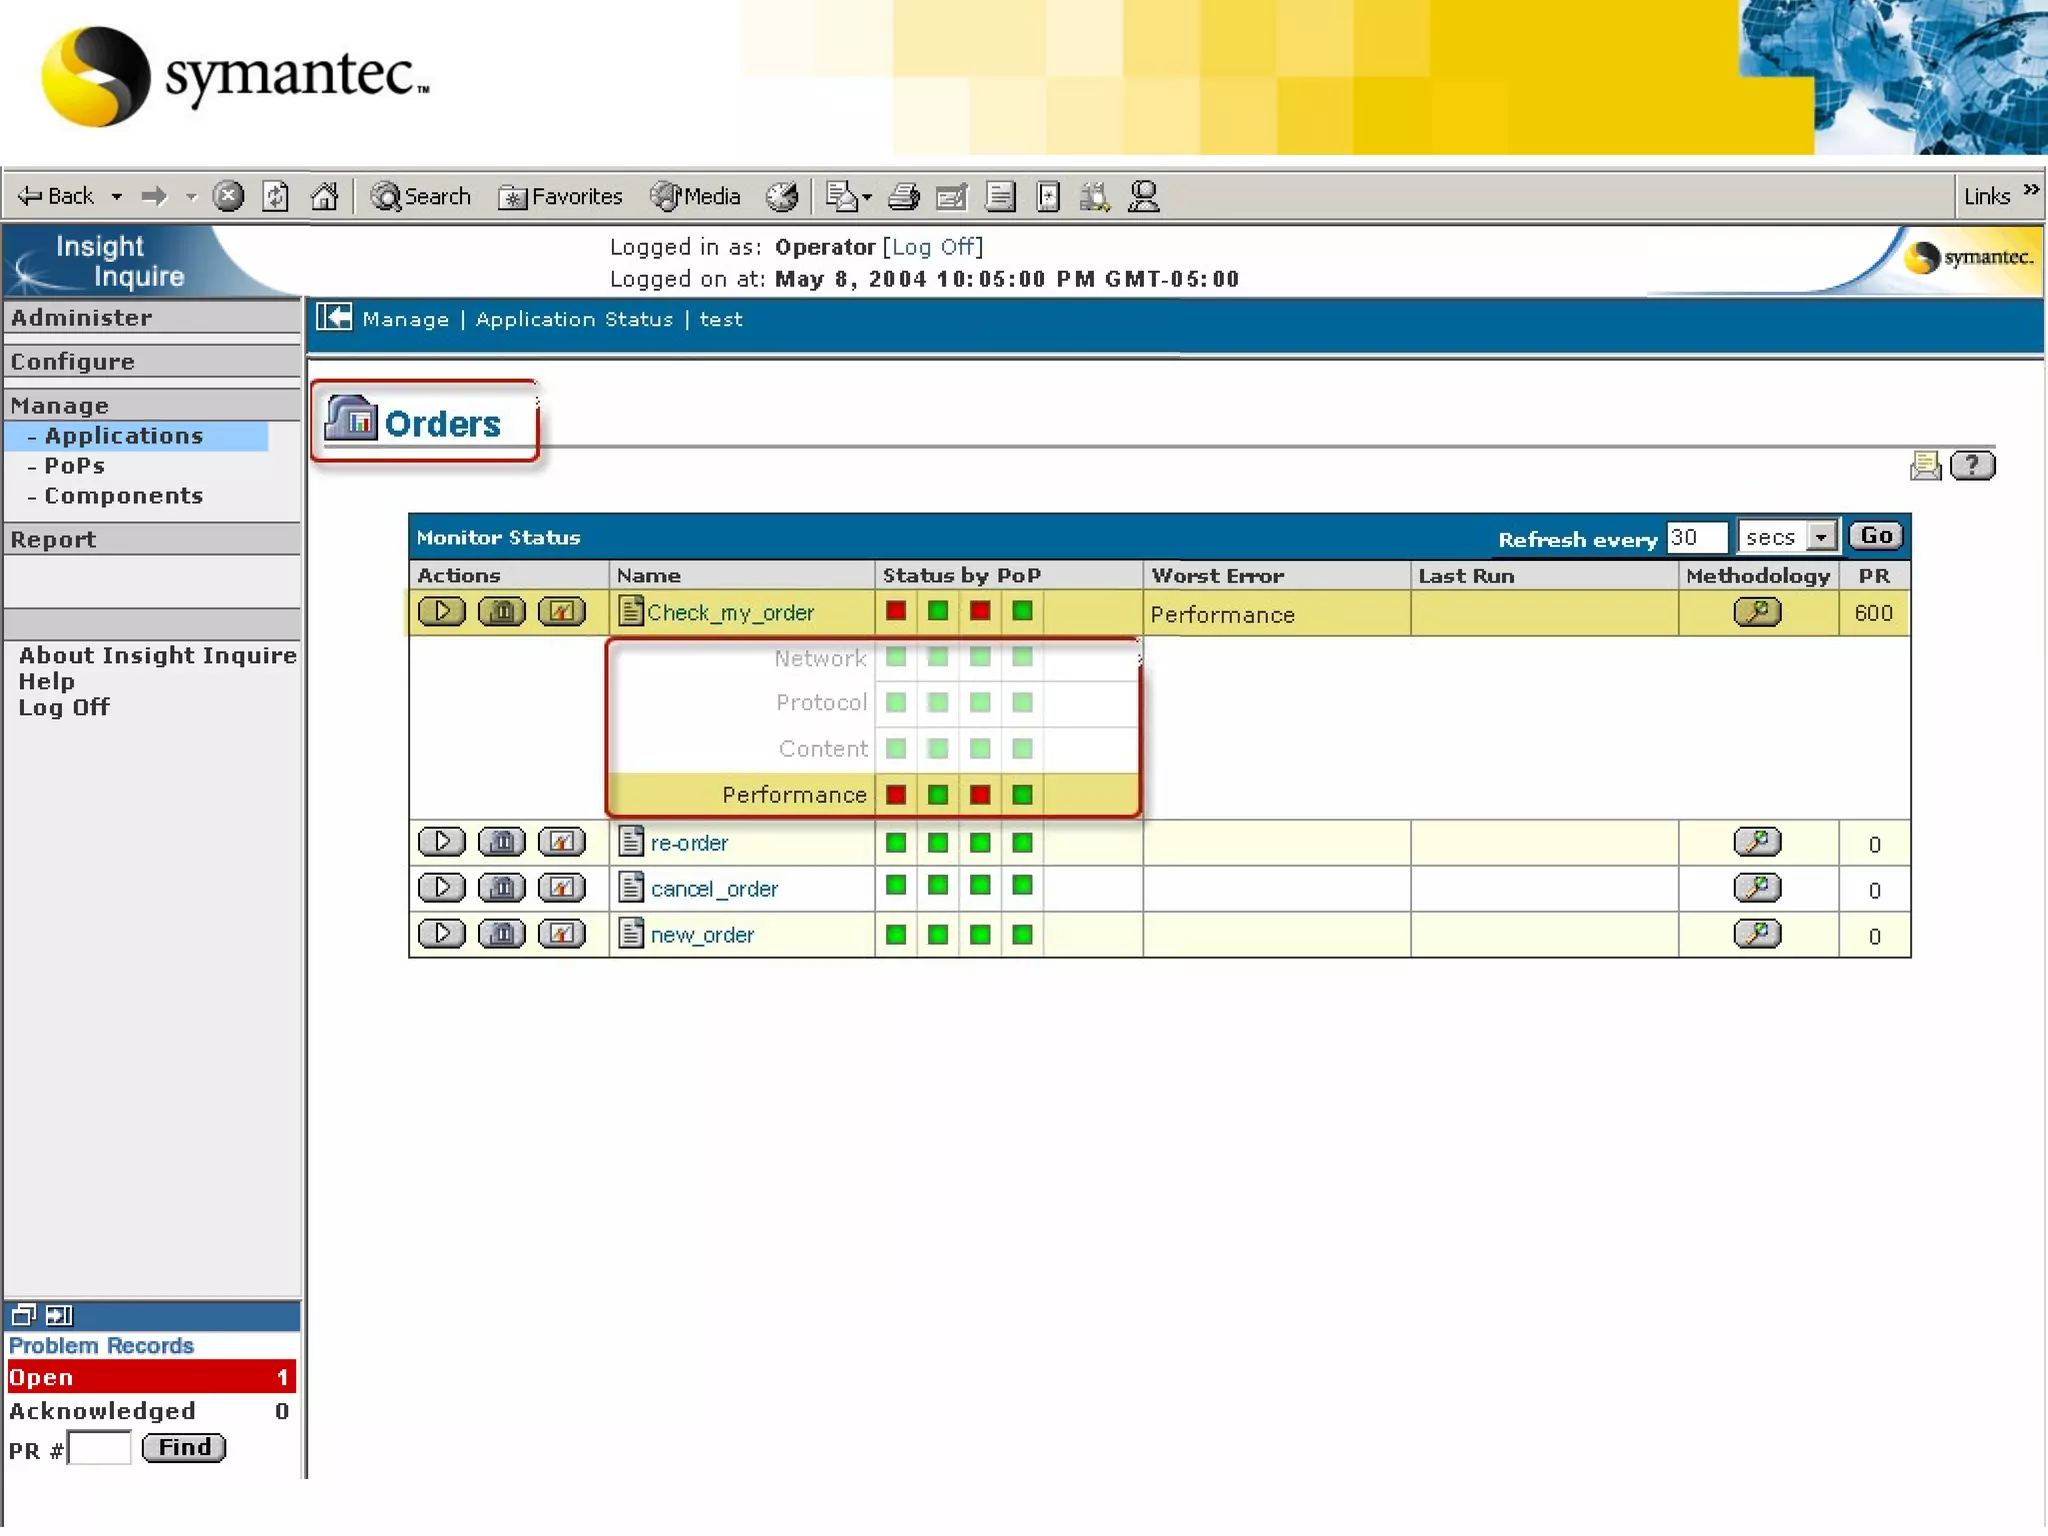
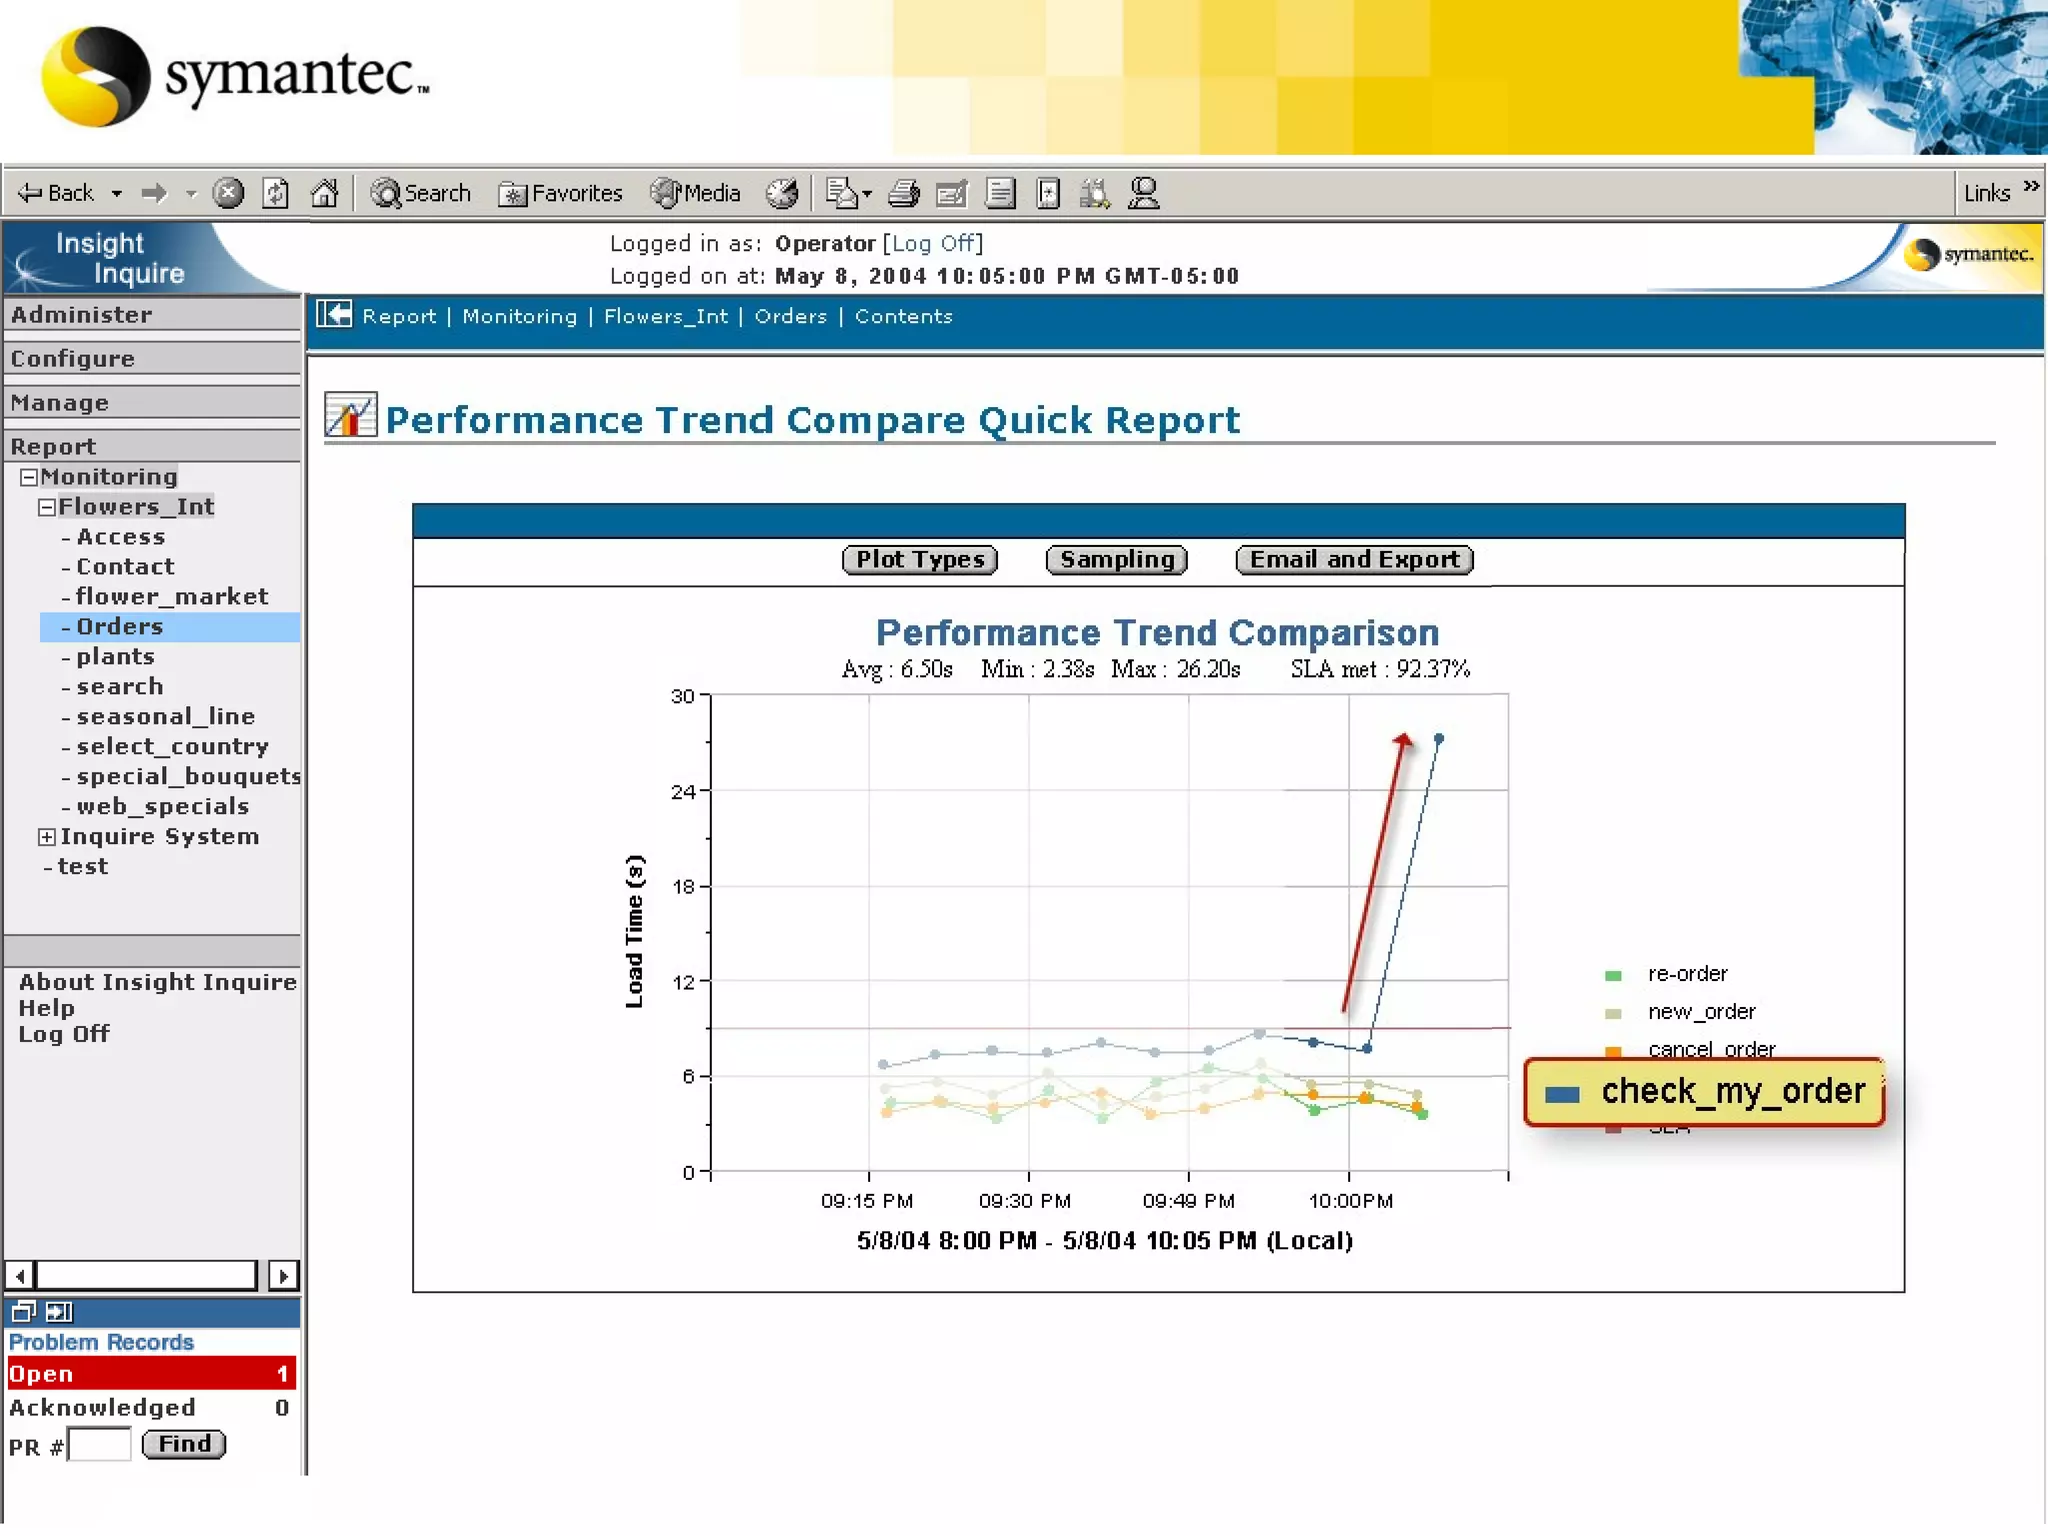
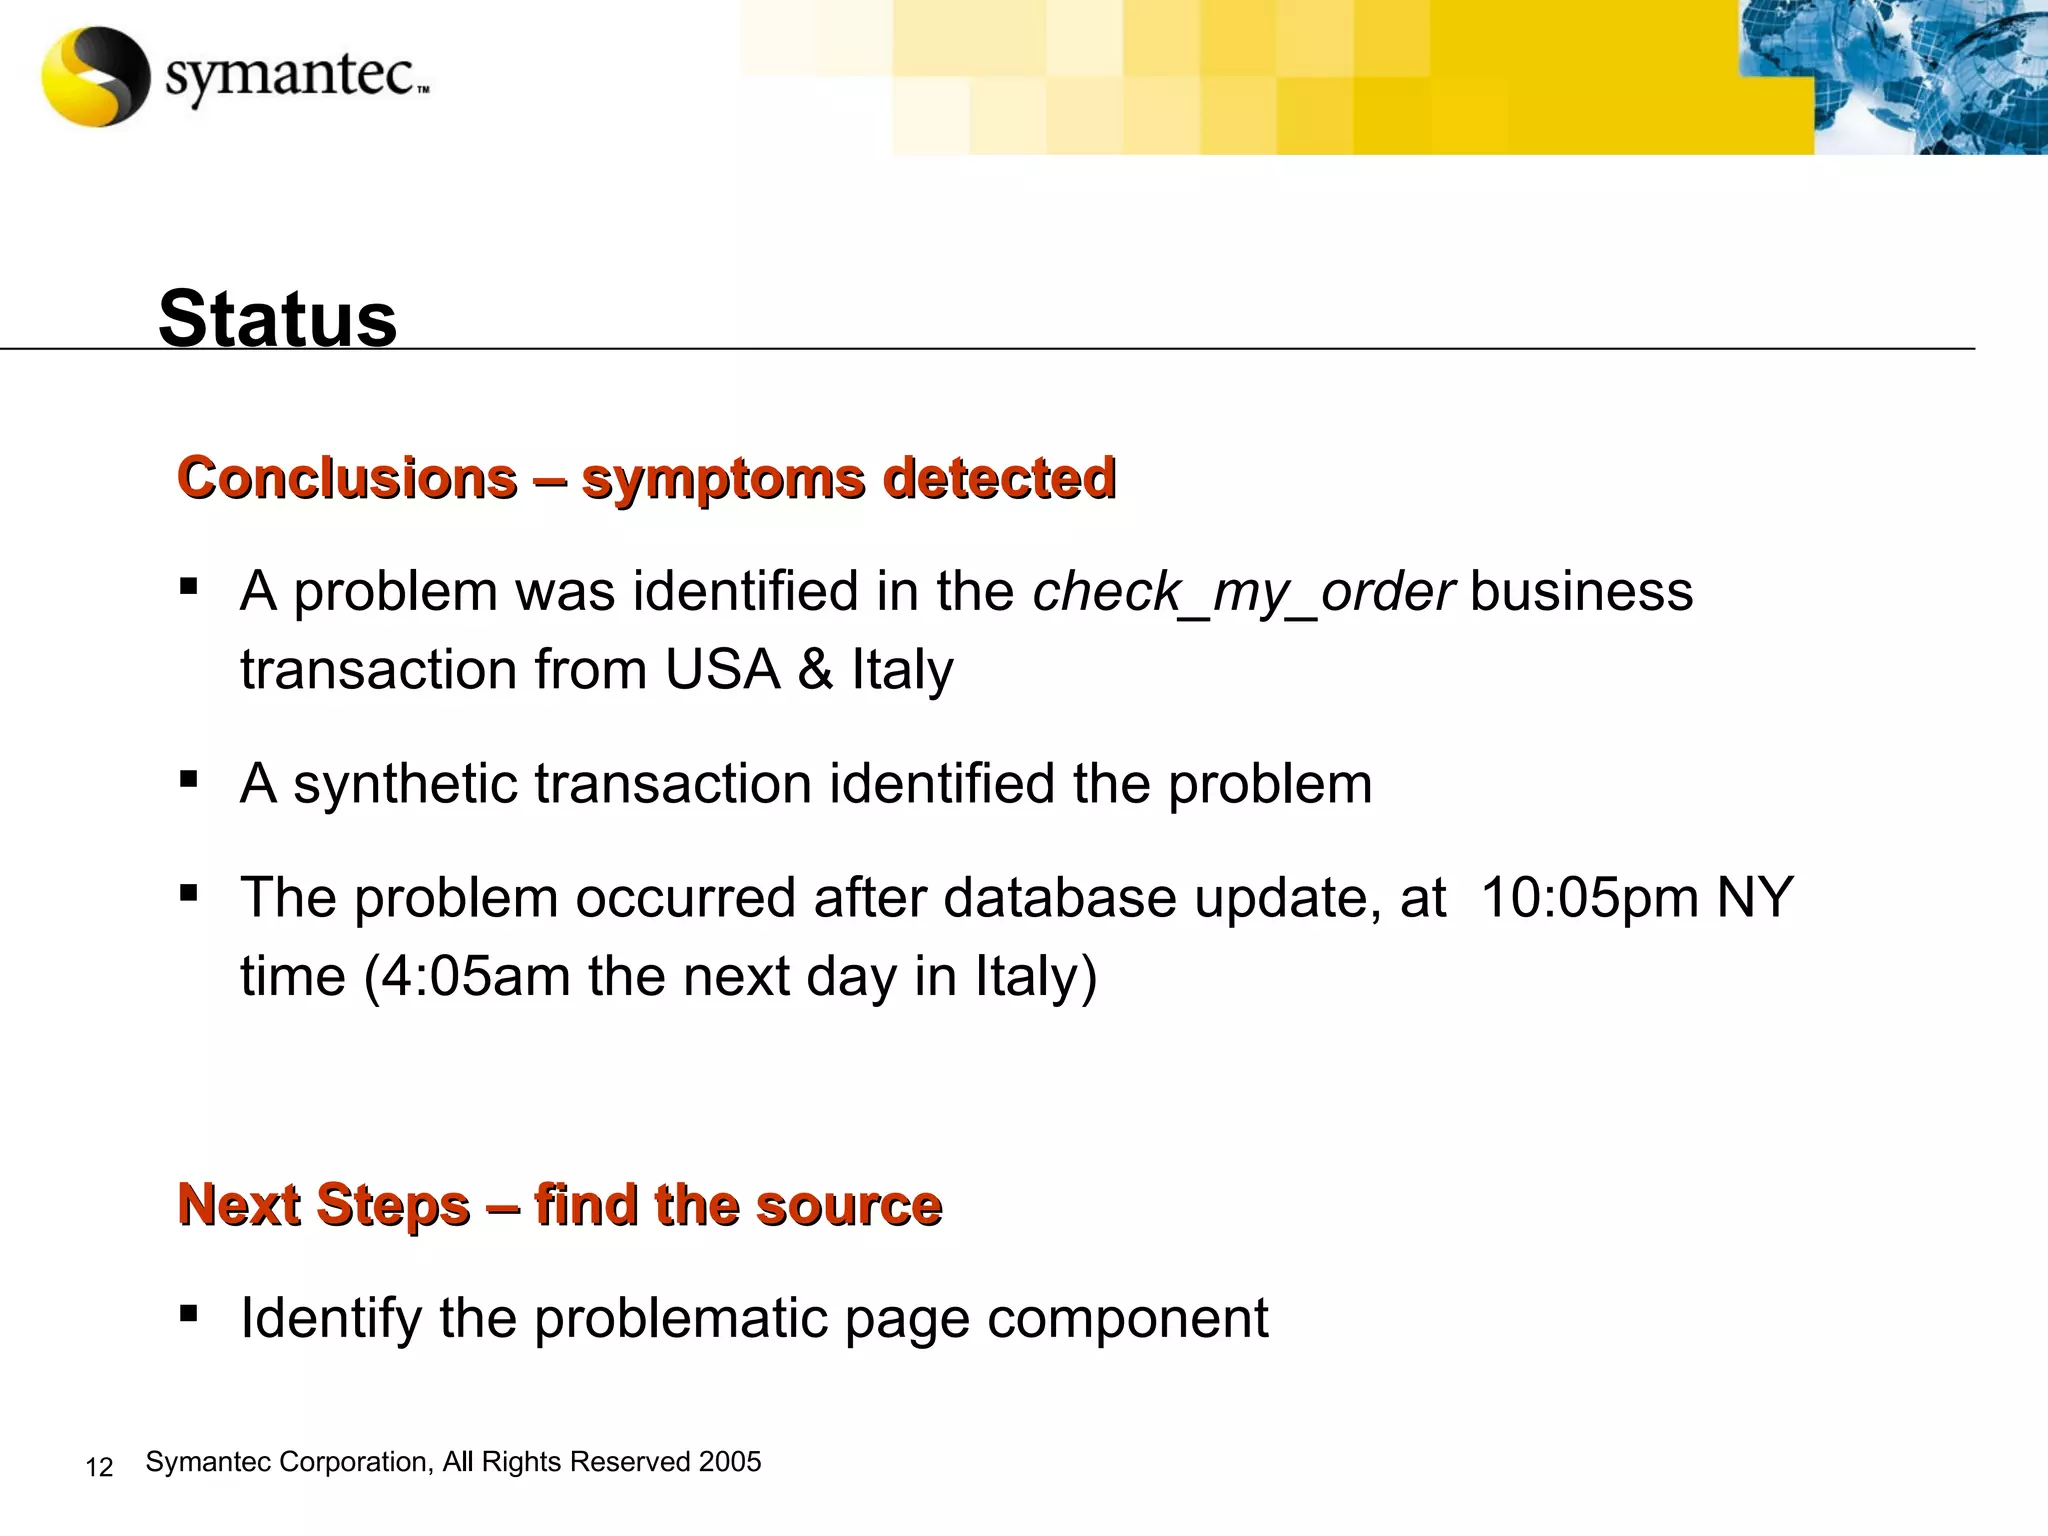
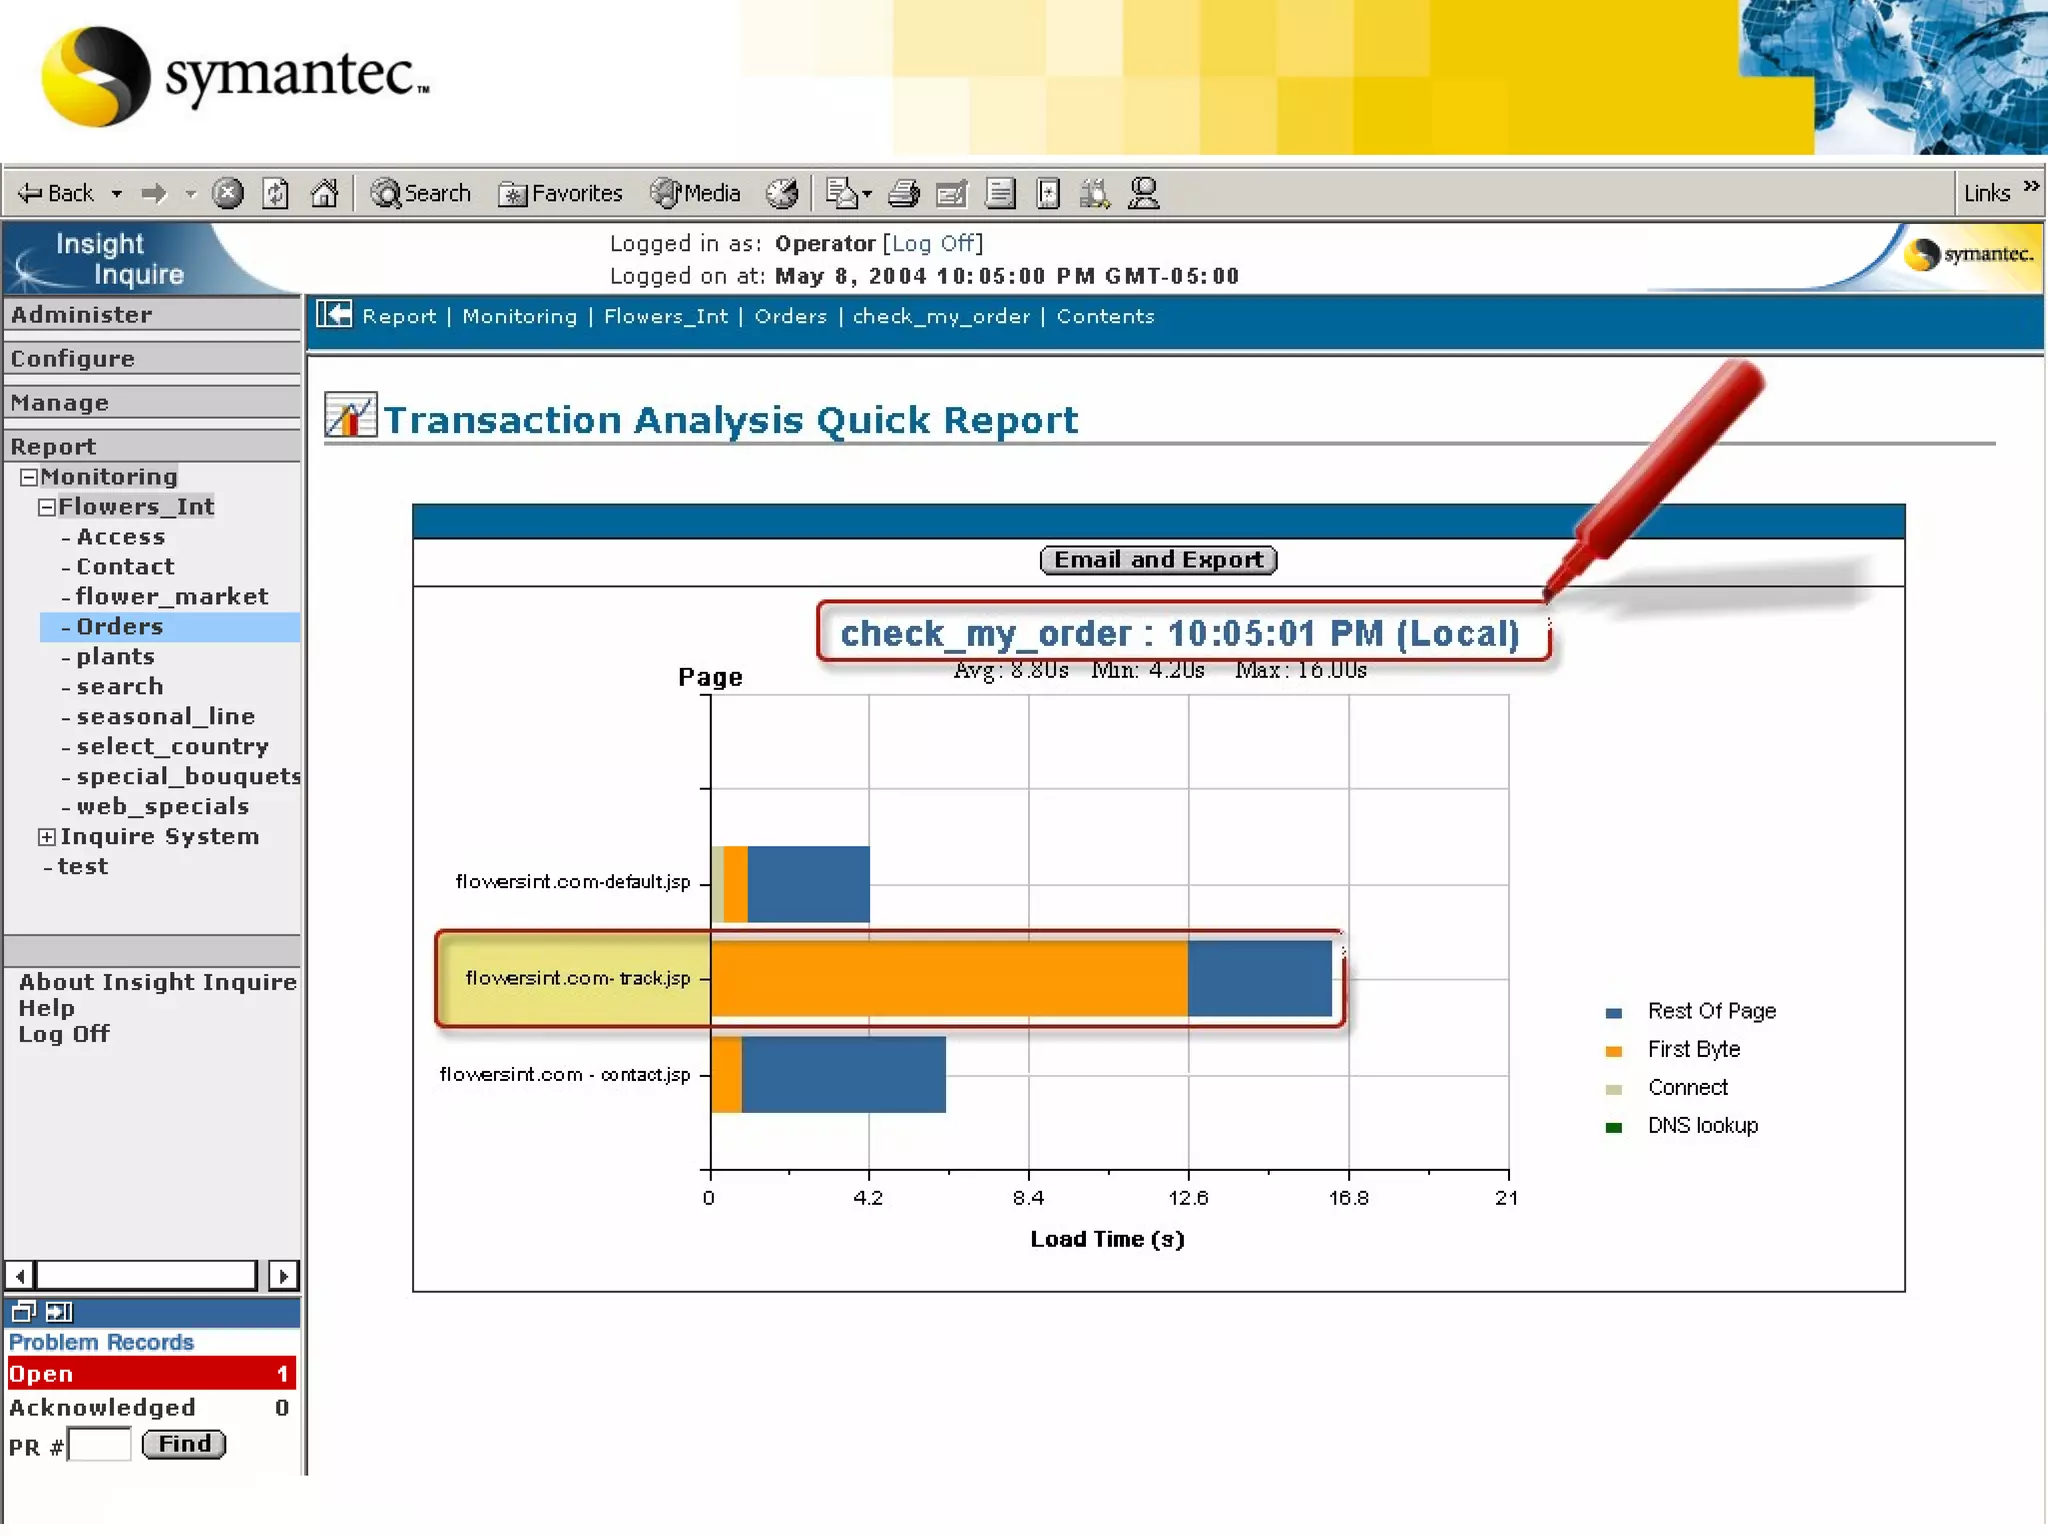
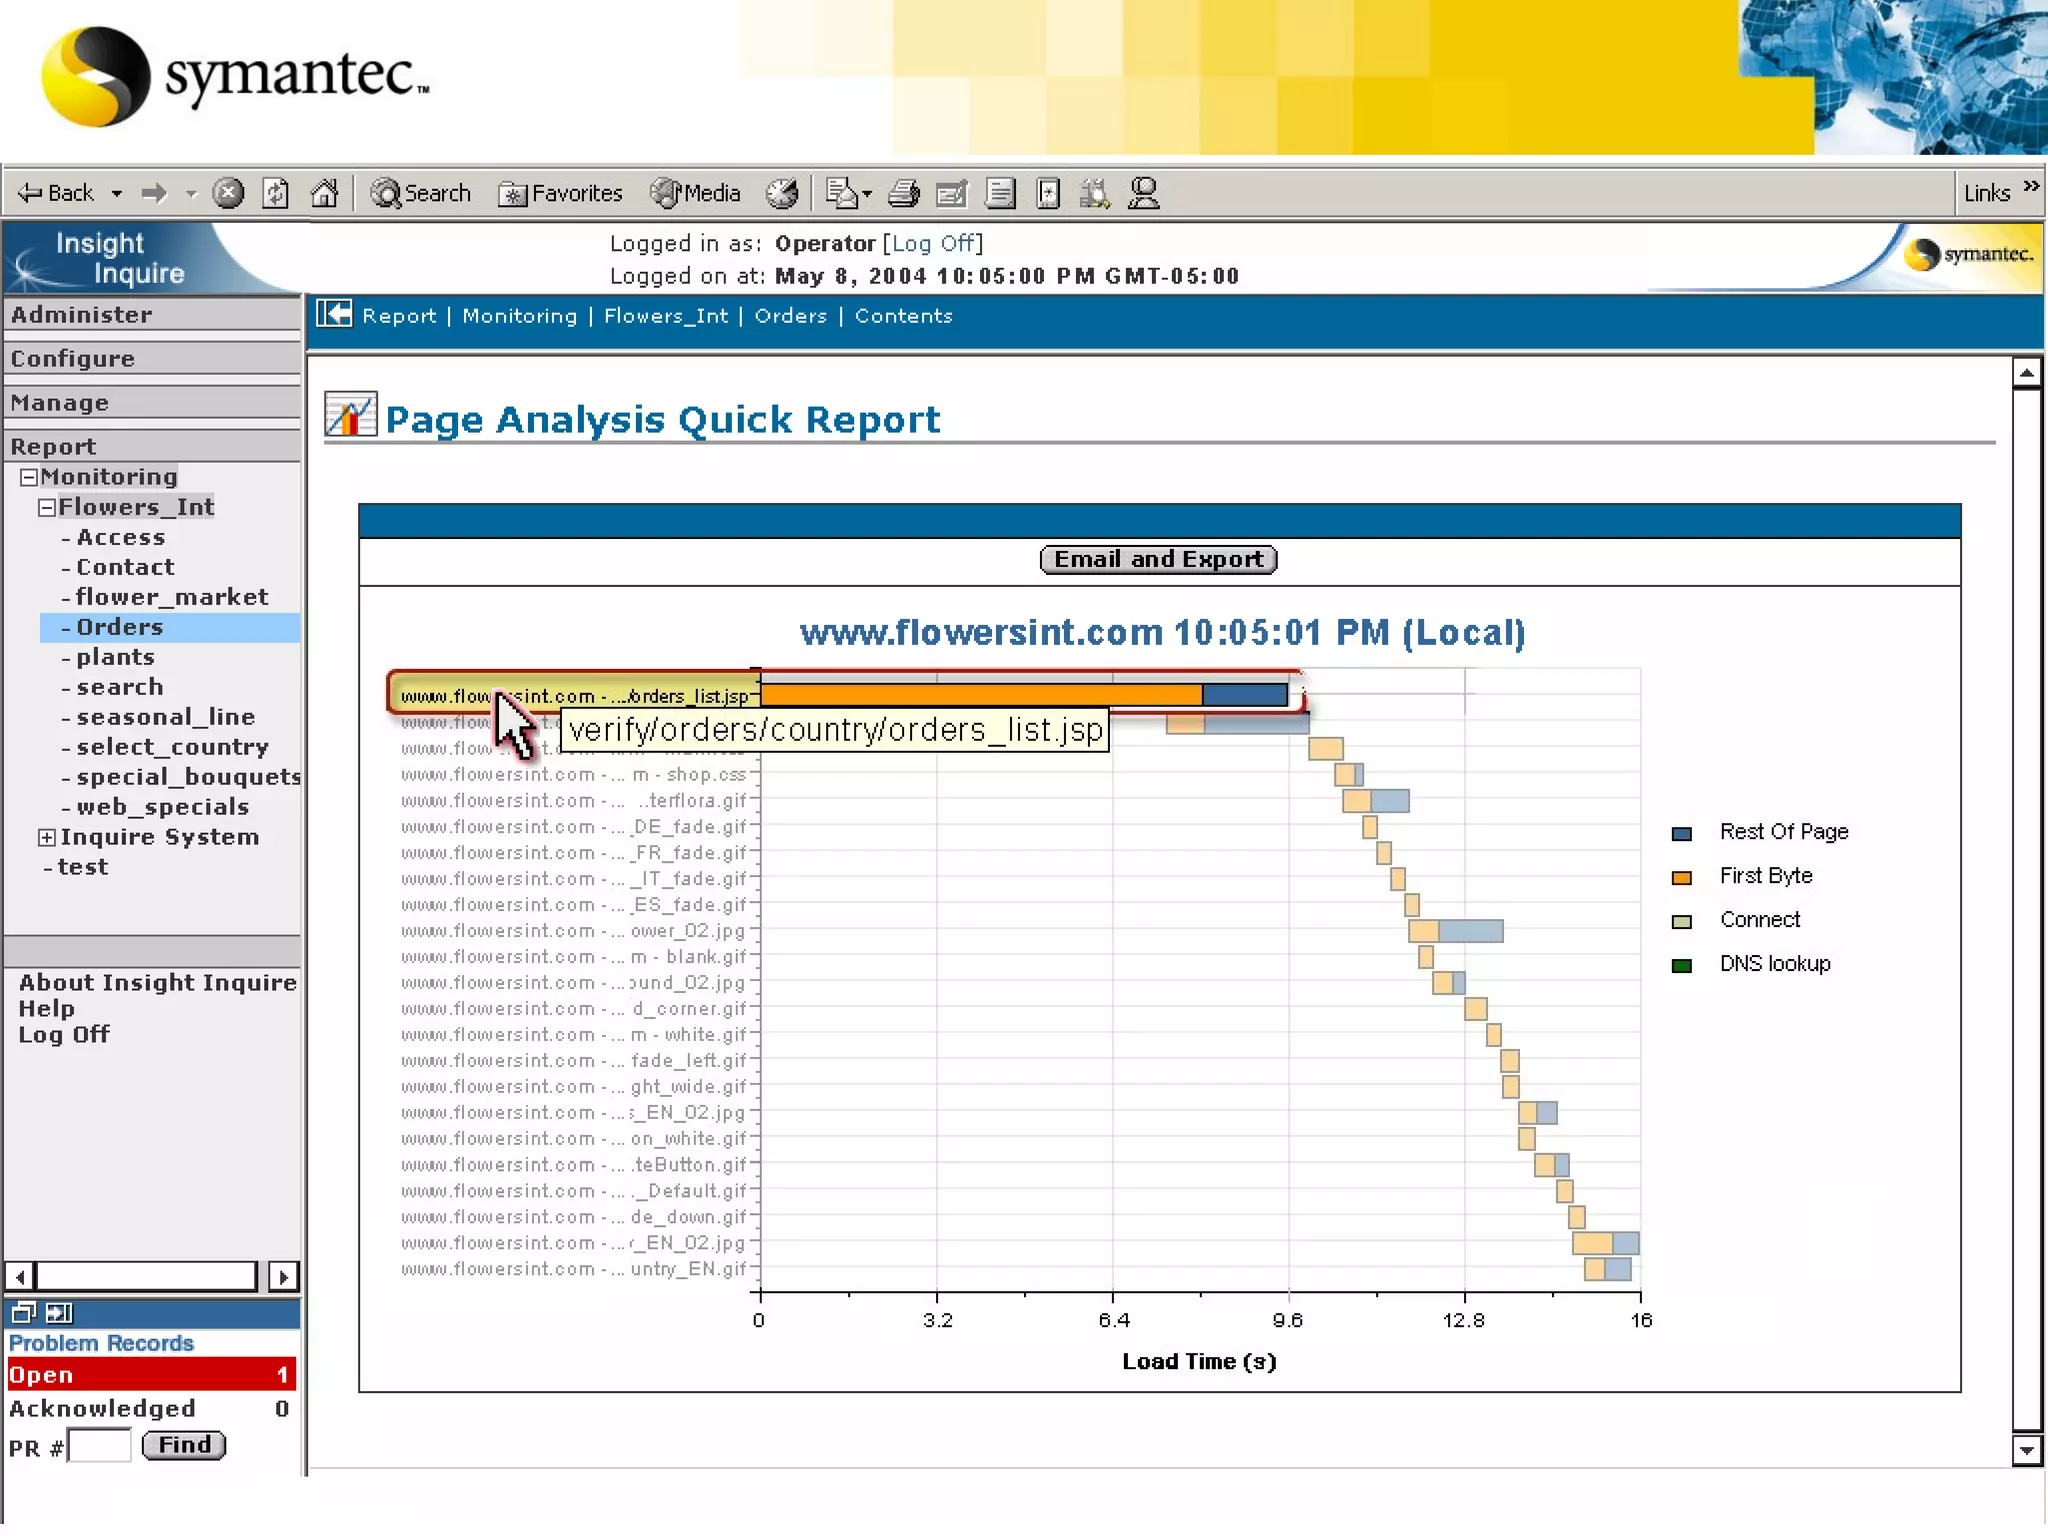
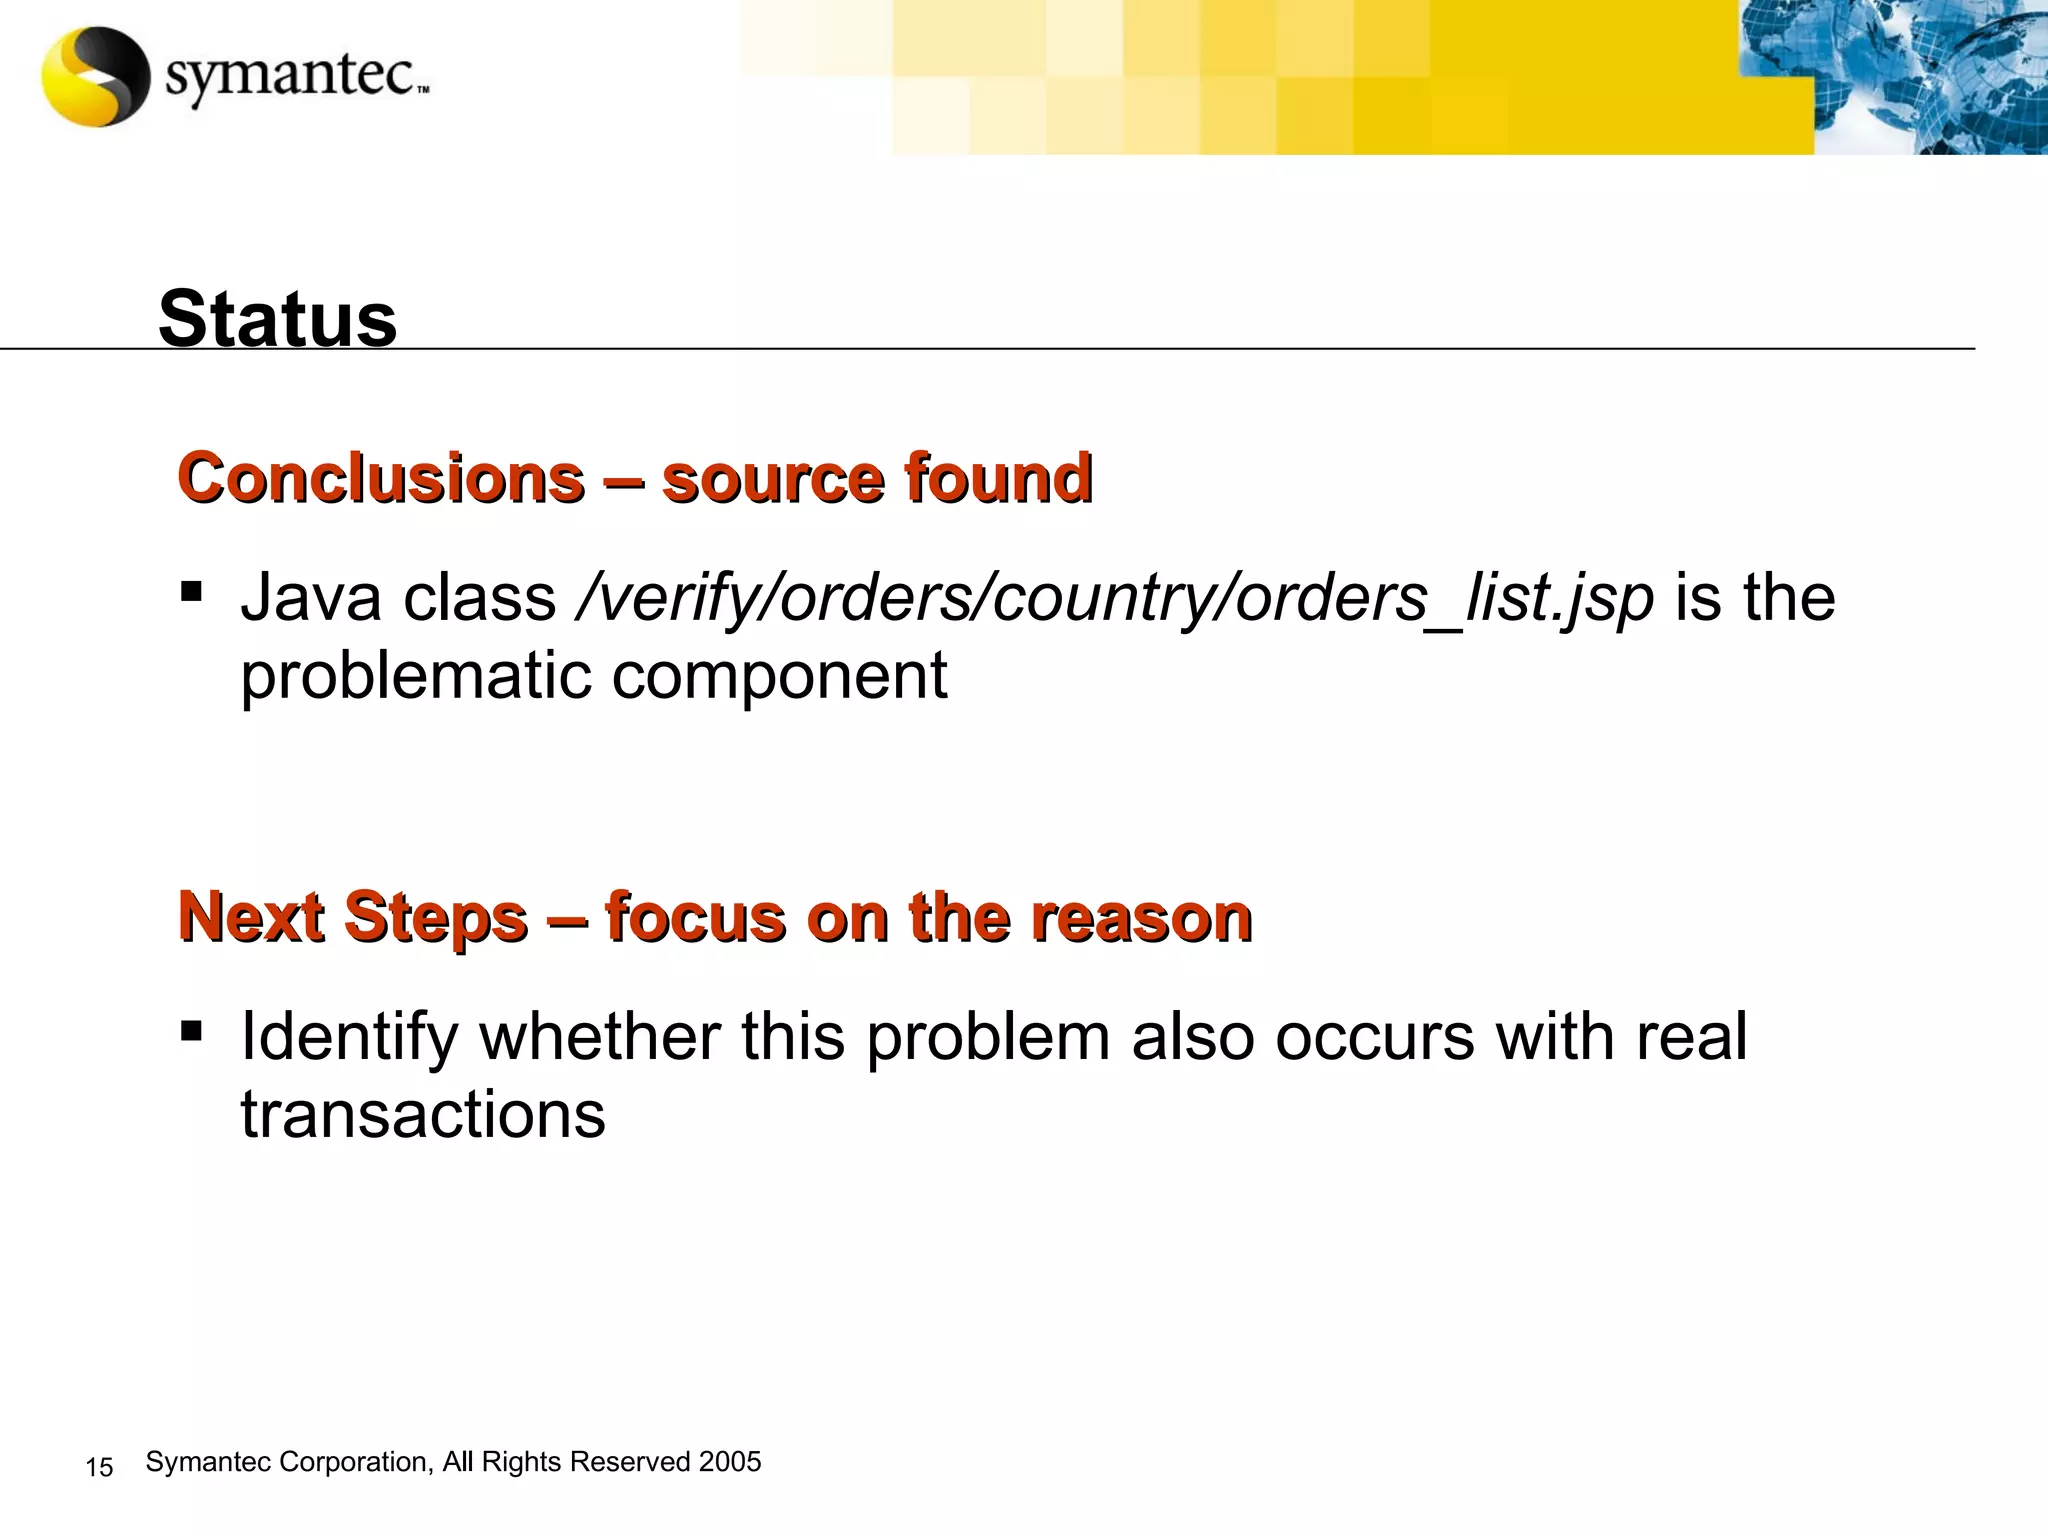
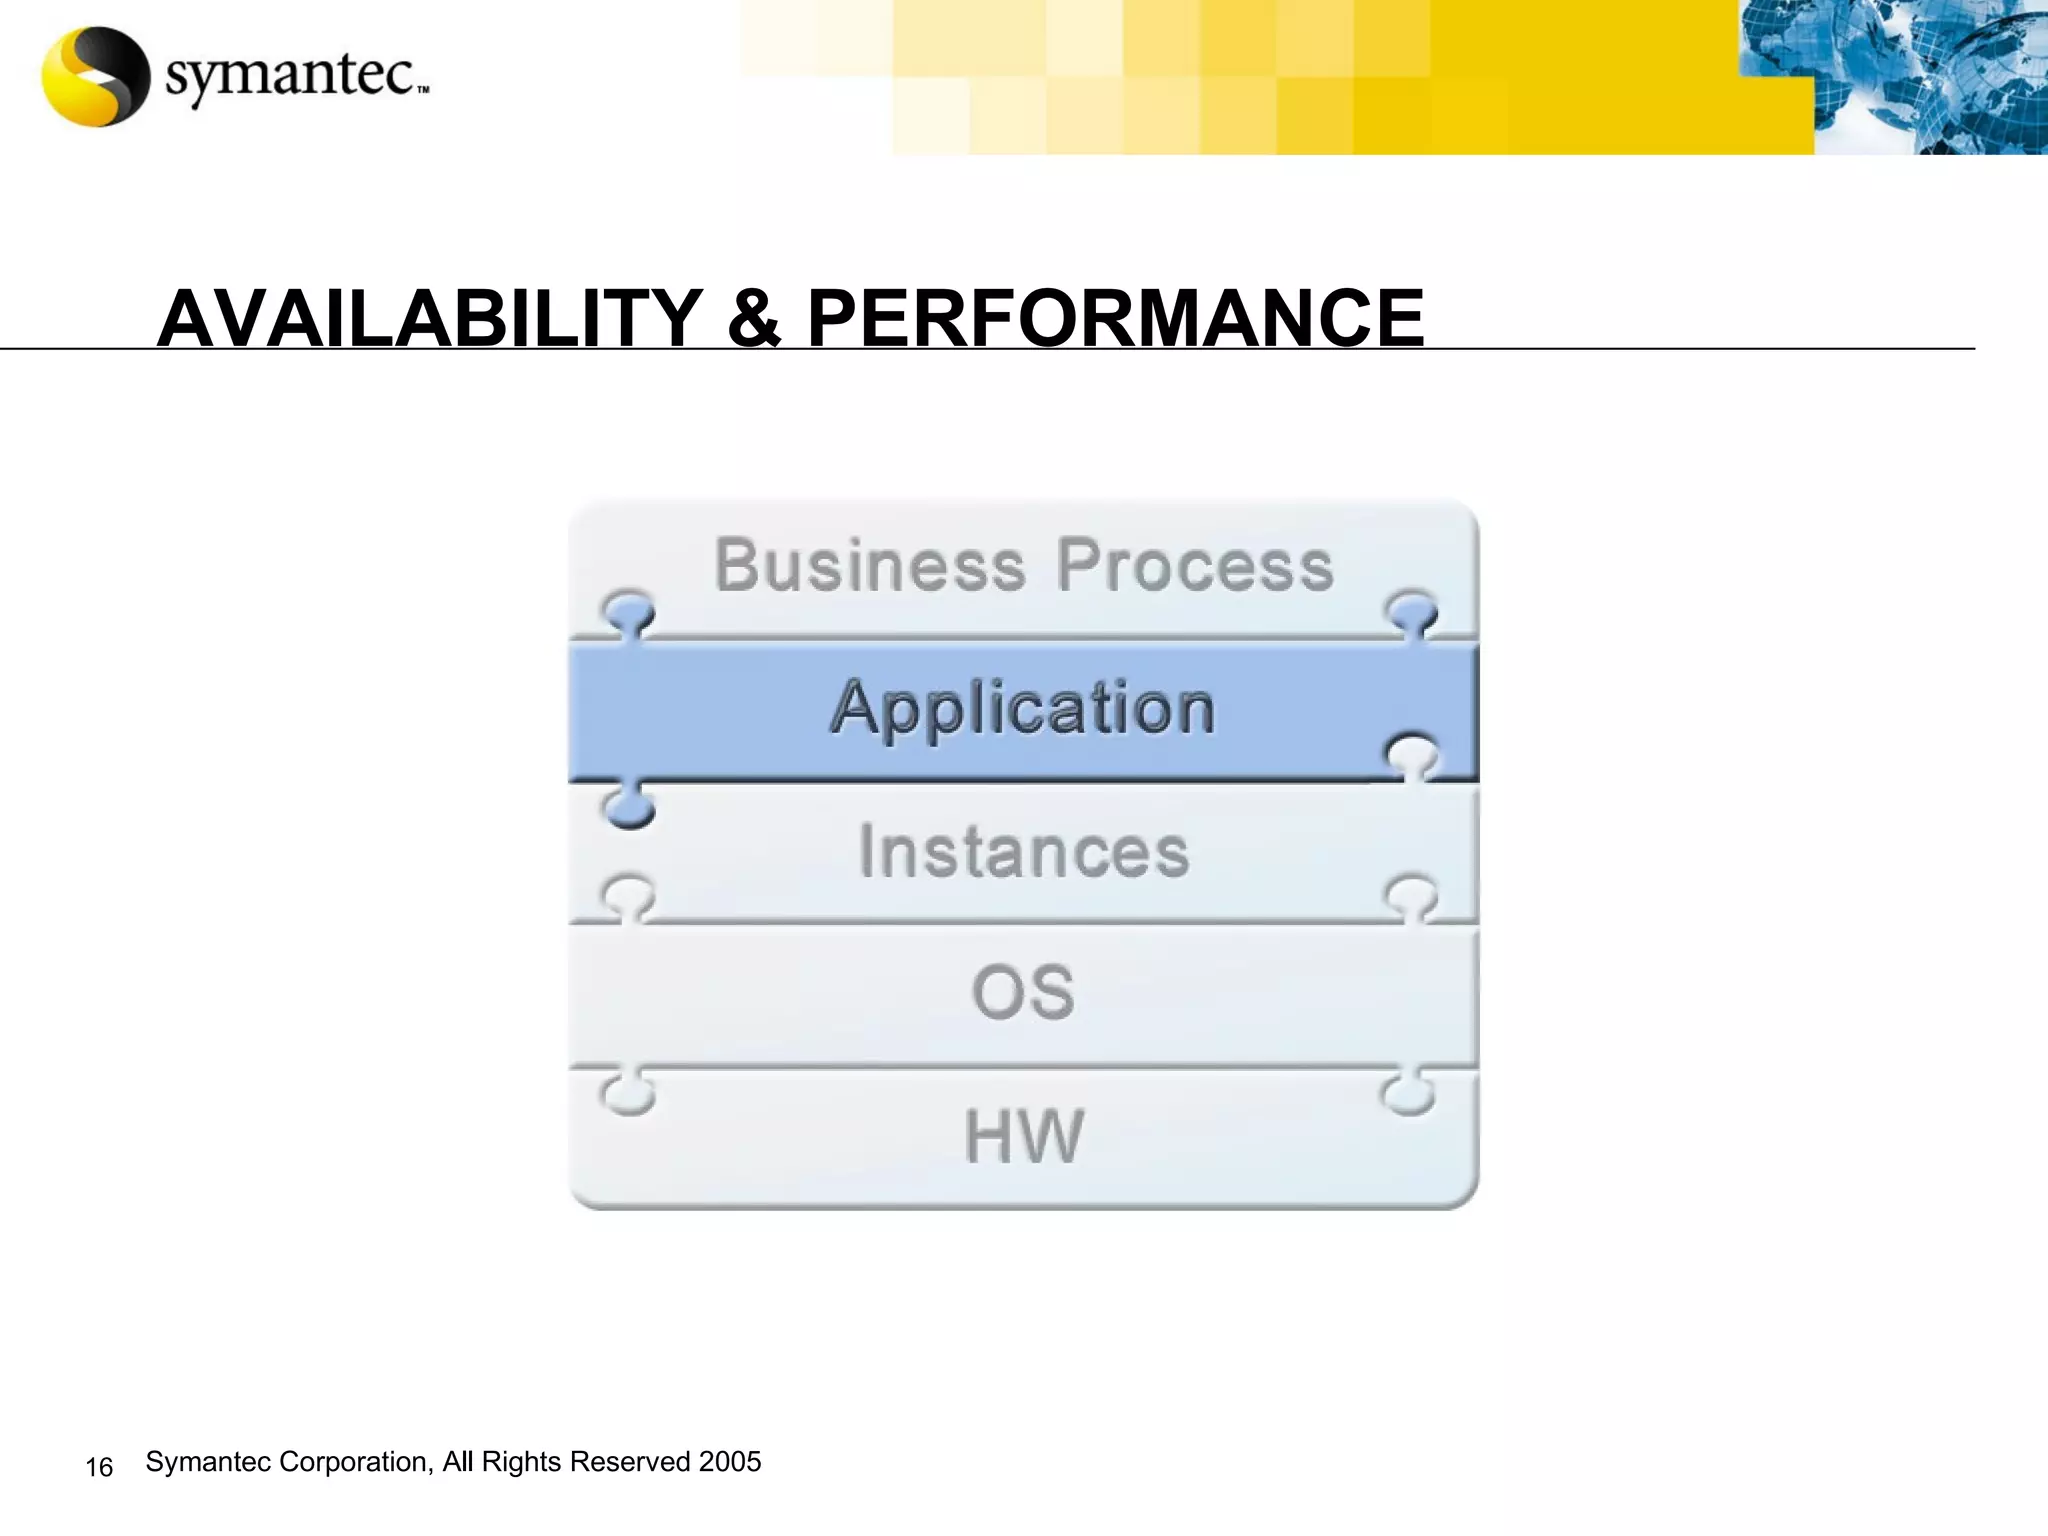
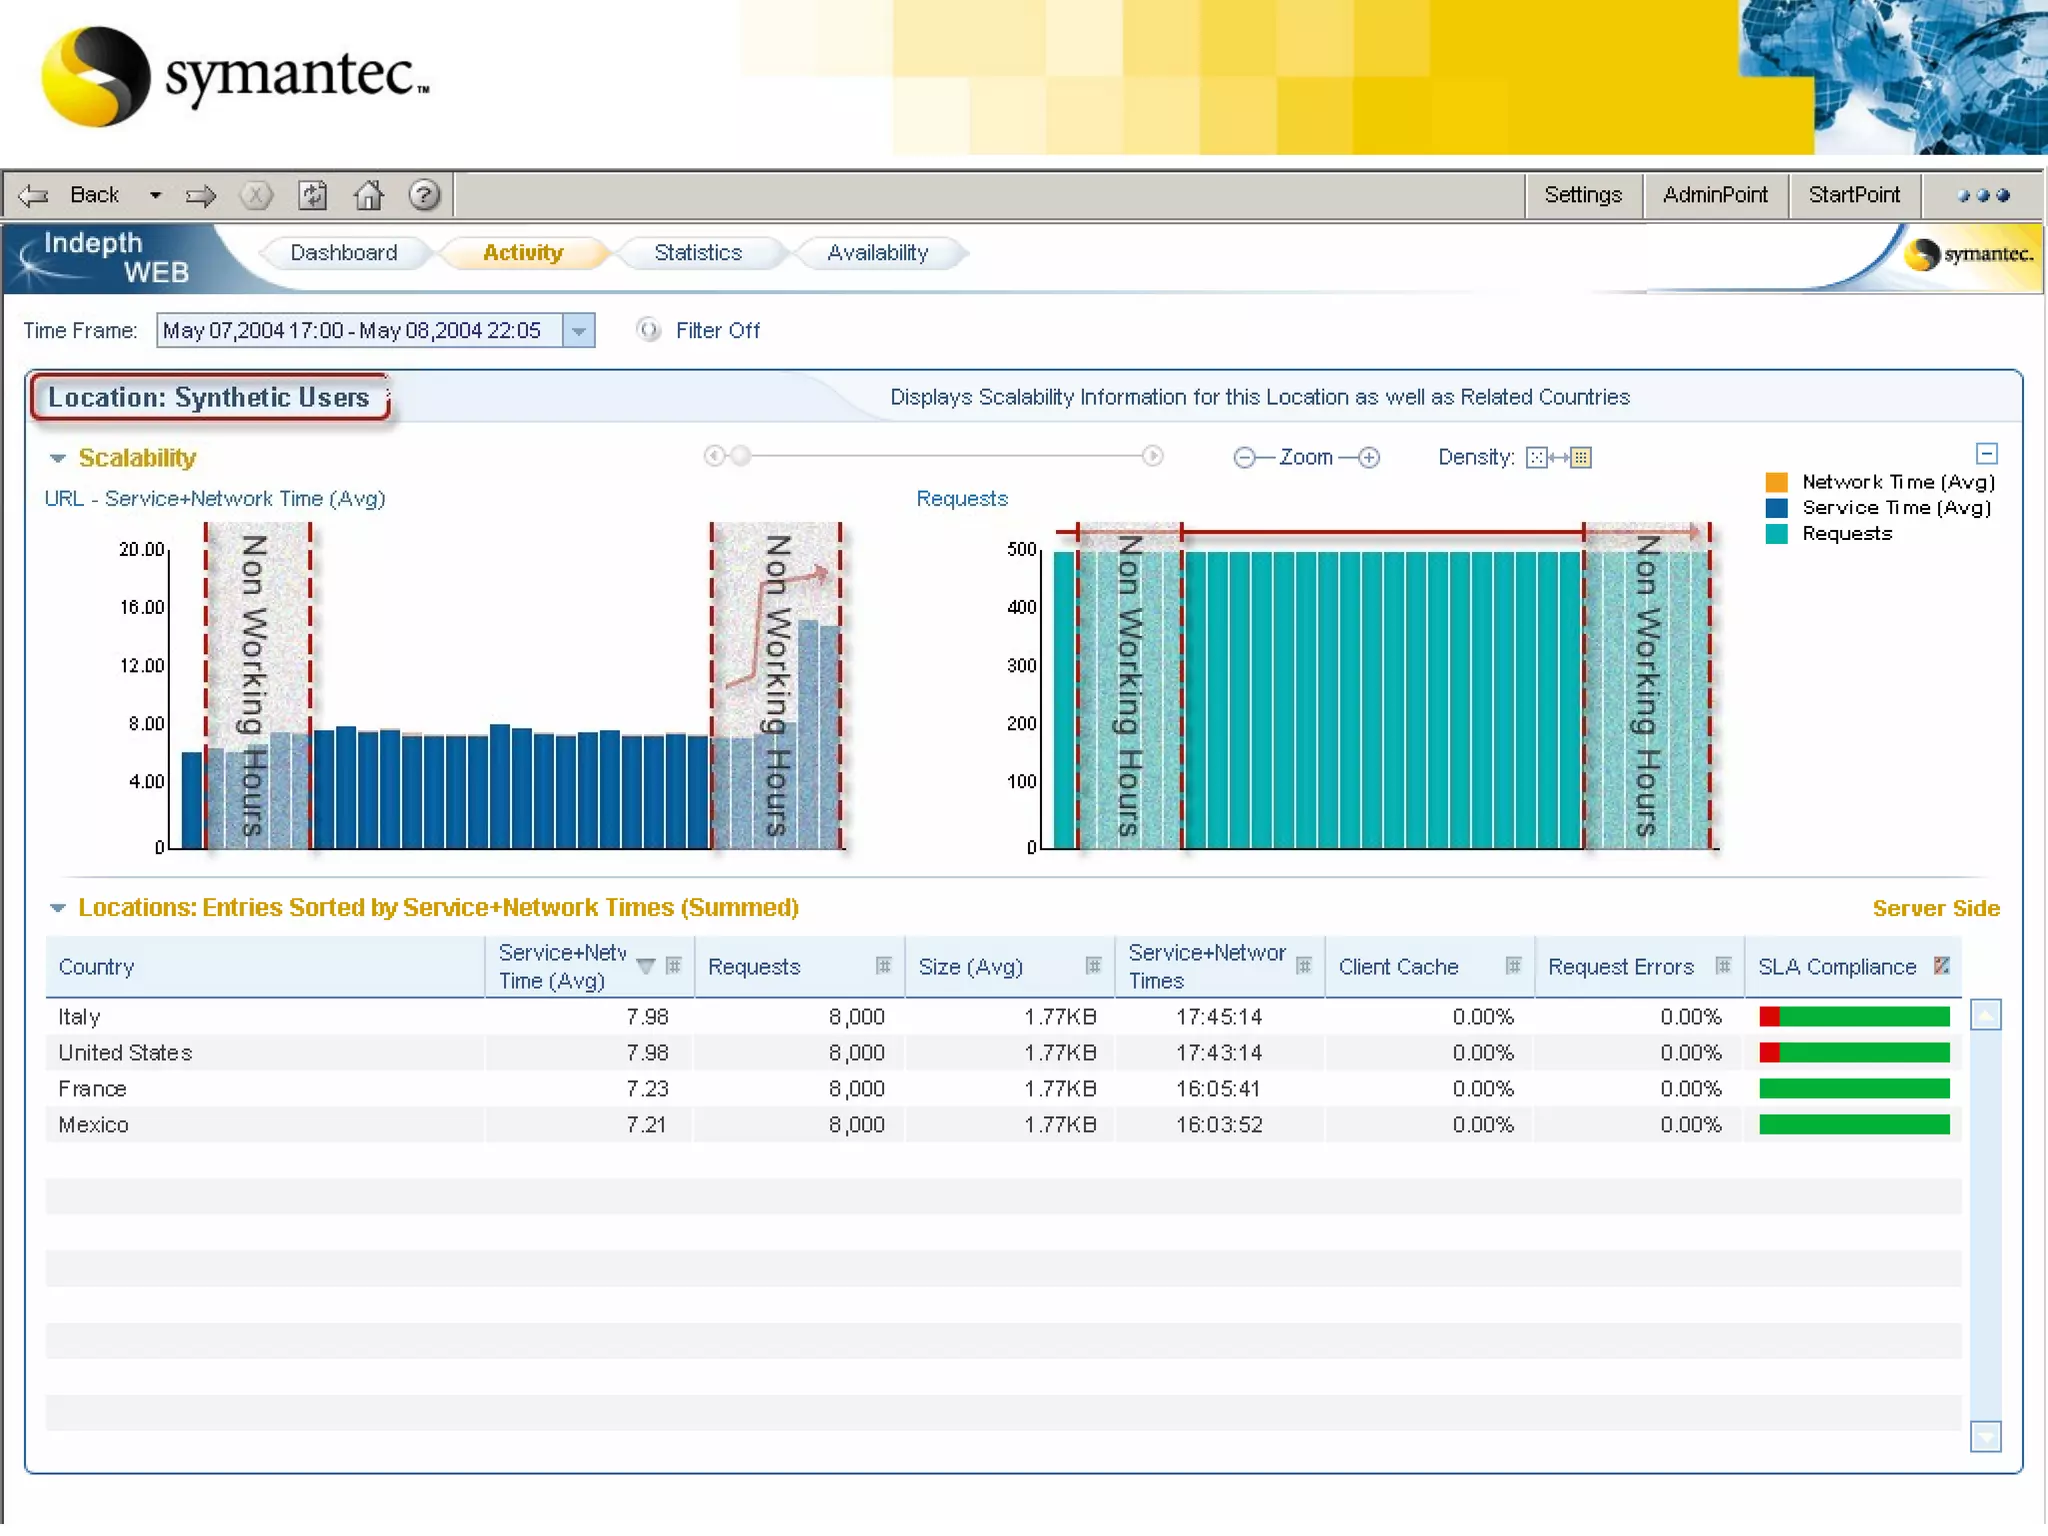
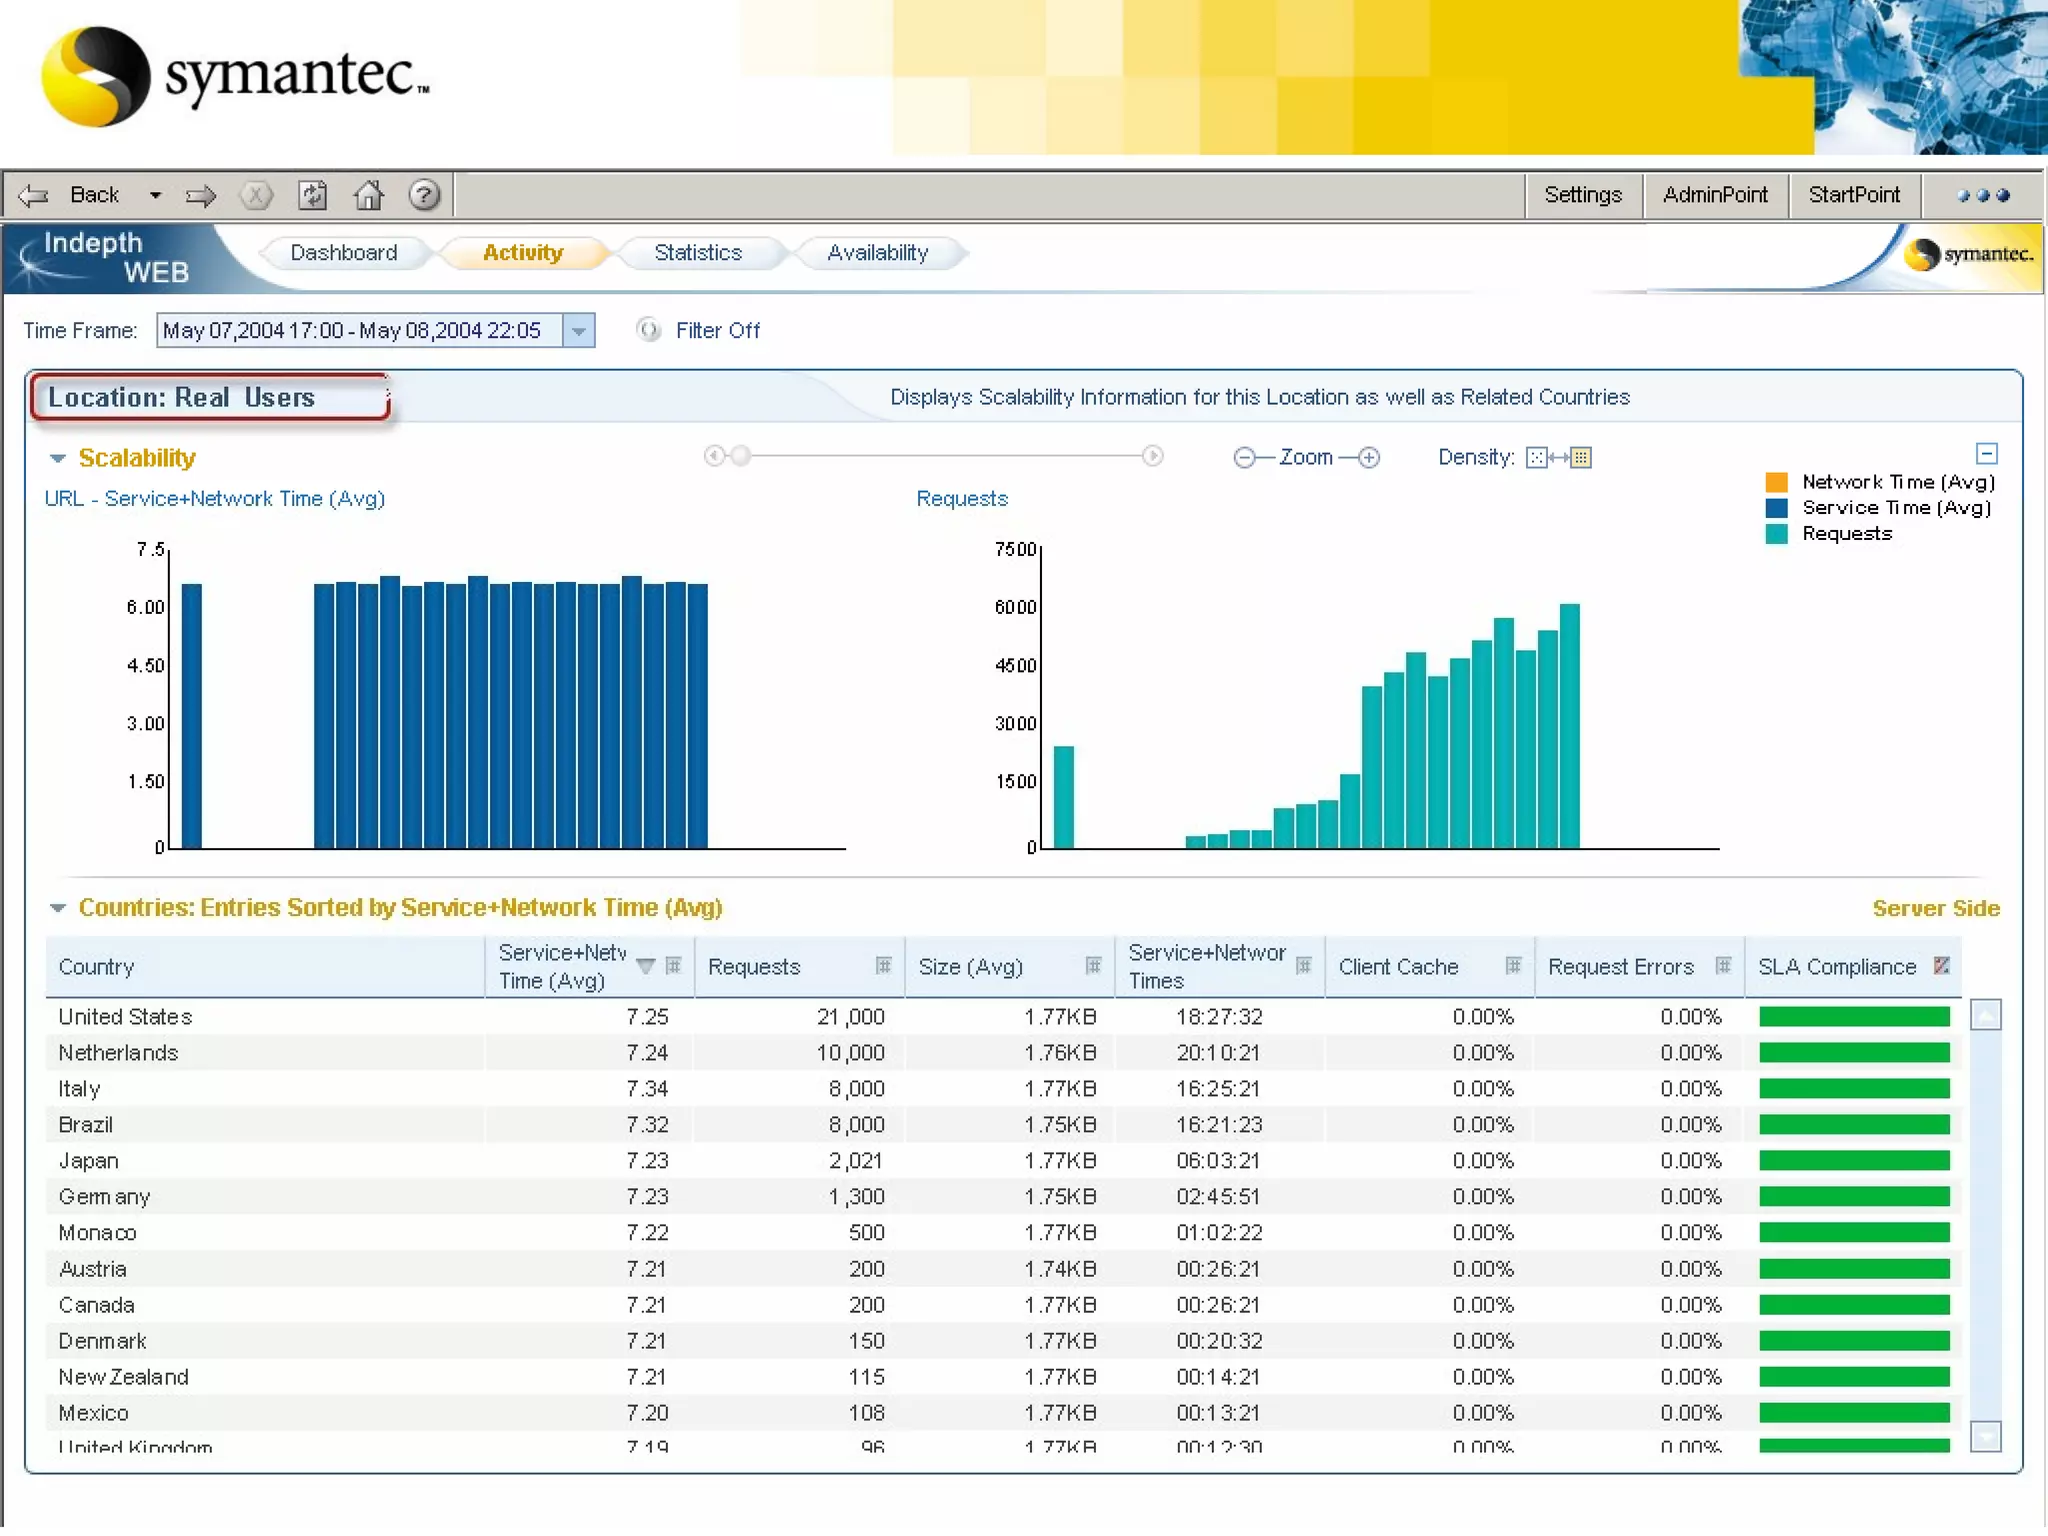
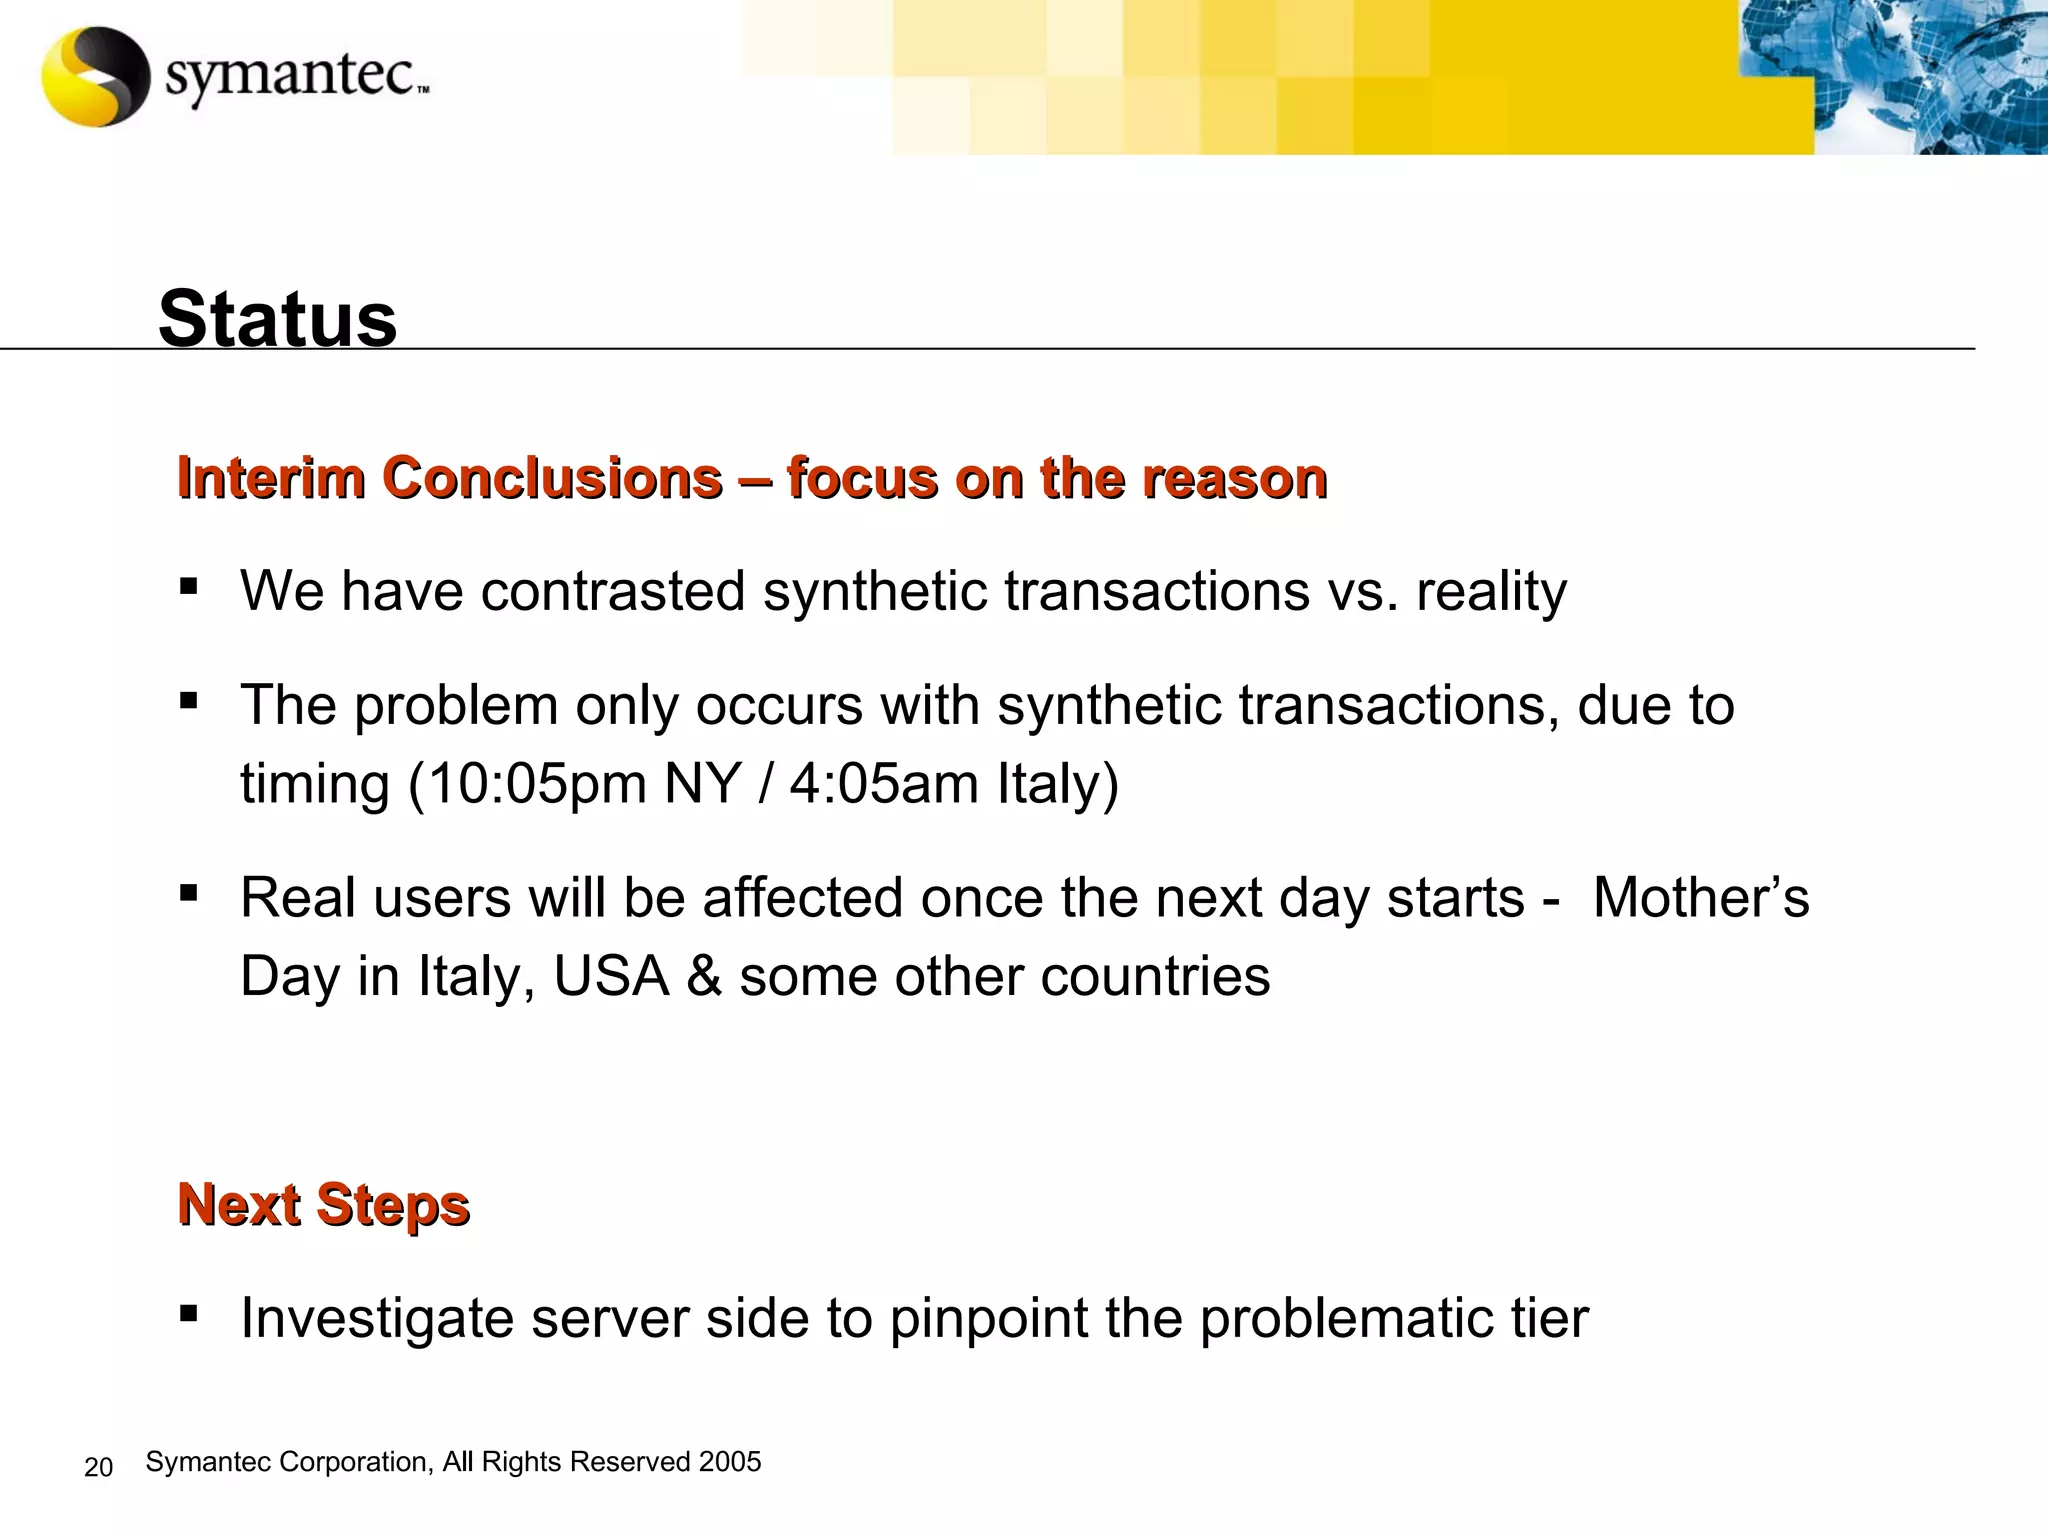
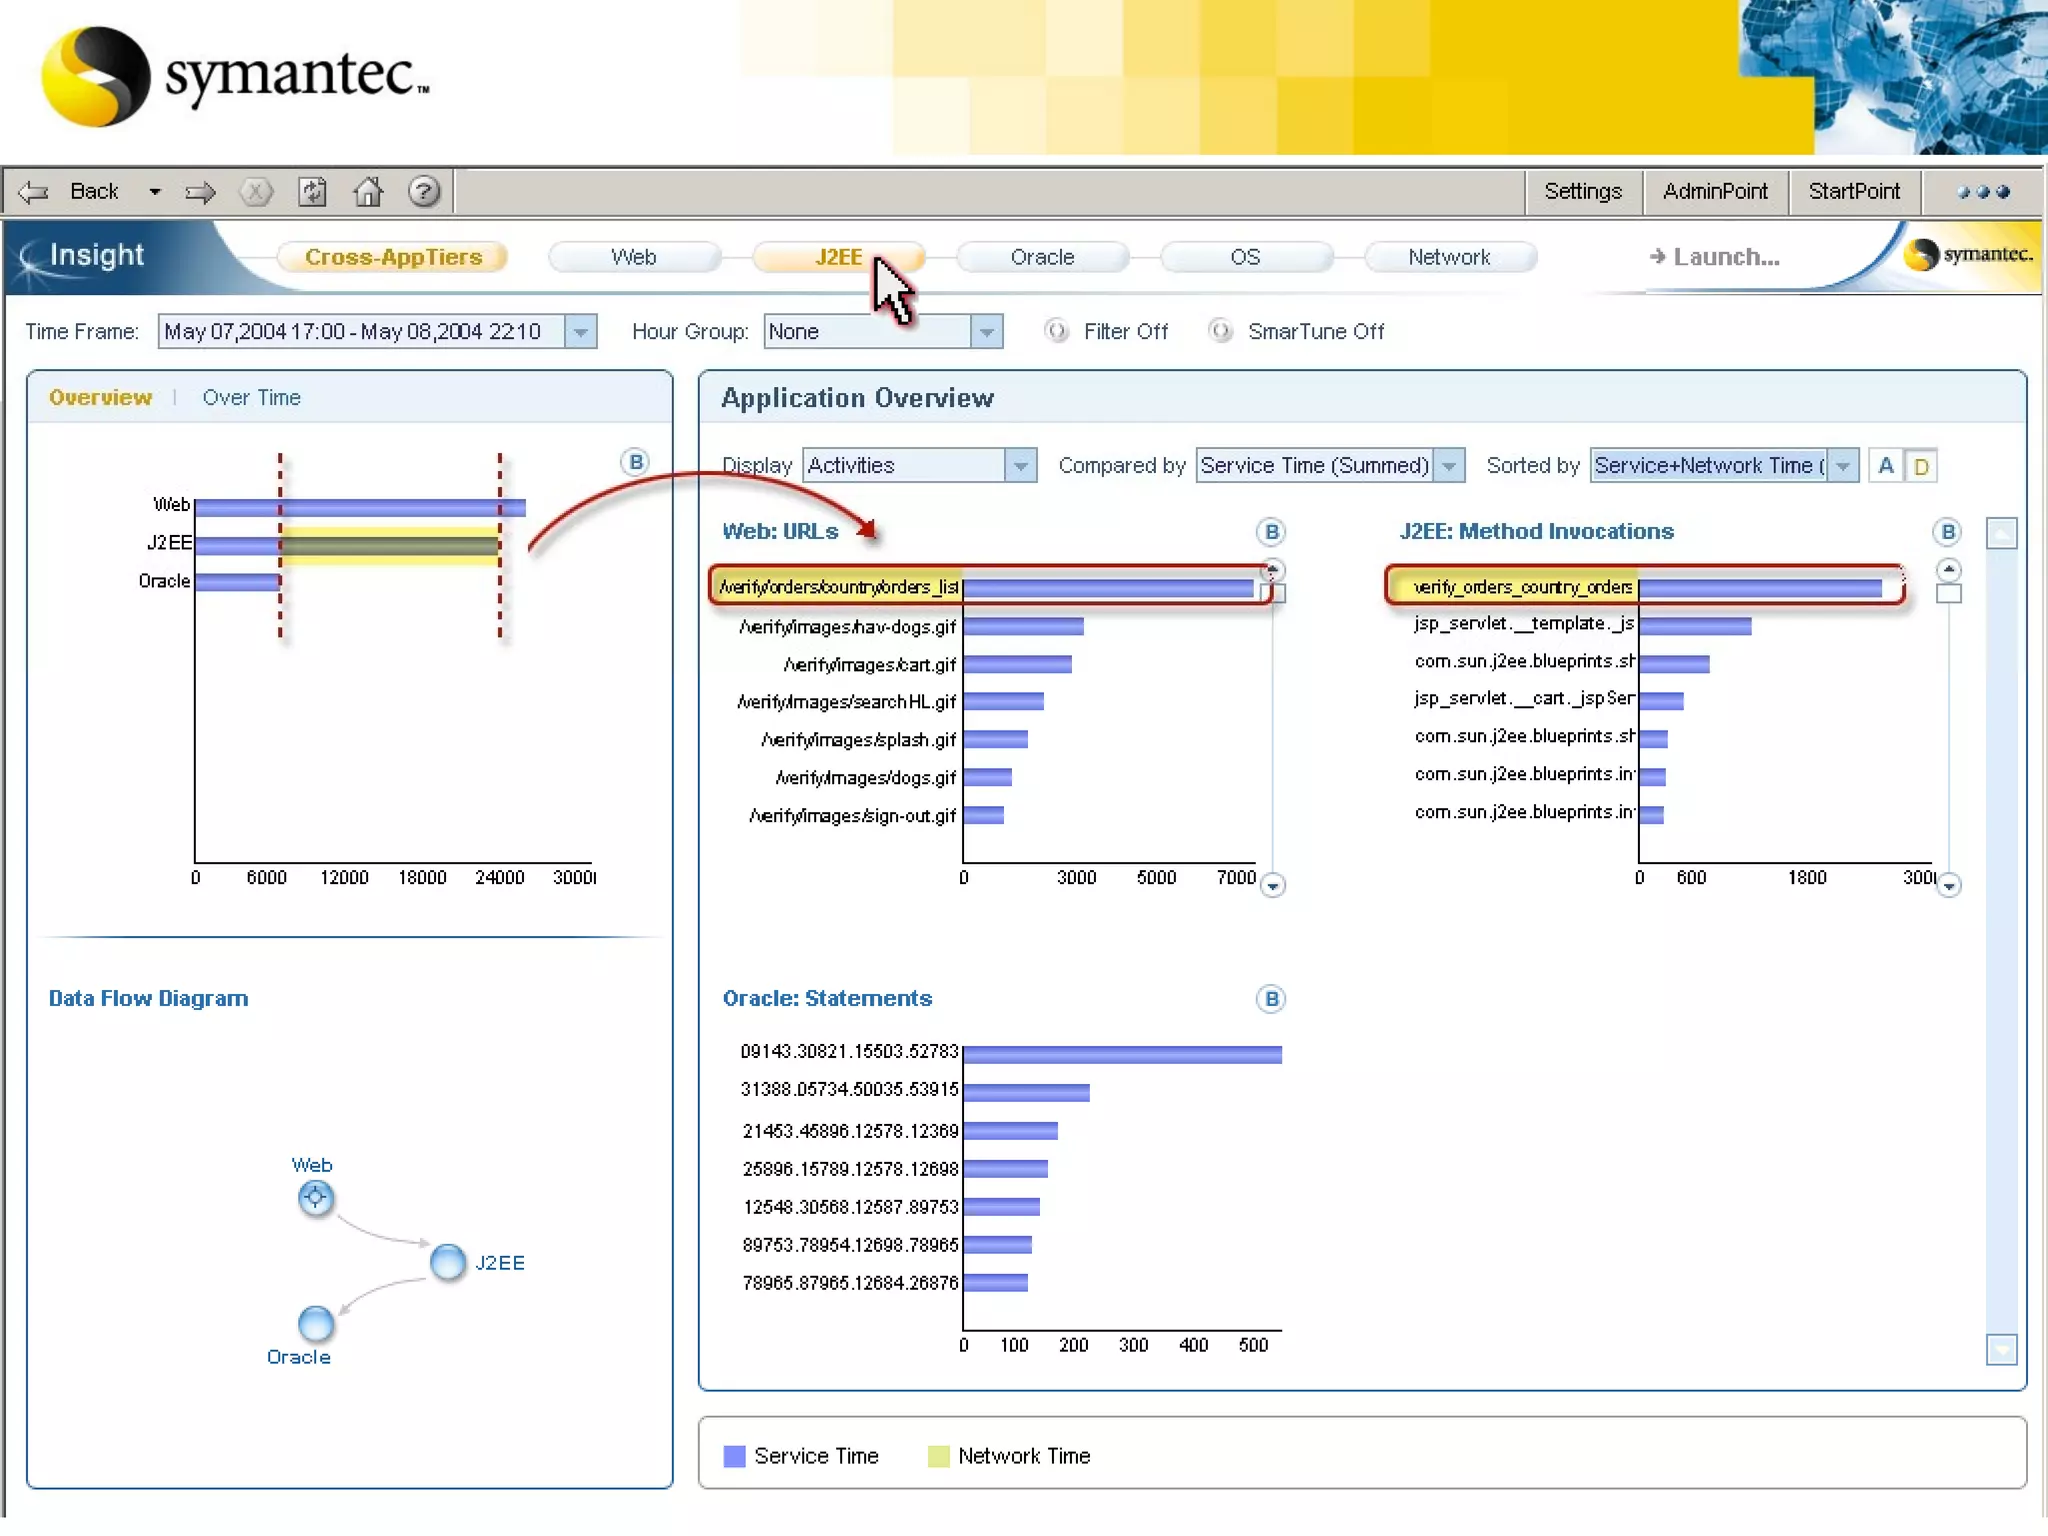
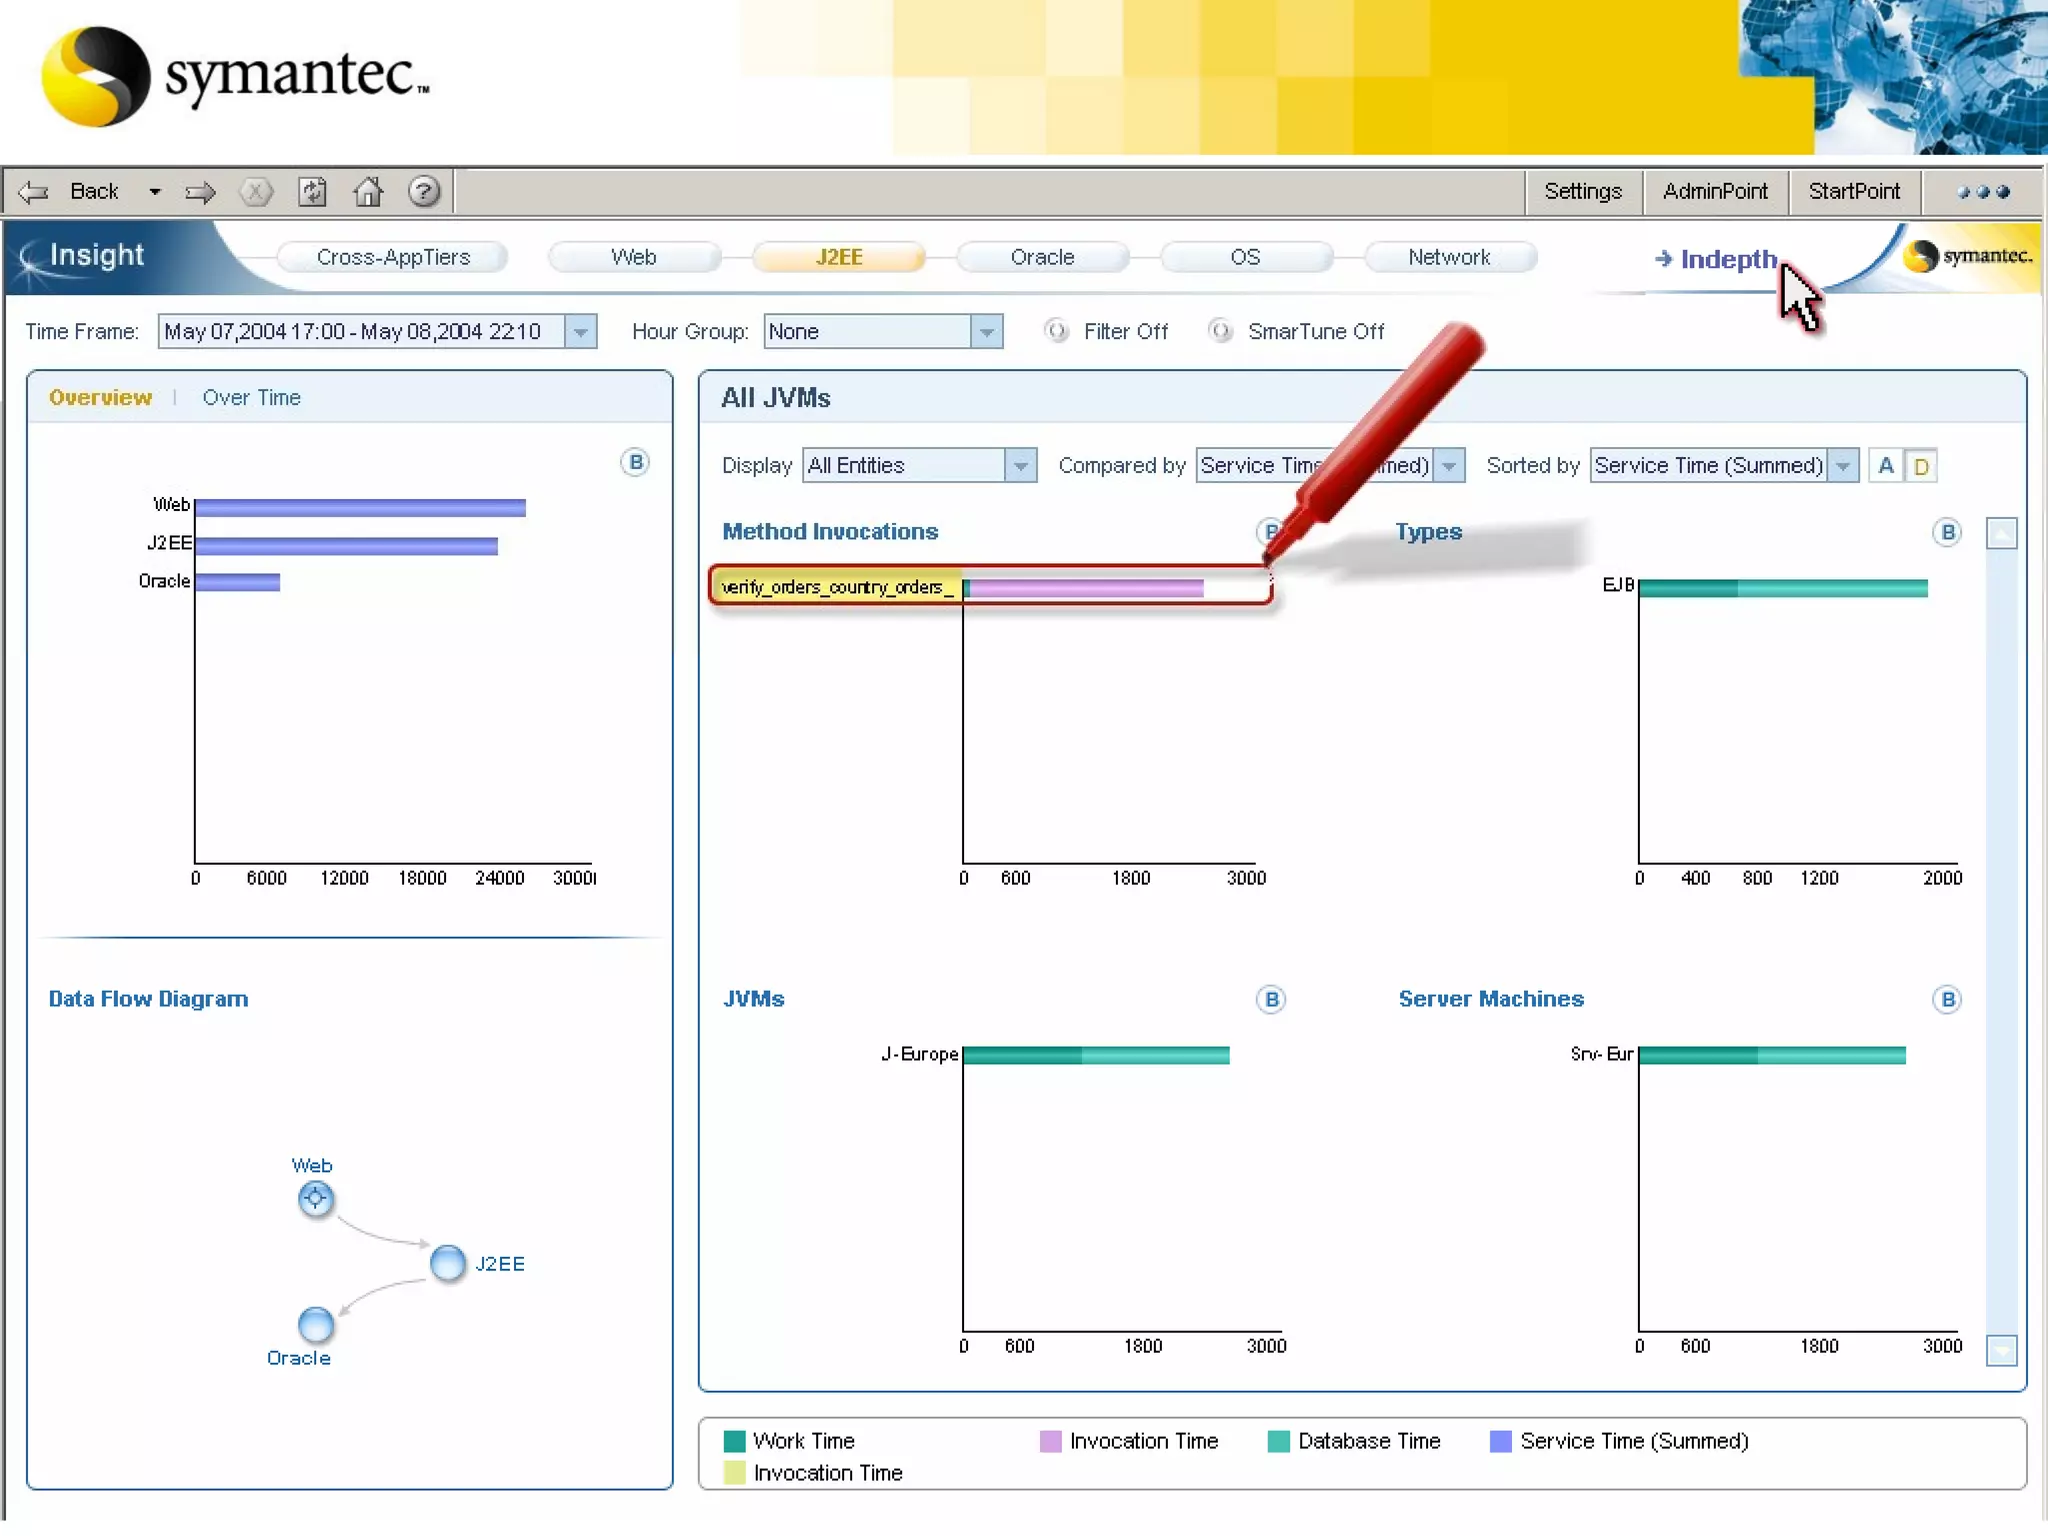
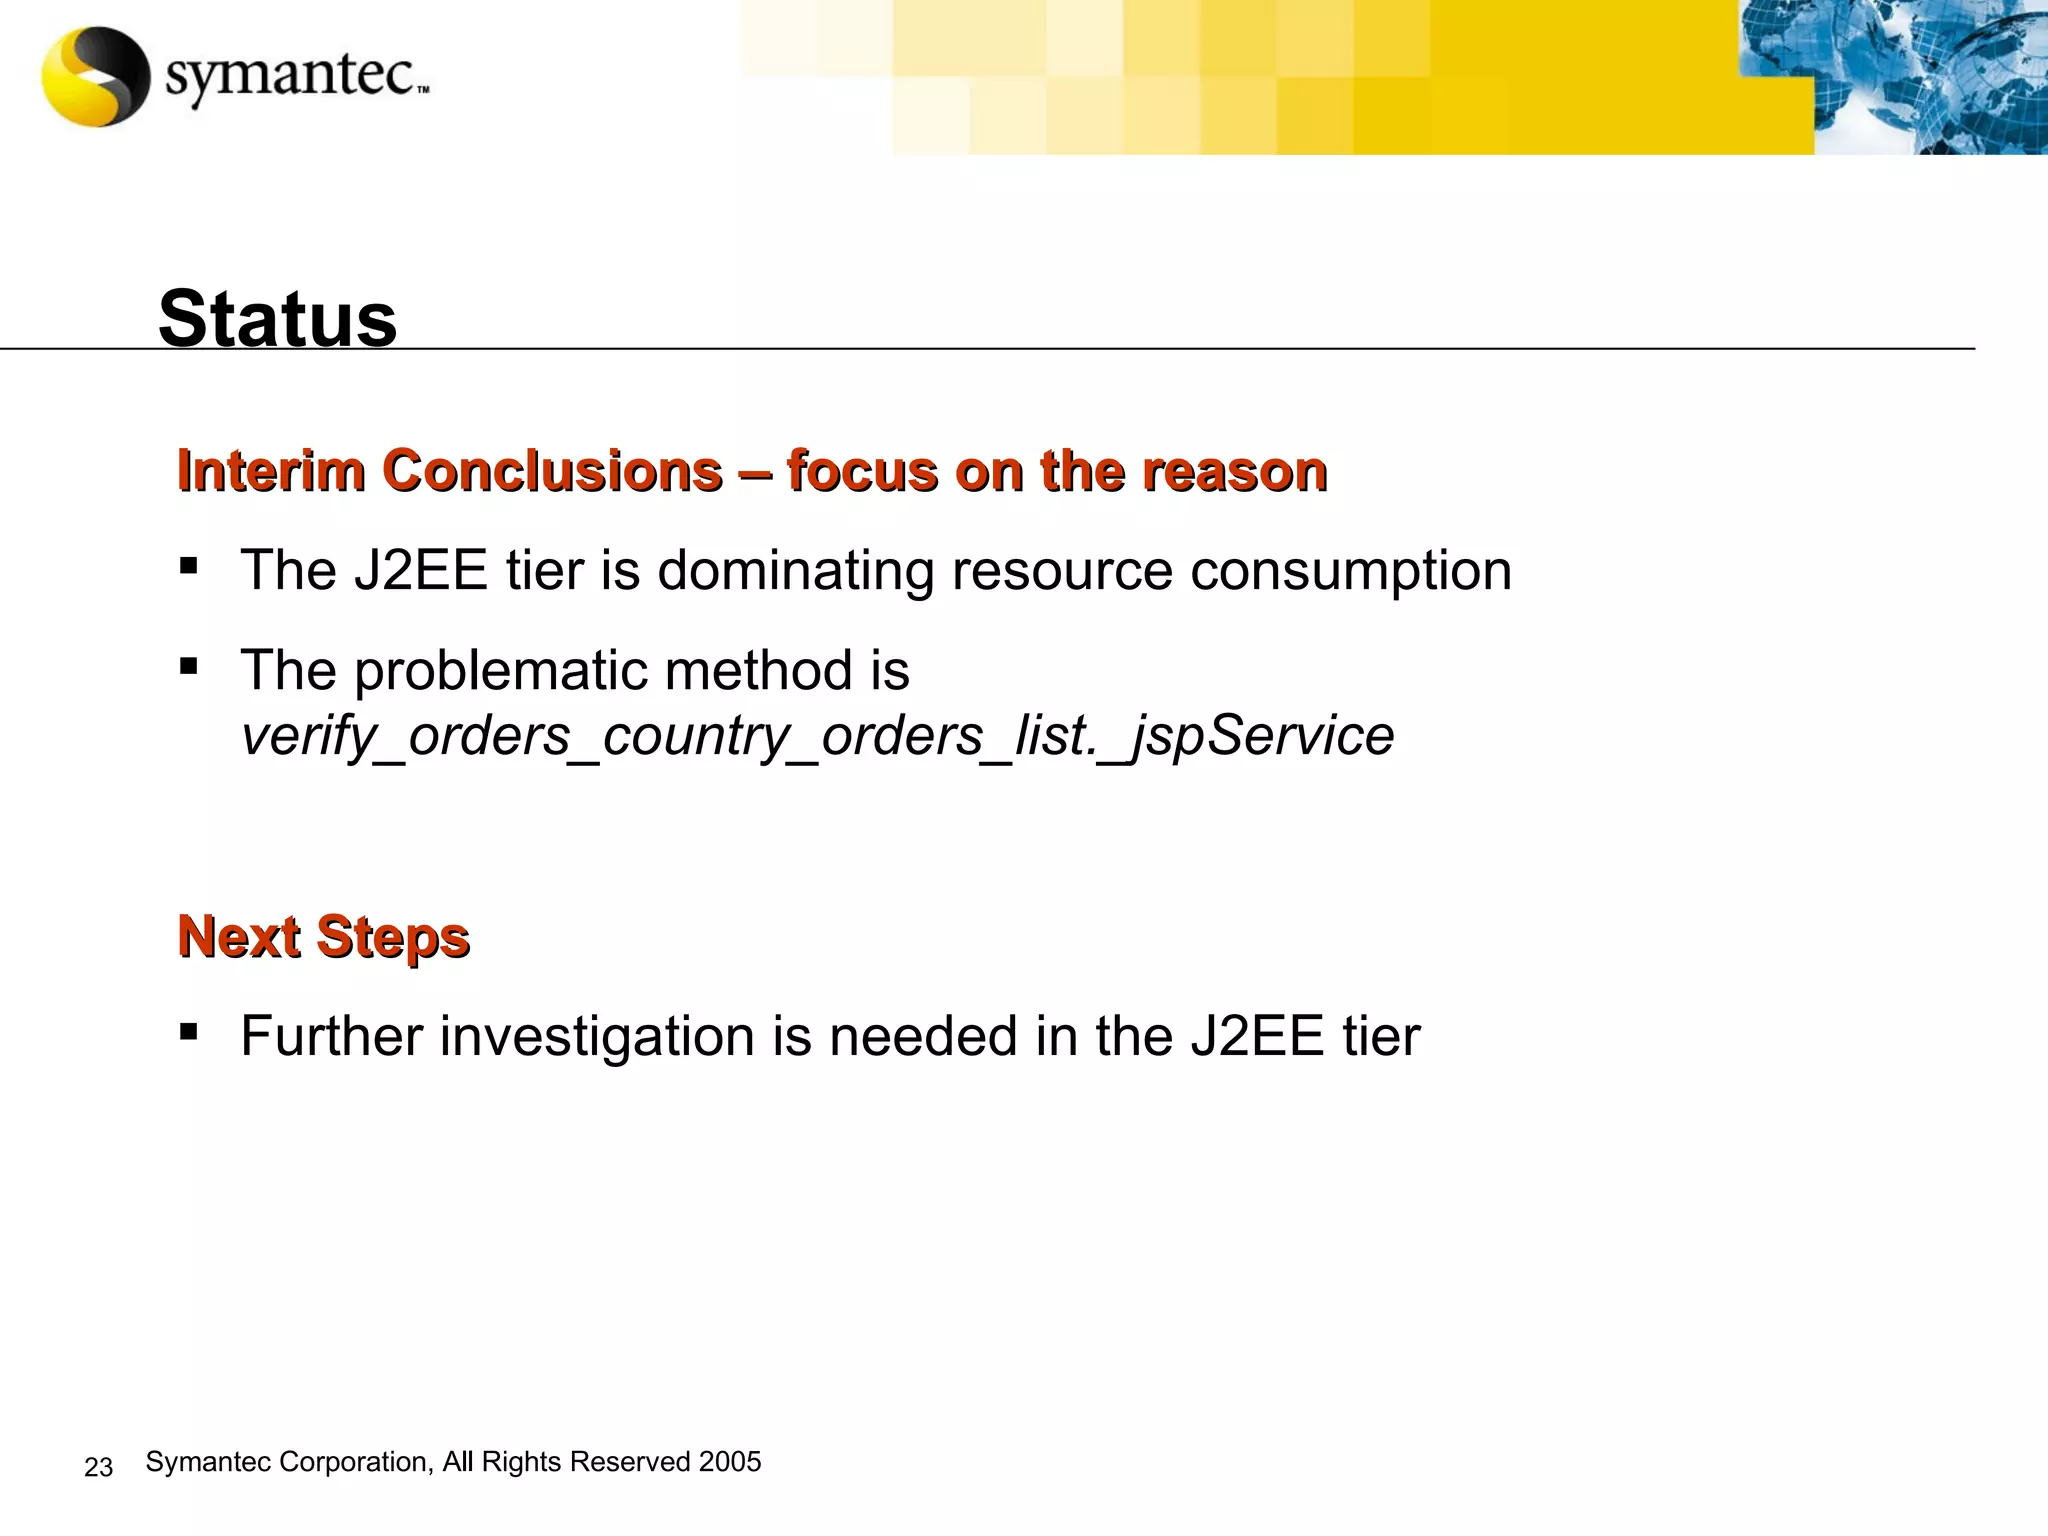
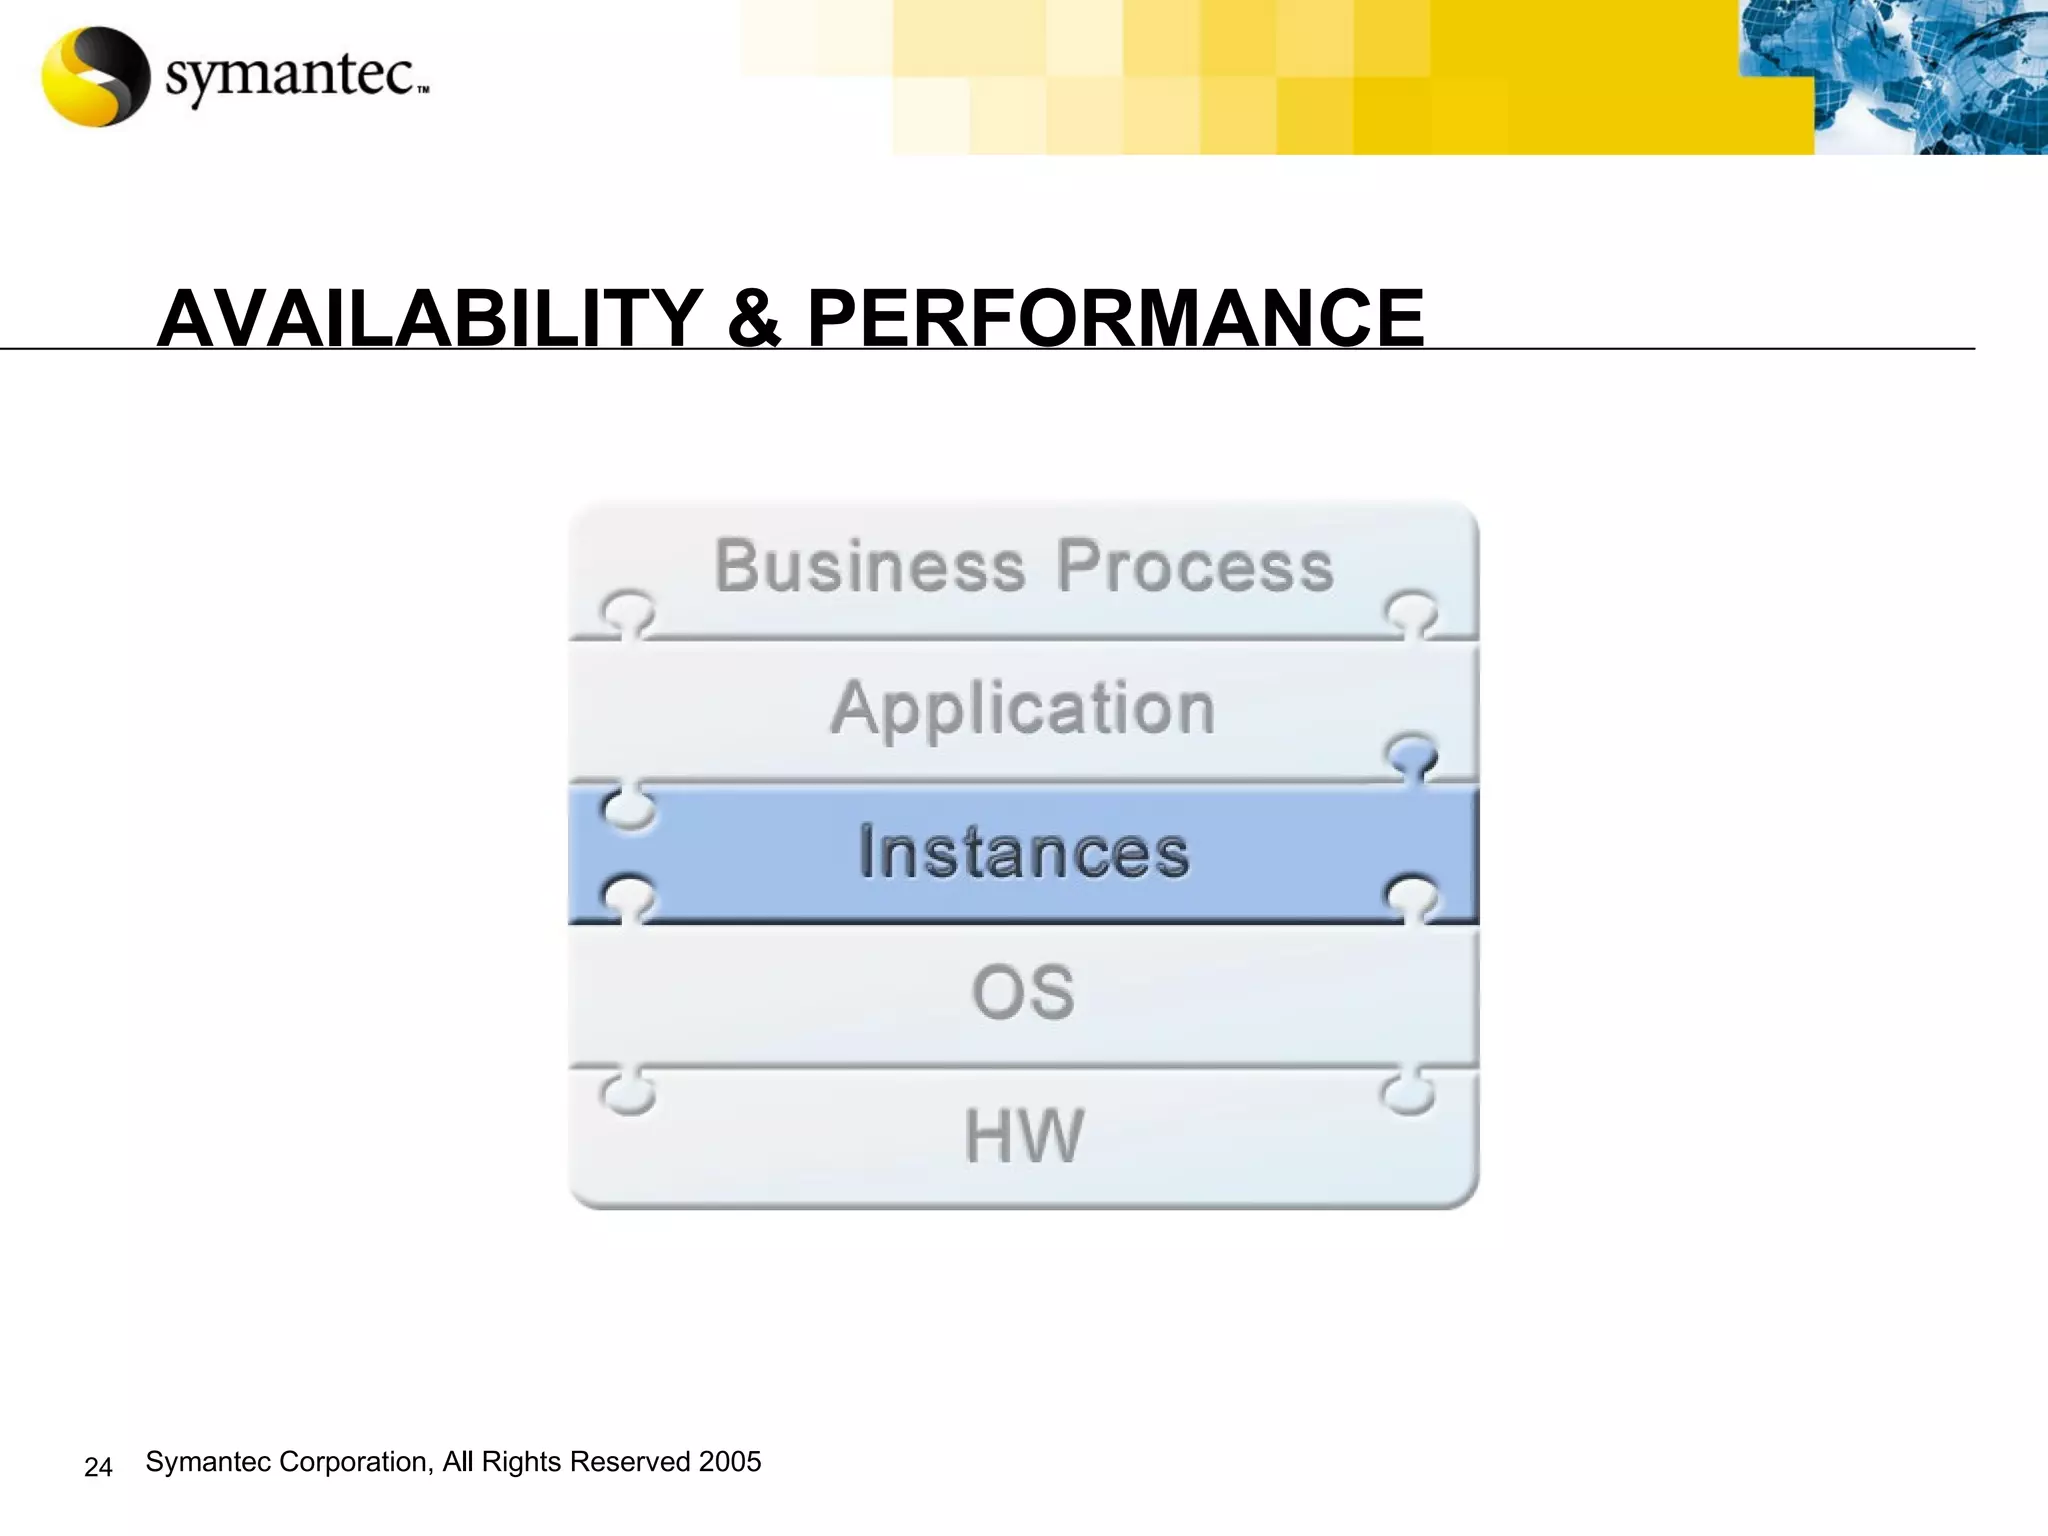
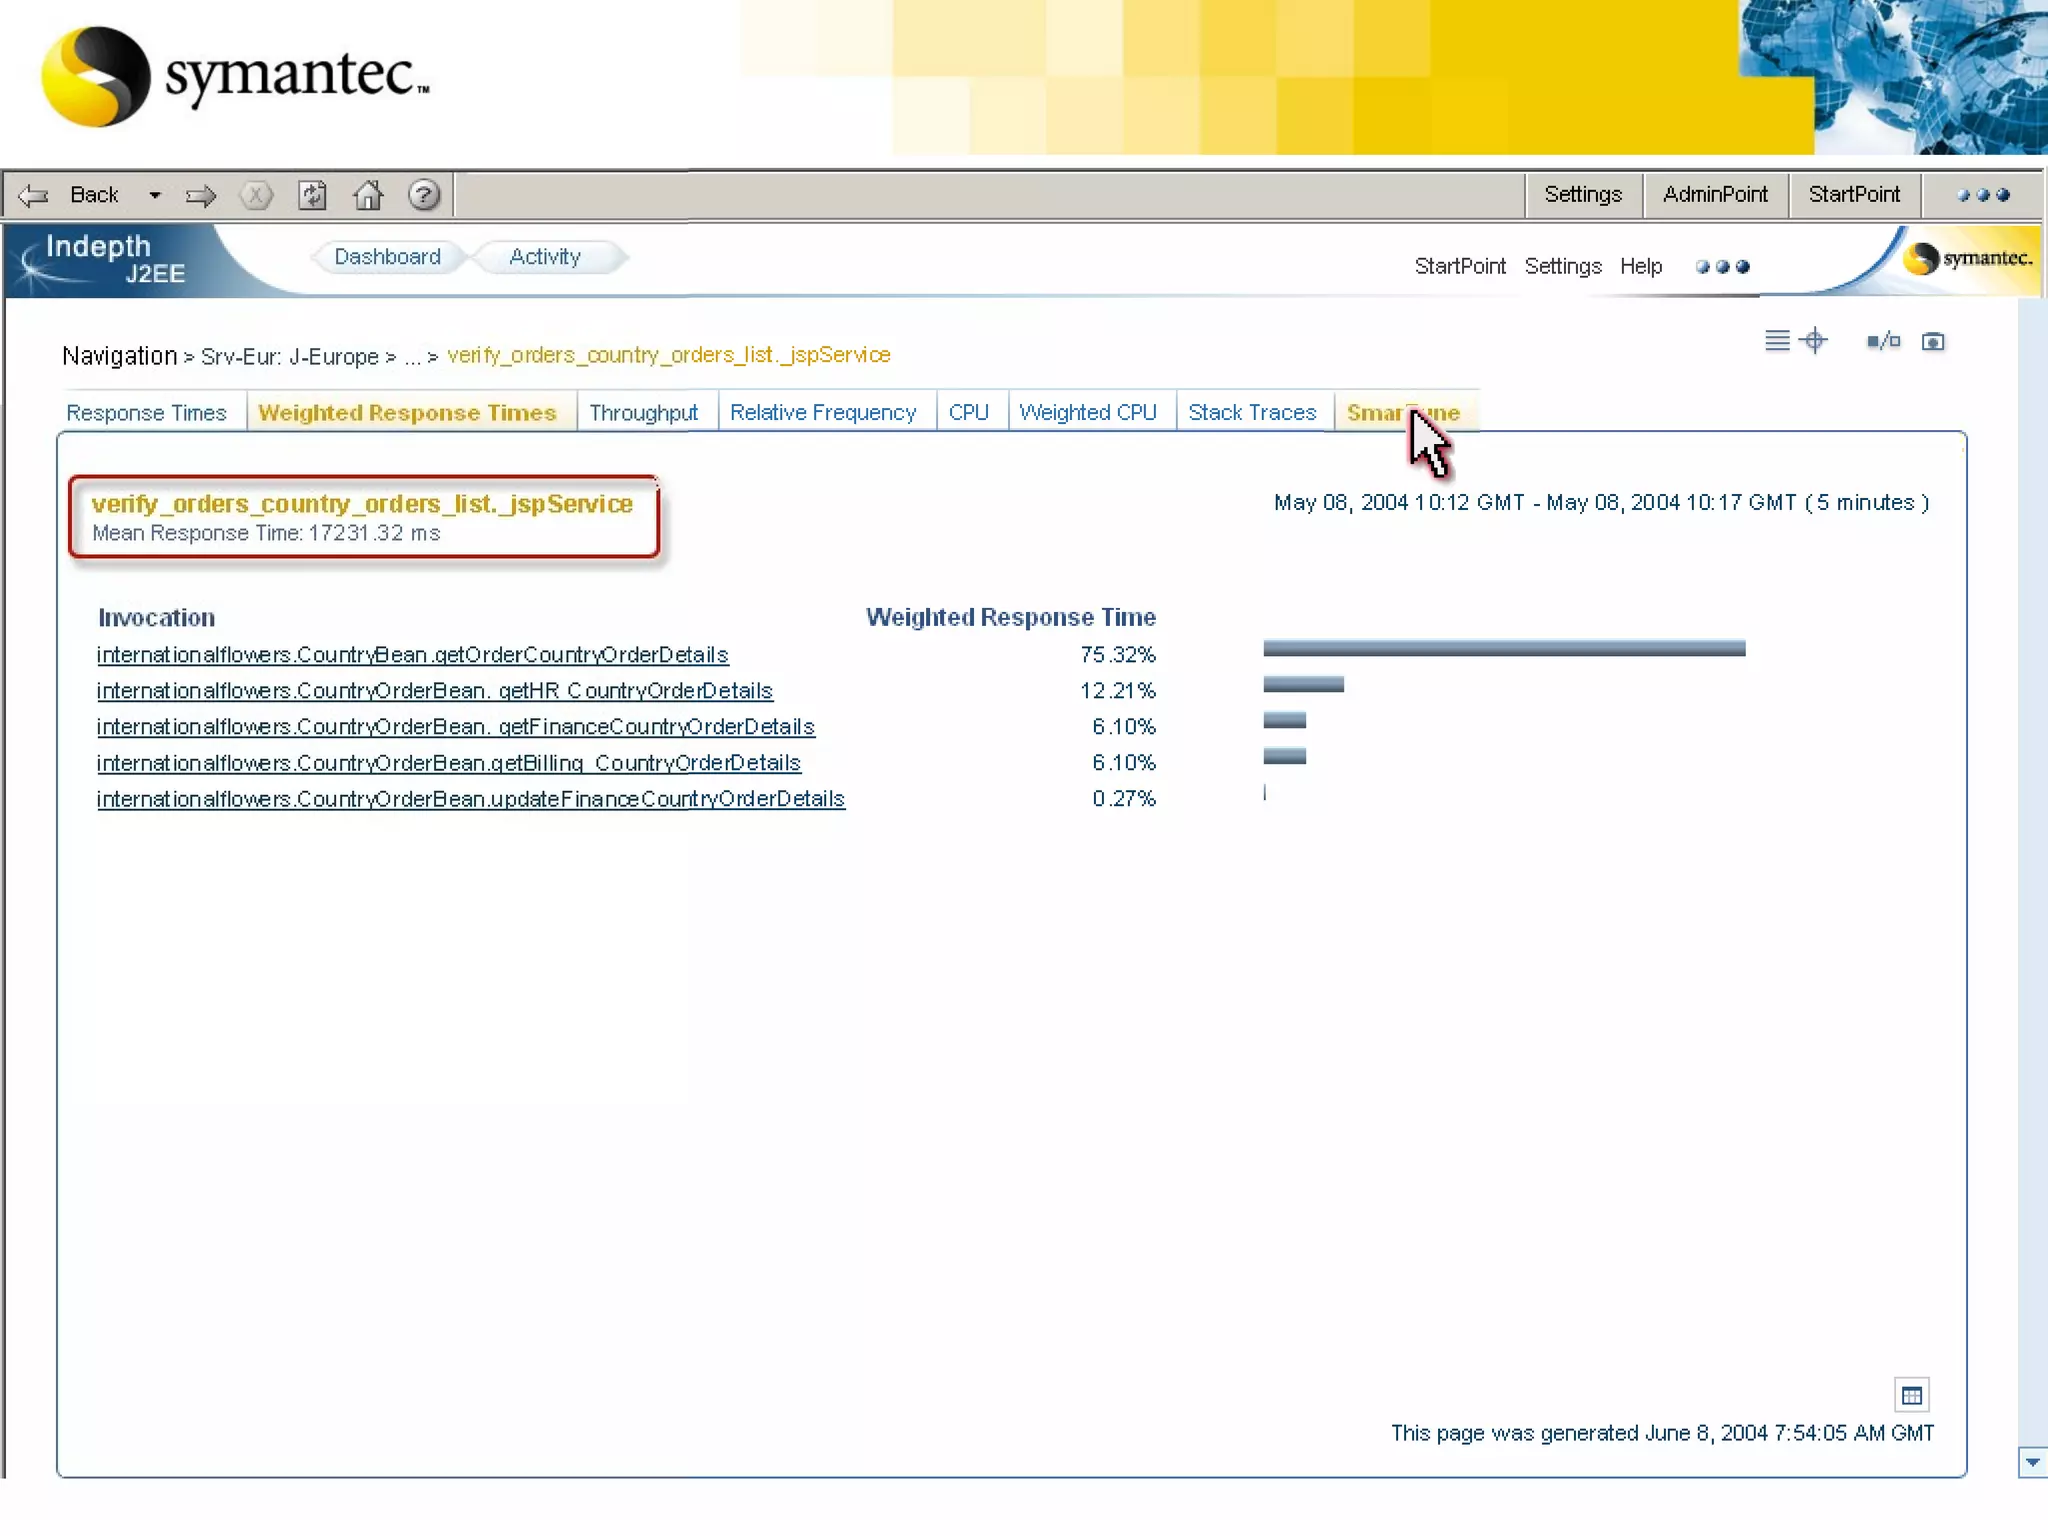
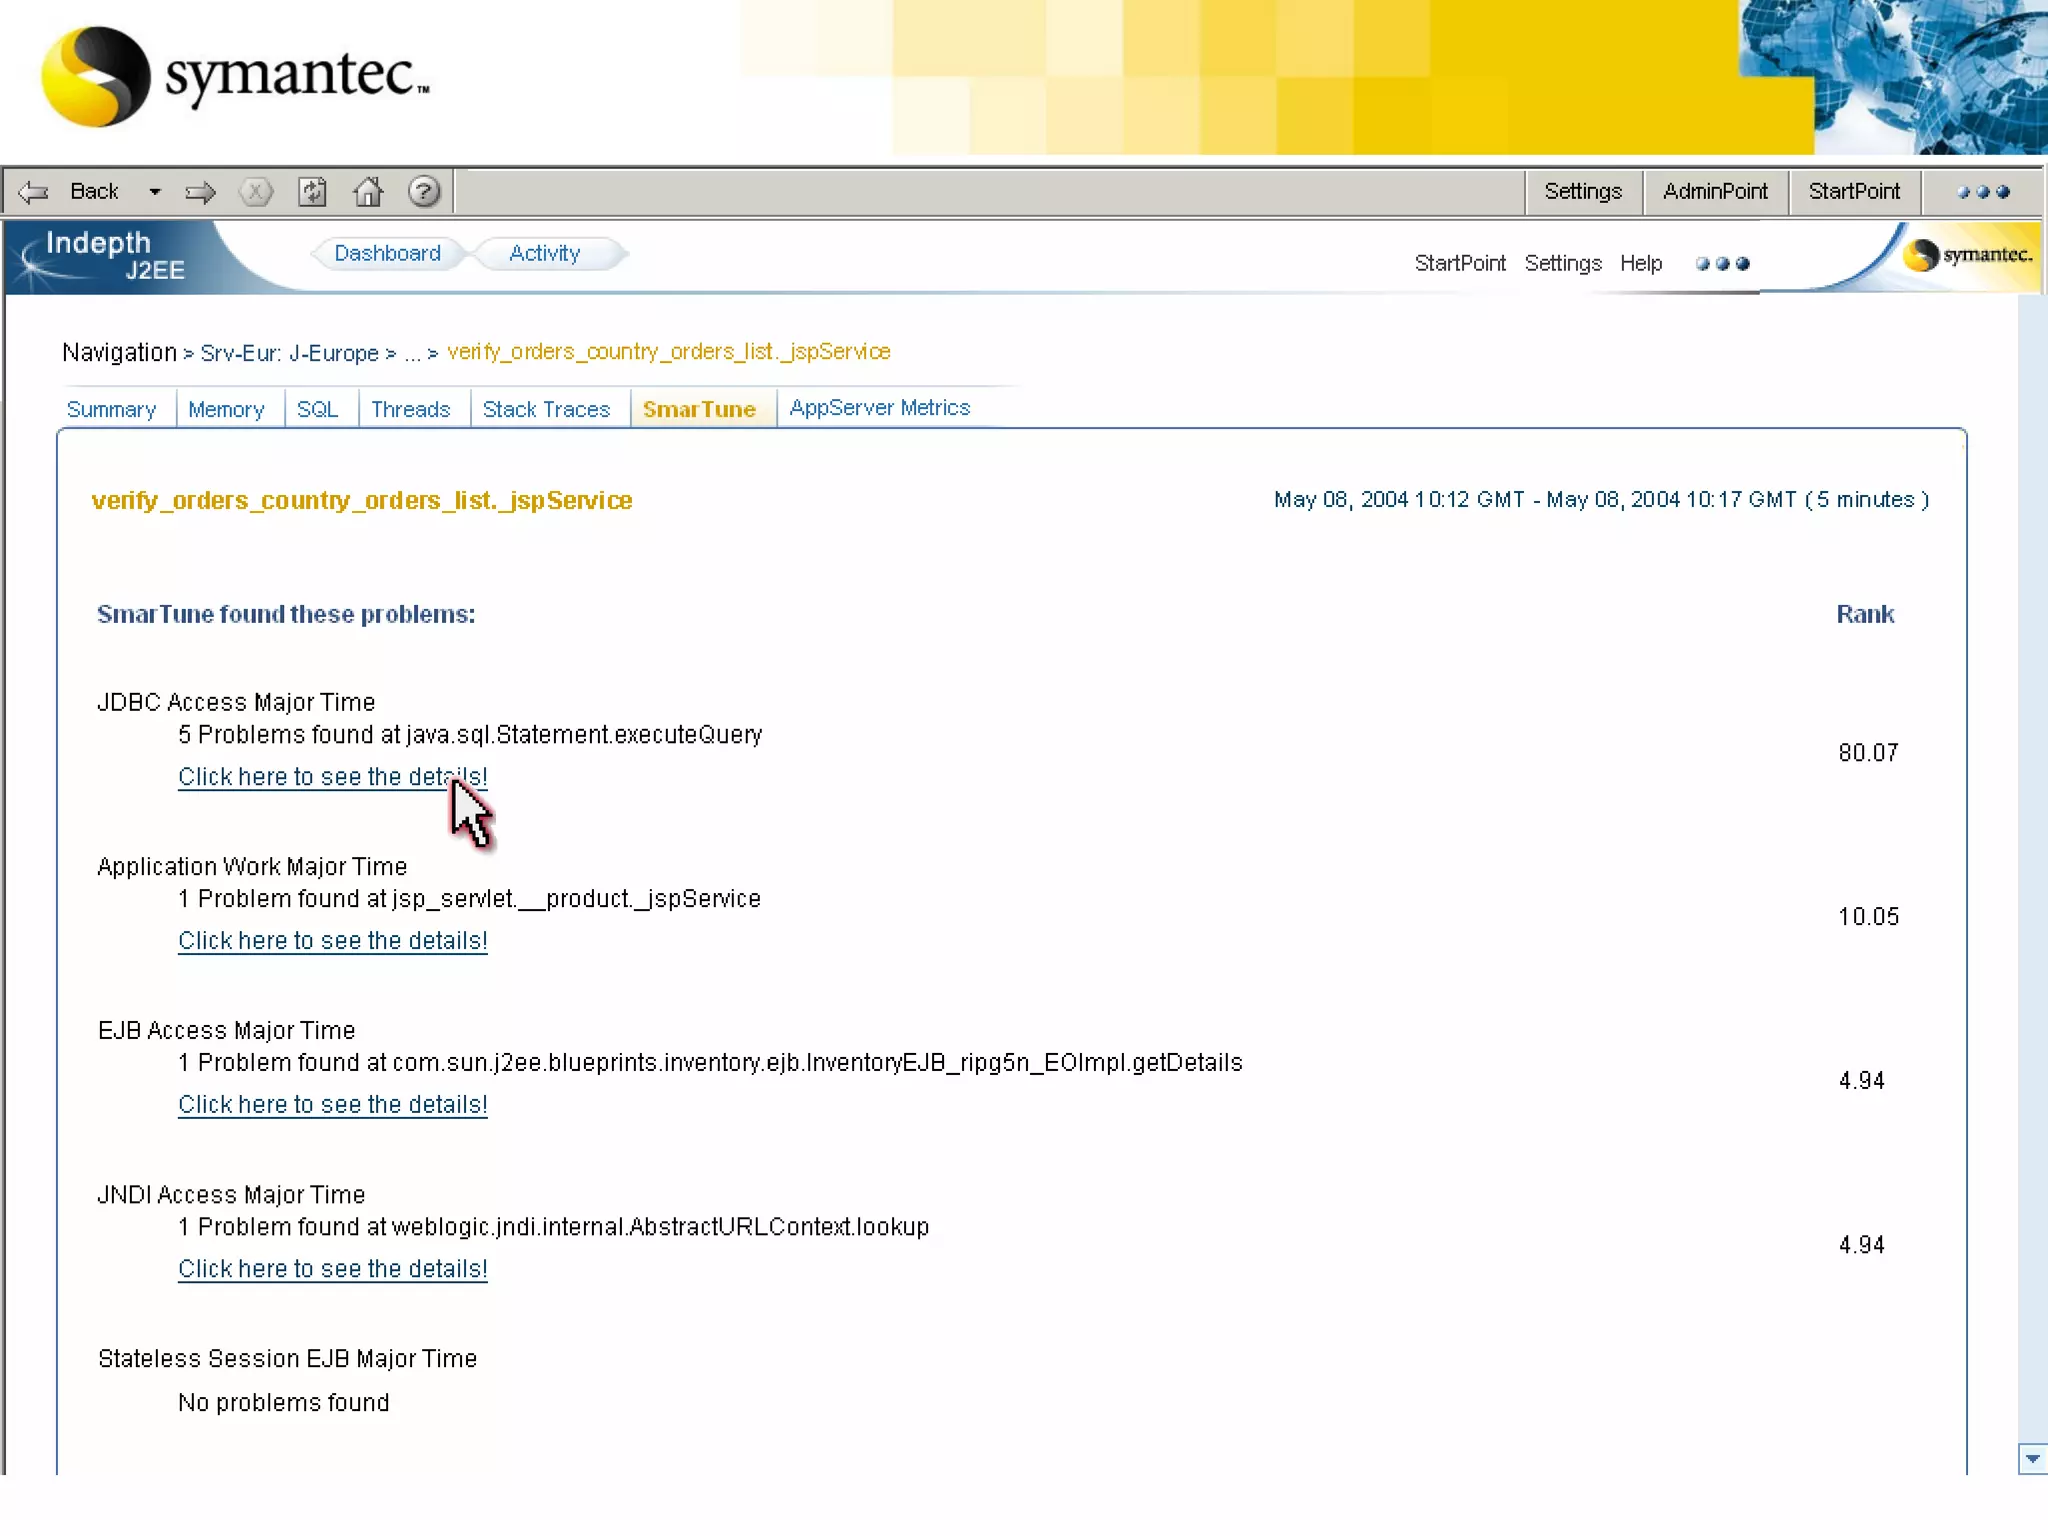
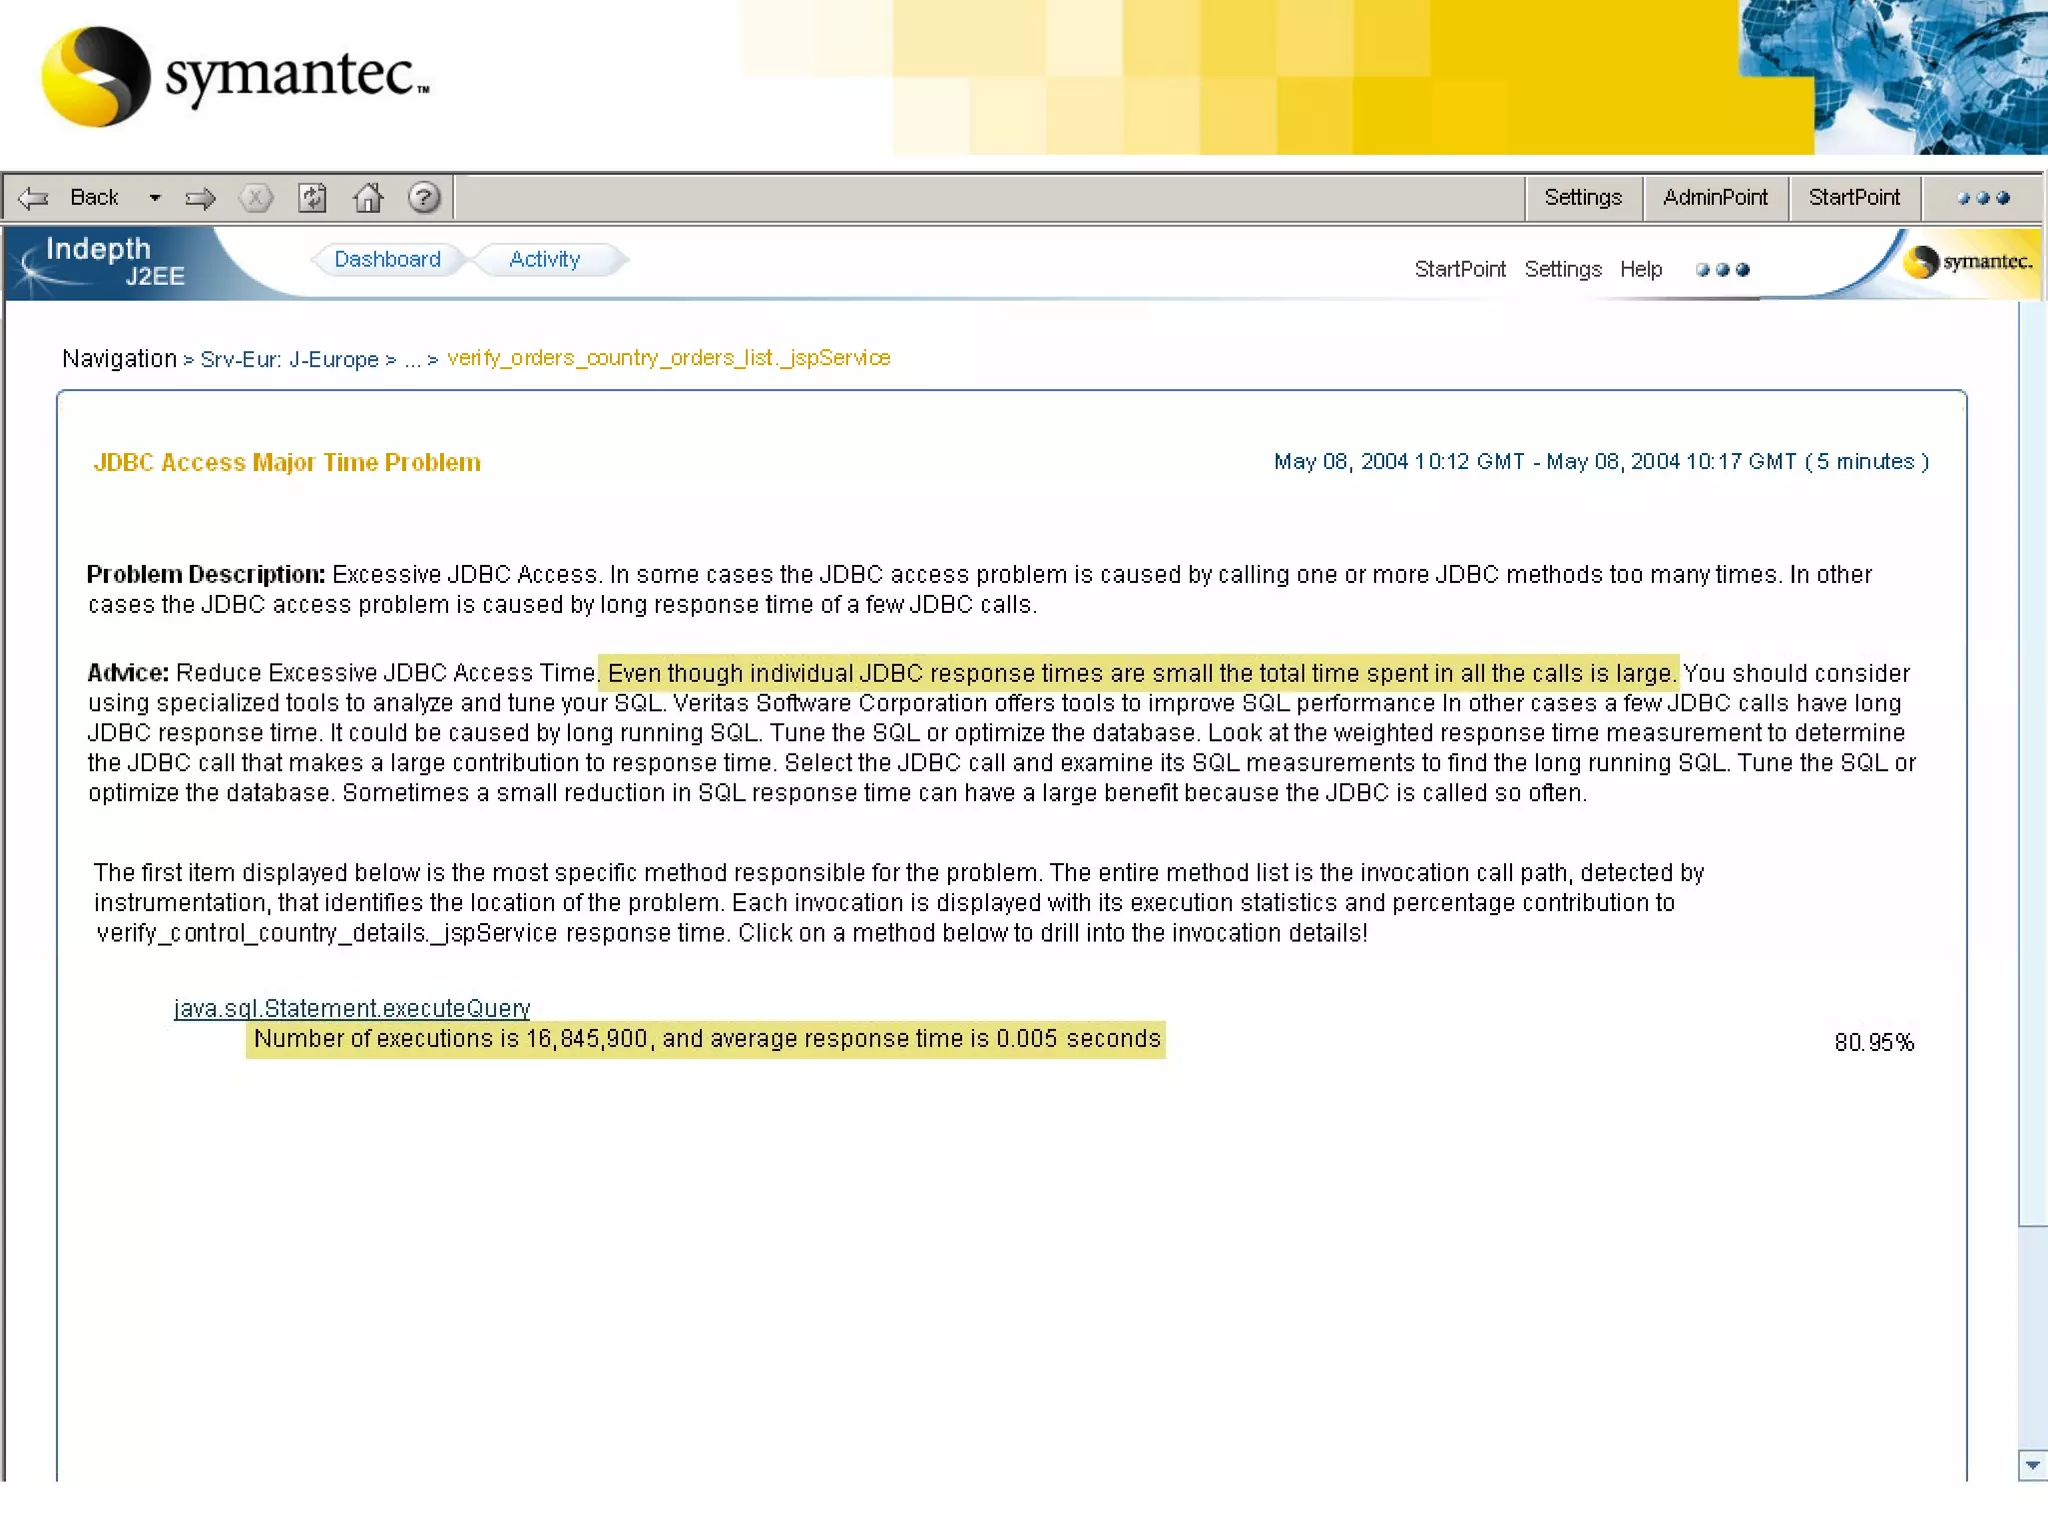
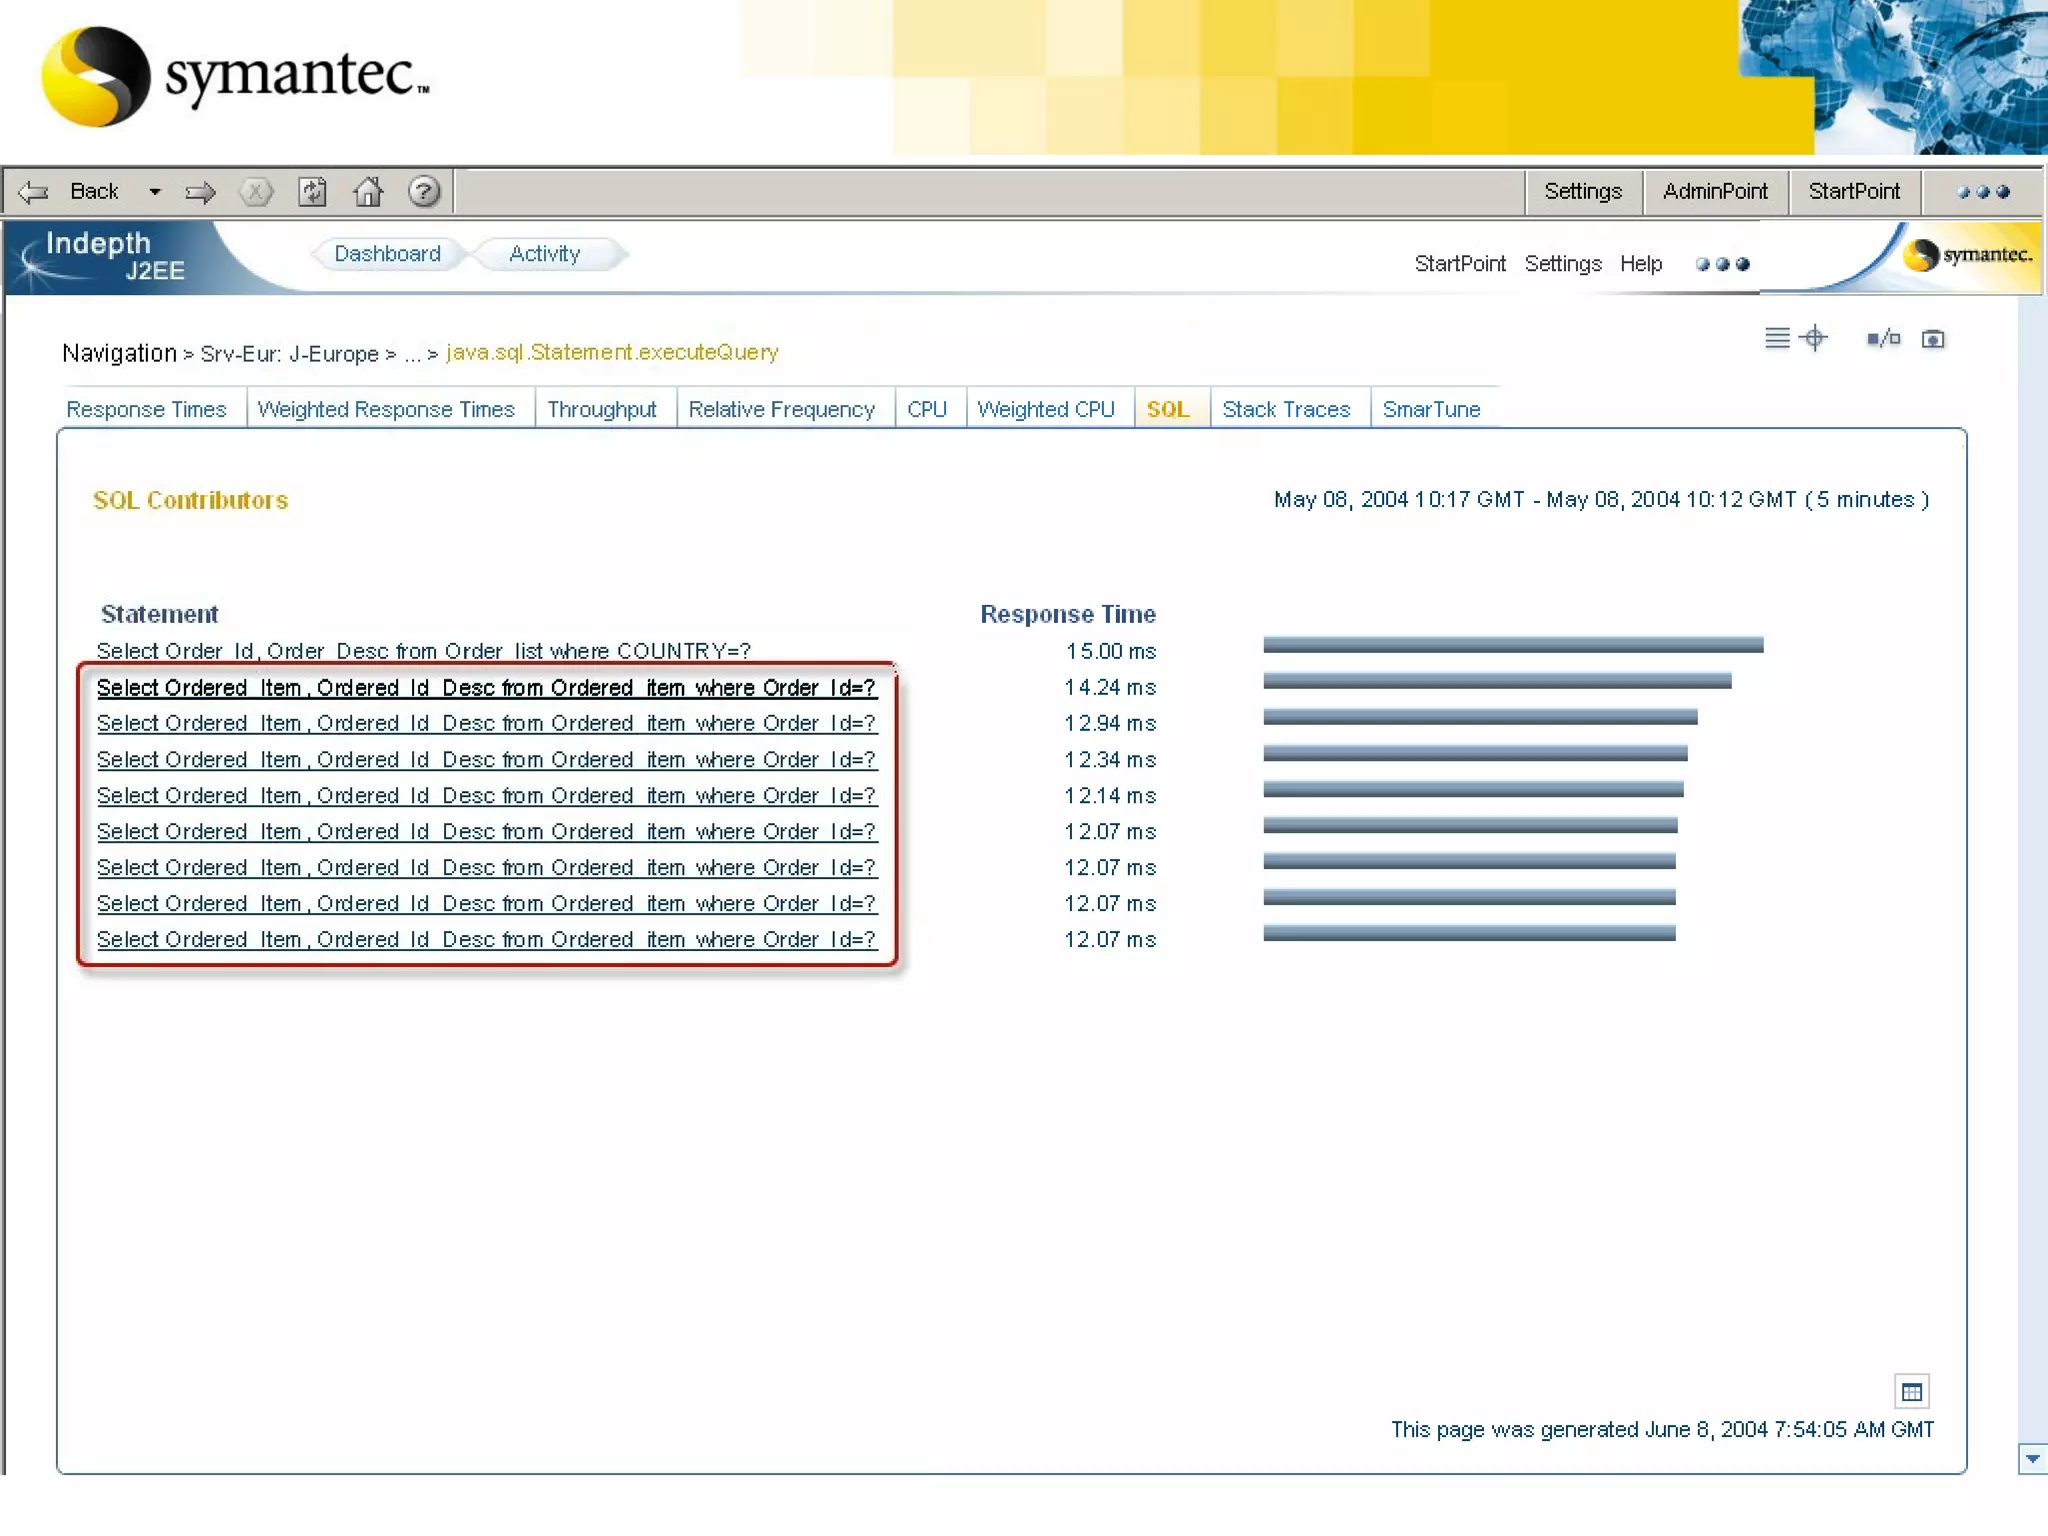
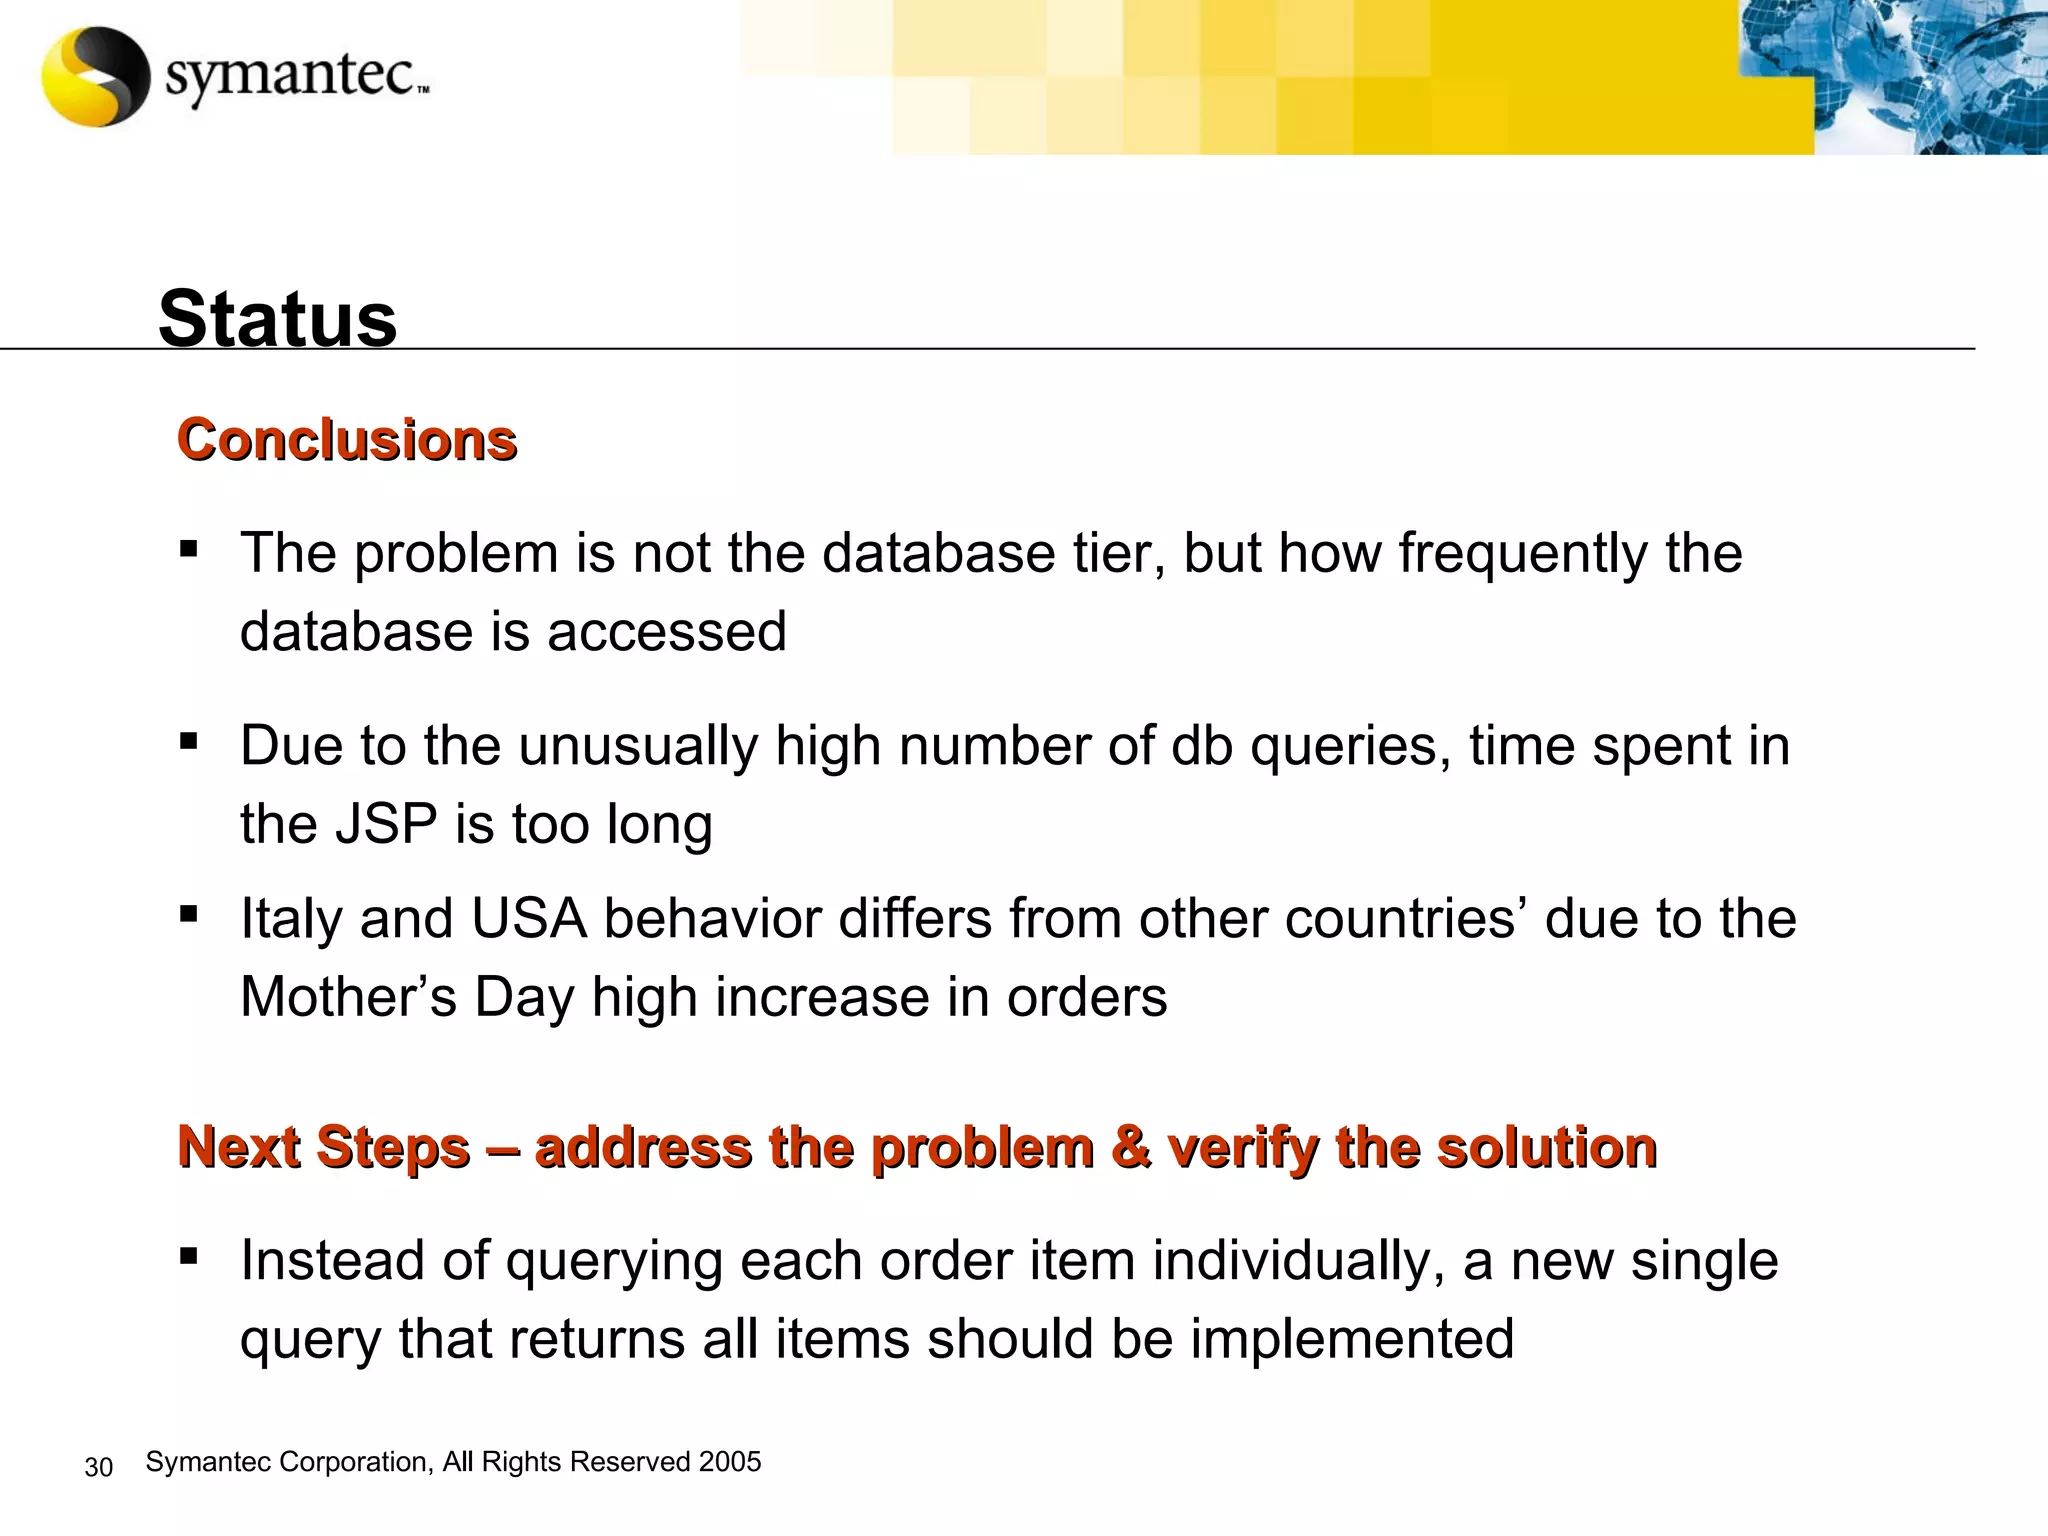
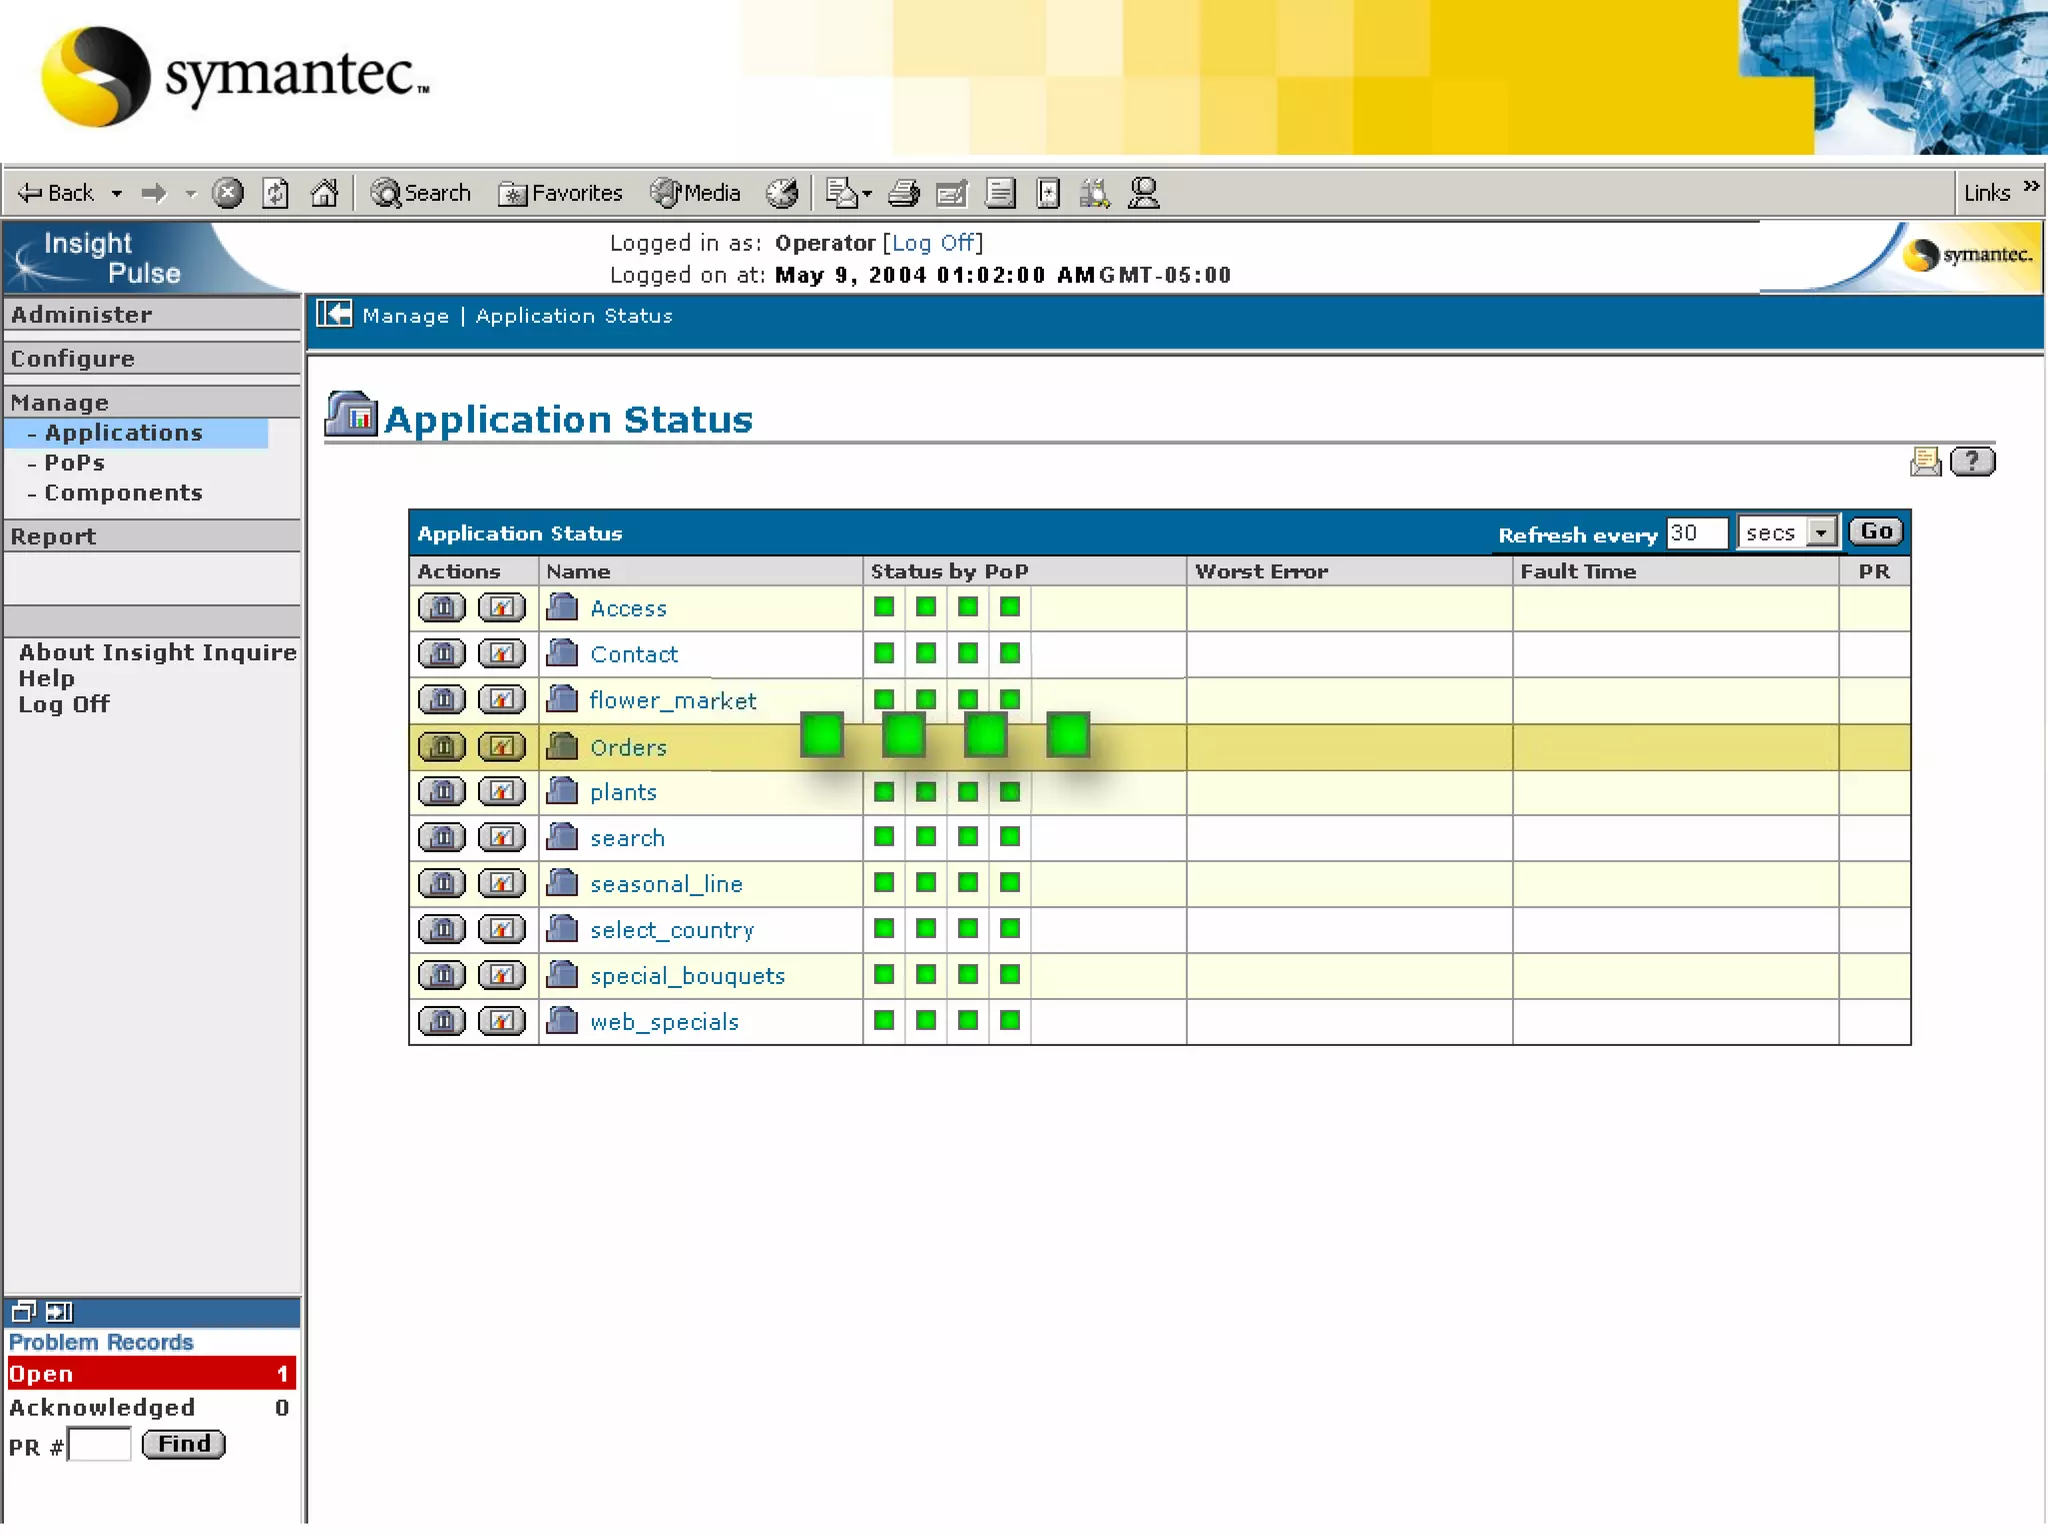
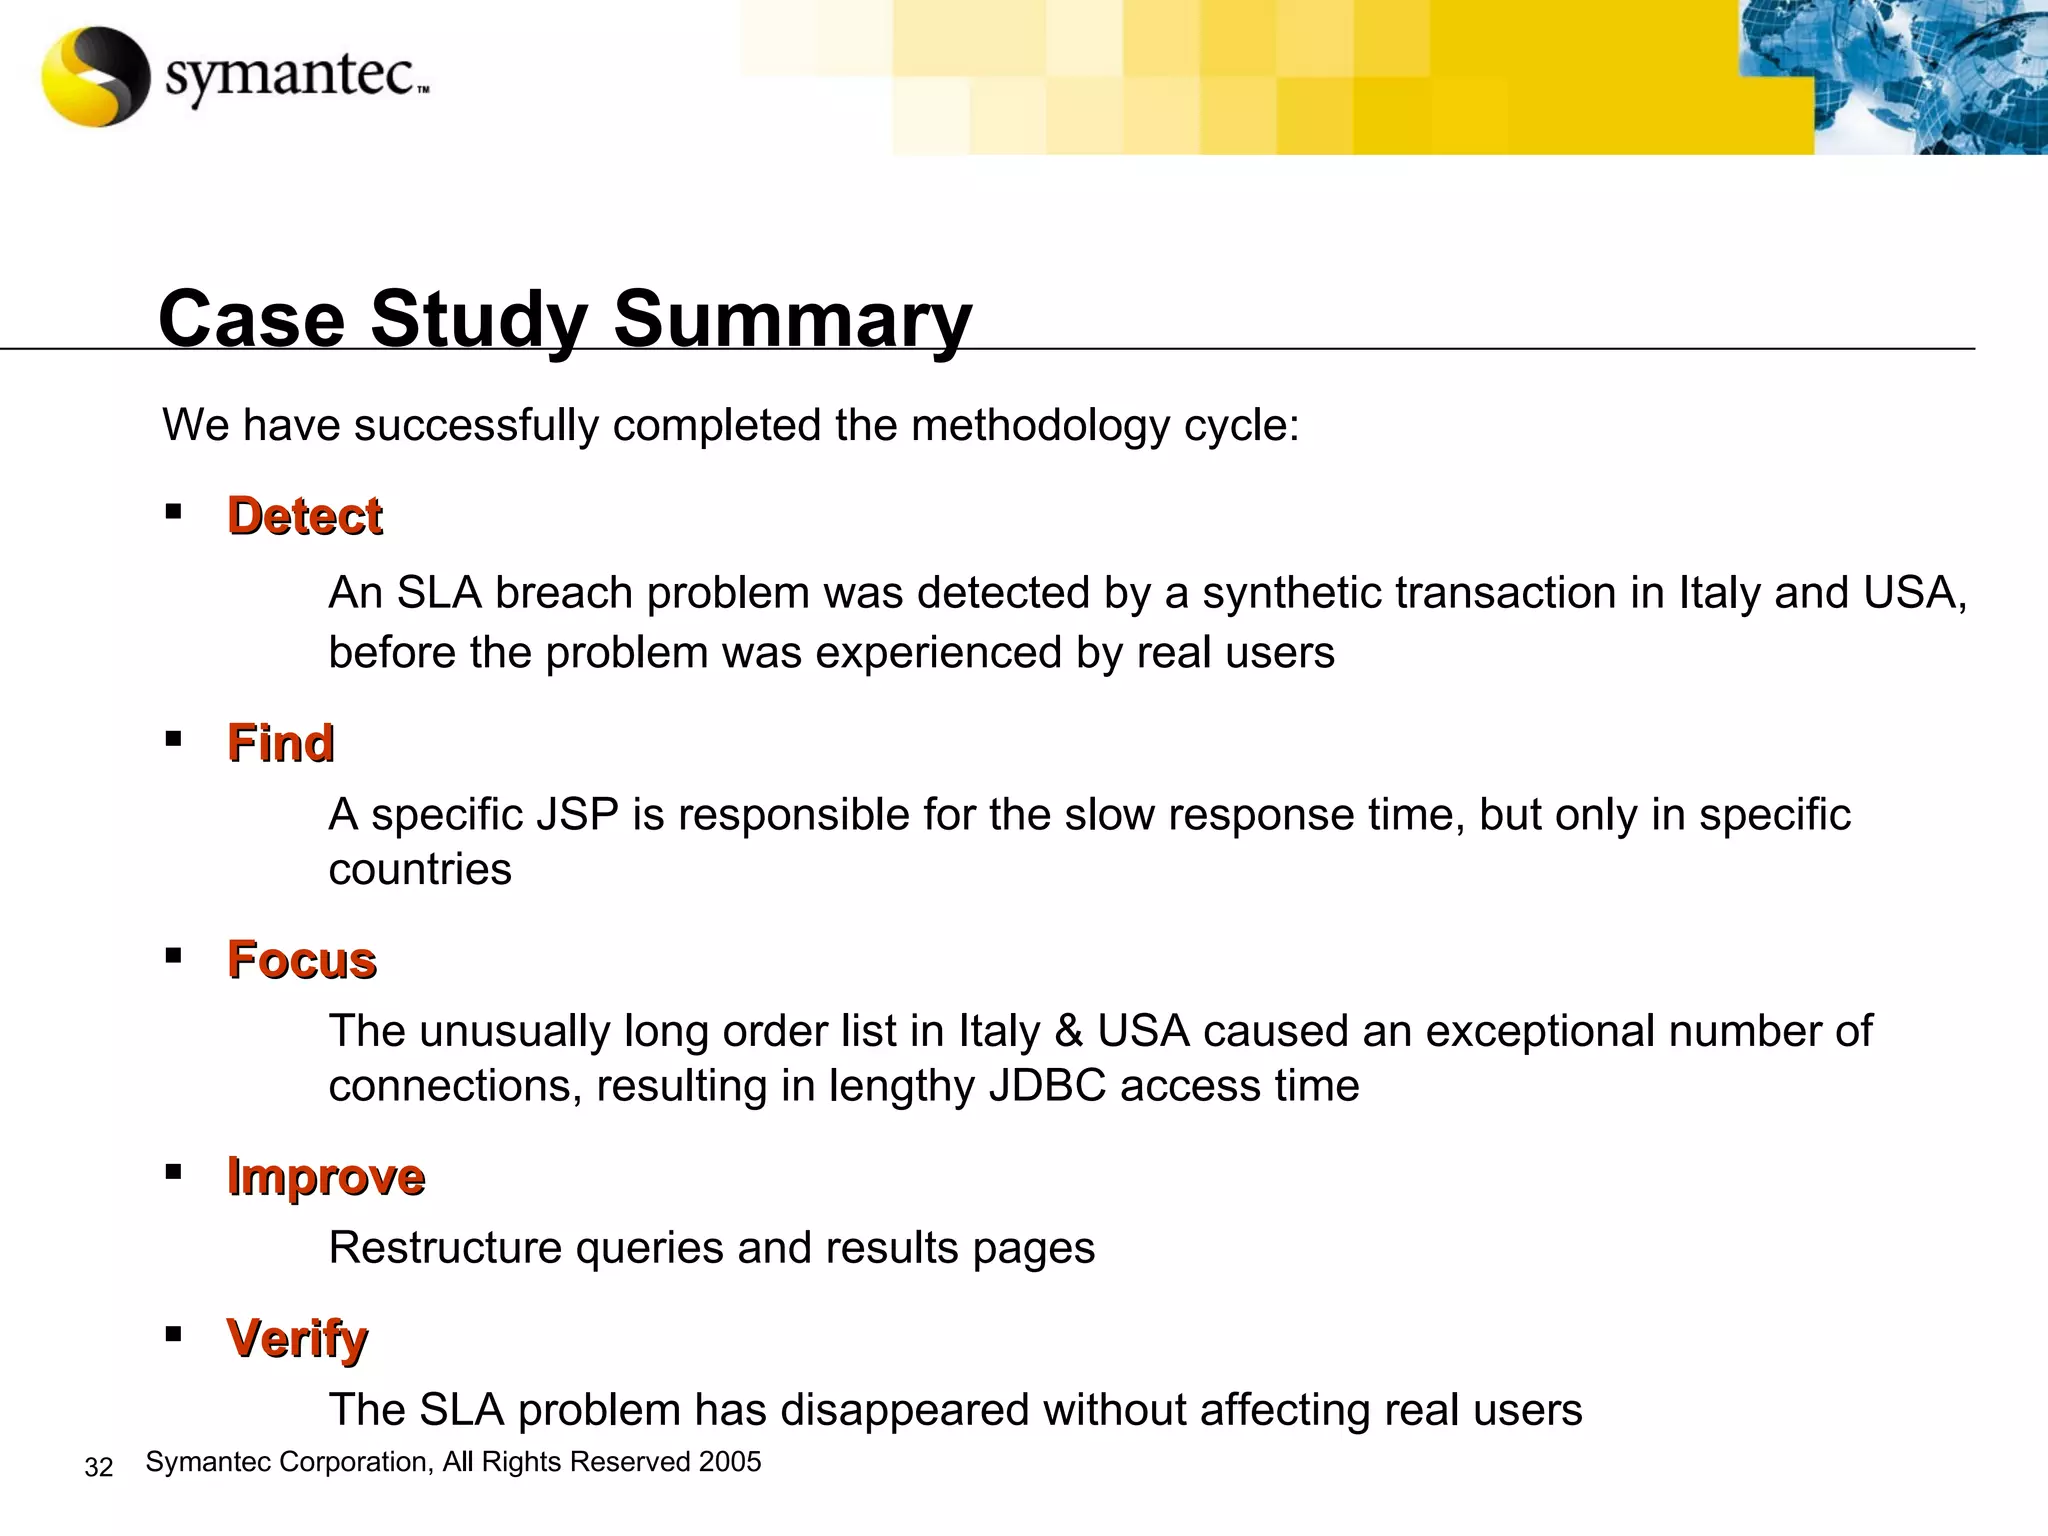
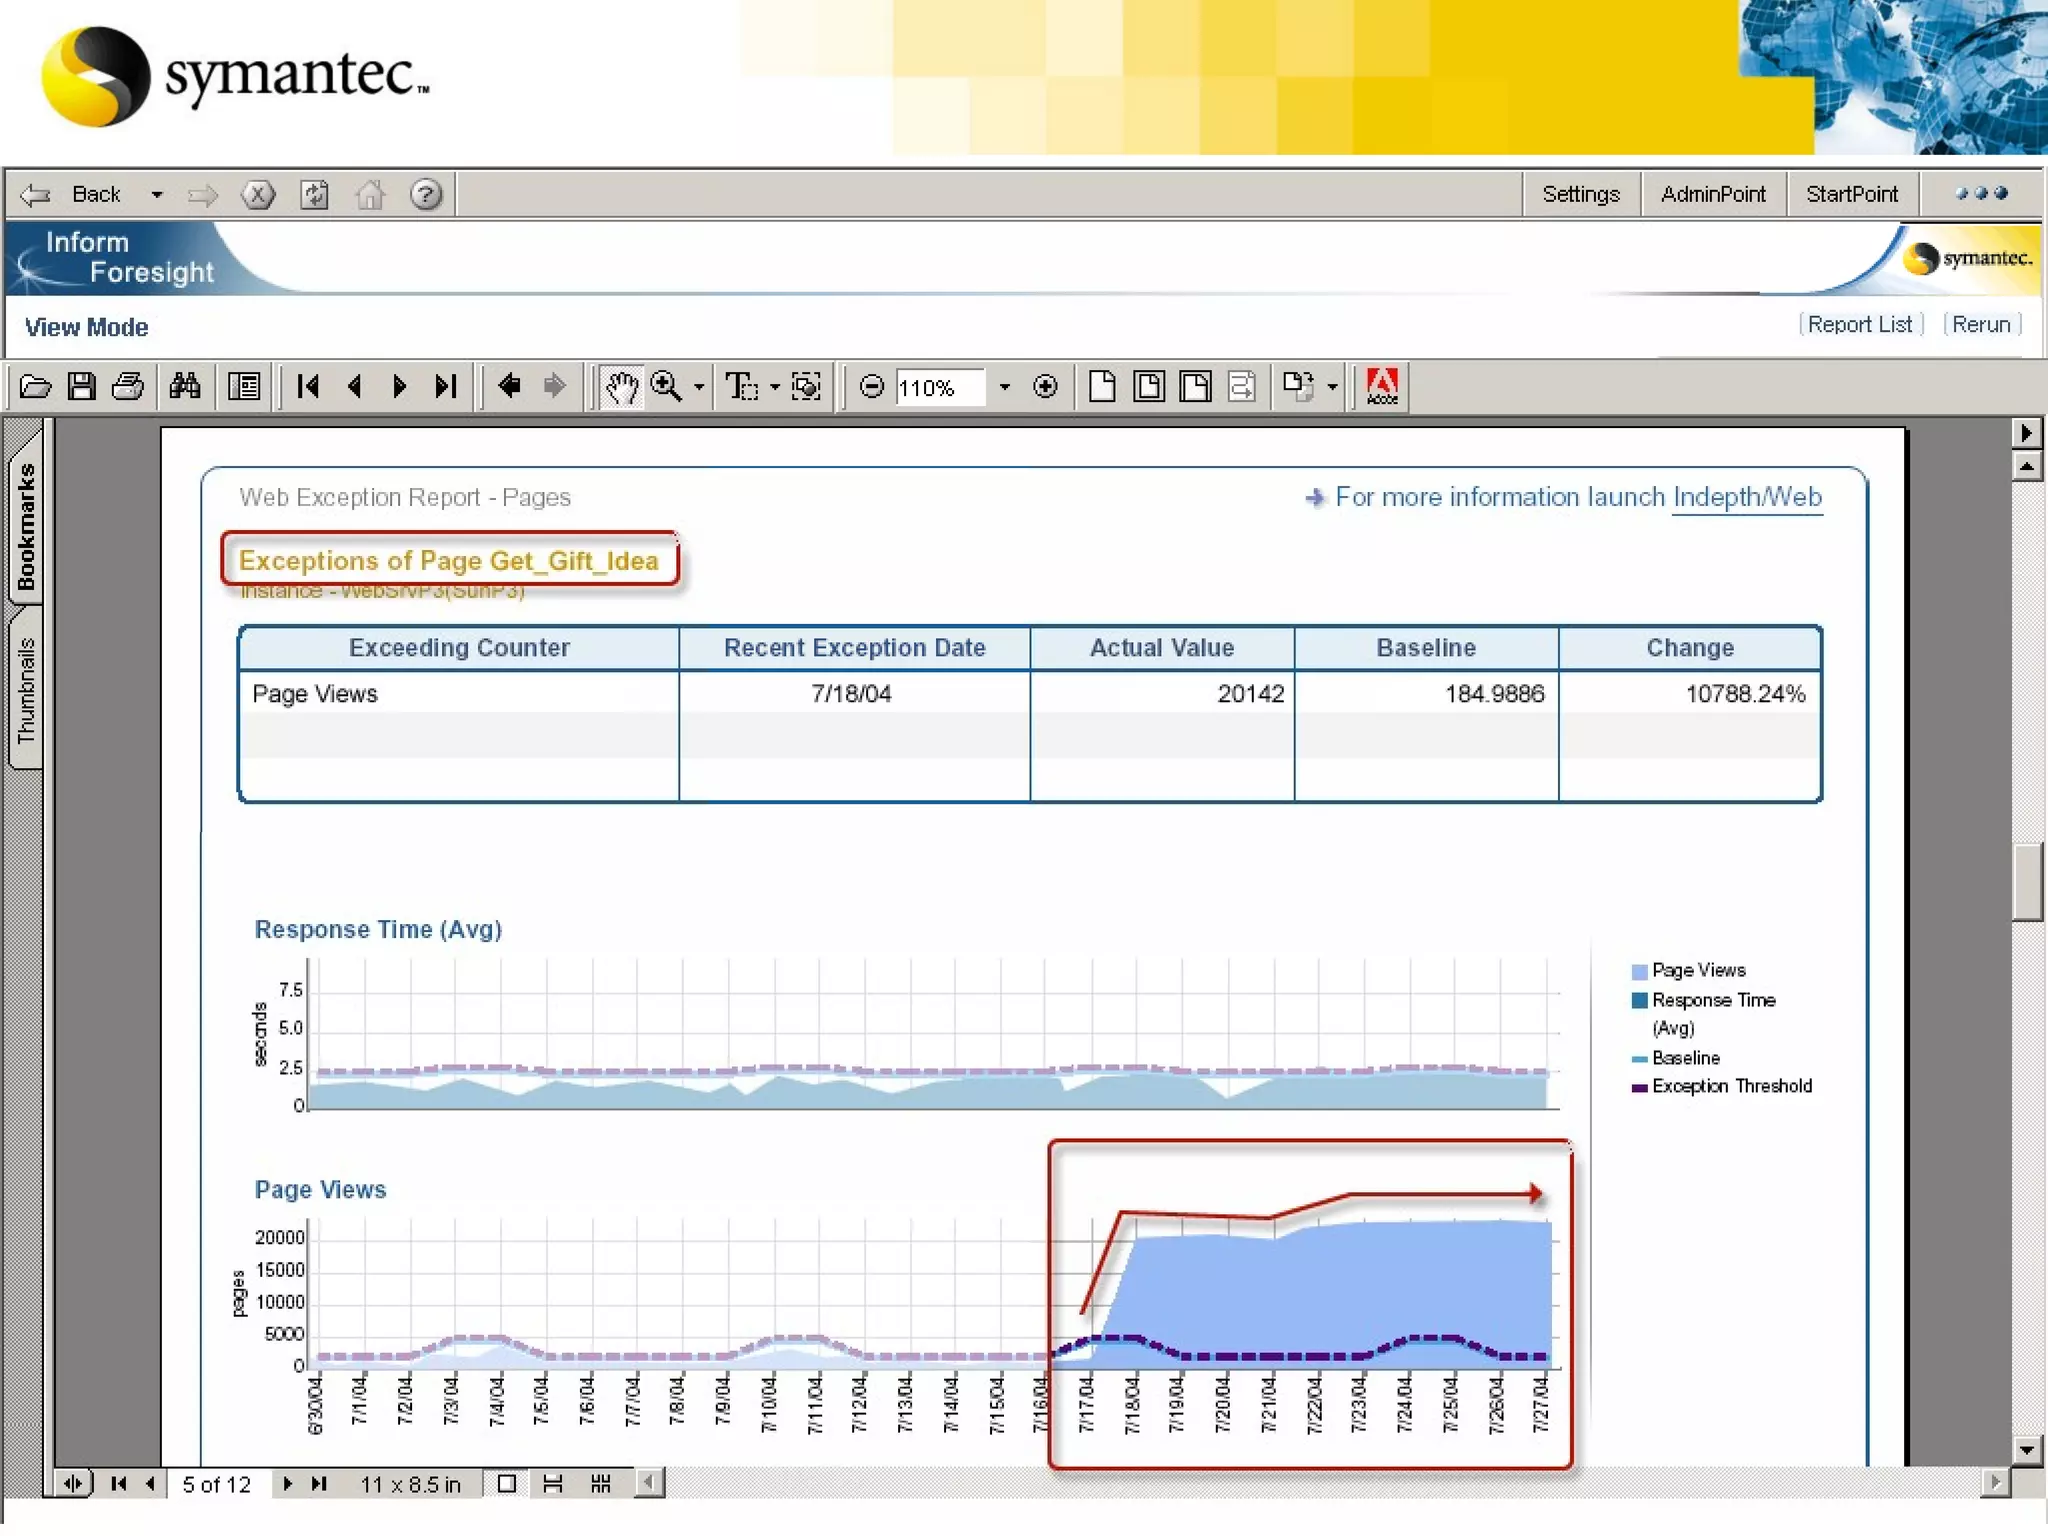
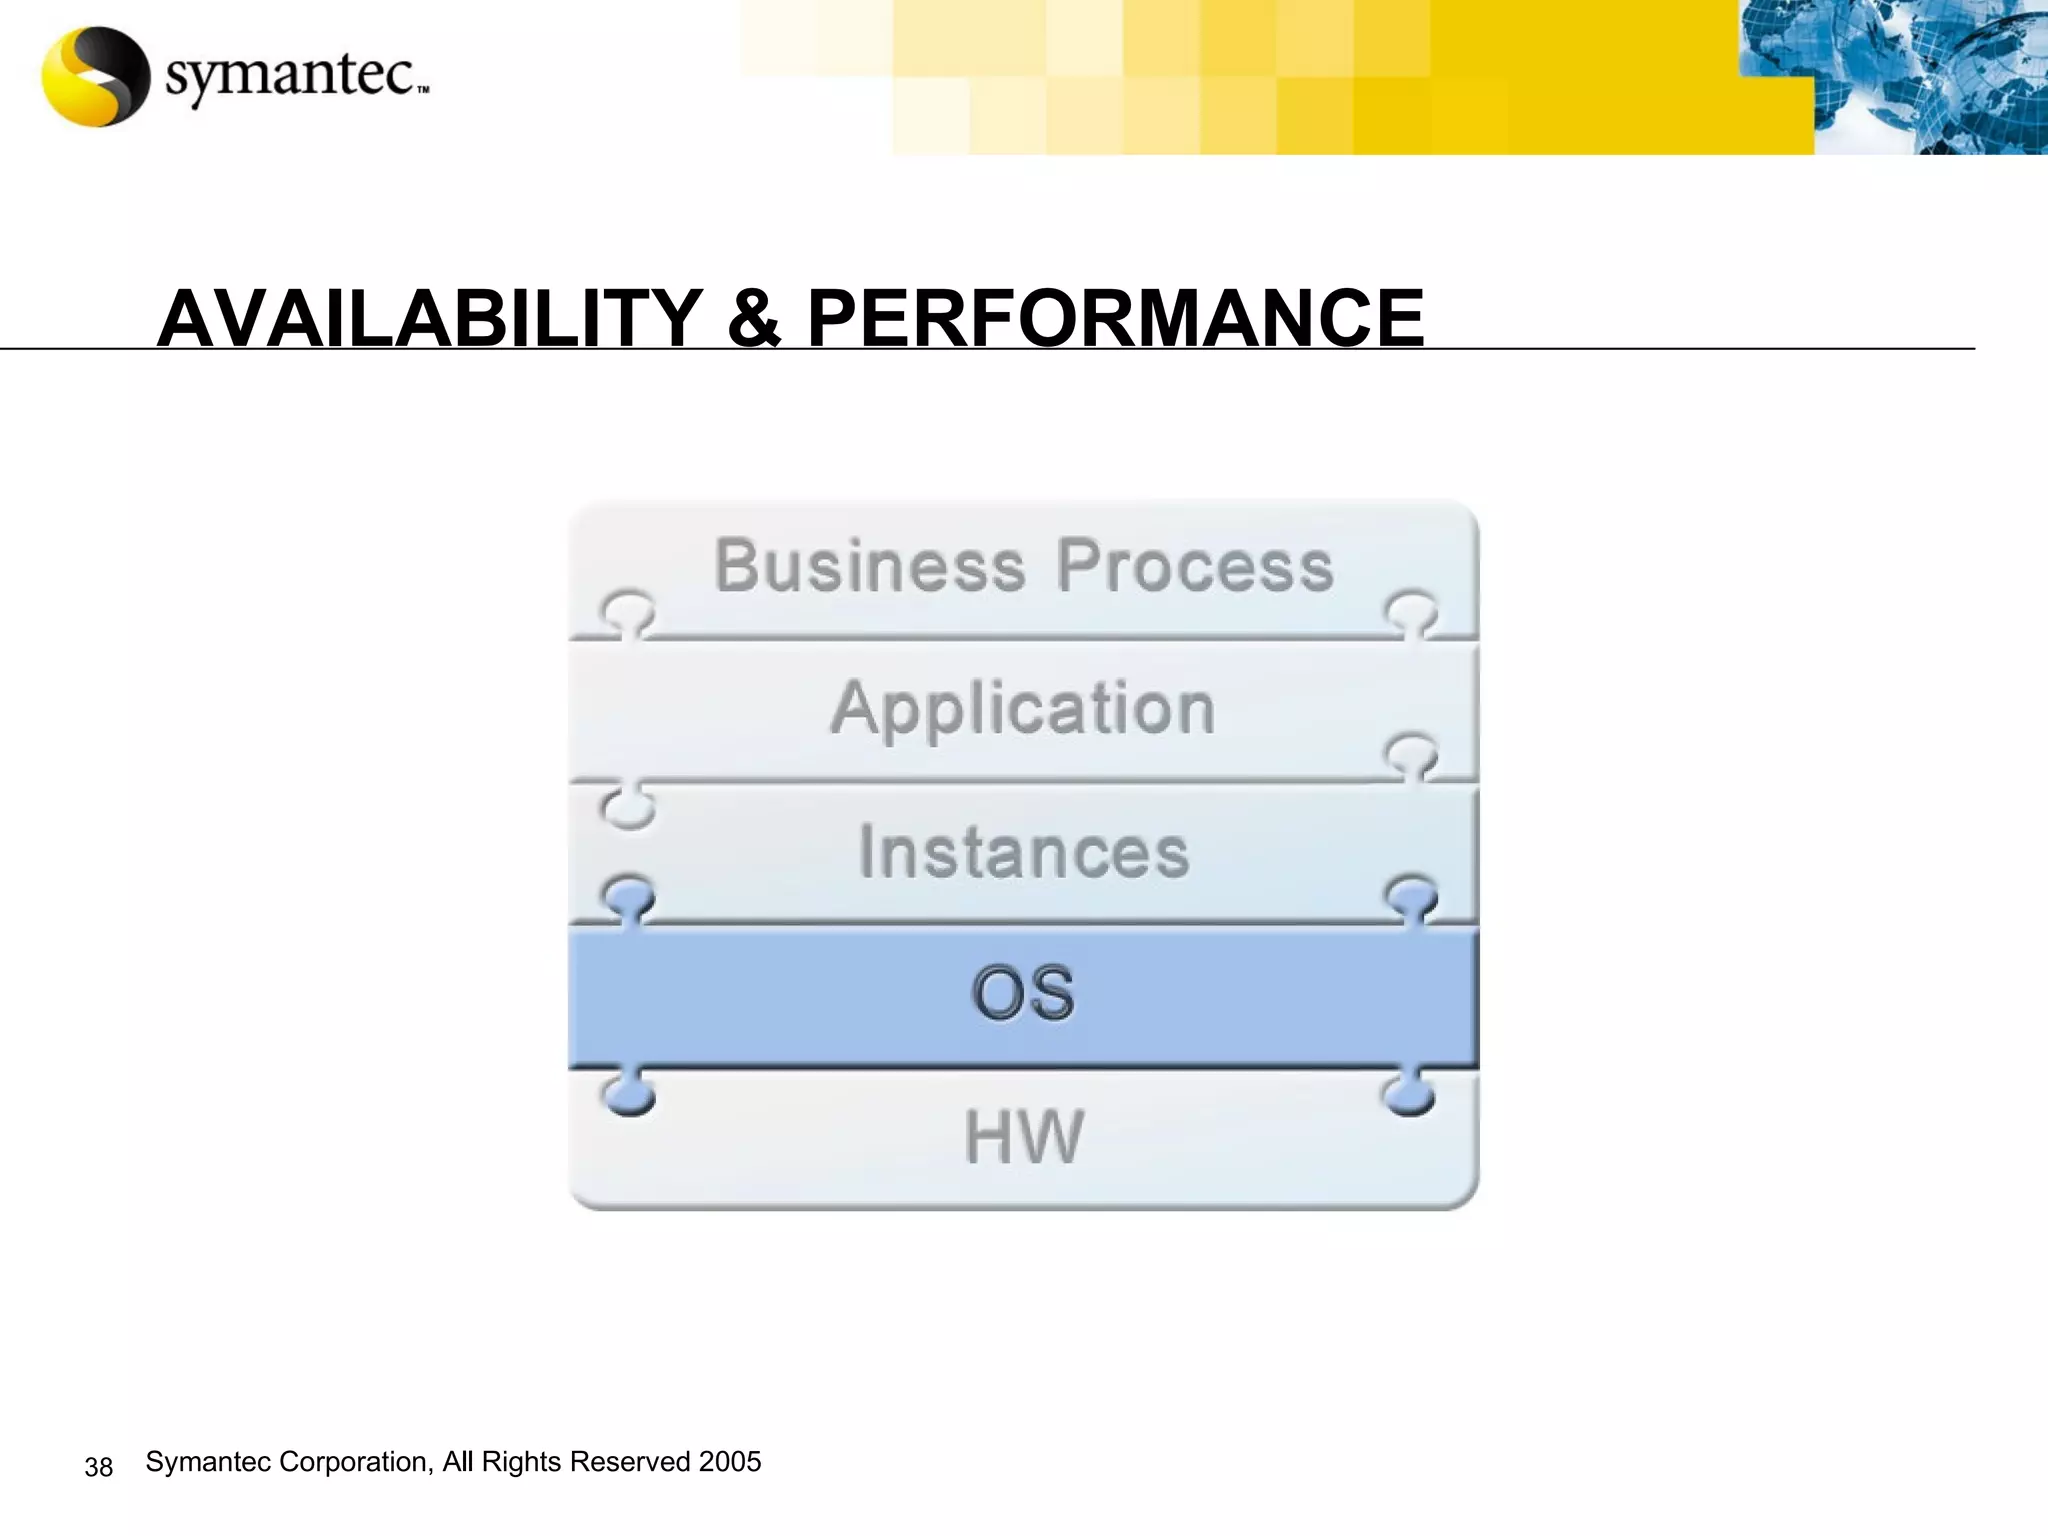
Symantec i 3 AVAILABILITY & PERFORMANCE
The Web Applications Environment Multi-tier applications that can include : Client (Web browser) Web Server J2EE Application Server Interfaces to external systems Database Worldwide, around-the-clock user access Usage patterns are not controlled Management requires the expertise of multiple IT teams
Architecture Web Clients Web Clients Web Servers J2EE Server Oracle Databases Legacy System External System
Symantec i 3 Symantec i 3  is an  integrated  solution that is end-user focused .  Symantec i 3  provides a built-in  methodology   that enables you to effectively manage the  Availability  and  Performance of business applications.
Why an Integrated Solution? With a multi-tier architecture, IT must: Align IT to business priorities Monitor the availability and performance of “business processes” Monitor “business processes” 24x7  from multiple geographies Constantly update the “business processes” by adjusting to real usage patterns initiated by real users Easily & rapidly detect problems, & analyze in context  Correlate application flow activities among technologies Pinpoint & analyze their causes Implement proactive tuning of your performance and availability
AVAILABILITY & PERFORMANCE
Case Study Enterprise web application running on a 4-tier architecture International flower ordering service The system is critical to sales & support activities The worldwide data center is located in NY The central orders database is updated at 10:00pm NY time Sales peak around local holidays, e.g. Mother’s Day on May 9 in Italy & USA


Status Conclusions – symptoms detected  A problem was identified in the  check_my_order  business transaction from USA & Italy A synthetic transaction identified the problem The problem occurred after database update, at  10:05pm NY time (4:05am the next day in Italy) Next Steps – find the source Identify the problematic page component
 
 
Status Conclusions – source found Java class  /verify/orders/country/orders_list.jsp  is the problematic component Next Steps – focus on the reason Identify whether this problem also occurs with real transactions
AVAILABILITY & PERFORMANCE


Status Interim Conclusions – focus on the reason We have contrasted synthetic transactions vs. reality The problem only occurs with synthetic transactions, due to timing (10:05pm NY / 4:05am Italy) Real users will be affected once the next day starts -  Mother’s Day in Italy, USA & some other countries Next Steps Investigate server side to pinpoint the problematic tier
 
 
Status Interim Conclusions – focus on the reason The J2EE tier is dominating resource consumption The problematic method is  verify_orders_country_orders_list._jspService Next Steps Further investigation is needed in the J2EE tier
AVAILABILITY & PERFORMANCE
 
 
Status Interim Conclusions – focus on the reason Smartune ranked JDBC Access Major Time as the main problem Next Steps Seek more details and advice
 
 
Status Conclusions  The problem is not the database tier, but how frequently the database is accessed Due to the unusually high number of db queries, time spent in the JSP is too long Italy and USA behavior differs from other countries’ due to the Mother’s Day high increase in orders   Next Steps – address the problem & verify the solution Instead of querying each order item individually, a new single query that returns all items should be implemented
 
Case Study Summary We have successfully completed the methodology cycle:   Detect An SLA breach problem was detected by a synthetic transaction in Italy and USA, before the problem was experienced by real users Find A specific JSP is responsible for the slow response time, but only in specific countries Focus   The unusually long order list in Italy & USA caused an exceptional number of connections, resulting in lengthy JDBC access time Improve Restructure queries and results pages Verify The SLA problem has disappeared without affecting real users
Synthetic Transactions Versus Reality Synthetic transactions indicate availability They should systematically reflect a dynamic real-world situation Identify application usage changes relating to both existing and new applications Reflect new delivered functionality Reflect trends regarding usage from new locations


Synthetic Transactions Versus Reality Summary  Systematically analyzed changes in usage pattern Identified new used functionality, change in usage patterns, and heavily used locations Based on the findings, the user can now adjust the synthetic transactions to reflect the actual real-world situation
AVAILABILITY & PERFORMANCE
VCS Case Study Enterprise web application running on a 4-tier architecture  Symantec Cluster Server (VCS) is activated on two machines running Oracle Each machine switches to the other upon failure


Status Interim Conclusions Upon Oracle tier failure, VCS activated failover Next Steps Follow the Alerts advice and use the VRTS Cluster Manager to investigate further
AVAILABILITY & PERFORMANCE


Status Conclusions Oracle ran on sys1 DiskGroup-oradg failed on sys1, hence VCS switched Oracle to sys2 Despite a major problem, the application remained available But, to ensure availability over the long-term, the problematic resource must be repaired
 
Proactive & Preventive VCS Actions Implement a systematic review of resource consumption overtime to forecast utilization Identify up coming over-consumption  Establish VCS failover policies and assign system resources, accordingly


Proactive & Preventive VCS Actions Summary  Discovered peak of CPU consumption on server SrvProdD at the end of each month In the future, this increase will exceed the overall CPU capacities  Based on the findings, the user can now establish an appropriate VCS failover system
AVAILABILITY & PERFORMANCE
& ANSWERS QUESTIONS

Symantec I3 - Inquire & Cluster

  • 1.
    Symantec i 3AVAILABILITY & PERFORMANCE
  • 2.
    The Web ApplicationsEnvironment Multi-tier applications that can include : Client (Web browser) Web Server J2EE Application Server Interfaces to external systems Database Worldwide, around-the-clock user access Usage patterns are not controlled Management requires the expertise of multiple IT teams
  • 3.
    Architecture Web ClientsWeb Clients Web Servers J2EE Server Oracle Databases Legacy System External System
  • 4.
    Symantec i 3Symantec i 3 is an integrated solution that is end-user focused . Symantec i 3 provides a built-in methodology that enables you to effectively manage the Availability and Performance of business applications.
  • 5.
    Why an IntegratedSolution? With a multi-tier architecture, IT must: Align IT to business priorities Monitor the availability and performance of “business processes” Monitor “business processes” 24x7 from multiple geographies Constantly update the “business processes” by adjusting to real usage patterns initiated by real users Easily & rapidly detect problems, & analyze in context Correlate application flow activities among technologies Pinpoint & analyze their causes Implement proactive tuning of your performance and availability
  • 6.
  • 7.
  • 8.
    Case Study Enterpriseweb application running on a 4-tier architecture International flower ordering service The system is critical to sales & support activities The worldwide data center is located in NY The central orders database is updated at 10:00pm NY time Sales peak around local holidays, e.g. Mother’s Day on May 9 in Italy & USA
  • 9.
  • 10.
  • 11.
  • 12.
    Status Conclusions –symptoms detected A problem was identified in the check_my_order business transaction from USA & Italy A synthetic transaction identified the problem The problem occurred after database update, at 10:05pm NY time (4:05am the next day in Italy) Next Steps – find the source Identify the problematic page component
  • 13.
  • 14.
  • 15.
    Status Conclusions –source found Java class /verify/orders/country/orders_list.jsp is the problematic component Next Steps – focus on the reason Identify whether this problem also occurs with real transactions
  • 16.
  • 17.
  • 18.
  • 19.
  • 20.
    Status Interim Conclusions– focus on the reason We have contrasted synthetic transactions vs. reality The problem only occurs with synthetic transactions, due to timing (10:05pm NY / 4:05am Italy) Real users will be affected once the next day starts - Mother’s Day in Italy, USA & some other countries Next Steps Investigate server side to pinpoint the problematic tier
  • 21.
  • 22.
  • 23.
    Status Interim Conclusions– focus on the reason The J2EE tier is dominating resource consumption The problematic method is verify_orders_country_orders_list._jspService Next Steps Further investigation is needed in the J2EE tier
  • 24.
  • 25.
  • 26.
  • 27.
    Status Interim Conclusions– focus on the reason Smartune ranked JDBC Access Major Time as the main problem Next Steps Seek more details and advice
  • 28.
  • 29.
  • 30.
    Status Conclusions The problem is not the database tier, but how frequently the database is accessed Due to the unusually high number of db queries, time spent in the JSP is too long Italy and USA behavior differs from other countries’ due to the Mother’s Day high increase in orders Next Steps – address the problem & verify the solution Instead of querying each order item individually, a new single query that returns all items should be implemented
  • 31.
  • 32.
    Case Study SummaryWe have successfully completed the methodology cycle: Detect An SLA breach problem was detected by a synthetic transaction in Italy and USA, before the problem was experienced by real users Find A specific JSP is responsible for the slow response time, but only in specific countries Focus The unusually long order list in Italy & USA caused an exceptional number of connections, resulting in lengthy JDBC access time Improve Restructure queries and results pages Verify The SLA problem has disappeared without affecting real users
  • 33.
    Synthetic Transactions VersusReality Synthetic transactions indicate availability They should systematically reflect a dynamic real-world situation Identify application usage changes relating to both existing and new applications Reflect new delivered functionality Reflect trends regarding usage from new locations
  • 34.
  • 35.
  • 36.
  • 37.
    Synthetic Transactions VersusReality Summary Systematically analyzed changes in usage pattern Identified new used functionality, change in usage patterns, and heavily used locations Based on the findings, the user can now adjust the synthetic transactions to reflect the actual real-world situation
  • 38.
  • 39.
    VCS Case StudyEnterprise web application running on a 4-tier architecture Symantec Cluster Server (VCS) is activated on two machines running Oracle Each machine switches to the other upon failure
  • 40.
  • 41.
  • 42.
  • 43.
    Status Interim ConclusionsUpon Oracle tier failure, VCS activated failover Next Steps Follow the Alerts advice and use the VRTS Cluster Manager to investigate further
  • 44.
  • 45.
  • 46.
  • 47.
  • 48.
    Status Conclusions Oracleran on sys1 DiskGroup-oradg failed on sys1, hence VCS switched Oracle to sys2 Despite a major problem, the application remained available But, to ensure availability over the long-term, the problematic resource must be repaired
  • 49.
  • 50.
    Proactive & PreventiveVCS Actions Implement a systematic review of resource consumption overtime to forecast utilization Identify up coming over-consumption Establish VCS failover policies and assign system resources, accordingly
  • 51.
  • 52.
  • 53.
  • 54.
    Proactive & PreventiveVCS Actions Summary Discovered peak of CPU consumption on server SrvProdD at the end of each month In the future, this increase will exceed the overall CPU capacities Based on the findings, the user can now establish an appropriate VCS failover system
  • 55.
  • 56.