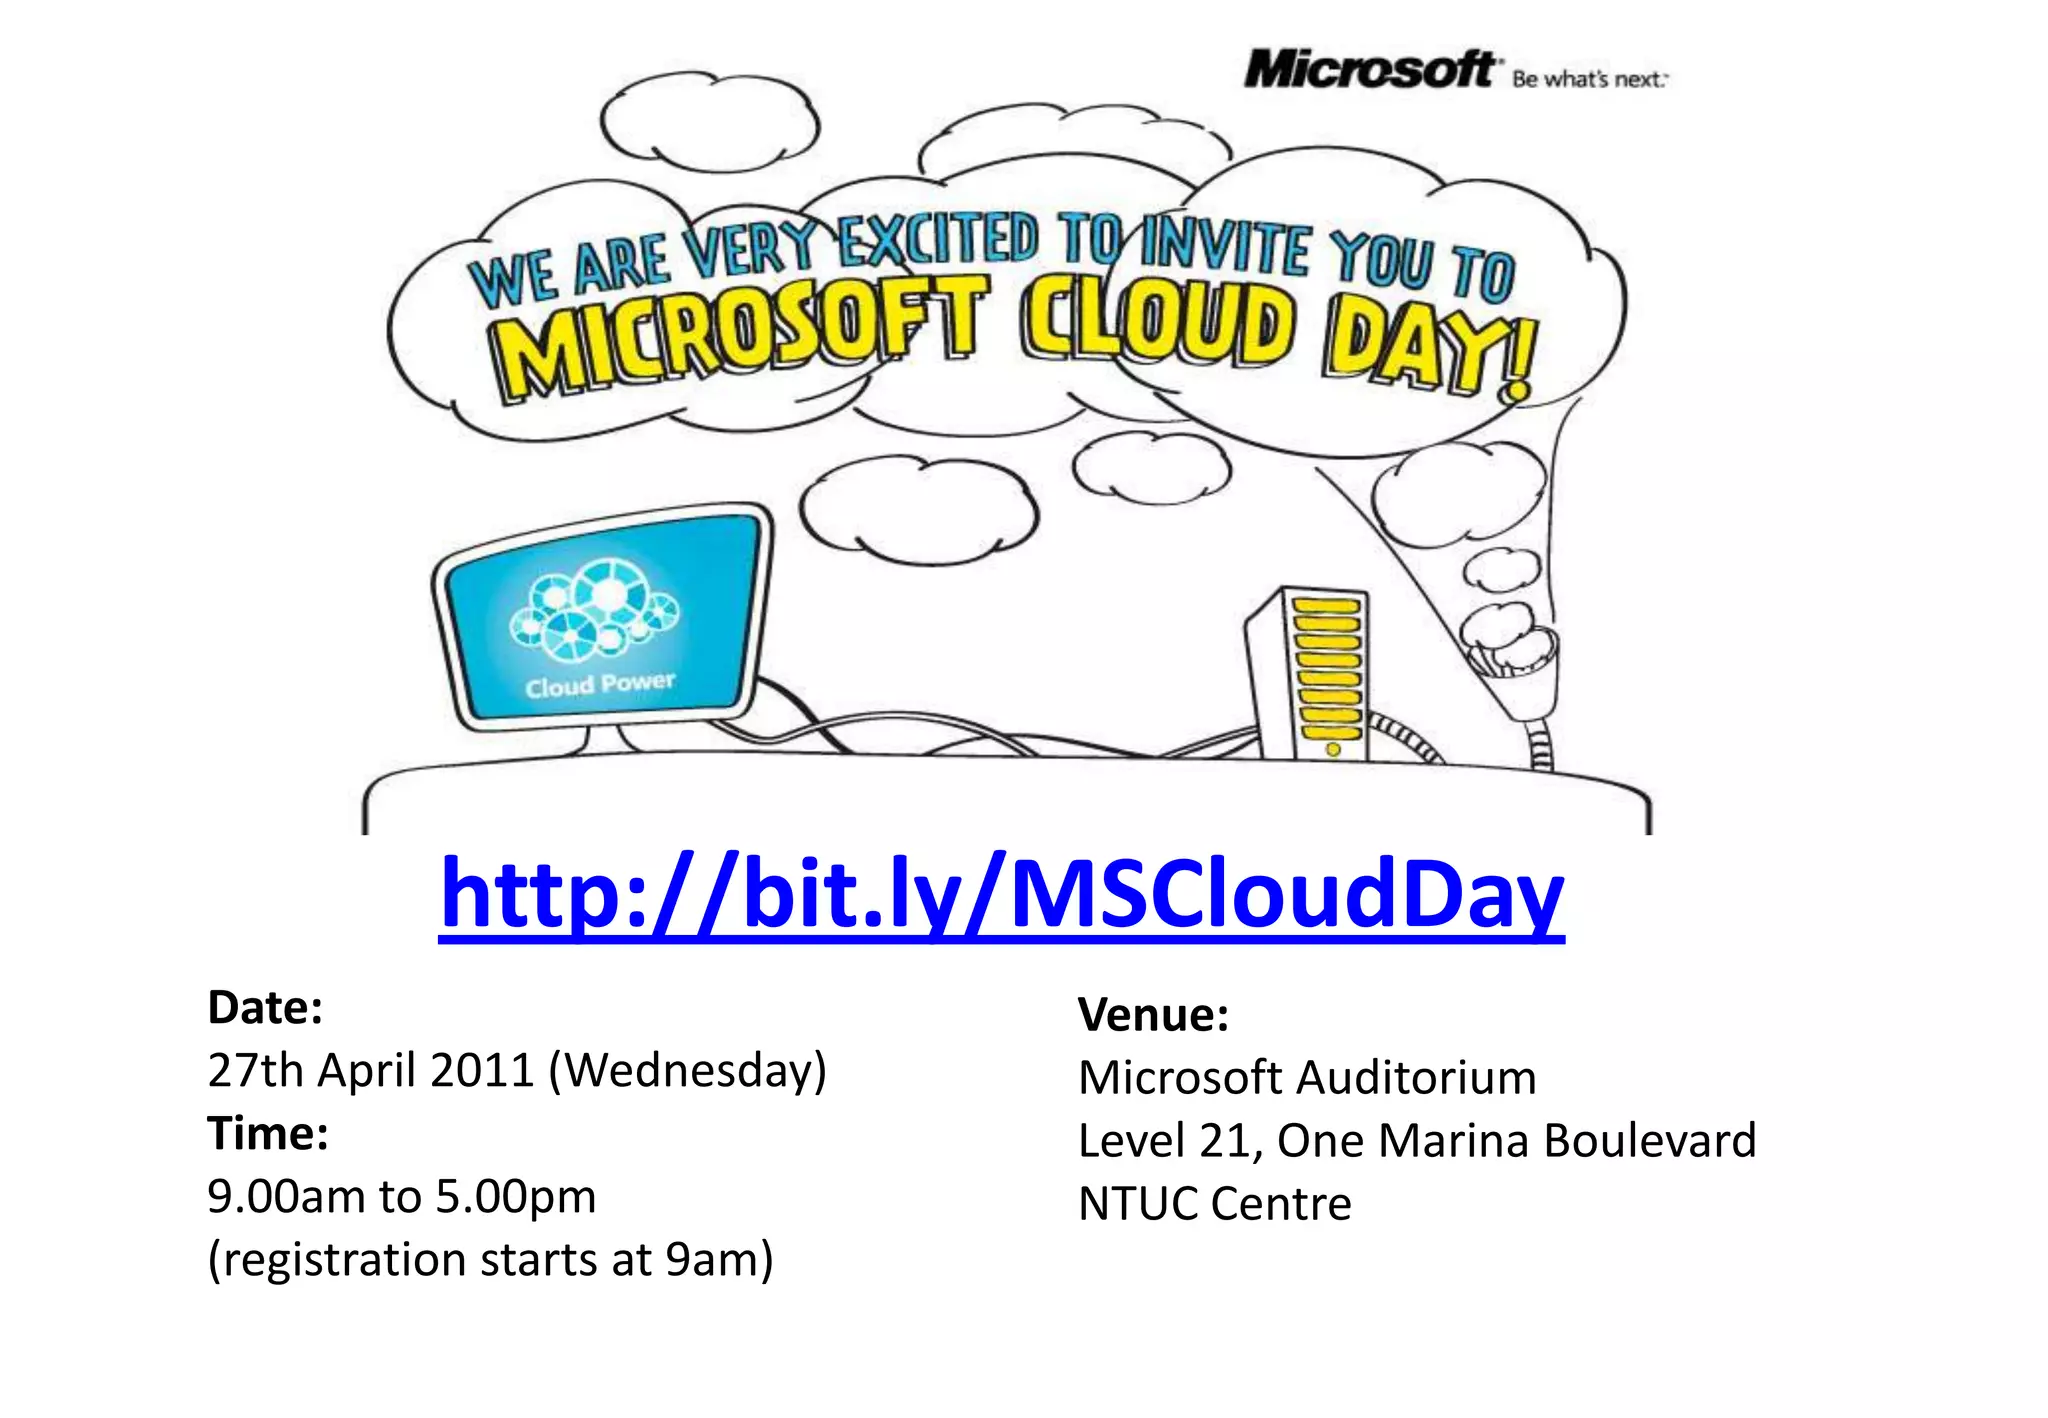
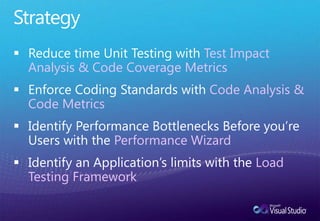
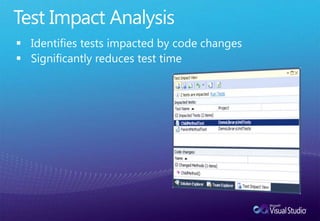
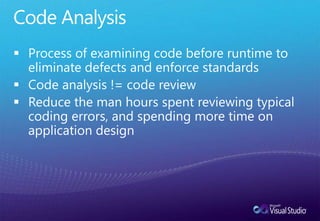
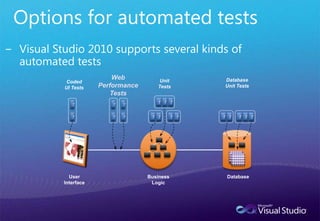
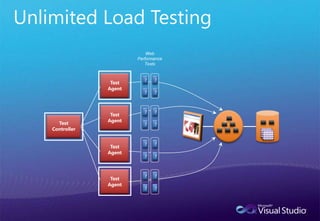
http://bit.ly/MSCloudDayDate:27th April 2011 (Wednesday)Time: 9.00am to 5.00pm(registration starts at 9am)Venue:Microsoft AuditoriumLevel 21, One Marina BoulevardNTUC Centre
13 April 2011Application Quality Best Practices with Visual Studio 2010Adrian Dunne | Microsoft Singapore(a-addun@microsoft.com)
The Cost of Sacrificing Quality$59 billion in lost productivity in the US64% of this cost is born by “End Users”Software bugs account for 55% of all downtime costsMicrosoft Confidential31 National Institute of Standards and Technology. (2002). Planning Report 02-3, The Economic Impacts of Inadequate Infrastructure for Software Testing. U.S. Department of Commerce.
StrategyReduce time Unit Testing with Test Impact Analysis & Code Coverage Metrics
Enforce Coding Standards with Code Analysis & Code Metrics
Identify Performance Bottlenecks Before you’re Users with the Performance Wizard
Identify an Application’s limits with the Load Testing FrameworkReduce time Unit Testing with Test Impact Analysis & Code Coverage MetricsMicrosoft Confidential5
Unit Test ImprovementsProgrammatically Control Unit Test Execution
Support for Categories (instead of lists)
Performance Improvements
Extensible with Custom Attributes
Can Extend Unit Test Type
Test Generation
Test Data GenerationTest Impact AnalysisIdentifies tests impacted by code changes
Significantly reduces test timeDEMOMicrosoft Confidential8Test Impact Analysis & Code Coverage
Enforce Coding Standards with Code Analysis & Code MetricsMicrosoft Confidential9
Code AnalysisProcess of examining code before runtime to eliminate defects and enforce standards
Code analysis != code review
Reduce the man hours spent reviewing typical coding errors, and spending more time on application designDogfooding
Project Health Metrics“Code metrics provide the ability to dig deep to find those un-maintainable and complex hotspots”CyclomaticComplexity
Lines of Code
Class Coupling
Depth of Inheritance
Maintainability IndexDEMOMicrosoft Confidential13Static Code Analysis & Metrics

Application Quality Best Practices with Visual Studio 2010 - Adrian Dunne

Editor's Notes

  • #3 Introduce self… Talking about code quality… It’s not secret that developers strive for code quality, its that inner perfectionist that drives us all, what makes us tick (…)
  • #4 Poor quality software costs the United States economy some $59 billion annually according to the National Institute of Standards and Technologies (2002). This money is lost through poor productivity and wasted resources, with the majority of the pain being felt not by the development team but by the end users.Of the estimated yearly loses, $38.3 billion (64%) of the cost is absorbed by the users of the softwareAnd of this cost, Software Bugs account for 55% of all downtime costsThe study concludes that one-third of this cost could be saved by improving the testing infrastructureWe do not want to stiffle innovation, without that we have nothing. What we have done… with VS2010 is put the tools you need RIGHT AT YOUR FINGERTIPS… it’s been done in a way that allows you to integrate these practices into your development lifecycle however you see fit.
  • #5 For the session we will focus on the following four steps to try and mitigate that risk early on in the development process.
  • #7 There are some minor enhancements, such as support for categories instead of test lists, performance improvements like using more than one core. Simplifying deployment that will result in improved performance as well. Unit Tests can now be extended with custom attributes (like privilege escalation attribute). The unit test type can be extended to provide custom coded tests (this is how coded UI is implemented)
  • #9 1) Code Analysis 2) Test Impact Analysis (Change Product constructor)
  • #10 Just because your unit testing was successful doesn't mean your code is error free. Use the static code analysis features of VS2010 to analyze managed assemblies.
  • #14 Tailspin.Model Project -> BuildChange to Design rules -> BuildModify (error message for none generic event handlers) and save as new ruleset and modify name directly in XMLBuild
  • #17 A profiler is a tool that monitors the execution of another application. A common language runtime (CLR) profiler is a dynamic link library (DLL) that consists of functions that receive messages from, and send messages to, the CLR by using the profiling API. The profiler DLL is loaded by the CLR at run time.Traditional profiling tools focus on measuring the execution of the application. That is, they measure the time that is spent in each function or the memory usage of the application over time. The profiling API targets a broader class of diagnostic tools such as code-coverage utilities and even advanced debugging aids. These uses are all diagnostic in nature. The profiling API not only measures but also monitors the execution of an application. For this reason, the profiling API should never be used by the application itself, and the application’s execution should not depend on (or be affected by) the profiler.Profiling a CLR application requires more support than profiling conventionally compiled machine code. This is because the CLR introduces concepts such as application domains, garbage collection, managed exception handling, just-in-time (JIT) compilation of code (converting Microsoft intermediate language, or MSIL, code into native machine code), and similar features. Conventional profiling mechanisms cannot identify or provide useful information about these features. The profiling API provides this missing information efficiently, with minimal effect on the performance of the CLR and the profiled application.JIT compilation at run time provides good opportunities for profiling. The profiling API enables a profiler to change the in-memory MSIL code stream for a routine before it is JIT-compiled. In this manner, the profiler can dynamically add instrumentation code to particular routines that need deeper investigation. Although this approach is possible in conventional scenarios, it is much easier to implement for the CLR by using the profiling API.
  • #19 Run basic profiling session (Instrumentation!!)Save ReportAdd some bogus sleeping code to HomeController->Show(SKU)Run basic profiling session (Instrumentation!!)Show new hot pathShow TIP
  • #20 This is one area that has had less of a focus in terms of development activities in the past, again, due to, mostly, a lack of integrated tooling. We have a large focus on testing in VS2010.One of the big impacts is load testing. Now you stress test, not only your application but also the resources your tapping into such as database servers, web servers etc. For example, you can tell VS2010 to just keep adding virtual user load onto you application until it’s completely crippled allowing you to know exactly what needs to be done before it goes into production