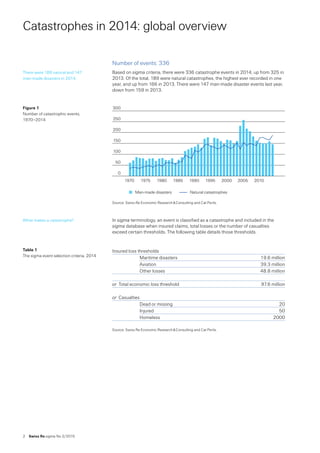
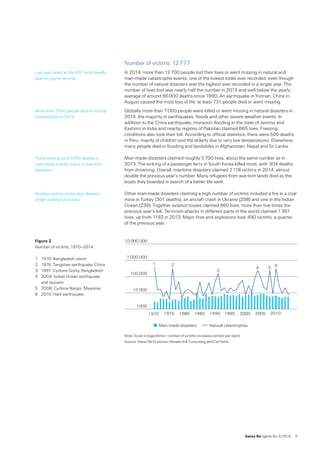
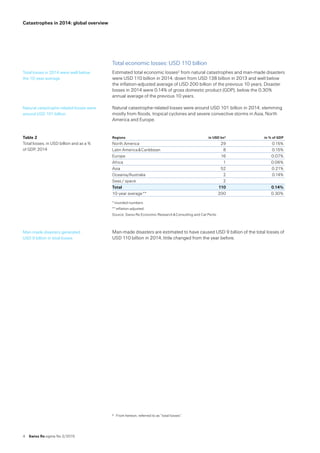
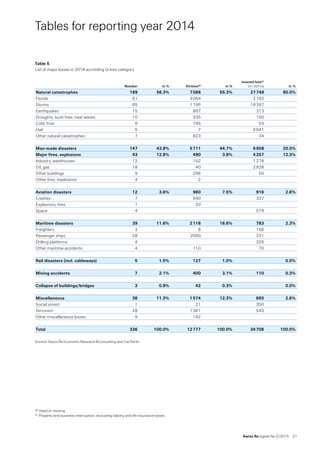
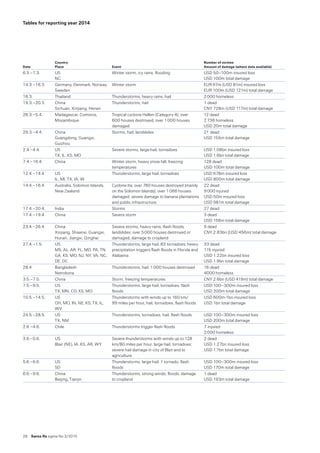
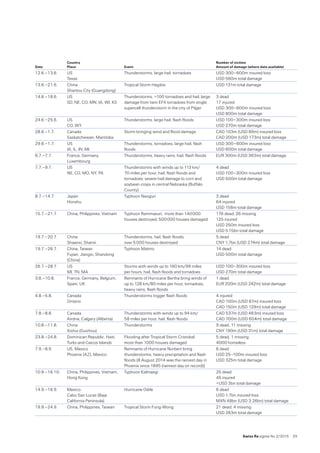
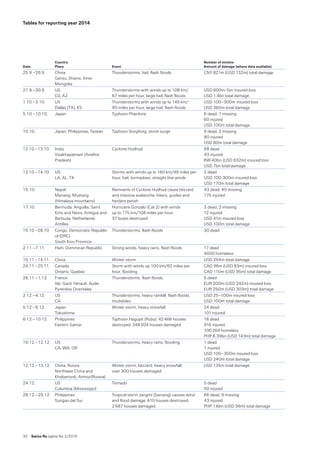
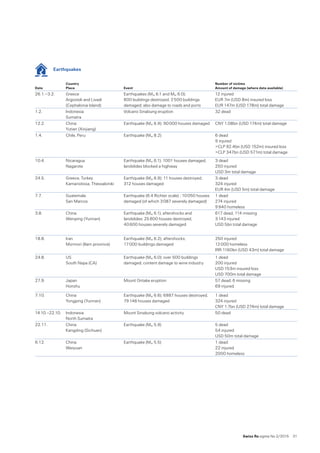
The number of victims of disaster events in 2014 was one of the lowest recorded, even though the number of natural catastrophes was the highest ever in a single year; 336 events, 189 were natural and 147 man-related.
Total economic losses generated were around USD 110 billion
Poverty Implications on Natural Disasters Occurrence in Nigeriatheijes
The International Journal of Engineering & Science is aimed at providing a platform for researchers, engineers, scientists, or educators to publish their original research results, to exchange new ideas, to disseminate information in innovative designs, engineering experiences and technological skills. It is also the Journal's objective to promote engineering and technology education. All papers submitted to the Journal will be blind peer-reviewed. Only original articles will be published.
The papers for publication in The International Journal of Engineering& Science are selected through rigorous peer reviews to ensure originality, timeliness, relevance, and readability.
This document provides information on preparing for floods. It discusses finding information about flood risks from meteorological services and emergency alerts. Specific steps for preparation are outlined, including being aware of local risks, learning from past flood events in the area, and using a four-step model of identifying risks, assessing risks, assessing needed preparations, and making a plan. The importance of starting preparations when warnings are issued is also highlighted.
The document discusses floods, including what they are, their causes, types, and risks. It defines a flood as the temporary covering of normally dry land with water. Floods are categorized based on their source (such as rivers, rain, or coastal flooding), speed of onset, and geographical scope. Areas at high risk of flooding include coastlines, waterways, low-lying terrain, and urban centers. The document outlines signs that a flood may occur like heavy rain, high winds, or rising water levels.
The document summarizes tornado damage and fatalities in the United States in 2011. 2011 was the deadliest year on record with 552 fatalities, mostly from two tornado outbreaks in April and May. It was also the most expensive year, with over $20 billion in normalized damage. Extreme weather, including a high number of long-track strong and violent tornadoes, contributed significantly to the record-breaking damage and loss of life in 2011. Improved construction techniques and early warning systems may help reduce casualties and losses in future severe outbreaks.
This document is the 2019 Global Risks Report published by the World Economic Forum. It identifies the top global risks by likelihood and impact based on a survey of experts. The top risks in terms of likelihood are extreme weather events, natural disasters, and failure of climate change mitigation. The top risks in terms of impact are extreme weather events, natural disasters, and failure of climate change mitigation. The report also examines how global risks are interconnected and how they have evolved over time from 2009 to 2019. It provides perspectives on emerging technology and environmental risks.
The document provides an emergency management plan for the Volusia County Public Library in Daytona Beach, Florida. It identifies four main hazards: fire, hurricane/flooding, pandemic, and active shooter. For each hazard, it outlines mitigation, preparedness, response, and recovery strategies. Key recommendations include installing sprinkler systems and fire extinguishers, conducting monthly fire drills, developing evacuation plans, and coordinating with local emergency services. The plan aims to minimize risks and damage from potential emergencies through preparedness and coordinated response.
GTSC's National Preparedness Month Symposium
Keynote: FEMA’s Preparedness: A Leading, Agile, Focused Agency
Presenter: David J. Kaufman, Associate Administrator, Policy, Program Analysis, and International Affairs, U.S. Department of Homeland Security/FEMA
Description: FEMA’s Office of Policy & Program Analysis is tasked with shaping FEMA and strengthening its ability to fulfill its mission by becoming a more agile, results oriented organization. This keynote will describe the efforts to achieve that vision and how the Office is working to strengthen public private partnerships to incorporate best practices from the lessons learned from previous disasters.
This document provides guidance on responding to floods. It discusses preparing for flood warnings by covering doors and clearing drains. During a flood, authorities will coordinate emergency responses, evacuate areas, and close roads if needed. Emergency services will try to divert or pump floodwater, rescue people, provide shelter, and keep people informed. The document emphasizes calling emergency services by dialing 999 if there is an emergency, clearly explaining the location and situation, and following operators' instructions.
Events are full of potential challenges and hazards for event participants, staff members, vendors and volunteers. It is the responsibility of the planner to thoroughly evaluate an event to foresee where these pitfalls may lie and develop strategies to implement on-site, should those challenges occur.
This document discusses the limitations of solely relying on the Saffir-Simpson Hurricane Wind Scale (SSHWS) category to determine a storm's potential impacts. While the SSHWS provides wind speed estimates, it does not account for other hazards like storm surge, rainfall, tornadoes, or storm size. Case studies of storms like Hurricanes Isaac, Sandy, and Ike demonstrate how low-category storms can still cause catastrophic flooding and damage depending on other factors. The document recommends considering detailed forecasts of each hazard in National Weather Service statements. It also discusses tools like tropical cyclone impact graphics and storm surge warnings that aim to better convey overall risk to the public.
Presentation on Greece crisis which was the most discussing topic for last 2 years. It's a message for other Government. When Greece Government was unable to decide, that they should left the EURO Group or not and then common people had decided that. It also shows that from where its all started. Hope you will like it.
This document discusses integrated emergency response from a global perspective. It summarizes that from 2001-2010, on average, there were 707 disasters annually that affected 268 million people and caused $107.2 billion in damage. Most deaths and those affected were due to natural disasters like floods and drought. The document outlines the various organizations that provide emergency response, including medical, military, and humanitarian aid groups. It also discusses challenges like the interaction of risks, cascading effects, and myths around disasters.
This document is the 11th edition of the Global Risks Report published by the World Economic Forum. It contains information on global risks identified through a survey, along with figures displaying the perceived likelihood and interconnectedness of various economic, geopolitical, environmental, societal and technological risks. The report is published for the World Economic Forum's Global Competitiveness and Risks Team and was obtained from sources believed to be reliable, though not independently verified.
As in previous years, the Report is based on the annual Global Risks Perception Survey, completed by almost 750 members of the World Economic Forum’s global multistakeholder community. In addition to the special section exploring the evolving security landscape in an era of uncertainty, the Report presents deep-dive discussions of risks to the stability of societies posed by the (dis)empowered citizen, who is empowered by technology but feels disempowered by traditional decision-making processes.
The document is the 11th edition of the Global Risks Report published by the World Economic Forum. It contains information on risks assessed in the Global Risks Perception Survey 2015, including descriptions of global risks, rankings of risks by likelihood and impact, and visualizations of the risks landscape and interconnections between risks. The report and additional interactive data are available on the WEF website.
Impact of Climate Change in Turkey on U.S. National SecurityBrett Champlin
Completed a thirty-page research paper including in depth analysis of how climate change could impact United States foreign policy and national security issues in the Middle East
Conducted research on the implications of a devastating earthquake or water shortage in Turkey on the ability of the United States to have a strategic base of operations in the United States
Presented research in a fifteen-slide PowerPoint to twenty students and five staff in the National Security Department
IJEOMA EZEASOR ASSESSING THE IMPACT OF THE 2012 FLOOD DISASTER ON INDUSTRIES ...ijeomaezeasor
In 2012, flooding in Anambra State, Nigeria caused significant damage to commercial and industrial areas. About 35 privately-owned manufacturing industries were submerged, with total estimated damages of 5 million naira. The flooding served as a warning that even non-coastal areas are vulnerable to floods and of the high costs of lack of disaster preparedness. Lessons included the need for households and businesses to insure against disasters, and for governments to invest more in contingency planning and disaster risk reduction strategies. With climate change bringing more variable weather, greater economic impacts from floods are expected in the future without improved mitigation strategies.
Greek Economy Greek Loan to Germany during World War Two Greek Economic reform Transparency Tax evasion in Greece Improvements in the Greek economy since the Global Financial Crisis Namibian Case Study Lagarde List of Greeks with Bank Accounts HSBC Geneva Switzerland Option B Default on Greek Debts Consequences of debt default The Troika Reform or Austerity in Greece IMF policy Merkel
The Greek debt crisis began in 2009 when it was revealed that Greece's budget deficit was much larger than originally reported, reaching 15.4% of GDP rather than the claimed 6.7%. This caused Greece's borrowing costs to skyrocket and prevented the country from repaying its debts. The crisis had severe impacts, including unemployment rising to 25%, riots over austerity measures, and Greece ultimately defaulting on IMF loans in 2015. While three bailout packages involving the EU, ECB, and IMF imposed austerity, Greece's debt-to-GDP ratio rose to over 180% as the economy shrank by 25%. The crisis demonstrated the risks of misleading deficit reporting and overspending by Greece's government.
The document provides information about a local economy-wide impact evaluation (LEWIE) being conducted by OPM to measure the impact of emergency cash transfers (CTs) provided by Phase 2 of Kenya's Hunger Safety Net Programme (HSNP2) in response to drought. HSNP2 provides regular CTs to some households and emergency CTs to additional households when drought is declared based on satellite data. The LEWIE uses an economic model to simulate the negative impacts of a typical drought on local incomes and production, and the degree to which the emergency CTs offset these impacts. Preliminary results suggest drought reduces total annual incomes by around 2% while the emergency CTs mitigate between 11-3% of these losses.
This document summarizes the key issues around climate change and disaster preparedness in the Asia-Pacific region. It notes that the number of natural disasters has increased dramatically since 1950, with 90% related to extreme weather. The poor are most vulnerable to disasters, as they suffer the greatest losses and have the lowest capacity to cope. Many countries in the Asia-Pacific lie in hazard-prone areas and experience frequent disasters like typhoons, floods, droughts, landslides, earthquakes, tsunamis and volcanoes. Disasters can severely impact development and leave lasting psychological impacts.
This document provides an overview of disaster risk in the Philippines. It begins by defining key terms like hazards, disasters, and man-made versus natural disasters. It then examines the Philippine disaster risk profile in depth, outlining major disasters from 2009 to present and their human and economic costs. These events include typhoons, earthquakes, volcanoes and conflicts. The document discusses how disasters can specifically impact health systems and cause disease, injuries, mental health issues and displacement. Overall, it presents a comprehensive look at disaster typology and the ongoing challenges faced in The Philippines.
Making Cities Safe and Resilient to disaster JIT KUMAR GUPTA
In the face of ongoing scenario of; globalization, liberalization of economies; rapid population growth; ever expanding urban footprints; rapid industrialization; global warming, rising temperature, climate change; depleting ozone layers and increasing carbon footprints, human settlements are fast becoming vulnerable and victim to natural and manmade disasters. Cities are now facing increasing threat posed by cyclones, storms, heavy precipitation, earthquakes, landslides, floods, and avalanches., putting them in perpetual danger of damage and destruction. The Sendai Framework for Disaster Risk Reduction 2015-2030, evolved by UNO, defined targets to promote safety, including; understanding disaster risk; strengthening disaster risk governance to manage disaster ; investing in disaster reduction for resilience and enhancing disaster preparedness for effective response, and to "Build Back Better" in recovery, rehabilitation and reconstruction. For making cities safe against natural and manmade risks, disasters management and mitigation should be made integral part of urban planning and development process besides carrying out analysis of the land-use planning; zoning, environment , ecology, investment; risk and vulnerability mapping; land suitability analysis defining worst-case scenarios for emergency preparedness; promoting planned development; achieving sustainability and safety; making cities spongy and resilient; empowering and involving communities , should remain the underlying and governing principles to make cities safe. Working holistically with and supporting nature; preserving, protecting and promoting flora, fauna and bio-diversity; making optimum use of Pachbhutas (Prithvi, Agni, Vayu, Jal, Akaash), and minimizing conflict between development and nature, will remain most critical for planning, designing and construction of safe and secure built environment. Nature based solutions offer the best options for promoting sustainability and safety to human settlements against natural and manmade disasters.
The document analyzes the top 20 costliest climate disasters in 2023 based on economic impact per capita. The most expensive disaster was wildfires in Hawaii/USA in August, which cost over $4,000 per person on average. The second most costly was storms in Guam in May, at almost $1,500 per capita. Many different countries were affected by floods, storms, drought and wildfires. Wealthier nations generally saw higher per capita costs while developing countries saw more total people affected.
The Learner is introduced to the following terms in this unit.
Hazard * Vulnerability *Risk * Disasters *Disaster management
* Early Warning System * Preparedness * Response * Relief
* Recovery * Mitigation & DRR * Coping & Resilience
The document discusses several global trends related to natural hazards and disasters. It notes that while the number of reported disasters has increased significantly since 1960 due to improved recording and communications, the number of people killed by disasters has fallen. However, population growth and urbanization have led to more people living in hazardous areas, increasing risks. Other trends like climate change, deforestation, and poverty are also thought to be exacerbating disaster impacts, particularly in developing regions. Overall, global trends show rising disaster occurrence but falling death tolls, suggesting improvements in disaster management, warning systems, and relief efforts. However, the total economic costs of disasters continue rising.
Over the past 50 years in Argentina, there have been 75 major flood events affecting around 13 million people and causing over $43.5 billion in damages when adjusted for inflation. Floods are the most frequent and costly natural disasters in Argentina, accounting for 58% of economic losses from natural catastrophes. While some regions like Santa Fe are consistently impacted, flash floods can occur nearly anywhere due to intense, short-term rainfall. Most Argentinians remain at risk, with under 5% of flood losses insured despite the regularity of damaging floods.
Over the past 20 years from 1995-2015:
- There were 6,457 recorded weather-related disasters according to EM-DAT that killed over 606,000 people and affected over 4.1 billion.
- Floods, storms, heatwaves and other weather events accounted for 90% of disasters and Asia experienced the most disasters and deaths.
- The number of weather disasters rose from an average of 205 per year from 1995-2004 to an average of 335 per year from 2005-2014.
- While the number of people affected declined, the average death toll rose from 26,000 per year from 1995-2004 to over 34,000 per year from 2005-2014, showing continued vulnerability to climate hazards.
Assignment Details
Open Date
Aug 6, 2018 1:00 AM
Graded?
Yes
Points Possible
100.0
Resubmissions Allowed?
No
Attachments checked for originality?
Yes
Top of Form
Assignment Instructions
Assignment 1:
Choose a kind of childhood trauma and address;
1. How common is it for children to experience this kind of trauma?
2. Are there specific effects that result from this kind of childhood trauma?
3. What kinds of behaviors do children who have undergone this kind of trauma demonstrate?
4. Many trauma interventions are developed from heartfelt concern for children and their families, but have no scientific basis. Give at least one example of an intervention that is well-meant, but not based in science, and one that has a scientific underpinning.
· Natural disasters
· Terrorism
· Illness
· Abuse
· Divorce
· Economic stress
· Military family stress, PTSD
The paper will be submitted in MS word or RTF format only. None of the questions are to be re-copied into your paper.
You will be graded on these factors:
Possible grade
Student grade
The paper addresses the issues specified by the assignment
20
The author shows insight and sophistication in thinking and writing
30
Three citations were used; websites are acceptable
20
Paper was well organized and easy to follow. Paper was at least 1000 words, not including cover page or references. Running head, cover page, abstract, paper body, in-text citations and Reference page, and overall formatting were in the American Psychological Association format.
20
Few to no spelling, grammar, punctuation or other writing structure errors
10
TOTAL
100
Submission
Bottom of Form
READING
Introduction
Topics to be covered include:
Understanding natural disasters
Dimensions of impact
Stages of disaster
Responding to disaster
Humanitarian response
Some forms of childhood trauma can be avoided, but others are unavoidable, including the trauma produced by disasters, including both technological and natural disasters. These disasters uproot lives, cause deaths and injuries, and lead to long-term challenges with infrastructure. For families with children, disaster produces loss, financial instability, and significant parental stress.
Technological and Natural Disasters
You can read more about the Deep Water oil spill at:
https://www.gpo.gov/fdsys/pkg/GPO-OILCOMMISSION/pdf/GPO-OILCOMMISSION.pdf
Children are often impacted by events that parents and families cannot control, like technological and natural disasters. These events disrupt daily life in significant ways, leaving children to manage the loss of homes, possessions, or even parents and family members, depending upon the severity of the disaster. Not all disasters can be predicted, and families may have a limited ability to respond, even when the disaster is expected. The impact of natural disasters is most substantial on fami ...
This document contains summaries of figures and maps from the World Development Report 2010. It includes 3 summaries:
1) The number of people affected by climate-related disasters is increasing, especially in lower-middle income countries where almost 8% of the population is affected each year. Flood events are also increasing, particularly in Africa.
2) Insurance is limited in the developing world, with non-life insurance premiums making up a small percentage of GDP in these regions compared to developed countries.
3) In Niger, widespread regreening efforts led by farmers using indigenous techniques has improved food security and resilience to drought across 5 million hectares, benefiting millions of people. Social learning and government policies supported spreading these
Seema Hafeez Safeguarding delivery of public services during disaster 2016SEEMA HAFEEZ
This document discusses key challenges for public service delivery during disasters and outlines an innovative framework for disaster risk management (DRM). Some key challenges discussed include the lack of a systemic DRM approach in many countries, inadequate governance mechanisms for DRM, underdeveloped information and communication technologies to support DRM, and challenges partnering for disaster reduction. The document then presents a framework for building an integrated institutional DRM approach, including governance in DRM strategies, using data and technology for mainstreaming DRM, and strengthening implementation through partnerships. The framework aims to safeguard public services during disasters and support progress toward sustainable development goals.
This document provides an overview of disaster risk and management in the Philippines. It begins with the Philippines' geographic profile as an archipelago that is prone to various natural hazards due to its location in the Pacific Ring of Fire and Pacific typhoon belt. Several major recent disasters that impacted the Philippines are described, demonstrating the country's high risk ranking. The document then discusses how factors like climate change, unplanned urbanization, and societal changes have contributed to increased disaster losses. It outlines the disaster management cycle and various approaches to disaster planning. Key components of emergency preparedness and response are identified for effective disaster risk reduction and management in the Philippines.
A presentation on natural hazards was given by group members Ahsan Jamal, Ramakant Pandey, Shripad Dongare, Sahil Nikam, and Shahrukh Shaikh. The presentation introduced natural disasters and defined them as major adverse events resulting from natural Earth processes like floods, volcanic eruptions, and earthquakes. Natural disasters were classified into meteorological, topographical, and environmental categories. The top 10 natural disasters were identified as cyclones, earthquakes, tornadoes, volcanic eruptions, tsunamis, floods, wildlife, drought, avalanches, and landslides. Causes of natural disasters included movements of the Earth, weather events, and secondary disasters like floods and
This document contains data on human and economic losses from natural disasters between 1980 and 2010. Some key details:
- Over 6.3 million people were affected on average each year
- An average of 677 people were killed each year
- Economic damage averaged $6.1 billion USD per year
It also provides specific data on affected populations and deaths from droughts, floods, and epidemics during this period. In 2012, flooding in Nigeria affected over 134,000 people and displaced 64,000, killing 148. The document discusses challenges around risk management and flooding in Nigeria.
Running head DISASTER OF PORT-AU-PRINCE1DISASTER OF PORT-A.docxsusanschei
Running head: DISASTER OF PORT-AU-PRINCE 1
DISASTER OF PORT-AU-PRINCE 2
DISASTER OF PORT-AU-PRINCE
Summary of the Event
Port-Au-Prince is the capital city of Haiti located at coordinates 18°32′N 72°20′W. Haiti is an island nation in the Caribbean. The city is located by the sea on the Gulf of Gonave, a deep natural harbor. The city is ringed with hills. The island of Haiti overlies a fault line in the earth’s crust, the Enriquillo-Plantain Garden fault system (Marley, 2005).
Haiti is a 3rd World Country and consequently, the city is a third world city. It has a population of 1,897,846 souls within its boundaries. For a country to be defined as a third world country, it must fulfill at least two of the following three conditions, first, its main source of income is mainly from agricultural or mining activities. Secondly, its education, health and infrastructure sectors must be poorly developed as indicated by high levels of mortality, low life expectancy and high illiteracy levels among the population. Thirdly the per capita income of the population should be less than $1000 per annum. Using this criterion, Port-au-Prince qualifies as a third world city. The main driver of the economy of Port-au-Prince is the export of coffee and sugar thus agriculture is the main driver of the economy of the City. Secondly, the city has only two operational hospitals, which operate at low efficiency. The city has a number of highways but they are poorly maintained and only see limited use. The infant mortality rate is 55 deaths per 1000 live births, a very high number compared to only 6 per 1000 births in other countries. The GDP per capita for the city is $851 per annum. Therefore, port au prince fulfils all three criteria and is therefore classified as a third world country (Tobin, 2013).
The natural hazards that could affect Port-au-Price include Earthquakes, Tsunamis, hurricanes, Landslides, Floods and wild fires (Wade, 2010).
On 12 January 2010 4:53 pm, a 7.0 magnitude earthquake struck Port-au-Prince and it wrecked the city. Several buildings were lost including a number of government buildings such as the legislative palace which housed parliament, the palace of Justice which housed the Supreme Court, the presidential palace, several ministerial buildings, the city’s main hospital , the sea port, and the airport. The death toll was estimated to be about 160,000 people with official government records reporting as high as 220,000 deaths. The government estimated that 250,000 residences were destroyed, 30,000 commercial buildings were brought down, and an estimated 3,000,000 people were affected as a result of the quake (ABC News, 2010).
Roles of Response Agencies
As a result of the 2010 earthquake, Port-au-Prince is in a precarious position with respect to any Natural disaster. Already, the damage that an earthquake can do to the city has already materialized. The whole city, and indeed the country was brought ...
Disaster and Disaster RIsk_Quarter 1 - MOdule 2HuggoOtters
Management this is how to protect yourself against disaster and keep the world peace and save the world without sacrificing the people and saving yourself form one anothe to another
1) The document summarizes key findings from the IPCC's Special Report on Managing the Risks of Extreme Events and Disasters to Advance Climate Change Adaptation (SREX) regarding trends and projections for various climate extremes including floods, hurricanes, tornadoes, heat waves, drought, and wildfires.
2) The SREX found low confidence in attributed changes to many extremes due to lack of historical trends, but projected increases in some extremes like heat waves and drought in some regions.
3) The document discusses examples of extreme events from history that challenge the notion that recent extremes are unprecedented, such as the deadly 1936 North American heat wave.
A disaster occurs when a hazard impacts vulnerable people and communities. Factors such as climate change, underdevelopment, and unplanned urbanization exacerbate disaster risk by increasing hazards and vulnerability. Poverty increases vulnerability as poorer countries and communities lack resources to prepare for and cope with disasters. Disaster risk is dynamic and influenced by development failures that increase exposure and vulnerability to hazards over time.
Climate Tipping Points and the Insurance SectorOpen Knowledge
Climate change won’t be a smooth transition to a warmer world, warns the Tipping Points Report by Allianz and WWF. Twelve regions around the world will be most affected by abrupt changes.
This document defines key terms related to disaster risk reduction and management such as hazard, exposure, vulnerability, capacity, and risk. It then provides examples of specific disasters that have impacted Baguio City, including earthquakes, tropical cyclones, and landslides. The document discusses the Philippines' risk profile as a disaster-prone country located in the typhoon belt and ring of fire. It emphasizes the importance of preparedness and outlines critical concerns to assess preparedness. The document also summarizes provisions of the Disaster Risk Reduction and Management Act of 2010 in the Philippines and highlights actions needed to reduce disaster risk such as establishing early warning systems and integrating disaster risk reduction into land use planning.
Underinsurance of property risks1 is a global challenge. Much of the protection gap is due to uninsured global natural catastrophe risk, which has been rising steadily over the past 40 years
Supply chain, a risk management survey results and analysisSimone Luca Giargia
This document provides a summary of a report on managing risk in the global supply chain. It finds that while supply chain risk is a major issue, many companies do little to formally manage it. Key findings include that no companies surveyed use outside expertise to assess risk, 90% do not quantify risk when outsourcing production, and only 25% of supply chains are assessed for risk. It also finds that while insurance can help mitigate risk, it is not a major consideration for most supply chain executives. The report provides recommendations for developing a three-step process to better identify, prioritize and mitigate supply chain risks.
The main challenge for risk managers currently is how to prepare companies for an increasingly threatening world in which Terrorism and political violence are real and changing threats.
The document analyzes trends in cybersecurity discussions and research in 2014. Key findings include:
1) Malware and data breaches were heavily discussed topics. Mobile malware and Android threats in particular saw increased attention.
2) Security experts' views tended to focus more on negative terms like "targeted attacks" and "exploit kits" compared to the general public.
3) High-profile breaches like Target garnered more initial interest than similar later events, indicating discussion fatigue with repeated security incidents.
Aon’s 2015 Global Risk Management Survey is designed to offer organizations the insights necessary to compete in
this increasingly complex operating environment
2° edizione dell’Osservatorio Politecnico di Milano-Cineas, in collaborazione con Confapi Industria, sul Risk Management nelle PMI italiane e realizzato da RiskGovernance del Dipartimento di Ingegneria Gestionale del Politecnico di Milano
As in previous years, the report is based on the annual Global Risks Perception Survey, completed by almost 900
members of the World Economic Forum’s global multistakeholder community. This year’s report introduces a new distinction between risks and trends, which allows the highlighting of trends as an enlarged solution space to many possible risks.
The results of this year’s Internal Audit Capabilities and Needs Survey show that, not surprisingly, cybersecurity represents a major focus for internal audit programs, but it is far from the only pressing issue on internal audit’s plate
This document provides an overview and analysis of the Global Risks Report, which identifies and assesses global risks. It discusses the report's methodology over its 9 editions, including defining risks, identifying them, mapping them based on impact and likelihood, and emphasizing their interconnectivity. The document reflects on ensuring the report remains relevant by improving its approach based on past insights. It also examines challenges like distinguishing risks from trends, determining the level of detail, and the need for a multistakeholder approach. The conclusion emphasizes themes like trust, long-term thinking, collaboration, and global governance in addressing global risks.
This document provides an overview of systemic risks and how they could interplay in the coming decade. It discusses how growing complexities and interdependencies between global systems like finance, supply chains, health, and the environment are increasing systemic risk. It then explores three potential threats: emerging market uncertainties as countries face economic and political challenges; the proliferation of interstate conflicts and frictions as countries prioritize domestic concerns; and slow progress on global challenges due to a lack of international cooperation. It concludes by discussing implications for systemically important sectors like energy, financial services, and healthcare.
This report from the World Economic Forum summarizes the findings of the Global Risks 2014 report, which examines interconnected global risks that could have systemic impacts. The Global Risks 2014 report is based on a survey of over 700 World Economic Forum members on their perceptions of 31 global risks. It finds that the top concerns are fiscal crises, unemployment, and water crises. It maps these risks according to their likelihood and potential impact, as well as the interconnections between them. The report then explores in depth three areas of interconnected global risks: changes in the geopolitical order, high youth unemployment and its social impacts, and potential challenges to cybersecurity and trust in digital systems.
Falcon stands out as a top-tier P2P Invoice Discounting platform in India, bridging esteemed blue-chip companies and eager investors. Our goal is to transform the investment landscape in India by establishing a comprehensive destination for borrowers and investors with diverse profiles and needs, all while minimizing risk. What sets Falcon apart is the elimination of intermediaries such as commercial banks and depository institutions, allowing investors to enjoy higher yields.
Discover the Future of Dogecoin with Our Comprehensive Guidance36 Crypto
Learn in-depth about Dogecoin's trajectory and stay informed with 36crypto's essential and up-to-date information about the crypto space.
Our presentation delves into Dogecoin's potential future, exploring whether it's destined to skyrocket to the moon or face a downward spiral. In addition, it highlights invaluable insights. Don't miss out on this opportunity to enhance your crypto understanding!
https://36crypto.com/the-future-of-dogecoin-how-high-can-this-cryptocurrency-reach/
Confirmation of Payee (CoP) is a vital security measure adopted by financial institutions and payment service providers. Its core purpose is to confirm that the recipient’s name matches the information provided by the sender during a banking transaction, ensuring that funds are transferred to the correct payment account.
Confirmation of Payee was built to tackle the increasing numbers of APP Fraud and in the landscape of UK banking, the spectre of APP fraud looms large. In 2022, over £1.2 billion was stolen by fraudsters through authorised and unauthorised fraud, equivalent to more than £2,300 every minute. This statistic emphasises the urgent need for robust security measures like CoP. While over £1.2 billion was stolen through fraud in 2022, there was an eight per cent reduction compared to 2021 which highlights the positive outcomes obtained from the implementation of Confirmation of Payee. The number of fraud cases across the UK also decreased by four per cent to nearly three million cases during the same period; latest statistics from UK Finance.
In essence, Confirmation of Payee plays a pivotal role in digital banking, guaranteeing the flawless execution of banking transactions. It stands as a guardian against fraud and misallocation, demonstrating the commitment of financial institutions to safeguard their clients’ assets. The next time you engage in a banking transaction, remember the invaluable role of CoP in ensuring the security of your financial interests.
For more details, you can visit https://technoxander.com.
In a tight labour market, job-seekers gain bargaining power and leverage it into greater job quality—at least, that’s the conventional wisdom.
Michael, LMIC Economist, presented findings that reveal a weakened relationship between labour market tightness and job quality indicators following the pandemic. Labour market tightness coincided with growth in real wages for only a portion of workers: those in low-wage jobs requiring little education. Several factors—including labour market composition, worker and employer behaviour, and labour market practices—have contributed to the absence of worker benefits. These will be investigated further in future work.
South Dakota State University degree offer diploma Transcriptynfqplhm
办理美国SDSU毕业证书制作南达科他州立大学假文凭定制Q微168899991做SDSU留信网教留服认证海牙认证改SDSU成绩单GPA做SDSU假学位证假文凭高仿毕业证GRE代考如何申请南达科他州立大学South Dakota State University degree offer diploma Transcript
The Rise and Fall of Ponzi Schemes in America.pptxDiana Rose
Ponzi schemes, a notorious form of financial fraud, have plagued America’s investment landscape for decades. Named after Charles Ponzi, who orchestrated one of the most infamous schemes in the early 20th century, these fraudulent operations promise high returns with little or no risk, only to collapse and leave investors with significant losses. This article explores the nature of Ponzi schemes, notable cases in American history, their impact on victims, and measures to prevent falling prey to such scams.
Understanding Ponzi Schemes
A Ponzi scheme is an investment scam where returns are paid to earlier investors using the capital from newer investors, rather than from legitimate profit earned. The scheme relies on a constant influx of new investments to continue paying the promised returns. Eventually, when the flow of new money slows down or stops, the scheme collapses, leaving the majority of investors with substantial financial losses.
Historical Context: Charles Ponzi and His Legacy
Charles Ponzi is the namesake of this deceptive practice. In the 1920s, Ponzi promised investors in Boston a 50% return within 45 days or 100% return in 90 days through arbitrage of international reply coupons. Initially, he paid returns as promised, not from profits, but from the investments of new participants. When his scheme unraveled, it resulted in losses exceeding $20 million (equivalent to about $270 million today).
Notable American Ponzi Schemes
1. Bernie Madoff: Perhaps the most notorious Ponzi scheme in recent history, Bernie Madoff’s fraud involved $65 billion. Madoff, a well-respected figure in the financial industry, promised steady, high returns through a secretive investment strategy. His scheme lasted for decades before collapsing in 2008, devastating thousands of investors, including individuals, charities, and institutional clients.
2. Allen Stanford: Through his company, Stanford Financial Group, Allen Stanford orchestrated a $7 billion Ponzi scheme, luring investors with fraudulent certificates of deposit issued by his offshore bank. Stanford promised high returns and lavish lifestyle benefits to his investors, which ultimately led to a 110-year prison sentence for the financier in 2012.
3. Tom Petters: In a scheme that lasted more than a decade, Tom Petters ran a $3.65 billion Ponzi scheme, using his company, Petters Group Worldwide. He claimed to buy and sell consumer electronics, but in reality, he used new investments to pay off old debts and fund his extravagant lifestyle. Petters was convicted in 2009 and sentenced to 50 years in prison.
4. Eric Dalius and Saivian: Eric Dalius, a prominent figure behind Saivian, a cashback program promising high returns, is under scrutiny for allegedly orchestrating a Ponzi scheme. Saivian enticed investors with promises of up to 20% cash back on everyday purchases. However, investigations suggest that the returns were paid using new investments rather than legitimate profits. The collapse of Saivian l
OJP data from firms like Vicinity Jobs have emerged as a complement to traditional sources of labour demand data, such as the Job Vacancy and Wages Survey (JVWS). Ibrahim Abuallail, PhD Candidate, University of Ottawa, presented research relating to bias in OJPs and a proposed approach to effectively adjust OJP data to complement existing official data (such as from the JVWS) and improve the measurement of labour demand.
Abhay Bhutada, the Managing Director of Poonawalla Fincorp Limited, is an accomplished leader with over 15 years of experience in commercial and retail lending. A Qualified Chartered Accountant, he has been pivotal in leveraging technology to enhance financial services. Starting his career at Bank of India, he later founded TAB Capital Limited and co-founded Poonawalla Finance Private Limited, emphasizing digital lending. Under his leadership, Poonawalla Fincorp achieved a 'AAA' credit rating, integrating acquisitions and emphasizing corporate governance. Actively involved in industry forums and CSR initiatives, Abhay has been recognized with awards like "Young Entrepreneur of India 2017" and "40 under 40 Most Influential Leader for 2020-21." Personally, he values mindfulness, enjoys gardening, yoga, and sees every day as an opportunity for growth and improvement.
Dr. Alyce Su Cover Story - China's Investment Leadermsthrill
In World Expo 2010 Shanghai – the most visited Expo in the World History
https://www.britannica.com/event/Expo-Shanghai-2010
China’s official organizer of the Expo, CCPIT (China Council for the Promotion of International Trade https://en.ccpit.org/) has chosen Dr. Alyce Su as the Cover Person with Cover Story, in the Expo’s official magazine distributed throughout the Expo, showcasing China’s New Generation of Leaders to the World.
New Visa Rules for Tourists and Students in Thailand | Amit Kakkar Easy VisaAmit Kakkar
Discover essential details about Thailand's recent visa policy changes, tailored for tourists and students. Amit Kakkar Easy Visa provides a comprehensive overview of new requirements, application processes, and tips to ensure a smooth transition for all travelers.
"Does Foreign Direct Investment Negatively Affect Preservation of Culture in the Global South? Case Studies in Thailand and Cambodia."
Do elements of globalization, such as Foreign Direct Investment (FDI), negatively affect the ability of countries in the Global South to preserve their culture? This research aims to answer this question by employing a cross-sectional comparative case study analysis utilizing methods of difference. Thailand and Cambodia are compared as they are in the same region and have a similar culture. The metric of difference between Thailand and Cambodia is their ability to preserve their culture. This ability is operationalized by their respective attitudes towards FDI; Thailand imposes stringent regulations and limitations on FDI while Cambodia does not hesitate to accept most FDI and imposes fewer limitations. The evidence from this study suggests that FDI from globally influential countries with high gross domestic products (GDPs) (e.g. China, U.S.) challenges the ability of countries with lower GDPs (e.g. Cambodia) to protect their culture. Furthermore, the ability, or lack thereof, of the receiving countries to protect their culture is amplified by the existence and implementation of restrictive FDI policies imposed by their governments.
My study abroad in Bali, Indonesia, inspired this research topic as I noticed how globalization is changing the culture of its people. I learned their language and way of life which helped me understand the beauty and importance of cultural preservation. I believe we could all benefit from learning new perspectives as they could help us ideate solutions to contemporary issues and empathize with others.
13 Jun 24 ILC Retirement Income Summit - slides.pptxILC- UK
ILC's Retirement Income Summit was hosted by M&G and supported by Canada Life. The event brought together key policymakers, influencers and experts to help identify policy priorities for the next Government and ensure more of us have access to a decent income in retirement.
Contributors included:
Jo Blanden, Professor in Economics, University of Surrey
Clive Bolton, CEO, Life Insurance M&G Plc
Jim Boyd, CEO, Equity Release Council
Molly Broome, Economist, Resolution Foundation
Nida Broughton, Co-Director of Economic Policy, Behavioural Insights Team
Jonathan Cribb, Associate Director and Head of Retirement, Savings, and Ageing, Institute for Fiscal Studies
Joanna Elson CBE, Chief Executive Officer, Independent Age
Tom Evans, Managing Director of Retirement, Canada Life
Steve Groves, Chair, Key Retirement Group
Tish Hanifan, Founder and Joint Chair of the Society of Later life Advisers
Sue Lewis, ILC Trustee
Siobhan Lough, Senior Consultant, Hymans Robertson
Mick McAteer, Co-Director, The Financial Inclusion Centre
Stuart McDonald MBE, Head of Longevity and Democratic Insights, LCP
Anusha Mittal, Managing Director, Individual Life and Pensions, M&G Life
Shelley Morris, Senior Project Manager, Living Pension, Living Wage Foundation
Sarah O'Grady, Journalist
Will Sherlock, Head of External Relations, M&G Plc
Daniela Silcock, Head of Policy Research, Pensions Policy Institute
David Sinclair, Chief Executive, ILC
Jordi Skilbeck, Senior Policy Advisor, Pensions and Lifetime Savings Association
Rt Hon Sir Stephen Timms, former Chair, Work & Pensions Committee
Nigel Waterson, ILC Trustee
Jackie Wells, Strategy and Policy Consultant, ILC Strategic Advisory Board
Fabular Frames and the Four Ratio ProblemMajid Iqbal
Digital, interactive art showing the struggle of a society in providing for its present population while also saving planetary resources for future generations. Spread across several frames, the art is actually the rendering of real and speculative data. The stereographic projections change shape in response to prompts and provocations. Visitors interact with the model through speculative statements about how to increase savings across communities, regions, ecosystems and environments. Their fabulations combined with random noise, i.e. factors beyond control, have a dramatic effect on the societal transition. Things get better. Things get worse. The aim is to give visitors a new grasp and feel of the ongoing struggles in democracies around the world.
Stunning art in the small multiples format brings out the spatiotemporal nature of societal transitions, against backdrop issues such as energy, housing, waste, farmland and forest. In each frame we see hopeful and frightful interplays between spending and saving. Problems emerge when one of the two parts of the existential anaglyph rapidly shrinks like Arctic ice, as factors cross thresholds. Ecological wealth and intergenerational equity areFour at stake. Not enough spending could mean economic stress, social unrest and political conflict. Not enough saving and there will be climate breakdown and ‘bankruptcy’. So where does speculative design start and the gambling and betting end? Behind each fabular frame is a four ratio problem. Each ratio reflects the level of sacrifice and self-restraint a society is willing to accept, against promises of prosperity and freedom. Some values seem to stabilise a frame while others cause collapse. Get the ratios right and we can have it all. Get them wrong and things get more desperate.
1. No 2 /2015
Natural catastrophes and
man-made disasters in 2014:
convective and winter storms
generate most losses
1 Executive summary
2 Catastrophes in 2014:
global overview
7 Regional overview
14 Severe convective
storms: a growing
global risk
21 Tables for reporting
year 2014
43 Terms and selection
criteria
2.
3. Swiss Re sigma No 2 /2015 1
Executive summary
In 2014, there were 336 disaster events. Of these, 189 were natural catastrophes,
the highest ever recorded, and 147 were man-made disasters. More than 12 700
people lost their lives or went missing in the disasters.
The total economic losses generated by natural catastrophes and man-made
disasters in 2014 were around USD 110 billion, down from USD 138 billion in 2013
and well below the inflation-adjusted average of USD 200 billion for the previous
10 years. Asia was hardest hit, with cyclones in the Pacific creating the most losses.
Weather events in North America and Europe caused most of the remaining losses.
Insured losses were USD 35 billion, down from USD 44 billion in 2013 and well
below the inflation-adjusted previous 10-year average of USD 64 billion. As in recent
years, the decline was largely due to a benign hurricane season in the US. Of the
insured losses, USD 28 billion were attributed to natural catastrophes and USD 7
billion to man-made events. In the US and Europe, severe thunderstorms (also
known as severe convective storms) triggered many of the insurance claims. Harsh
winters in the US and in Japan were the other major cause of claims in 2014.
The number of victims of disaster events in 2014 was one of the lowest recorded,
even though the number of natural catastrophes was the highest ever in a single
year. Improvements in early warning systems and emergency preparedness meant
fewer victims than otherwise may have been. Progress in local prevention and
mitigation measures to strengthen resilience will be a key variable in total victim
numbers in the future, especially if climate change leads to more frequent natural
catastrophe events.
Severe convective storms1 include tornadoes, hail, thunder and lightning, heavy rains
and flash floods, and pose a significant threat to modern societies. The localised
nature of the storms means they can cause considerable damage to crops, and also
to properties and vehicles when they hit densely populated areas. This sigma
includes a special chapter on severe convective storms and the trend of rising
insurance losses therefrom. Increasing exposures as a result of economic
development and the associated population expansion and urbanisation, among
other factors, suggest that losses from severe weather events may well continue on
an upward path. This calls for more sophisticated modelling techniques of the risks
posed by the different sub-perils in the severe convective storm family.
1 The criteria to classify a convective storm as “severe” is generally the threshold where damage is likely to
to occur, typically winds of 90 km/56 miles per hour and/or hail of 2 cm/1 inch in diametre or more.
There were a record 189 natural
catastrophe events in 2014.
Globally, total losses from all disaster
events were USD 110 billion in 2014,
with most in Asia.
Insured losses were USD 35 billion,
driven largely by severe thunderstorms in
the US and Europe, and harsh winter
conditions in the US and Japan.
The number of victims of disaster events
in 2014 was one of the lowest on record.
Losses from severe convective storms
have been rising, increasing the need for
more sophisticated risk modelling tools.
4. 2 Swiss Re sigma No 2 /2015
Catastrophes in 2014: global overview
Number of events: 336
Based on sigma criteria, there were 336 catastrophe events in 2014, up from 325 in
2013. Of the total, 189 were natural catastrophes, the highest ever recorded in one
year, and up from 166 in 2013. There were 147 man-made disaster events last year,
down from 159 in 2013.
Source: Swiss Re Economic Research Consulting and Cat Perils.
In sigma terminology, an event is classified as a catastrophe and included in the
sigma database when insured claims, total losses or the number of casualties
exceed certain thresholds. The following table details those thresholds.
Insured loss thresholds
Maritime disasters 19.6 million
Aviation 39.3 million
Other losses 48.8 million
or Total economic loss threshold 97.6 million
or Casualties
Dead or missing 20
Injured 50
Homeless 2000
Source: Swiss Re Economic Research Consulting and Cat Perils.
There were 189 natural and 147
man-made disasters in 2014.
Figure 1
Number of catastrophic events,
1970–2014
0
50
100
150
200
250
300
201020052000199519901985198019751970
Man-made disasters Natural catastrophes
What makes a catastrophe?
Table 1
The sigma event selection criteria, 2014
5. Swiss Re sigma No 2 /2015 3
Number of victims: 12 777
In 2014, more than 12 700 people lost their lives or went missing in natural and
man-made catastrophe events, one of the lowest totals ever recorded, even though
the number of natural disasters was the highest ever recorded in a single year. The
number of lives lost was nearly half the number in 2013 and well below the yearly
average of around 66 000 deaths since 1990. An earthquake in Yunnan, China in
August caused the most loss of life: at least 731 people died or went missing.
Globally more than 7 000 people were killed or went missing in natural disasters in
2014, the majority in earthquakes, floods and other severe weather events. In
addition to the China earthquake, monsoon flooding in the state of Jammu and
Kashmir in India and nearby regions of Pakistan claimed 665 lives. Freezing
conditions also took their toll. According to official statistics, there were 505 deaths
in Peru, mainly of children and the elderly due to very low temperatures. Elsewhere,
many people died in flooding and landslides in Afghanistan, Nepal and Sri Lanka.
Man-made disasters claimed roughly 5 700 lives, about the same number as in
2013. The sinking of a passenger ferry in South Korea killed most, with 304 deaths
from drowning. Overall, maritime disasters claimed 2 118 victims in 2014, almost
double the previous year’s number. Many refugees from war-torn lands died as the
boats they boarded in search of a better life sank.
Other man-made disasters claiming a high number of victims included a fire in a coal
mine in Turkey (301 deaths), an aircraft crash in Ukraine (298) and one in the Indian
Ocean (239). Together aviation losses claimed 960 lives, more than five times the
previous year’s toll. Terrorism attacks in different parts of the world claimed 1 361
lives, up from 1192 in 2013. Major fires and explosions took 490 victims, a quarter
of the previous year.
Note: Scale is logarithmic: number of victims increases tenfold per band.
Source: Swiss Re Economic Research Consulting and Cat Perils.
Last year ranks as the 40th most deadly
year on sigma records.
More than 7000 people died in natural
catastrophes in 2014.
There were around 5700 deaths in
man-made events, many in maritime
disasters.
Aviation and terrorism also claimed
a high number of victims.
Figure 2
Number of victims, 1970–2014
1 1970: Bangladesh storm
2 1976: Tangshan earthquake, China
3 1991: Cyclone Gorky, Bangladesh
4 2004: Indian Ocean earthquake
and tsunami
5 2008: Cyclone Nargis, Myanmar
6 2010: Haiti earthquake
Man-made disasters Natural catastrophes
1000
10 000
100 000
1 000 000
10 000 000
1970 1975 1980 1985 1990 1995 2000 2005 2010
1 2
3
4 5
6
6. 4 Swiss Re sigma No 2 /2015
Catastrophes in 2014: global overview
Total economic losses: USD 110 billion
Estimated total economic losses2 from natural catastrophes and man-made disasters
were USD 110 billion in 2014, down from USD 138 billion in 2013 and well below
the inflation-adjusted average of USD 200 billion of the previous 10 years. Disaster
losses in 2014 were 0.14% of gross domestic product (GDP), below the 0.30%
annual average of the previous 10 years.
Natural catastrophe-related losses were around USD 101 billion in 2014, stemming
mostly from floods, tropical cyclones and severe convective storms in Asia, North
America and Europe.
* rounded numbers
** inflation adjusted
Source: Swiss Re Economic Research Consulting and Cat Perils.
Man-made disasters are estimated to have caused USD 9 billion of the total losses of
USD 110 billion in 2014, little changed from the year before.
2 From hereon, referred to as “total losses”.
Total losses in 2014 were well below
the 10-year average.
Natural catastrophe-related losses were
around USD 101 billion.
Table 2
Total losses, in USD billion and as a %
of GDP, 2014
Regions in USD bn* in % of GDP
North America 29 0.15%
Latin America Caribbean 8 0.15%
Europe 16 0.07%
Africa 1 0.06%
Asia 52 0.21%
Oceania/Australia 2 0.14%
Seas / space 2
Total 110 0.14%
10-year average ** 200 0.30%
Man-made disasters generated
USD 9 billion in total losses.
7. Swiss Re sigma No 2 /2015 5
Insured losses: USD 35 billion
The insurance industry covered an estimated USD 35 billion, or one-third of the total
losses from natural and man-made disasters in 2014. Natural catastrophes resulted
in claims of USD 28 billion, the lowest since 2009 and about half the previous 10-year
inflation-adjusted average (USD 58 billion). Large man-made disasters led to claims
of USD 7 billion, down from USD 8 billion in 2013.
Relative to GDP and direct non-life premiums written (DPW), the 2014 natural
catastrophe losses were 0.04% of GDP and 1.8% of DPW, below the respective
previous 10-year annual averages of 0.08% and 3.8%.
Source: Swiss Re Economic Research Consulting and Cat Perils.
Nine disasters triggered insured claims of USD 1 billion or more in 2014 (see Table 6
on page 22). A severe convective storm with wind and hail over a five-day period in
the US in May was the single most expensive event of the year, causing an estimated
USD 2.9 billion in insured losses. The second costliest was a winter storm in Japan,
with claims of USD 2.5 billion. Hail and wind storm Ela in Europe in June led to
insured losses of USD 2.2 billion, and Hurricane Odile in Mexico in September a
further USD 1.7 billion.
Figure 4 shows the difference between insured and total losses over time. The
difference is defined as the insurance protection or funding gap. It is the amount
of financial loss generated by catastrophes not covered by insurance. In 2014, the
global protection gap was USD 75 billion. The rate of growth of total losses has
outpaced the growth of insured losses. In terms of the 10-year moving average,
insured losses grew at 10.7% between 1979 and 2014, and total losses by 11.4%.
Natural catastrophe insured losses were
below average last year …
… and equivalent to 0.04% of GDP.
Figure 3
Insured catastrophe losses,
1970–2014, in USD billion
at 2014 prices
201020052000199519901985198019751970
Man-made disastersWeather-related catastrophesEarthquake/tsunami
10-year moving average total insured losses
0
20
40
60
80
100
120
140
The largest single insured-loss event
was in US.
The global insurance protection gap was
USD 75 billion in 2014.
8. 6 Swiss Re sigma No 2 /2015
Catastrophes in 2014: global overview
Total losses = insured + uninsured losses
Source: Swiss Re Economic Research Consulting and Cat Perils.
Economic development, population growth, a higher concentration of assets in
exposed areas and a changing climate are increasing the economic cost of natural
disasters. The above, if not accompanied by a commensurate increase in insurance
penetration, will likely result in a widening protection gap over the long term.
Figure 4
Insured vs uninsured losses,
1970–2014, in USD billion
in 2014 prices
0
50
100
150
200
250
300
350
400
450
Uninsured lossesInsured losses
201020052000199519901985198019751970
10-year moving average insured losses
10-year moving average total economic losses
The protection gap can be narrowed with
greater insurance penetration.
9. Swiss Re sigma No 2 /2015 7
Regional overview
Severe thunder (or convective) storms and hard winter conditions in the US and
Europe caused the biggest insurance losses globally in 2014. In Asia, Cyclone
Hudhud and other major storms led to the highest losses in the region, while an
earthquake in China and monsoon floods in India and Pakistan took most lives.
Source: Swiss Re Economic Research Consulting and Cat Perils.
North America
In North America, insured losses were USD 17.5 billion in 2014, the highest of all
regions. Losses were primarily caused by convective activity and by a series of
winter storms in the US. Five independent events each caused insured losses of
USD 1 billion or above, all of them in the US. Canada experienced relatively few
catastrophes last year.
In mid-May, a spate of severe convective storms over a five-day period brought large
hail and strong winds across the Rockies, Midwest and Eastern states, with
Pennsylvania, Colorado and Illinois the worst hit. The storms caused USD 2.9 billion
in insured losses, the most from a single weather event in the year. Another hail
event in June also caused significant damage to property and agriculture,
particularly in Nebraska. There was also a tornado outbreak which, with the hail
storms, caused overall combined insured losses of USD 1.3 billion. Central
Nebraska’s corn and soybean crops suffered more damage in July, again because of
hail. July is the most critical growth period for these crops.
Overall the number of recorded tornadoes in the US was below average for the third
year running. The Storm Prediction Centre of the National Oceanic and Atmospheric
Administration (NOAA) tallied 888 tornadoes in 2014, well below the yearly average
of 1235 since 1990, and less than half the 1811 of the record season in 2004. Last
year’s number was also the lowest on record since the start of the Doppler radar era
in the early 1990s.
Nevertheless, with an estimated USD 13 billion in insured losses from tornado
outbreaks and thunderstorms, 2014 ranks as the fourth costliest year on sigma
record in terms of insured losses from these perils. Four of the thunderstorm events
caused losses of USD 1 billion or more, compared to three in 2013.
It was an active winter season in the US in 2014, with multiple storms bringing
heavy snowfall, icy winds and long periods of freezing temperatures. At the
beginning of January, a storm caused widespread damage in 17 states, with snow
falling as far south as Florida. The damage was estimated at USD 1.7 billion, and
came mainly from burst frozen water pipes, ice weight and water damage to houses
and businesses. Overall insured losses from winter weather damage in the US in
2014 were USD 2.4 billion, more than double the previous 10-years’ annual average.
The highest insured losses in 2014 were
in North America and Europe.
Table 3
Number of events, victims, economic
and insured losses by region, 2014
Insured losses Total loss
Region Number Victims in % in USD bn in % in USD bn in %
North America 51 206 1.6% 17.5 50.4% 28.6 26.0%
Latin America Caribbean 31 883 6.9% 2.3 6.5% 8.2 7.4%
Europe 37 763 6.0% 6.6 19.1% 15.9 14.5%
Africa 47 2506 19.6% 0.8 2.3% 1.5 1.3%
Asia 130 7093 55.5% 5.2 15.0% 51.7 47.0%
Oceania/Australia 7 206 1.6% 1.0 2.9% 2.3 2.1%
Seas / space 33 1120 8.8% 1.3 3.8% 1.7 1.5%
World 336 12 777 100.0% 34.7 100.0% 109.9 100.0%
In North America, the biggest losses
came from convective activity and winter
storms.
Tornadoes and hail in May and June
caused major damage.
The total number of tornadoes in the
US in 2014 was well below the annual
average …
… but even so, the year ranks fourth
highest in terms of tornado-induced
insurance losses.
The losses from harsh winter conditions
were above average.
10. 8 Swiss Re sigma No 2 /2015
Regional overview
In August, a slow-moving low pressure system delivered rainfall in excess of
12.7 cm/5 inches, resulting in widespread flooding in several cities across Michigan,
with the metro Detroit area worst affected. Flooding also occurred in Maryland
and Long Island, New York, as part of the same weather system. In Islip, NY, a new
24-hour rainfall record was set. The preliminary estimate for the total damage was
USD 1.6 billion, with approximately one third insured. A month later, on 8 September
Phoenix, Arizona experienced its rainiest day on record.3
The western US, however, had very little rain. California had its driest year on record
in 2014. Following two consecutive dry years, a state of emergency was declared in
January and state officials took all necessary actions to prepare for water shortages.
As of late September, the US Drought Monitor classified 58% of California as
experiencing “exceptional” drought, the worst category, with more than 80% in
“extreme” drought conditions.4
California is a major producer of fruit, vegetables, nuts and dairy products. Its
extensive system of water infrastructure and groundwater pumping helped
counteract the water shortages. Even so, agriculture suffered an estimated total loss
of USD 1.5 billion out of overall economic losses of USD 2.2 billion.5 Private insured
losses were limited by farmers’ increasing reliance on the federal insurance program
after the passage of the Federal Crop Insurance Act of 1980 and after 1995, when
the catastrophic (CAT) option became available for specialty crops such as fruits,
vegetables and tree nuts. Drought conditions still lingered in early 2015 and are
expected to continue. As groundwater depletion is likely to increase the cost of
irrigation, agriculture losses are expected to rise further.
The 2014 Atlantic hurricane season produced eight named storms (13 in 2013), six
of which became hurricanes (two in 2013). Two were major hurricanes (Category 3
or stronger on the Saffir-Simpson scale; there were none in 2013). Only Hurricane
Arthur, the first named storm of the season, made US landfall last year. It was also
the first Category 2 hurricane since Ike in 2008, according to the National Weather
Service.6 It caused power outages and limited flooding and damage. Last year was
the ninth in succession (ie, since 2005) that no major hurricane made US landfall,7
the longest stretch since the 1860s.
Overall in terms of numbers, collective strength and duration of named storms and
hurricanes, 2014 ranks as the 10th-least active Atlantic hurricane season on record
since 1950. According to the Climate Prediction Centre of the NOAA, the combination
of stable atmospheric conditions and high wind shear in the large parts of the main
hurricane generation region curbed the development of storms.
3 Record-breaking rain in Arizona, NOAA,10 September 2014, http://www.climate.gov/news-features/
event-tracker/record-breaking-rain-arizona
4 R. Heim, California, US Drought Monitor, 20 September 2014, http://droughtmonitor.unl.edu/
MapsAndData/MapArchive.aspx
5 R. Howitt, Josué Medellin-Azuara, Duncan MacEwan et al., Economic Analysis of the 2014 Drought for
California Agriculture, Center for Watershed Sciences, University of California, UC Agricultural Issues
Center and ERC Economics, 23 July 2014, p 10, https://watershed.ucdavis.edu/files/biblio/
DroughtReport_23July2014_0.pdf
6 Hurricane Arthur, National Weather Service, 3–4 July 2014, http://www.weather.gov/mhx/Arthur
7 Hurricane Sandy in 2012 produced the third-biggest loss ever from a storm event, but being rated
Category 1 on the Saffir-Simpson scale, it is not considered a “major” hurricane. The damage wreaked
was because of Sandy’s very large size, which drove a strong storm surge into the affected areas on land.
Heavy rainfall triggered severe flooding
in parts of Northeast, and Arizona had its
rainiest day on record.
However, California had its driest year
ever …
… leading to an estimated total loss of
USD 2.2 billion, mainly in agriculture.
The North Atlantic hurricane season was
very quiet in 2014.
Stable weather conditions limited the
formation of storms.
11. Swiss Re sigma No 2 /2015 9
Earthquake South Napa, measuring 6.0 on the moment-magnitude (Mw) scale8,
struck just north of San Francisco on 24 August 2014. It was the most powerful
in the San Francisco Bay Area since the 1989 Loma Prieta earthquake. The quake
caused structural damage mainly to old unreinforced masonry buildings and also
inventory damage, particularly in the numerous barrel storage facilities of the local
wine industry. The estimated insured losses of USD 0.15 billion were limited by low
insurance penetration in the region. In spite of the high exposure to seismic risk,
insurance take-up in San Francisco County and in California overall is still very low,
even for commercial properties.
In Canada, the biggest loss-inducing natural disaster was a series of thunderstorms
in Calgary, Alberta in mid-August, leading to insured losses of USD 0.46 billion. After
record losses in 2013, it was a quiet year in terms of natural catastrophes in Canada.
With respect to man-made disasters, a fire at a petrochemical plant in Texas, US
caused the biggest insured loss. Another main event was a fire at an elderly home in
Canada in January, which claimed 17 lives.
Europe
Natural catastrophes and man-made disasters caused total losses of
USD 15.9 billion in Europe in 2014. Insured losses were USD 6.6 billion. Most losses
came from convective storms and heavy precipitation in several countries.
During the third week of May, the low pressure system Yvette brought very heavy
rainfall to Serbia, Bosnia and Croatia. For some areas, it was the heaviest downpour
in 120 years. Several dams were broken and the ensuing floods and debris flows
destroyed houses, infrastructure and crops. The devastation caused total losses of
USD 3 billion, much of which was uninsured. Eighty-two people died, the largest loss
of life from a natural catastrophe event in Europe last year.
In early June, the low pressure system Ela brought severe hail storms to France and
Belgium, and strong winds in Germany. After a period of above-average temperatures,
the severe storms from northwest Europe moved south-eastwards, mixing with an
influx of warm air and creating the conditions for strong winds, thunder, rainfall and
hail. Damage was severe in parts of northern France, Belgium and north-west
Germany. More than 600 000 houses and 500 000 vehicles were damaged, and
the associated insured losses were USD 2.2 billion. Ela is the second most expensive
convective storm event in Europe on sigma records after hail storm Andreas just one
year earlier.
The risk of rising hail losses in Europe
Hail is a familiar hazard in Europe and one of the major drivers of residential, business
and agricultural property damage. Areas of significant to high hail risk include
central, eastern and southern Europe, including the Alps and the Pyrenees mountain
regions. Hail storms can come in isolation or, more often, as part of more complex
convective storms, which may also leave wind and flood damage. In Europe, hail and
flash floods tend to be the main drivers of severe convective storms losses. In
general, the limited spatial scale and lack of uniform detection methods of severe hail
events limits full assessment of their impact beyond local damage reports.9
8 The moment magnitude scale measures the scale of earthquakes based on the area of earth ruptured by
a quake. For more see Measuring the Size of an Earthquake, US Geological Survey, http://earthquake.
usgs.gov/learn/topics/measure.php
9 H. J. Punge, K. M. Bedka, M. Kunz et al, “A new physically based stochastic event catalog for hail in
Europe”, Natural Hazards, vol 73 issue 3, September 2014, pp 1625–1645.
The South Napa earthquake caused
limited losses.
In Canada, insured losses were below
average …
… but 17 people died in a fire at a home
for the elderly.
Hail, wind and flooding caused the
heaviest losses in Europe.
The Balkans were hit by devastating
floods ...
… while severe hail and winds struck
France, Belgium and Germany.
Hail and other severe convective storms
occur frequently in Europe.
12. 10 Swiss Re sigma No 2 /2015
Regional overview
Nevertheless, hail risk is a standard component of building insurance in Western
Europe, purchased as part of a package for protection against windstorm damage.
The insurance penetration for these perils is above 75% in the region, except in Italy.
In some countries (eg, France, Switzerland and Belgium), hail and wind storm
insurance are compulsory, along with fire coverage,10 which is why insured losses
after hail storms can be high.
Source: Swiss Re CatNet®.
The loss potential in Europe has been on an upward trend due to increased exposure
from societal and economic development. In addition, average claim severity has
risen because the modern building materials used for thermal insulation and energy
generation systems are susceptible to damage from hail stones. The localised nature
of hail events limits the overall losses, especially compared to winter storm losses,
the biggest weather-event risk in Europe. But the loss experience of the last two
years is a stark reminder that multi-billion-loss convective storm events do happen.
Stronger mitigation measures in building construction, and more comprehensive risk
modelling are needed.
The 2013–2014 winter windstorm season in Europe was very active, especially
from early December 2013 to mid-February 2014. A series of low pressure systems
triggered major losses in December 2013, and winter storms continued to flow into
northwest Europe from the Atlantic well into 2014. Individually, the January and
February storm events were not significant but their quick succession brought heavy
rainfall and widespread inland flooding, particularly in the UK. The combination of
strong winds coincided with peak high tides, leading to coastal inundations that
exacerbated the flood situation. The UK Met Office classified January 2014 as the
wettest calendar month in southeast and central southern England since records
began in 1910. 11 The resulting insured losses were USD 0.5 billion.
10 Hailstorms in Europe – a new look at a familiar risk, Swiss Re, 2005.
11 Record wet January for parts of southern Britain, Met Office, 30 January 2014, http://www.metoffice.
gov.uk/news/releases/archive/2014/Early-January-Stats
Hail risk is a standard component of
building insurance in Europe …
Figure 5
Hail hazard map in Europe
… and the loss potential has increased
considerably recently.
Multiple low pressure systems from the
North Atlantic led to a cluster of
windstorms and heavy precipitation in
northwest Europe.
13. Swiss Re sigma No 2 /2015 11
In addition to the North Atlantic winter storms, multiple low pressure systems
originating in the Mediterranean generated a series of wind, flood and landslide
events in central and southern Europe. France and Italy, in particular, experienced
numerous episodes of heavy precipitation. France had its wettest July on record
and the highest number of tornadoes since 2004: around 50, almost three times
the annual average.12 The total losses from the flood events in France and Italy are
estimated to have reached at least USD 2 billion, and insured losses USD 0.5 billion.
In Slovenia and Croatia, heavy snowfall, freezing rains and floods in the period from
31 January to 6 February caused damage to forest stands, roads, ski-trails and other
infrastructure, with total losses estimated at around USD 0.9 billion. A state of
emergency was declared in affected areas and EU solidarity funds were dispersed.
Of man-made disasters, in May a fire at a coal mine in Turkey claimed 301 lives.
In June, a major fire followed by explosion at an oil refinery in Russia caused the
biggest man-made financial loss in Europe.
Asia
Asia was hardest hit in terms of human loss in 2014, with over 7000 victims from
natural and man-made catastrophes. The region also suffered the most loss
of life relative to others in 2013 and 2012. The total cost of disaster events in the
region in 2014 is estimated to be around USD 52 billion. Insured losses were over
USD 5 billion.
In mid-February, a severe cold snap brought the heaviest snowfall seen in Japan for
many decades, killing 26 people and injuring many more, primarily in road accidents.
Metropolitan Tokyo was also hit hard. The snow caused widespread damage to
residential and commercial property, and to agriculture. Insurers estimated claims of
USD 2.5 billion, making it the costliest disaster of the year in Asia. Total losses were
USD 5 billion.
In early September, monsoon rains in the northern state of Jammu and Kashmir in
India and the neighbouring region in Pakistan resulted in the worst flooding in 60
years. At least 665 perished and over 200 000 houses were destroyed. The total
losses from the destruction of housing in India were set at USD 4.4 billion. However,
the rural communities were hit harder as the floods came at harvest time for rice and
apple crops, the livelihood of many farmers. Together, the total losses in India and
Pakistan were USD 5.9 billion, and insured losses were at least USD 0.2 billion.
The biggest storm of the Pacific and Indian Ocean season was Cyclone Hudhud in
October. Hudhud made landfall near the port city of Visakhapatnam in the Indian
state of Andhra Pradesh with winds of up to 200 km/124 miles per hour and a storm
surge of up to three metres in some areas. The storm brought heavy rains and
flooding in neighbouring states also. With a population of 2 million, Visakhapatnam
is the third largest city on India’s east coast. The total losses were estimated at
USD 7 billion, the largest of all natural catastrophes in the world in 2014. However,
the insured losses were a fraction of the total at just USD 0.6 billion. The cyclone
claimed 68 lives but the number could have been much higher. Early warning and
evacuation of up to 400 000 people ahead of the storm saved many lives.
12 Les tornados en France en 2014: bilan national, Keraunos,2 January 2015, http://www.keraunos.org/
actualites/fil-infos/2015/janvier/tornades-en-france-2014-bilan-nombre-intensite-climatologie.html
Mediterranean cyclone activity triggered
convective precipitation and flash flood
events in France and Italy.
Winter weather caused severe forest
damage in Slovenia and Croatia.
Europe was hit by deadly and costly
man-made disasters.
The Asia region has suffered the most
loss of life from catastrophic events for
three years running.
Snow covered and damaged parts of
Japan.
Heavy monsoon rains hit northern India
and Pakistan.
Cyclone Hudhud caused the largest loss
from a tropical cyclone.
14. 12 Swiss Re sigma No 2 /2015
Typhoon Rammasun hit the Philippines and China in a double landfall in July,
destroying over 140 000 houses and damaging at least another 500 000, while
also causing crop losses in Vietnam. The total loss was USD 5 billion, of which
USD 0.8 billion and 101 of the 202 total victims were in the Philippines. This was
the deadliest and most damaging event for the Philippines in 2014, which one
year earlier suffered the deadliest and most disastrous event in its history, Typhoon
Haiyan. Another typhoon struck the Philippines later in the year, in December. This
was Typhoon Hagupit. The country’s disaster management authority managed to
evacuate close to 1 million people ahead of the storm, saving many lives.
In August, an Mw 6.1 earthquake struck Yunnan Province in southwest China, killing
617 people, while 114 remain missing. The high number of victims was due to the
widespread use of unreinforced masonry in residential housing. The quake destroyed
25 800 houses and caused damage to a further 40 600. It caused damage to local
infrastructure, generating total losses of USD 5 billion, according to local authorities.
In August, an explosion at a metal factory in China caused the largest loss of life
generated by a man-made disaster (146). Numerous fires and explosion at refineries
and various industrial plants triggered further losses.
Latin America and the Caribbean
Natural catastrophes and man-made disasters caused total damage of at least
USD 8.2 billion in Latin America and the Caribbean in 2014. Insured losses were
over USD 2.3 billion. The main drivers were hurricanes and industrial accidents.
While it was a quiet hurricane season in the North Atlantic, the eastern Pacific had
20 named storms. That’s five more than the annual average of 15 since 1990,
making 2014 the most active hurricane year in the region since 1992. The most
devastating was Hurricane Odile in Mexico, which ties with Hurricane Olivia (1967)
as the strongest hurricane to make landfall along the Baja of California peninsula
during the satellite era.13 The combination of strong winds and heavy rains resulted
in insured losses of USD 1.7 billion, mainly from the tourist resort of Cabo San Lucas
where commercial insurance penetration is relatively high given a large number of
hotels and other commercial properties. Hurricane Odile is the second most costly
catastrophe event in Mexico after Hurricane Wilma in 2005.
Drought affected Brazil and Central America, disrupting coffee, maze and bean
production and killing thousands of livestock. This impacted the livelihood of farmers
and low-income families, particularly in Central America. International aid helped
alleviate the situation. However, dry conditions were still lingering at the beginning of
2015. The preliminary estimate of total losses is USD 3 billion, at least.
For the second successive year, very low temperatures caused high casualties in
Peru. It is believed as many as 505 people, mainly children and the elderly, died in
the Andean region because of freezing temperatures.14
13 J.P. Cangialosi, T.B. Kimberlain, “National Hurricane Center Tropical Cyclone Report - Hurricane Odile”,
www.nhc.noaa.gov, 19 December 2014, http://www.nhc.noaa.gov/data/tcr/EP152014_Odile.pdf
14 Instituto Nacional de Defensa Civil, http://www.indeci.gob.pe/objetos/alerta/ODIy/
fil20141015171856.pdf
Typhoon Rammasun hit China and the
Philippines.
An Mw 6.1 earthquake in China killed
617 people.
An explosion at a metal factory in China
caused the biggest loss of life.
Insured losses in Latin America were over
USD 2.3 billion in 2014.
Hurricane Odile in Mexico caused the
biggest insured losses ...
... while drought impacted other
countries in the region.
More than 500 people died in a cold
snap in Peru.
Regional overview
15. Swiss Re sigma No 2 /2015 13
Oceania
Natural catastrophes and man-made disasters in 2014 caused insured losses of just
USD 1 billion in Oceania, primarily from hail in Australia. On 27 November 2014, a
powerful storm system brought large hail, strong winds and heavy rainfall to Brisbane
and southeast Queensland. Damage affected Brisbane’s central business district.
Estimated insured losses from the storm were around USD 0.9 billion, the costliest
catastrophe event in Australia and the region last year. There were some other storm
events and bushfires, but these were below the sigma threshold in terms of losses.
Africa
Natural catastrophes and man-made disasters in Africa claimed 2506 lives in 2014
and caused total losses of USD 1.5 billion. The insured losses were just USD 0.8 billion.
Late in the year, 47 people died in floods in southern Morocco, which inundated
356 villages causing thousands of houses to collapse, and damage to 505 bridges
and 18 000 roads. Total losses were estimated to be USD 0.5 billion.
Elsewhere, floods hits Burundi, Tanzania, Zimbabwe, the Ivory Coast and Niger.
Cyclone Bejisa hit La Réunion causing power outages that affected 170 000 homes
and severe damage to sugar crops. Terrorism contributed to the largest loss of life in
the region, resulting in at least 900 victims.
Hail was the main driver of large insured
losses in Australia.
In Africa, 2506 people died in disaster
events in 2014 …
… of whom 900 were victims of terrorist
incidents.
16. 14 Swiss Re sigma No 2 /2015
Severe convective storms: a growing global risk
Convective storms, or thunderstorms, are a meteorological hazard generated by
the collision of cold dry air and warm moist air.15 Most thunderstorms are localised
and short-lived, but severe thunderstorms, also called severe convective storms, can
persist for many hours and even develop into multi-day events. They consist of hail,
tornadoes, straight-line winds, flash flooding and lightning. The classification of a
storm as “severe” varies across regions, but generally the criteria are set at the
threshold where damage is expected to occur (typically winds of 90 km/56 miles
per hour and/or hail stones of 2 cm in diametre or more in countries using the metric
system, and 1 inch or more in US reference terminology). The severe storms occur in
many countries around the world to different degrees of frequency and severity, but
it is in the US where they wreak most havoc.
The damage left in the wake of a severe convective storm can be extreme, and the
impact and costs of such storms have been rising over the last 25 years. Tornadoes
and hail are the two most damaging sub-perils of the severe convective storm family.
Between 1990 and 2014, the global total and insured losses from severe convective
storms grew at average annual rates of 7.7% and 9.0%, respectively.16 In contrast,
total and insured losses from all natural catastrophe events in the same period grew
by 6.4% and 6.6% on average each year, respectively.
The share of severe convective storm losses from all-weather event losses has
similarly been on an upward trend. In the 1990s, the share of insured losses inflicted
by severe convective storms was estimated to be about 29% of the total all-weather
related insured losses. In the period 2010–2014, the estimated share was over 40%
(see Figure 6).17 Notably, from the early 2000s, with the exception of 2005, at least
one severe convective storm each year has resulted in insured losses of USD 1 billion
or more. Since 2008, there have been four to seven such storm events annually.
Source: Swiss Re Economic Research Consulting and Cat Perils.
15 Peril classification and hazard glossary, Integrated Research on Disaster Risk, January 2014.
16 To smooth out the short term-fluctuations and highlight the longer-term trends, the annual growth rate is
calculated based on the the average of the years 1986-1990 and 2010-2014.
17 The sigma database does not include estimates for all drought events. Hence all-weather event-related
losses may be understimated and the share of the losses from severe convective storms overestimated.
However, in regions other than the US and Europe, given scarcity of information insured losses from
convective storm activity in those regions may be underestimated.
Severe convective storms include
tornados, hail, thunder and lightning,
wind, heavy rains and flash floods.
The damage inflicted by and costs of
severe convective storms are on an
upward trend.
The number of severe convective storms
resulting in insured losses of at least
USD 1 billion is also rising.
Figure 6
Severe convective storm-related insured
losses as % of all-weather event insured
losses
0%
10%
20%
30%
40%
50%
2010–20142000–20091990–1999
17. Swiss Re sigma No 2 /2015 15
Among the reasons for the rise in losses from severe convective storms are the
growing exposures and increasing insurance penetration that come with economic
development: expanding populations and urban centres, and increasing values and
technology at risk. For example, the US states with the most severe convective storm
activity have seen 15–48% population growth since 199018 and, in parallel, increasing
risk exposure. The rising losses from convective storms worldwide is mostly due to
the mounting levels of damage seen in the US. In addition, with better understanding
of the meteorological systems responsible for the sudden and heavy precipitation
that can come with severe convective storms, such as the cloud systems that cause
the flash floods in the Mediterranean basin, in certain regions it is now possible to
better-estimate the losses arising from specific storms. Previously, those losses
would have been attributed to all-weather, not convective-storm, events.
Today there are many models to assess the risks from “main” perils such as tropical
cyclones and earthquakes. In contrast, modelling of severe convective storms is
still in its infancy and is constrained by several limitations. For example, in many
countries there is no official process to collect reports of observed severe convective
storm events. And, even when there is such a system (eg, like in the US, since 1950,
for tornadoes), the observed increase in the number of single events may be due to
more effective reporting and recording than in the past, particularly after the
introduction of Doppler radar technology in the early 1990s. As such, the observed
frequency of tornadoes based on available records may not fully reflect the real
frequency, which makes historical analysis more complicated.
Even with better understanding of meteorological systems in certain regions, the
modelling of severe convective storms remains challenging. They are local in nature
compared to tropical cyclones, must often be observed remotely via Doppler radar
or satellite technology, and frequently include different sub-perils interacting
simultaneously. But in a world where convective storm-related losses are mounting,
the development of probabilistic models for a broad range of perils is essential for
insurers and communities to better assess this growing risk and manage the
impacts.
Severe convective storms: the regional risk landscape
In North America, severe convective storm losses are mainly driven by hail and
tornadoes, particularly in the US. According to the NOAA’s Storm Prediction Center
(SPC), there are on average around 1200 tornadoes in the US each year, and an
average 216 days with hail of 1 inch in diametre or larger. The US has more
tornadoes than any other country in the world, which is due to its geography. Cold
dry air from Canada/Rocky Mountains, hot dry air from the desert southwest and
warm moist air from the Gulf of Mexico all come together in the central US. In the
spring, these air masses collide with the winds in the lower atmosphere coming from
different directions at different speeds, causing thunderstorms to rotate. These
rotating storms – supercells – are the source of the strongest tornadoes and largest
hailstones. Up to 60 people die in US tornadoes each year and 1500 are injured.19
In Canada, there are on average 60 tornadoes and 160 severe hail events every year,
mostly in the lower latitude provinces of Alberta, Manitoba, Saskatchewan and
Ontario.20
18 US and State Decennial Census Population Counts, 1990–2010, Bureau of Business and Economic
Research, University of New Mexico, https://bber.unm.edu/census/2010States.htm
19 Tornadoes: A Rising Risk?, Lloyds, 2013, http://www.lloyds.com/~/media/lloyds/reports/
emerging%20risk%20reports/tornadoes%20final%20report.pdf
20 Spring and Summer Weather Hazards, Environment Canada, 28 January 2015 http://ec.gc.ca/
meteo-weather/default.asp?lang=enn=6c5d4990-1
The rising losses are due to the growing
exposures that come with economic
development.
Insurers need to be able to model a broad
range of weather perils …
... but the localised nature of sub-perils
makes modelling difficult.
The US has more tornadoes than
anywhere else in the world.
18. 16 Swiss Re sigma No 2 /2015
Severe convective storms: a growing global risk
In Europe, thunderstorms tend to be smaller scale than in the US. The Alps protect
many countries against intense influx of moisture from the Mediterranean, which
limits the formation of severe convective storms. Nevertheless, during the summer
months moist air masses do move through continental central Europe, creating
conditions for severe thunderstorms in which hail, rather than tornadoes, tends to be
the cause of the larger losses. Tornadoes do happen in Europe but they are typically
weaker and have less loss impact than in other tornado-prone regions. A recent
study indicated that on average 276 tornadoes were reported each year in Europe
from 2006 to 2013.21 An earlier study estimated around 295 tornadoes annually but
that only 169 of those were reported, an under-reporting of about 40%.22
Flash flooding is another regular occurrence in Europe, particularly in south western
France, north eastern Italy and the southern Pyrenees in Spain. The topography of
these regions with steep mountains near the coast and torrent-like rivers, renders
them susceptible to sudden flooding when there are heavy downpours.
In Latin America, the majority of the tornado and hail activity occurs in southern
Brazil, Paraguay, Uruguay and Argentina. On average, Brazil experiences two
tornadoes every year, mostly in the Sur region,23 and around 68 hail storms
throughout the country.
In Asia, the bulk of the severe convective storm activity occurs in India and
Bangladesh, most often in the pre-monsoon period from March-May. The storms are
classified by wind speed, with speeds of 42 meters per second/151 km per hour or
higher referred to as tornadoes, and below that as “nor’westers”. The four deadliest
tornadoes on sigma records were all in Bangladesh and the fifth and sixth in India.
On 26 April 1989, a tornado in the Manikganj district of Bangladesh killed 1 115
people, the most ever. The twister injured a further 12 000 and left 40 000 people
homeless. Elsewhere in Asia, China has many severe thunderstorms, with the
highest activity over the central Tibetan Plateau and Qilian Mountain region. Nagqu
has the highest number of hail days recorded per year at 33. The nationwide average
is lower at one to five per year.24 Overall, good reporting and data are scarce in Asia.
In Australia, on average 22 tornadoes were reported each year between 1990 and
2014, the majority in Western Australia near Perth.25 Hail storms are also common in
New South Wales, particularly in September through March, with about 45 events
per year, although the number of hail storms reported in the last five year has fallen.26
Meanwhile, the New Zealand National Institute of Water and Atmospheric Research
estimates that seven to 10 tornado loss events happen in the country each year.27
Losses from severe convective storms are highest in the US
Given the high frequency and intensity, particularly of tornadoes, the US is the most
susceptible to high-impact, high-cost severe convective storms. It follows, therefore,
that insured and total losses from this hazard in the US are higher than anywhere
else in the world. Between 1990 and 2014, insured losses from severe convective
storms in the US averaged USD 8 billion annually. Since 2008, those insured losses
have exceeded USD 10 billion every year, including in 2014 which was the quietest
year for tornado activity since the early 1990s. Hail activity was also below average
21 P. Groenemeijer, T. Kühnem, “A Climatology of Tornadoes in Europe: Results from the European Severe
Weather Database,” Monthly Weather Review, vol. 142, 2014 pp. 4775–4790.
22 N. Dotzek, “An updated estimate of tornado occurrence in Europe,” Atmospheric Research, vol. 67–68,
2003, pp. 153–161.
23 Atlas Brasileiro de Desastres Naturais 1990 a 2012, Universidade Federal de Santa Catarina and Centro
Universitário de Estudos e Pesquisas Sobre Desastres.
24 C. Zhang, Qinghong Zhang, 2008: “Climatology of Hail in China: 1961–2005” Journal of Applied
Meteorology and Climatology, vol. 27, pp. 795–804.
25 Severe Storms Archive, Australia Government Bureau of Meteorology, http://www.bom.gov.au/
australia/stormarchive/
26 Ibid.
27 Tornados in New Zealand – FAQs, New Zealand National Institute of Water and Atmospheric Research,
https://www.niwa.co.nz/natural-hazards/faq/tornadoes-in-new-zealand-faqs
In Europe, severe convective storm-
related losses are driven mostly by hail…
… and flash flooding.
Southern Brazil is prone to tornadoes.
Northern India and Bangladesh are hit
by severe convective storms, often with
large loss of life. Storms happen in China
regularly also …
… and in Australia and New Zealand.
Since 2008, the insured losses from
severe storms in the US have exceeded
USD 10 billion each year.
19. Swiss Re sigma No 2 /2015 17
in 2014. The high insured loss total of USD 13 billion in 2014 resulted because the
less-than average number of severe events often hit densely populated areas.
According to sigma records, 2011 was the record year in the US in terms of insured
(USD 28 billion) and total losses (USD 39 billion) from severe convective storms.
Most of the losses were caused by tornado outbreaks. There were 1690 tornadoes
in the US that year, and new records were set for the highest number registered in
both a single day and in a single month. Two outbreaks in the southern and Midwest
states in April and May caused the most damage. A single Enhanced Fujita scale
5 (EF5) tornado,28 the strongest category, hit the city of Joplin, Missouri on May 22
killing 160 people, the deadliest single tornado in the US since 1950. The outbreak
at the end of April spawned a record 349 tornadoes, the highest for a single
outbreak since 1950. In terms of insured losses, the two tornado outbreaks are the
12th and 13th most expensive US natural catastrophe events on sigma records, and
the 19th and 20th worldwide. The most damaging hail event ever recorded in the
US was in 2001, when a hailstorm inflicted severe damage on Kansas City, causing
insured losses of USD 2.9 billion (in 2014 prices). The claims were mostly for vehicle
and property damage.
0
5
10
15
20
25
30
35
40
Uninsured losses from severe convective storms
Insured losses from severe convective storms
20102005200019951990
0
1
2
3
4
5
6
7
8
Number of events (Insured loss = USD 1 bn (RHS))
20102005200019951990
Source: Swiss Re Economic Research Consulting and Cat Perils.
Severe convective storms: a need for robust modelling
The increasing losses from severe convective storms are a growing challenge for
society and insurers alike. The multi-billion dollar severe convective storm loss events
of recent years reaffirm the need for stronger mitigation measures, for example in
building codes and construction practices. They also call for more comprehensive
risk modelling in order to better understand the risks.
28 The Enhanced Fujita scale is a ratings system to measure the strength of tornadoes based on the damage
caused. There are six categories, zero to five, representing increasing degrees of damage. For more
information, see http://en.wikipedia.org/wiki/Enhanced_Fujita_scale
2011 saw record losses from severe
convective storms.
Figure 7
US total and insured losses from severe
convective storms in USD billions, and
number of events leading to insured
losses in excess of USD 1 billion
Modelling severe convective storms is
a challenging business …
20. 18 Swiss Re sigma No 2 /2015
Severe convective storms: a growing global risk
Challenges in severe convective storm risk assessment
The reality, however, is that modelling severe convective storm risk is inherently
difficult. The risk assessment models are typically built from the historical archives
of events. Yet the archives for severe convective storms are not very reliable, if they
exist at all. For example, the US record of tornadoes, hail and straight-line winds is
the most complete in the world. Even so, to use this information for risk assessment
presents still many challenges, such as:
̤̤ Short and incomplete entries.
̤̤ Duplicate entries (eg, when a tornado crosses state boundaries).
̤̤ Reporting biases near population centres and by time of day .
̤̤ Tornado intensity rating based on damage as a proxy for actual wind speed
intensity, which can often lead to under-reporting of weak tornadoes and under-
classification of strong tornadoes.
̤̤ Tornado intensity classification based on the maximum rather than the average
or distribution of damage observed.
̤̤ Tornado path width and length based on the maximum rather than average or
distribution of width observed. These parameters are also often rounded to the
nearest 100 yards or mile.
̤̤ Recording of only the start and end points of the tornado damage path, and no
information on path curvature.
̤̤ In the US, the Enhanced Fujita scale replaced the Fujita29 scale in 2007. The
tornadoes on record prior to 1970s were retroactively rated.
̤̤ Descriptions of hail storm intensity in reports are very subjective, and based on
the relative size of common objects such as golf balls.
̤̤ Hail reports are from point locations only. Information on hail swaths has to be
derived from other methods (eg, Doppler radar or satellite observations).
In addition, insured losses for severe convective storms are generally reported with
tornado, hail and straight-line wind losses aggregated. Also the historical reporting
thresholds are high and can change. For example, from 1941–1981 the threshold
used by the Property Claim Services (PCS) in the US was USD 1 million. That moved
to USD 5 million in 1982–1996, and has been at USD 25 million since 1997.
Models for severe convective storms risk assessment
There are many models to assess the risks from “main” perils such as tropical
cyclones and earthquakes, but there are few that model severe convective storms.
Risk assessment models generally use simulated event sets based on statistics
derived from historical records. The localized nature of the severe convective storms,
however, means that the associated damage can be concentrated over a very small
area, and that hundreds of thousands to millions of years of simulated events would
need to be generated to obtain enough data to assess the risk at any given location.
Today, computing capability has reached a level where generating these millions of
years of events is possible. But this is a recent development, which explains why risk
assessment modelling for severe convective storms is still a new art.
The few severe convective storm risk assessment models that do exist have many
shortcomings. The models are all hybrids incorporating, for example, statistical
techniques coupled with numerical weather prediction modelling and claims
analyses, or using satellite or Doppler radar data as proxies for hail or tornado-
favourable environments. These techniques are used to circumvent some of the
difficulties posed by the historical archives, but they have their own uncertainties
and complications. Additionally, the grid spacing, spatial correlation, structural
vulnerability and loss accumulation potential are generally all treated very differently
from model to model. One model used in the US and Canada considers the impact
of tornadoes, hail and straight-line winds together, while another used in the US,
Canada and Australia can be run for each sub-peril independently or in combination.
29 The predecessor to the EF scale, also rating six levels of tornado intensity based on damage caused.
For more, see http://en.wikipedia.org/wiki/Fujita_scale
… with many ambiguities, including short
and incomplete recording, impacting the
quality of historical event data.
Added complications are that severe
convection storm losses are generally
aggregated, and the reporting thresholds
can change.
The localized nature of severe convective
storms makes it difficult to build up a full
overview of events.
There are some models to assess
convective storm risk on the market …
21. Swiss Re sigma No 2 /2015 19
Yet another model focuses on tornadoes and hail storms in the US. Because of the
wide variety of approaches and assumptions used, the models rarely compare well
with one another. These challenges and difficulties are further amplified with short,
incomplete, or non-existent historical records.
Also, different approaches are required depending on whether the focus is a single
risk/location or a large portfolio of risks/locations (ie, reinsurance treaty). This is
particularly important from the reinsurance perspective. For reinsurance treaties,
large severe convective storm outbreaks are the major loss drivers, and the losses
tend to correlate better with market losses. For a single location, however, a single
storm can cause significant to total loss, but the likelihood of the specific location
being hit directly by a severe convective storm is much lower.
Swiss Re’s models for severe convective storms
Swiss Re has three models for severe convective storm risk assessment. One is a
combined tornado/hail model for the eastern US, and another a hail model covering
central Europe, both for treaty business. A recent addition in 2014 is a tornado-only
model for single-risk business in the US and Canada.
This latest model was developed based on the occurrence and severity of historical
tornadoes, the spatial correlation of damage and the frequency of expected losses.
A “hazard map” was developed using the SPC’s 1950–2013 tornado track set after
removing all EF/F0 tornadoes, the lowest intensity tornadoes based on the Enhanced
Fujita/Fujita scales, and tornadoes caused by tropical cyclones. The number of
tornadoes within a 100km/62 mile radius for each grid point on a 1km/0.62 mile
grid was determined, and a severity factor was applied on a regional basis depending
on the likelihood that a tornado would exceed a certain intensity. Finally, adjustments
were made to account for reporting biases near population centres.
Source: Swiss Re.
An irregular grid was developed to take the spatial correlation of damage into
account. The grid resolution and orientation are based on the average track direction
(on a regional basis), and also the tornado path width and length characteristics
(Table 4).
… but with recurring shortfalls in all.
Swiss Re has three models to assess
severe convective storm risk.
The latest is a single-risk tornado model
for the US and Canada.
Table 4
Tornado path characteristics
Enhanced
Fujita/Fujita
scale rating
Number of
tornadoes
evaluated
Average
compass
direction
(degrees)
Tornado path length Tornado path width
50th
Percentile
(km)
95th
Percentile
(km)
50th
Percentile
(m)
95th
Percentile
(m)
1 18 691 67 1.6 21.1 46 305
2 8904 56 4.8 42.2 91 594
3 2510 62 15.5 77.4 183 1207
4 658 66 30.3 140.7 366 1609
5 81 54 48.4 182.6 487 1749
The model builds a hazard map showing
high and low risk areas.
22. 20 Swiss Re sigma No 2 /2015
Severe convective storms: a growing global risk
Source: Swiss Re CatNet®.
Using the “hazard map” and irregular grid, the expected losses were accumulated
assuming full correlation within the grid cell, and no correlation between grid cells.
Finally, the model was benchmarked by comparing expected market losses with
severe convective storm loss data from Property Claim Services.
Source: Swiss Re.
Like all severe convective storm models, the Swiss Re models have shortcomings for
all the same reasons mentioned previously. Models are only as good as the data and
assumptions that go into them. That is why more attention needs to be devoted to
building a longer and higher quality historical archive of events and losses, and also
to developing probabilistic models for a broad range of perils. Only then will severe
convective storm risk assessment be significantly improved.
Figure 8
US tornado hazard map
The expected losses are accumulated
from the hazard map and irregular grid.
Figure 9
Regional exceedance probability
curves for tornado intensity
1
0.1
0.01
0.001
EF/F1 EF/F2 EF/F3 EF/F4 EF/F5
Southeast
Northeast
South Plains
North Plains
Midwest
Rocky Mountain
West
South Appalachian
Much more needs to be done to improve
severe convective storm risk assessment
modelling.
23. Swiss Re sigma No 2 /2015 21
Tables for reporting year 2014
Table 5
List of major losses in 2014 according to loss category 30 31
Number in % Victims30 in %
Insured loss31
(in USD m) in %
Natural catastrophes 189 56.3% 7 066 55.3% 27 749 80.0%
Floods 61 3 064 2 162
Storms 85 1 195 18 397
Earthquakes 15 897 313
Droughts, bush fires, heat waves 10 335 150
Cold, frost 6 745 53
Hail 5 7 6 641
Other natural catastrophes 7 823 34
Man-made disasters 147 43.8% 5 711 44.7% 6 958 20.0%
Major fires, explosions 43 12.8% 490 3.8% 4 257 12.3%
Industry, warehouses 12 152 1 278
Oil, gas 18 40 2 928
Other buildings 9 296 50
Other fires, explosions 4 2
Aviation disasters 12 3.6% 960 7.5% 916 2.6%
Crashes 7 940 337
Explosions, fires 1 20
Space 4 579
Maritime disasters 39 11.6% 2 118 16.6% 783 2.3%
Freighters 3 8 156
Passenger ships 28 2000 231
Drilling platforms 4 326
Other maritime accidents 4 110 70
Rail disasters (incl. cableways) 5 1.5% 127 1.0% 0.0%
Mining accidents 7 2.1% 400 3.1% 110 0.3%
Collapse of buildings/bridges 3 0.9% 42 0.3% 0.0%
Miscellaneous 38 11.3% 1 574 12.3% 893 2.6%
Social unrest 1 21 350
Terrorism 28 1 361 543
Other miscellaneous losses 9 192
Total 336 100.0% 12 777 100.0% 34 708 100.0%
Source: Swiss Re Economic Research Consulting and Cat Perils.
30 Dead or missing.
31 Property and business interruption, excluding liability and life insurance losses.
24. 22 Swiss Re sigma No 2 /2015
Tables for reporting year 2014
Table 6
The 20 most costly insurance losses in 2014 32 33
Insured loss32
(in USD m) Victims33
Date
(start) Event Country
2 935 – 18.05.2014 Severe thunderstorms, large hail US
2 502 26 08.02.2014 Snow storm Japan
2 190 6 08.06.2014 Wind and hail storm Ela France, Germany, Belgium
1 700 6 14.09.2014 Hurricane Odile Mexico
1 669 21 05.01.2014 Winter storm US
1 269 2 03.06.2014 Severe thunderstorms, large hail, tornadoes US
1 220 33 27.04.2014 Thunderstorms, large hail, 83 tornadoes, severe flash floods US
1 084 – 02.04.2014 Severe storms, large hail, tornadoes US
ns 7 15.06.2014 Major fire and explosion at oil refinery Russia
905 – 27.09.2014
Thunderstorms with winds up to 108 km/67 miles per hour,
hail, flash floods US
852 – 30.11.2014 Hailstorm Australia
678 – 12.04.2014 Thunderstorms, large hail, tornadoes US
ns – 07.07.2014 Fire at petrochemical plant US
635 – 10.05.2014 Thunderstorms, hail, tornadoes, flash floods US
632 68 12.10.2014 Cyclone Hudhud India
592 – 27.03.2014
Thunderstorms, winds up to 129 km/80 miles per hour, large hail,
tornadoes US
545 3 14.06.2014 Thunderstorms, 100 tornadoes, hail US
539 2 11.08.2014 Torrential rains trigger severe floods US
ns* 47 13.07.2014 Fighting at airport destroys aircrafts Libyan Arab Jamahiriya
530 – 01.01.2014 Floods UK
*Not shown.
Source: Swiss Re Economic Research Consulting and Cat Perils.
32 Property and business interruption, excluding liability and life insurance losses; US natural catastrophe figures based on Property Claim Services, including
National Flood Insurance Program (NFIP) losses (see page 43, “Terms and selection criteria” section).
33 Dead and missing.
25. Swiss Re sigma No 2 /2015 23
Table 7
The 20 worst catastrophes in terms of victims 2014 34 35
Victims34
Insured loss35
(in USD m)
Date
(start) Event Country
731 – 03.08.2014 Earthquake (Mw* 6.1); aftershocks and landslides China
665 237 03.09.2014 Severe monsoon floods India, Pakistan
505 – 13.04.2014 Cold wave; freezing temperatures Peru
304 ns 16.04.2014 Passenger ferry sinks North Pacific Ocean, South Korea
301 – 13.05.2014 Fire at coal mine Turkey
298 ns 17.07.2014 Malaysia Airlines Boeing 777-2H6ER (Flight MH17) crashes Ukraine
256 – 02.05.2014 Heavy rains trigger massive landslide Afghanistan
251 – 22.03.2014 Overcrowded boat carrying refugees capsizes on Lake Albert Uganda
250 – 13.01.2014 Overcrowded boat capsizes on the Nile Sudan
241 – 13.08.2014 Monsoon foods Nepal
239 ns 08.03.2014 Malaysia Airlines Boeing 777-2H6ER (Flight MH-370) crashes Indian Ocean
212 – 15.03.2014 Terrorist attacks at area nearby prison Nigeria
209 – 30.07.2014 Landslide triggered by heavy rains buries a village India
202 250 15.07.2014 Typhoon Rammasun China, Philippines, Viet Nam
196 – 29.10.2014 Massive landslide Sri Lanka
190 – 11.04.2014 Heavy rains trigger floods and landslides Afghanistan, Tajikistan
186 – 02.08.2014 Massive landslide Nepal
180 – 01.01.2014 Heat wave Pakistan
162 – 28.12.2014 Indonesia AirAsia Airbus A320-216 goes missing Indonesia
154 – 22.04.2014 Floods Tajikistan
*Mw = moment-magnitude scale.
Source: Swiss Re Economic Research Consulting and Cat Perils.
34 Dead and missing.
35 Property and business interruption, excluding liability and life insurance losses.
26. 24 Swiss Re sigma No 2 /2015
Tables for reporting year 2014
Table 8
Chronological list of all natural catastrophes 2014
Floods
Date
Country
Place Event
Number of victims
Amount of damage (where data available)
1.1.–24.1. UK
South
Floods; ongoing precipitation during winter
storms trigger floods on saturated soil
GBP 340m (USD 530m) insured loss
GBP 400m (USD 624m) total damage
1.1.–20.1. Peru
Cusco, Huancavelica
Floods 21 dead
4.1.–5.1. Italy
Liguria, Tuscany
Flash floods EUR 154m (USD 186m) total damage
10.1.–28.2. Bolivia
Beni
Floods, landslides; 1 600 houses destroyed
2 200 houses damaged, 63 000 ha of cropland
flooded, 108 231 livestock killed
64 dead, 10 missing
USD 200m total damage
13.1. Brazil
Itaoca (Sao Paulo)
Flash floods 12 dead, 8 missing
14.1.–7.2. Indonesia
Jakarta
Floods 32 dead
USD 20m insured loss
USD 600m total damage
16.1.–19.1. France, Italy
Var (France), Liguria,
Tuscany (Italy)
Flash floods, landslides; train derails in Italy 1 dead
3 injured
EUR 140m (USD 169m) insured loss
EUR 320m (USD 387m) total damage
19.1. Italy
Modena, Bologna (Emilia
Romagna)
Flash floods caused by torrential rains; River
Secchia burst its banks; 6 500 ha of agricultural
land flooded
2 dead
1 injured
1 000 homeless
EUR 99m (USD 120m) total damage
22.1.–23.1. Tanzania
Morogoro
Flash floods; 500 houses destroyed 5 000 homeless
24.1. Argentina
El Rodeo (Catamarca)
Floods cause landslide 24 dead
27.1. Peru
Tambopata, Manú
Heavy rains and floods; 500 houses destroyed,
1 240 houses damaged
6 000 homeless
30.1.–31.1. Italy
Rome
Floods caused by torrential rains EUR 243m (USD 294m) total damage
1.2.–30.3. Zimbabwe Floods 4 000 homeless
6.2. Sri Lanka Floods 27 dead
19.2.–10.3. Burundi
Bujumbura
Floods, landslides 64 dead, 32 missing
182 injured
12 500 homeless
25.2.–10.3. Paraguay
Asuncion
Floods 2 000 homeless
15.3.–15.5. Colombia
Caquetá, Magdalena,
Chocó, Cauca
Floods 33 dead
2.4.–3.4. Solomon Islands Flash floods 22 dead
5.4.–9.4. Argentina
Neuquén, Rio Negro,
Cordoba, Santa Fe, Entre
Rios, Catamarca, Santiago
del Estero
Floods 3 000 homeless
11.4.–13.4. Afghanistan, Tajikistan Heavy rains trigger floods and landslides 190 dead
11.4.–17.4 Tanzania
Dar es Salaam
Floods 41 dead
22.4.–30.4. Tajikistan Floods 154 dead
2.5. Afghanistan
Badakhshan
Heavy rains trigger massive landslide;
300 houses destroyed
256 dead
27. Swiss Re sigma No 2 /2015 25
Date
Country
Place Event
Number of victims
Amount of damage (where data available)
2.5.–4.5. Italy
Senigallia, Chiaravalle
(Marche)
Flash floods caused by torrential rains;
Rivers Triponzio and Misa burst their banks;
2 670 houses damaged
3 dead
EUR 99m (USD 120m) total damage
12.5.–16.5. China
Hunan
Floods as a result of torrential rains 53 dead
USD 700m total damage
12.5.–21.5. Serbia and Montenegro,
Bosnia and Herzegovina,
Croatia, Romania, Slovakia,
Poland
Severe floods, landslides 82 dead
USD 100m insured loss
USD 3.1bn total damage
24.5.–28.5. China
Guangdong
Floods; more than 90 000 houses destroyed or
damaged
37 dead
USD 1.1bn total damage
27.5.–31.5. Russia
Altai region, Khakassia
Republic, Altai Republic
Floods caused by heavy torrential rains;
4 000 houses severely damaged
6 dead
2000 injured
RUB 500m (USD 8m) total damage
1.6.–10.6. Iran
Khorasan, Golestan
Floods 37 dead
2.6.–7.6. Ivory Coast
Abidjan
Floods, landslides 23 dead
2.6.–10.6. China
Guishou, Gangdong
Floods; over 70 000 houses damaged;
damage to agriculture
33 dead
CNY 4.2bn (USD 677m) total damage
5.6.–20.6. Brazil, Paraguay, Argentina
Paraná (Brazil), El Chaco
(Paraguay)
Floods 13 dead
7000 homeless
USD 500m total damage
6.6. Afghanistan
Guzargah-e-Nur (Baghlan)
Flash floods; 380 houses destroyed,
40 houses damaged
81 dead
35 injured
16.6.–25.6. China
Sichuan, Fujian
Monsoon floods, thundestorms, hail;
over 80 000 houses damaged or destroyed;
damage to cropland
34 dead
CNY 5.74bn (USD 925m) total damage
18.6.–20.6. Bulgaria
Varna, Dobrich, Gabrovo,
Veliko Tarnovo, Burgas,
Montana, Kyustendil,
Plovdiv, Haskovo, Yambol,
Sofia
Thunderstorms trigger flash floods
and hail
15 dead
1260 homeless
EUR 311m (USD 377m) total damage
19.6.–11.7. Ivory Coast
Abidjan
Floods 23 dead
23.6.–25.6. India
Assam
Floods 27 dead
26.6.–28.6. China
Sichuan, Zhejiang
Monsoon floods 24 dead
USD 900m total damage
3.7.–29.7. Brazil, Uruguay
Rio Grande do Sul (Brazil),
Paysandú (Uruguay)
Floods 10 dead
8405 homeless
3.7.–7.7. China
Guizhou, Yunnan
Floods; 5000 houses destroyed 15 dead, 8 missing
USD 500m total damage
13.7.–18.7. China
Fujian, Jiangxi, Shandong
Floods; 5800 houses destroyed,
16 300 houses damaged
66 dead
USD 1.25bn total damage
29.7.–3.8. Germany, Bulgaria,
Romania
North Rhine-Westphalia,
Baden-Württemberg
(Germany)
Thunderstorms trigger flash floods and landslides;
severe flood damage in city of Münster (Germany)
6 dead
EUR 140m (USD 169m) insured loss
EUR 300m (USD 363m) total damage
30.7.–31.7. Cambodia
Mekong River
Flash floods 45 dead
2.8.–20.8. Niger
Tillabéry
Floods; 4 700 houses destroyed 38 dead
36 000 homeless
7.8.–8.8. India
Odisha
Floods caused by monsoon rains 45 dead
USD 100m total damage
28. 26 Swiss Re sigma No 2 /2015
Tables for reporting year 2014
Date
Country
Place Event
Number of victims
Amount of damage (where data available)
11.8.–13.8. US
Detroit (MI), NY, MD
Torrential rains trigger severe floods in Michigan
and Northeast
2 dead
USD 600m-1bn insured loss
USD 1.6bn total damage
11.8.–19.8. China
Fujian, Jiangxi, Hunan,
Guangdong, Sichuan and
Guangxi regions
Flood caused by heavy monsoon rains 27 dead
USD 400m total damage
13.8.–20.8. Nepal Monsoon foods 92 dead, 149 missing
13.8.–18.8. Bangladesh
Bhola District, Barisal
Monsoon floods; 16 314 houses destroyed,
110 682 houses damaged
59 dead
USD 150m total damage
20.8. Japan
Hiroshima
Landslides triggered by heavy rains 74 dead
67 injured
USD 30.9m insured loss
USD 38m total damage
22.8.–28.8. China
Guizhou, Hebei, Qinghai,
Ningxia, Hunan, Sichuan,
Inner Mongolia, Shaanxi,
Gansu
Floods 10 dead
USD 600m total damage
1.9.–8.9. China
Chongqing, Sichuan,
Guizhou provinces
Floods caused by monsoon rains 65 dead
USD 570m total damage
3.9.–10.9. India, Pakistan
Jammu and Kashmir (India)
Severe monsoon floods 665 dead
53 735 injured
INR 15bn (USD 237m) insured loss
USD 5.97bn total damage
19.9.–20.9. France
Hérault, Gard, Ardèche
(Languedoc)
Thunderstorms cause flash floods, hail 6 dead
EUR 120m (USD 145m) insured loss
EUR 150m (USD 182m) total damage
20.9.–25.9. India
Assam, Meghalaya
Floods following Typhoon Kalmaegi 73 dead
INR 10bn (USD 158m) total damage
28.9.–30.9. France
Montpellier, Hérault,
Montagnac, Saint-Pargoire
(Languedoc-Roussillon)
Thunderstorms cause flash floods, hail EUR 200m (USD 242m) insured loss
8.10.–13.10. Italy
Genoa, La Spezia (Liguria)
Flash floods 1 dead
EUR 250m (USD 303m) total damage
15.10.–27.10. Nicaragua, Honduras,
Guatemala
Floods caused by heavy torrential rains 33 dead
32 000 homeless
28.10.–24.11. Colombia Floods 44 dead
4.11.–16.11. Italy, France, Switzerland,
Slovenia
Lombardy, Piedmont,
Liguria, Trentino-Alto
Adige, Tuscany, Friuli-
Venetia, Sicily (Italy),
Provence-Alpes-Cote
d’Azur, Languedoc-
Roussillon (France), Ticino
(Switzerland)
Multiple low depression systems trigger
thunderstorms, flash floods and tornadoes
12 dead, 3 missing
5 injured
EUR 300m (USD 363m) total damage
22.11.–30.11. Morocco, Spain
Guelmim-Es-Semara,
Souss Massa Drâa
(Morocco)
Storms trigger severe floods and damage to
infrastructure
47 dead
USD 450m total damage
3.12.–4.12. Colombia
Chocó
Flash floods 44 dead
17.12.–30.12. Malaysia, Thailand Floods 36 dead
USD 284m total damage
29. Swiss Re sigma No 2 /2015 27
Storms 36
Date
Country
Place Event
Number of victims
Amount of damage (where data available)
2.1. Réunion Cyclone Bejisa; power cuts to 170 000 houses,
roads damaged by high waves,
severe damage to sugar cane crops
2 dead
15 injured
EUR 41m (USD 49m) insured loss
EUR 70m (USD 85m) total damage
3.1.–5.1. US
MA, NJ, NY, PA, CT
Winter storm 16 dead
USD 100–300m insured loss
USD 210m total damage
5.1.–8.1. US
GA, OH, NY, TN, IL, PA, MI,
MD, NJ, IN, VA, NC, KY, AL,
MO, SC, MS
Winter storm 21 dead
USD 1.67bn insured loss
USD 2.5bn total damage
11.1. Tonga
Ha’apai
Cyclone Ian (Cat 5) with winds up to
430 km/267 miles per hour; 800 houses
damaged or destroyed; 17 schools damaged;
extensive damage to staple crops
1 dead
14 injured
2 300 homeless
TOP 62m (USD 31m) total damage
12.1.–20.1. Philippines Tropical Storm Linglin 64 dead
36 injured
USD 13m total damage
25.1. Burundi
Nyanza-Lac
Lightning strikes a school 7 dead
51 injured
1.2.–11.2. Afghanistan
Jawzjan
Winter storm, heavy snowfall, cold wave 63 dead
4.2.–6.2. France, Spain, UK, Ireland Winter storm Petra, floods EUR 77m (USD 94m) insured loss
EUR 130m (USD 157m) total damage
4.2.–6.2. US
PA, MD
Winter storm, icy winds USD 100–300m insured loss
USD 260m total damage
6.2.–9.2. France, Ireland, UK, Spain,
Portugal
Winter storms EUR 125m (USD 151m) insured loss
EUR 170m (USD 206m) total damage
7.2.–14.2. China
South
Winter storm, heavy snowfall 10 dead
90 injured
USD 675m total damage
8.2. Japan Snow storm 26 dead
600 injured
USD 2.5bn insured loss
USD 5bn total damage
11.2. US
GA, NY, NC, PA, SC
Winter storm, icy rains, snowfall 12 dead
USD 100–300m insured loss
USD 650m total damage
12.2.–13.2. UK, Ireland Windstorm Tini (Darwin); winds up to
180 km/112 miles per hour; heavy rainfall
exacerbates flooding in southern England.
1 dead
USD 362m insured loss36
USD 500m total damage
14.2.–15.2. Ireland, UK, France, Belgium,
Norway
Winter storm Ulla EUR 136m (USD 165m) insured loss
EUR 160m (USD 194m) total damage
17.2.–21.2. China
Sichuan, Guizhou, Yunnan
Winter storm, snow fall; damage to houses
and agriculture
USD 140m total damage
20.2.–21.2. US
MO, IL
Thunderstorms, tornadoes, hail 1 dead
USD 100–300m insured loss
USD 170m total damage
3.3.–4.3. India
Hyderabad (Andhra Pradesh)
Thunderstorms, hail, flash floods; 374 houses
damaged
7 dead
58 injured
6.3.–7.3. US
NC
Winter storm, icy rains, flooding USD 50–100m insured loss
USD 100m total damage
36 Data taken from Perils AG, http://www.perils.org/
30. 28 Swiss Re sigma No 2 /2015
Tables for reporting year 2014
Date
Country
Place Event
Number of victims
Amount of damage (where data available)
6.3.–7.3. US
NC
Winter storm, icy rains, flooding USD 50–100m insured loss
USD 100m total damage
14.3.–16.3. Germany, Denmark, Norway,
Sweden
Winter storm EUR 67m (USD 81m) insured loss
EUR 100m (USD 121m) total damage
16.3. Thailand Thunderstorms, heavy rains, hail 2 000 homeless
19.3.–20.3. China
Sichuan, Xinjiang, Henan
Thunderstorms, hail 1 dead
CNY 728m (USD 117m) total damage
26.3.–5.4. Madagascar, Comoros,
Mozambique
Tropical cyclone Hellen (Category 4); over
600 houses destroyed, over 1 000 houses
damaged
12 dead
2 736 homeless
USD 20m total damage
29.3.–4.4. China
Guangdong, Guangxi,
Guizhou
Storms, hail, landslides 21 dead
USD 155m total damage
2.4.–4.4. US
TX, IL, KS, MO
Severe storms, large hail, tornadoes USD 1.08bn insured loss
USD 1.6bn total damage
7.4.–16.4. China Winter storm, heavy snow fall, freezing
temperatures
128 dead
USD 100m total damage
12.4.–14.4. US
IL, MI, TX, IA, W
Thunderstorms, large hail, tornadoes USD 678m insured loss
USD 800m total damage
14.4.–16.4. Australia, Solomon Islands,
New Zealand
Cyclone Ita; over 760 houses destroyed (mainly
on the Solomon Islands), over 1 066 houses
damaged; severe damage to banana plantations
and public infrastructure.
22 dead
9 000 injured
USD 50m insured loss
USD 981m total damage
17.4.–20.4. India Storms 27 dead
17.4.–19.4. China Severe storm 3 dead
USD 156m total damage
23.4.–26.4. China
Xinjiang, Shaanxi, Guangxi,
Hunan, Jiangxi, Qinghai
Severe storms, heavy rains, flash floods,
landslides; over 5 000 houses destroyed or
damaged, damage to cropland
9 dead
CNY 2.83bn (USD 456m) total damage
27.4.–1.5. US
MS, AL, AR, FL, MD, PA, TN,
GA, KS, MO, NJ, NY, VA, NC,
DE, DC
Thunderstorms, large hail, 83 tornadoes; heavy
precipitation triggers flash floods in Florida and
Alabama
33 dead
115 injured
USD 1.22bn insured loss
USD 1.9bn total damage
28.4. Bangladesh
Netrokona
Thunderstorms, hail; 1 000 houses destroyed 16 dead
4000 homeless
3.5.–7.5. China Storm, freezing temperatures CNY 2.6bn (USD 419m) total damage
7.5.–9.5. US
TX, MN, CO, KS, MO
Thunderstorms, large hail, tornadoes, flash
floods
USD 100–300m insured loss
USD 200m total damage
10.5.–14.5. US
OH, MO, IN, NE, KS, TX, IL,
WV
Thunderstorms with winds up to 160 km/
99 miles per hour, hail, tornadoes, flash floods
USD 600m-1bn insured loss
USD 1bn total damage
24.5.–28.5. US
TX, NM
Thunderstorms, tornadoes, hail, flash floods USD 100–300m insured loss
USD 200m total damage
2.6.–4.6. Chile Thunderstorms trigger flash floods 7 injured
2 000 homeless
3.6.–5.6. US
Blair (NE), IA, KS, AR, WY
Severe thunderstorms with winds up to 128
km/80 miles per hour, large hail, tornadoes;
severe hail damage in city of Blair and to
agriculture.
2 dead
USD 1.27bn insured loss
USD 1.7bn total damage
5.6.–6.6. US
SD
Thunderstorms, large hail, 1 tornado, flash
floods
USD 100–300m insured loss
USD 170m total damage
6.6.–9.6. China
Beijing, Tianjin
Thunderstorms, strong winds, floods; damage
to cropland
1 dead
USD 193m total damage
31. Swiss Re sigma No 2 /2015 29
Date
Country
Place Event
Number of victims
Amount of damage (where data available)
12.6.–13.6. US
Texas
Thunderstorms, large hail, tornadoes USD 300–600m insured loss
USD 560m total damage
13.6.–21.6. China
Shantou City (Guangdong)
Tropical Storm Hagibis USD 131m total damage
14.6.–18.6. US
SD, NE, CO, MN, IA, WI, KS
Thunderstorms, 100 tornadoes and hail; large
damage from twin EF4 tornadoes from single
supercell thunderstorm in the city of Pilger
3 dead
17 injured
USD 300–600m insured loss
USD 800m total damage
24.6.–25.6. US
CO, WY
Thunderstorms, large hail, flash floods USD 100–300m insured loss
USD 270m total damage
28.6.–1.7. Canada
Saskatchewan, Manitoba
Storm bringing wind and flood damage CAD 103m (USD 89m) insured loss
CAD 200m (USD 173m) total damage
29.6.–1.7. US
IA, IL, IN, MI
Thunderstorms, tornadoes, large hail, flash
floods
USD 300–600m insured loss
USD 600m total damage
6.7.–7.7. France, Germany,
Luxembourg
Thunderstorms, heavy rains, hail, flash floods EUR 300m (USD 363m) total damage
7.7.–9.7. US
NE, CO, MO, NY, PA
Thunderstorms with winds up to 113 km/
70 miles per hour, hail, flash floods and
tornadoes; severe hail damage to corn and
soybean crops in central Nebraska (Buffalo
County)
4 dead
USD 100–300m insured loss
USD 500m total damage
8.7.–14.7. Japan
Honshu
Typhoon Neoguri 3 dead
64 injured
USD 156m total damage
15.7.–21.7. China, Philippines, Vietnam Typhoon Rammasun; more than 140 000
houses destroyed, 500 000 houses damaged
176 dead, 26 missing
125 injured
USD 250m insured loss
USD 5.15bn total damage
19.7.–20.7. China
Shaanxi, Shanxi
Thunderstorms, hail, flash floods;
over 5 000 houses destroyed
5 dead
CNY 1.7bn (USD 274m) total damage
19.7.–26.7. China, Taiwan
Fujian, Jiangxi, Shandong
(China)
Typhoon Matmo 14 dead
USD 500m total damage
26.7.–28.7. US
MI, TN, MA
Storms with winds up to 160 km/99 miles
per hours, hail, flash floods and tornadoes
USD 100–300m insured loss
USD 270m total damage
3.8.–10.8. France, Germany, Belgium,
Spain, UK
Remnants of Hurricane Bertha bring winds of
up to 128 km/80 miles per hour, tornadoes,
heavy rains, flash floods
1 dead
EUR 200m (USD 242m) total damage
4.8.–5.8. Canada
Ontario
Thunderstorms trigger flash floods 4 injured
CAD 100m (USD 87m) insured loss
CAD 150m (USD 129m) total damage
7.8.–8.8. Canada
Airdrie, Calgary (Alberta)
Thunderstorms with winds up to 94 km/
58 miles per hour, hail, flash floods
CAD 537m (USD 463m) insured loss
CAD 700m (USD 604m) total damage
10.8.–11.8. China
Xishui (Guizhou)
Thunderstorms 9 dead, 11 missing
CNY 190m (USD 31m) total damage
23.8.–24.8. Dominican Republic, Haiti,
Turks and Caicos Islands
Flooding after Tropical Storm Cristobal;
more than 1000 houses damaged
5 dead, 1 missing
4000 homeless
7.9.–8.9. US, Mexico
Phoenix (AZ), Mexico
Remnants of Hurricane Norbert bring
thunderstorms, heavy precipitation and flash
floods (8 August 2014 was the rainiest day in
Phoenix since 1895 (rainiest day on record))
6 dead
USD 25–100m insured loss
USD 325m total damage
10.9.–16.10. China, Philippines, Vietnam,
Hong Kong
Typhoon Kalmaegi 25 dead
45 injured
USD 3bn total damage
14.9.–16.9. Mexico
Cabo San Lucas (Baja
California Peninsula)
Hurricane Odile 6 dead
USD 1.7bn insured loss
MXN 48bn (USD 3.26bn) total damage
19.9.–24.9. China, Philippines, Taiwan Tropical Storm Fung-Wong 21 dead, 4 missing
USD 263m total damage
32. 30 Swiss Re sigma No 2 /2015
Tables for reporting year 2014
Date
Country
Place Event
Number of victims
Amount of damage (where data available)
25.9.–26.9. China
Gansu, Shanxi, Inner
Mongolia
Thunderstorms, hail, flash floods CNY 821m (USD 132m) total damage
27.9.–30.9. US
C0, AZ
Thunderstorms with winds up to 108 km/
67 miles per hour, large hail, flash floods
USD 600m-1bn insured loss
USD 1.4bn total damage
1.10.–3.10. US
Dallas (TX), KS
Thunderstorms with winds up to 145 km/
90 miles per hour, large hail, flash floods
USD 100–300m insured loss
USD 360m total damage
5.10.–10.10. Japan Typhoon Phanfone 6 dead, 1 missing
60 injured
USD 100m total damage
10.10. Japan, Philippines, Taiwan Typhoon Vongfong, storm surge 9 dead, 2 missing
90 injured
USD 80m total damage
12.10.–13.10. India
Visakhapatnam (Andhra
Pradesh)
Cyclone Hudhud 68 dead
43 injured
INR 40bn (USD 632m) insured loss
USD 7bn total damage
12.10.–14.10. US
LA, AL, TX
Storms with winds up to 160 km/99 miles per
hour, hail, tormadoes, straight line winds
2 dead
USD 100-300m insured loss
USD 170m total damage
15.10. Nepal
Manang, Mustang
(Himalaya mountains)
Remnants of Cyclone Hudhud cause blizzard
and massive avalanche; hikers, guides and
herders perish
43 dead, 40 missing
175 injured
17.10. Bermuda, Anguilla, Saint
Kitts and Nevis, Antigua and
Barbuda, Netherlands
Antilles
Hurricane Gonzalo (Cat 2) with winds
up to 175 km/108 miles per hour;
37 boats destroyed
2 dead, 2 missing
12 injured
USD 41m insured loss
USD 100m total damage
15.10.–28.10. Congo, Democratic Republic
of (DRC)
South Kivu Province
Thunderstorms, flash floods 30 dead
2.11.–7.11. Haiti, Dominican Republic Strong winds, heavy rains, flash floods 17 dead
4000 homeless
10.11.–14.11. China Winter storm USD 254m total damage
24.11.–25.11. Canada
Ontario, Quebec
Storm with winds up 100 km/62 miles per
hour, flooding
CAD 96m (USD 83m) insured loss
CAD 110m (USD 95m) total damage
26.11.–1.12. France
Var, Gard, Hérault, Aude,
Pyrénées Orientales
Thunderstorms, flash floods 5 dead
EUR 200m (USD 242m) insured loss
EUR 250m (USD 303m) total damage
2.12.–4.12. US
CA
Thunderstorms, heavy rainfall, flash floods,
mudslides
USD 25–100m insured loss
USD 100m total damage
5.12.–6.12. Japan
Tokushima
Winter storm, heavy snowfall 24 dead
101 injured
6.12.–10.12. Philippines
Eastern Samar
Typhoon Hagupit (Ruby); 42 466 houses
destroyed, 248 204 houses damaged
18 dead
916 injured
100 264 homeless
PHP 6.39bn (USD 143m) total damage
10.12.–12.12. US
CA, WA, OR
Thunderstorms, heavy rains, flooding 1 dead
1 injured
USD 100–300m insured loss
USD 240m total damage
12.12.–13.12. China, Russia
Northeast China and
Khabarovsk, Amnur(Russia)
Winter storm, blizzard, heavy snowfall;
over 300 houses damaged
USD 135m total damage
24.12. US
Columbia (Mississippi)
Tornado 5 dead
50 injured
28.12.–29.12. Philippines
Surigao del Sur
Tropical storm Jangmi (Seniang) causes wind
and flood damage; 610 houses destroyed,
2 687 houses damaged
66 dead, 6 missing
43 injured
PHP 1.6bn (USD 36m) total damage
33. Swiss Re sigma No 2 /2015 31
Earthquakes
Date
Country
Place Event
Number of victims
Amount of damage (where data available)
26.1.–3.2. Greece
Argostoli and Livadi
(Cephalonia Island)
Earthquakes (Mw 6.1 and Mw 6.0);
600 buildings destroyed, 2 500 buildings
damaged; also damage to roads and ports
12 injured
EUR 7m (USD 8m) insured loss
EUR 147m (USD 178m) total damage
1.2. Indonesia
Sumatra
Volcano Sinabung eruption 32 dead
12.2. China
Yutian (Xinjiang)
Earthquake (Mw 6.9); 90 000 houses damaged CNY 1.08bn (USD 174m) total damage
1.4. Chile, Peru Earthquake (Mw 8.2) 6 dead
9 injured
CLP 92.4bn (USD 152m) insured loss
CLP 347bn (USD 571m) total damage
10.4. Nicaragua
Nagarote
Earthquake (Mw 6.1); 1001 houses damaged,
landslides blocked a highway
3 dead
250 injured
USD 3m total damage
24.5. Greece, Turkey
Kamariotissa, Thessaloniki
Earthquake (Mw 6.9); 11 houses destroyed,
312 houses damaged
3 dead
324 injured
EUR 4m (USD 5m) total damage
7.7. Guatemala
San Marcos
Earthquake (6.4 Richter scale) ; 10 050 houses
damaged (of which 3 087 severely damaged)
1 dead
274 injured
9 940 homeless
3.8. China
Wenping (Yunnan)
Earthquake (Mw 6.1), aftershocks and
landslides; 25 800 houses destroyed,
40 600 houses severely damaged
617 dead, 114 missing
3 143 injured
USD 5bn total damage
18.8. Iran
Mormori (Ilam province)
Earthquake (Mw 6.2), aftershocks;
17 000 buildings damaged
250 injured
12 000 homeless
IRR 1160bn (USD 43m) total damage
24.8. US
South Napa (CA)
Earthquake (Mw 6.0); over 500 buildings
damaged; content damage to wine industry
1 dead
200 injured
USD 153m insured loss
USD 700m total damage
27.9. Japan
Honshu
Mount Ontake eruption 57 dead, 6 missing
69 injured
7.10. China
Yongping (Yunnan)
Earthquake (Mw 6.6); 6987 houses destroyed,
79 146 houses damaged
1 dead
324 injured
CNY 1.7bn (USD 274m) total damage
14.10.–22.10. Indonesia
North Sumatra
Mount Sinabung volcano activity 50 dead
22.11. China
Kangding (Sichuan)
Earthquake (Mw 5.9) 5 dead
54 injured
USD 50m total damage
6.12. China
Weiyuan
Earthquake (Mw 5.5) 1 dead
22 injured
2000 homeless
34. 32 Swiss Re sigma No 2 /2015
Tables for reporting year 2014
Droughts, bush fires, heat waves
Date
Country
Place Event
Number of victims
Amount of damage (where data available)
1.1.–30.11. Brazil Severe drought USD 3bn total damage
1.1.–30.4. Pakistan Heat wave 180 dead
1.1.–31.12. US
San Joaquin Valley, Central
Coast (California)
Drought in California USD 2.2bn total damage
13.1.–18.1. Australia
Victoria
Heatwave 139 dead
Summer China
Henan
Drought; 508 000 ha of cropland lost CNY 7.3bn (USD 1.18bn) total damage
Summer China
Liaoning
Drought; 471 000 ha of cropland lost USD 110m insured loss
USD 2.5bn total damage
12.4.–16.4. Chile
Valparaiso
Wildfires 15 dead
10 injured
8 000 homeless
USD 34m total damage
Summer China
Mongolia
Drought; 178 000 ha of cropland destroyed USD 459m total damage
1.6.–10.10. Guatemala Severe drought in Central America USD 100m total damage
31.7.–25.8. Sweden
Västmanland
Wildfires 1 dead
USD 30m insured loss
USD 100m total damage
Cold, frost
Date
Country
Place Event
Number of victims
Amount of damage (where data available)
3.1.–20.1. India Cold wave, dense fog 24 dead
23.1.–31.1. Thailand
Loei, Tak
Cold wave 63 dead
31.1.–6.2. Slovenia, Croatia
Slovenia: whole country
Croatia: Primorje-Gorski
Kotar, Karlovac, Sisak-
Moslavina, Varazdin, Zagreb
Heavy snowfall, icy rains and floods from ice
breaks cause severe forest damage; over
500 000 ha of forest destroyed or damaged
(40% of Slovenia forest resources)
EUR 721m (USD 873m) total damage
13.4.–27.9. Peru
Ancash, Apurimac,
Arequipa, Ayacucho, Cusco,
Huancavelica, Huanuco,
Junin, Lima, Moquegua,
Pasco, Puno and Tacna
Cold wave; freezing temperatures 505 dead
17.11.–19.11. US
Buffalo (NY)
Winter storm (lake-effect storm) brings heavy
snowfall; Buffalo gets 1.5 metres of snow
13 dead
USD 25-100m insured loss
USD 100m total damage
23.12.–30.12. India
Uttar Pradesh
Cold wave, icy winds, dense fog 140 dead
35. Swiss Re sigma No 2 /2015 33
Hail
Date
Country
Place Event
Number of victims
Amount of damage (where data available)
27.3.–29.3. US
TX, MO, LA
Thunderstorms, winds up to 129 km/80 miles
per hour, large hail, tornadoes; considerable
hail damage in Texas
USD 600m-1bn insured loss
USD 1bn total damage
18.5.–23.5 US
PA, CO, IL, MT, SC, IN, NY,
IA, OA, VA
Severe thunderstorms, large hail USD 2.94bn insured loss
USD 3.7bn total damage
8.6.–10.6. France, Germany, Belgium Storm Ela brings large hail in France and
Belgium, and wind damage in Germany; over
600 000 houses and 500 000 vehicles
damaged
6 dead
EUR 1.81bn (USD 2.19bn) insured loss
EUR 2.6bn (USD 3.15bn) total damage
8.7. Bulgaria
Sofia
Severe hailstorm; severe damage in Sofia,
10 000 vehicles damaged
1 dead
40 injured
EUR 60m (USD 73m) insured loss
EUR 450m (USD 545m) total damage
30.11. Australia
Brisbane
Hailstorm; 17 509 houses and 51 472 vehicles
damaged
12 injured
AUD 1.04bn (USD 852m) insured loss
AUD 1.3bn (USD 1bn) total damage
Other natural catastrophes
Date
Country
Place Event
Number of victims
Amount of damage (where data available)
22.3. US
Oso (Washington State)
Landslide 43 dead
4 injured
USD 20m total damage
13.4. Indonesia
Kediri District (Java)
Ash fall from Volcano Kelud eruption, cold lava
flooding exacerbated by concomitant rains;
11 093 houses severely damaged,
15 412 houses with moderate damage
7 dead
70 injured
USD 103m total damage
30.7. India
Malin, Pune district
(Maharashtra)
Landslide triggered by heavy rains 209 dead
2.8. Nepal
Sindhupalchowk district
Massive landslide 33 dead, 153 missing
29.10. Sri Lanka
Haldummulla (Badulla
District)
Massive landslide; 63 houses destroyed 4 dead, 192 missing
20.12. Indonesia
Banjarnegara (Java)
Landslide; over 100 houses destroyed 95 dead, 13 missing
2 000 homeless
Note: Table 8 uses loss ranges for US natural catastrophes as defined by the Property Claim Services.
Source: Swiss Re Economic Research Consulting and Cat Perils.
36. 34 Swiss Re sigma No 2 /2015
Tables for reporting year 2014
Table 9
Chronological list of all man-made disasters 2014
Major fires, explosions
Date
Country
Place Event
Number of victims
Amount of damage (where data available)
10.1. Saudi Arabia Fire at a petrochemical plant
18.1.–19.1. Norway
Laerdalsoyri
Fire destroys a historical village 50 injured
20.1. Kuwait Fire at an oil refinery
23.1. Canada
L‘Isle-Verte (Quebec)
Fire at a home for the elderly 17 dead, 15 missing
8.2. Saudi Arabia
Medina
Fire at a hotel 15 dead
130 injured
12.2. US
Connecticut
Fire at a gas turbine plant
26.2. Russia
Stavropol Krai
Fire at a petrochemical plant
9.3. South Korea Fire at an electronics plant
10.3. Sweden
Lysekil
Fire at an oil refinery
12.3. US
New York
Gas leak causes explosion in two apartment
blocks
5 dead
63 injured
17.3. North Sea, Norway Fire at an offshore pipeline
22.3.–24.3. Argentina
Mendoza
Fire at an oil plant
22.3. US
Storm Lake
Fire at a meat processing plant
29.3. South Korea Fire at an optical company
30.4. US
Pensacola (Florida)
Gas explosion in a jail 2 dead
184 injured
5.5. US
Colorado Springs
Fire at a power plant 1 injured
12.5. Germany
Hesse
Explosion at a thermal power station
28.5. South Korea
Jangseong
Fire at a hospital 21 dead
29.5. US Fire at an oil well
9.6. Thailand
Rayong
Fire at a refinery
12.6. India
Chhattisgarh
Explosion at a steel plant 6 dead
50 injured
14.6. Ghana
Sekondi-Takoradi
Damage at an oil plant
15.6. Russia
Achinsk (Krasnoyarsk Krai)
Major fire and explosion at an oil refinery 7 dead
12 injured
20.6. India
Bhatinda (Sirsa)
Fire at a refinery
25.6. Canada
Becancour
Explosion at a chemical plant 1 dead
27.6. Brazil Fire at a hydroelectric plant
28.6. India
Chennai
Eleven-storey building under construction
collapses
61 dead
27 injured
37. Swiss Re sigma No 2 /2015 35
Date
Country
Place Event
Number of victims
Amount of damage (where data available)
7.7. US
Port Arthur
Fire at a petrochemical plant 2 injured
11.7. Morocco
Casablanca
Collapse of three residential buildings 23 dead
55 injured
24.7. Angola
Luanda
Fire at a food retailer’s warehouse
31.7. Taiwan
Kaohsiung
Series of underground gas explosions in
pipelines
32 dead
321 injured
31.7. UK
Yorkshire
Fire at a power station
2.8. China
Kunshan
Explosion at a metal factory 146 dead
185 injured
8.9. Brazil
Sao Paulo
Fire destroys 600 houses (80%) in a shanty
town
2 000 homeless
9.9. Pakistan
Lahore
Roof failure at a mosque 24 dead
9.10. Saudi Arabia
Jeddah
Fire at a large bakery plant
9.10. South Africa
Kya Sands (Johannesburg)
Fire at a shanty town 8 injured
2 000 homeless
13.10. Nigeria
Lagos
Collpase of a church hostel building 115 dead
6.11. Argentina
Córdoba
Explosion at a chemicals plant 66 injured
12.11. Thailand
Pathum Thani
Fire at an electronic component plant 2 injured
16.11. Spain
Burgos
Fire at a meat processing plant
18.11. US
Los Angeles
Explosion at a wastewater plant 52 injured
8.12. US
Los Angeles
Fire at a residential building
38. 36 Swiss Re sigma No 2 /2015
Tables for reporting year 2014
Aviation disasters
Date
Country
Place Event
Number of victims
Amount of damage (where data available)
25.1. Congo, Democratic Republic
of (DRC)
Mbuji-Mayi
Explosion at arms depot triggered by lightning
strike
20 dead
50 injured
11.2. Algeria
Aïn Kercha
Algerian Air Force Lockheed C-130 Hercules
crash lands
76 dead
8.3. Indian Ocean Malaysia Airlines Boeing 777-2H6ER (Flight
MH-370) crashes in unknown circumstances
239 dead
15.4. Space Power anomaly on satellite in orbit
16.5. Space Communications satellite lost after failing to
reach orbit
17.7. Ukraine
Donetsk
Malaysia Airlines Boeing 777-2H6ER (Flight
MH17) crashes in unknown circumstances
298 dead
23.7. Taiwan
Penghu Islands
TransAsia Airways ATR 72-500 crash lands 48 dead
24.7. Mali
Gossi
Air Algérie McDonnell Douglas MD-83 crashes 116 dead
26.7. Space Failure of transmission beam on satellite in orbit
28.10. Space
Wallops Island (Virginia)
Rocket carrying supply to space station blows
up shortly after launch
31.10. US
Mojave Desert (CA)
Spacecraft crashes during test flight 1 dead
1 injured
28.12. Indonesia
Java Sea
AirAsia Airbus A320-216 crashes in Java Sea 162 dead
Maritime disasters
Date
Country
Place Event
Number of victims
Amount of damage (where data available)
13.1. Sudan
Nile
Overcrowded boat capsizes on the Nile 250 dead
26.1. Indian Ocean, India
Nicobar Islands
Boat carrying tourists capsizes 22 dead
9 injured
3.2. Bangladesh
Sunamganj
Boat carrying workers catches fire and capsizes
on Surma river
11 dead, 30 missing
10.2. Gulf of Mexico, Mexico Fire on oil rig
2.3. Indian Ocean, Indonesia
East Java
Ground subsidence causes damage to oil rig
6.3. Nigeria Fire at offshore oil rig
12.3. Indian Ocean, Yemen
Beer Ali (Shabwa)
Boat carrying migrants capsizes 43 dead
17.3. North Pacific Ocean, Japan
Tokyo Bay
Cargo vessel collides with container ship and
sinks
8 missing
1 injured
22.3. Uganda
Ndaiga (Kibaale district)
Overcrowded boat carrying refugees capsizes
on Lake Albert
251 dead
39. Swiss Re sigma No 2 /2015 37
Date
Country
Place Event
Number of victims
Amount of damage (where data available)
22.3. Gulf of Mexico, Mexico
Bay of Campeche
Blowout at oil rig
7.4. North Pacific Ocean, Japan
Wakayama
Cargo ship catches fire
16.4. North Pacific Ocean, South
Korea
Jeju
Passenger ferry sinks 297 dead, 7 missing
3.5. Bangladesh, Meghna River,
Kalagasia, Munshiganj
Ferry capsizes in rough weather 58 dead, 12 missing
5.5. Mediterranean Sea, Greece
Samos
Boat carrying migrants capsizes 22 dead
6.5. Mediterranean Sea, Libyan
Arab Jamahiriya
Tripoli
Boat carrying migrants capsizes 36 dead, 42 missing
31.5. Red Sea, Yemen, Indian
Ocean
Dhubab
Overcrowded boat carrying migrants capsizes 60 dead
18.6. North Pacific Ocean,
Malaysia
Sepang
Ferry carrying migrants capsizes 10 dead, 20 missing
30.6. Mediterranean Sea, Italy
off Sicilian coast
30 people die of asphyxia on boat carrying
migrants
30 dead
13.7. Baltic Sea, Germany Pontoon sinks and cargo value is lost overboard
14.7. Indian Ocean, Malaysia
Southern Malaysia
Boat carrying migrants capsizes 2 dead, 18 missing
19.7. Mediterranean Sea, Malta
Malta
Boat carrying migrants capsizes 29 dead
1.8. Brazil
Santos
Fire at sugar export terminal
4.8. Bangladesh
Munshiganj district
Ferry capsizes on Padma River 130 missing
22.8. Mediterranean Sea, Libyan
Arab Jamahiriya
Guarabouli
Boat carrying migrants capsizes 119 dead
23.8. Sudan
Shagarab
Boat carrying migrants capsizes on Atbara
River
21 dead
23.8. Mediterranean Sea, Italy
Mediterranean Sea
Boat carrying migrants capsizes 18 dead, 10 missing
23.8. Mediterranean Sea, Libyan
Arab Jamahiriya
North Libya
Fishing boat capsizes north of the Libyan coast
in bad weather
24 dead
12.9. Central African Republic
Bangui
Boat capsizes on M’poko River 80 missing
16.9. North Pacific Ocean,
Indonesia
North Maluku
Passenger boat capsizes in rough weather 14 dead, 7 missing
6.10.–6.12. Red Sea, Indian Ocean,
Yemen
Al-Makha (Taiz province)
Boat carrying migrants capsizes in rough
weather
70 dead
7.10. South Pacific Ocean,
Indonesia
Bali
Passenger ferry capsizes due to engine
malfunction
22 dead, 21 missing
10.10. North Atlantic, Guinea
Benty
Overcrowded boat capsizes 18 dead, 20 missing