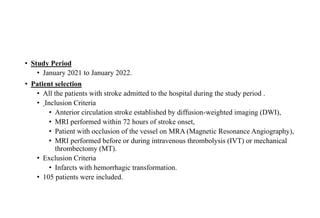
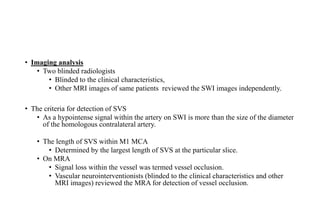
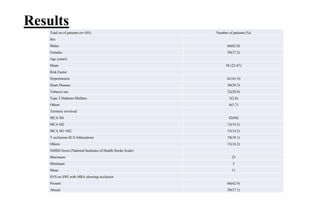
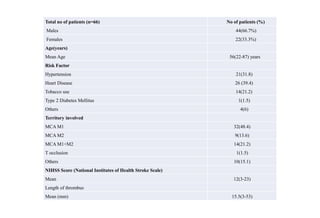
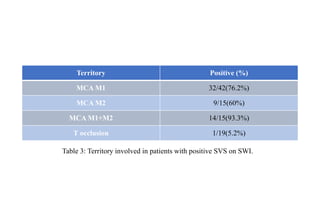
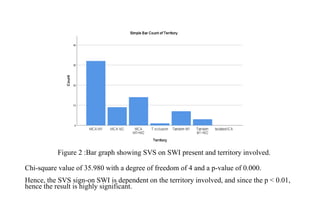
Susceptibility Vessel Sign (SVS) for Assessment
of Intra-Arterial Thrombus and Thrombus
burden in Patients with Acute Ischemic Stroke:
An Institutional Study.
Sushanta Paudel
MBBS – Final Year
NAIHS
Introduction
Susceptibility weighted
imaging (SWI) is an MRI
sequence.
•It can detect the thrombus
within the vessel in Acute
Ischemic Stroke (AIS).
Susceptibility-weighted
imaging (SWI) can detect
the thrombus within oc-
cluded arteries which
appear as hypointense
signals within the vessel,
known as “susceptibility
vessel sign” (SVS).
Thrombus in a stroke of
cardiogenic origin is
composed of mostly red
blood cells, and hence,
more commonly can be
seen as SVS on SWI.
This study is focused on
• Relation between SVS on SWI with
• Various risk factors of stroke .
• Territory involved in stroke .
• The length of thrombus (TL) with the National Institutes of Health Stroke Scale
(NIHSS) score.
Methodology
• Study Design
• Retrospective Cross Sectional Study .
• Study Site
• Department of Neuroradiology , Upendra Devokta Memorial Institute of Neurology
and Allied Sciences, Bansbari ,Kathmandu .
• With
• Prior ethical approval from the institutional review committee,
• Consent from the patient with the consent form.
• Study Period
• January 2021 to January 2022.
• Patient selection
• All the patients with stroke admitted to the hospital during the study period .
• Inclusion Criteria
• Anterior circulation stroke established by diffusion-weighted imaging (DWI),
• MRI performed within 72 hours of stroke onset,
• Patient with occlusion of the vessel on MRA (Magnetic Resonance Angiography),
• MRI performed before or during intravenous thrombolysis (IVT) or mechanical
thrombectomy (MT).
• Exclusion Criteria
• Infarcts with hemorrhagic transformation.
• 105 patients were included.
MRI Protocol
• MRI was done in 1.5T unit (Siemens, Magnetom, Essenza).
• Different parameters for SWI as follows at 1.5T
• Echo time (TE) = 40 ms,
• Repetition time (TR) = 29 ms,
• Slice thickness = 0.7 mm,
• Flip angle = 25°,
• Field of view (FOV) = 184 × 200,
• Intersection gap = 0 mm,
• Matrix size = 322 × 225.
• MRA parameters were as follows
• TR = 29 ms,
• TE = 7.15 ms,
• FOV = 168 × 200 mm,
• Slice thickness = 0.7 mm,
• Flip angle = 25°, with acquisition time of 3 minutes.
• Imaging analysis
• Two blinded radiologists
• Blinded to the clinical characteristics,
• Other MRI images of same patients reviewed the SWI images independently.
• The criteria for detection of SVS
• As a hypointense signal within the artery on SWI is more than the size of the diameter
of the homologous contralateral artery.
• The length of SVS within M1 MCA
• Determined by the largest length of SVS at the particular slice.
• On MRA
• Signal loss within the vessel was termed vessel occlusion.
• Vascular neurointerventionists (blinded to the clinical characteristics and other
MRI images) reviewed the MRA for detection of vessel occlusion.
• Statistics
• The data was analyzed in Statistical Package for Social Sciences (SPSS) software
(ver. 21; IBM, Armonk, New York).
• The statistical value was significant when as p-value was <0.05.
• A Chi-square test was done to find out the correlation between SVS on SWI with
patient risk factors and SVS on SWI with territory involved.
• The correlation was calculated between the size of the thrombus and the NIHSS score.
Results
Table 1: Demographics of all the patients included in study.
Total no of patients (n=105) Number of patients (%)
Sex
Males 66(62.8)
Females 39(37.2)
Age (years)
Mean 58 (22-87)
Risk Factor
Hypertension 44 (41.9)
Heart Disease 30(28.5)
Tobacco use 22(20.9)
Type 2 Diabetes Mellitus 3(2.8)
Others 6(5.7)
Territory involved
MCA M1 42(40)
MCA M2 15(14.2)
MCA M1+M2 15(14.2)
T occlusion (ICA bifurcation) 19(18.1)
Others 15(14.2)
NIHSS Score (National Institutes of Health Stroke Scale)
Maximum 23
Minimum 2
Mean 11
SVS on SWI with MRA showing occlusion
Present 66(62.9)
Absent 39(37.1)
Table 2: Demographics of the Patients with SVS positive on SWI.
Total no of patients (n=66) No of patients (%)
Males 44(66.7%)
Females 22(33.3%)
Age(years)
Mean Age 56(22-87) years
Risk Factor
Hypertension 21(31.8)
Heart Disease 26 (39.4)
Tobacco use 14(21.2)
Type 2 Diabetes Mellitus 1(1.5)
Others 4(6)
Territory involved
MCA M1 32(48.4)
MCA M2 9(13.6)
MCA M1+M2 14(21.2)
T occlusion 1(1.5)
Others 10(15.1)
NIHSS Score (National Institutes of Health Stroke Scale)
Mean 12(3-23)
Length of thrombus
Mean (mm) 15.5(3-53)
Figure 1: Bar diagram showing association of SVS on SWI with risk factor.
There was a positive correlation between SVS on SWI with the risk factor of the patient.
Hence, SVS on SWI can be dependent on risk factors in those patients.
Table 3: Territory involved in patients with positive SVS on SWI.
Territory Positive (%)
MCA M1 32/42(76.2%)
MCA M2 9/15(60%)
MCA M1+M2 14/15(93.3%)
T occlusion 1/19(5.2%)
Figure 2 :Bar graph showing SVS on SWI present and territory involved.
Chi-square value of 35.980 with a degree of freedom of 4 and a p-value of 0.000.
Hence, the SVS sign-on SWI is dependent on the territory involved, and since the p < 0.01,
hence the result is highly significant.
Figure 3: Relation of Length with NIHSS score
Pearson correlation coefficient of 0.367 and a p-value of 0.002
There was a moderate correlation between the length of thrombus and NIHSS score.
Figure 4. (A) MR angiography (MRA) shows occlusion in distal ICA and left MCA
segments.
(B)Susceptibility-weighted imaging (SWI) shows susceptibility vessel sign (SVS)
in M1 and M2 segments of left middle cerebral artery (MCA).
(C) MR angiography (MRA) shows occlusion in M1 segment of right MCA.
(D) SWI shows SVS in distal M1 and M2 segments of right MCA.
Discussion
• Susceptibility weighted imaging (SWI), has a better sensitivity than the T2* sequence for
the detection of blood products.
• In our study, SVS was seen in 62.8% of patients who had positive occlusion on MR
angiography.
• SVS can be seen in 50% to 85% of cases of hyperacute stroke, predominantly in RBC-rich
thrombus, whereas a lack of SVS is an indicator for fibrin-rich thrombus.(Bourcier et.al )
• Our result concluded that the SVS sign-on SWI is dependent on the territory of the artery
involved.
• In a similar study conducted by Bourcier et al. where 100 out of 143 (69.9%) patients
were found to have positive SVS with occlusion on MCA M1 territory.
• There was a significant association between SVS on SWI with cardiac disease.
• A similar observation was observed where SVS was frequently associated with
cardioembolic stroke (77.5%) vs stroke of other etiology (25.5%) with p<0.001.(Jiang HF
et al.)
• There was a moderate correlation between the NIHSS score and the length of the
thrombus in determining the acute stroke burden.
• Similar findings were also observed in the study by Zheng et al. where susceptibility was
positively correlated with admission to NIHSS.
Limitations
• It was a retrospective study with a small sample size.
• All patients were studied in 1.5T MRI, hence we were unable to compare the incidence of
SVS in higher field strength of 3T MRI.
• SVS has not been assessed in patients with MRA negative strokes.
• We did not assess the SVS in the posterior circulation and after treatment in stroke.
Conclusion
• SWI can be useful in identifying the location of the thrombus.
• SWI can help to determine the thrombus length in the cases of acute stroke.
• A higher incidence of SVS can be associated with risk factors and also depends upon the
site of occlusion of the vessel.
• A higher length of SVS can be associated with early neurologic deterioration.
Authors
• Subash Phuyal,1
• Sushanta Paudel, 2
• Sadina Shrestha, 1
• Prity Agrawal, 1
• Anzil Maharjan, 1
• Ghanashyam Kharel.1
1Upendra Devkota Memorial National Institute of Neurological and Allied Sciences.
2Nepalese Army Institute of Health Sciences, Kathmandu, Nepal.
THANK YOU.

SWI presentation.pptx

  • 1.
    Susceptibility Vessel Sign(SVS) for Assessment of Intra-Arterial Thrombus and Thrombus burden in Patients with Acute Ischemic Stroke: An Institutional Study. Sushanta Paudel MBBS – Final Year NAIHS
  • 2.
    Introduction Susceptibility weighted imaging (SWI)is an MRI sequence. •It can detect the thrombus within the vessel in Acute Ischemic Stroke (AIS). Susceptibility-weighted imaging (SWI) can detect the thrombus within oc- cluded arteries which appear as hypointense signals within the vessel, known as “susceptibility vessel sign” (SVS). Thrombus in a stroke of cardiogenic origin is composed of mostly red blood cells, and hence, more commonly can be seen as SVS on SWI.
  • 3.
    This study isfocused on • Relation between SVS on SWI with • Various risk factors of stroke . • Territory involved in stroke . • The length of thrombus (TL) with the National Institutes of Health Stroke Scale (NIHSS) score.
  • 4.
    Methodology • Study Design •Retrospective Cross Sectional Study . • Study Site • Department of Neuroradiology , Upendra Devokta Memorial Institute of Neurology and Allied Sciences, Bansbari ,Kathmandu . • With • Prior ethical approval from the institutional review committee, • Consent from the patient with the consent form.
  • 5.
    • Study Period •January 2021 to January 2022. • Patient selection • All the patients with stroke admitted to the hospital during the study period . • Inclusion Criteria • Anterior circulation stroke established by diffusion-weighted imaging (DWI), • MRI performed within 72 hours of stroke onset, • Patient with occlusion of the vessel on MRA (Magnetic Resonance Angiography), • MRI performed before or during intravenous thrombolysis (IVT) or mechanical thrombectomy (MT). • Exclusion Criteria • Infarcts with hemorrhagic transformation. • 105 patients were included.
  • 6.
    MRI Protocol • MRIwas done in 1.5T unit (Siemens, Magnetom, Essenza). • Different parameters for SWI as follows at 1.5T • Echo time (TE) = 40 ms, • Repetition time (TR) = 29 ms, • Slice thickness = 0.7 mm, • Flip angle = 25°, • Field of view (FOV) = 184 × 200, • Intersection gap = 0 mm, • Matrix size = 322 × 225. • MRA parameters were as follows • TR = 29 ms, • TE = 7.15 ms, • FOV = 168 × 200 mm, • Slice thickness = 0.7 mm, • Flip angle = 25°, with acquisition time of 3 minutes.
  • 7.
    • Imaging analysis •Two blinded radiologists • Blinded to the clinical characteristics, • Other MRI images of same patients reviewed the SWI images independently. • The criteria for detection of SVS • As a hypointense signal within the artery on SWI is more than the size of the diameter of the homologous contralateral artery. • The length of SVS within M1 MCA • Determined by the largest length of SVS at the particular slice. • On MRA • Signal loss within the vessel was termed vessel occlusion. • Vascular neurointerventionists (blinded to the clinical characteristics and other MRI images) reviewed the MRA for detection of vessel occlusion.
  • 8.
    • Statistics • Thedata was analyzed in Statistical Package for Social Sciences (SPSS) software (ver. 21; IBM, Armonk, New York). • The statistical value was significant when as p-value was <0.05. • A Chi-square test was done to find out the correlation between SVS on SWI with patient risk factors and SVS on SWI with territory involved. • The correlation was calculated between the size of the thrombus and the NIHSS score.
  • 9.
    Results Table 1: Demographicsof all the patients included in study. Total no of patients (n=105) Number of patients (%) Sex Males 66(62.8) Females 39(37.2) Age (years) Mean 58 (22-87) Risk Factor Hypertension 44 (41.9) Heart Disease 30(28.5) Tobacco use 22(20.9) Type 2 Diabetes Mellitus 3(2.8) Others 6(5.7) Territory involved MCA M1 42(40) MCA M2 15(14.2) MCA M1+M2 15(14.2) T occlusion (ICA bifurcation) 19(18.1) Others 15(14.2) NIHSS Score (National Institutes of Health Stroke Scale) Maximum 23 Minimum 2 Mean 11 SVS on SWI with MRA showing occlusion Present 66(62.9) Absent 39(37.1)
  • 10.
    Table 2: Demographicsof the Patients with SVS positive on SWI. Total no of patients (n=66) No of patients (%) Males 44(66.7%) Females 22(33.3%) Age(years) Mean Age 56(22-87) years Risk Factor Hypertension 21(31.8) Heart Disease 26 (39.4) Tobacco use 14(21.2) Type 2 Diabetes Mellitus 1(1.5) Others 4(6) Territory involved MCA M1 32(48.4) MCA M2 9(13.6) MCA M1+M2 14(21.2) T occlusion 1(1.5) Others 10(15.1) NIHSS Score (National Institutes of Health Stroke Scale) Mean 12(3-23) Length of thrombus Mean (mm) 15.5(3-53)
  • 11.
    Figure 1: Bardiagram showing association of SVS on SWI with risk factor. There was a positive correlation between SVS on SWI with the risk factor of the patient. Hence, SVS on SWI can be dependent on risk factors in those patients.
  • 12.
    Table 3: Territoryinvolved in patients with positive SVS on SWI. Territory Positive (%) MCA M1 32/42(76.2%) MCA M2 9/15(60%) MCA M1+M2 14/15(93.3%) T occlusion 1/19(5.2%)
  • 13.
    Figure 2 :Bargraph showing SVS on SWI present and territory involved. Chi-square value of 35.980 with a degree of freedom of 4 and a p-value of 0.000. Hence, the SVS sign-on SWI is dependent on the territory involved, and since the p < 0.01, hence the result is highly significant.
  • 14.
    Figure 3: Relationof Length with NIHSS score Pearson correlation coefficient of 0.367 and a p-value of 0.002 There was a moderate correlation between the length of thrombus and NIHSS score.
  • 15.
    Figure 4. (A)MR angiography (MRA) shows occlusion in distal ICA and left MCA segments. (B)Susceptibility-weighted imaging (SWI) shows susceptibility vessel sign (SVS) in M1 and M2 segments of left middle cerebral artery (MCA). (C) MR angiography (MRA) shows occlusion in M1 segment of right MCA. (D) SWI shows SVS in distal M1 and M2 segments of right MCA.
  • 16.
    Discussion • Susceptibility weightedimaging (SWI), has a better sensitivity than the T2* sequence for the detection of blood products. • In our study, SVS was seen in 62.8% of patients who had positive occlusion on MR angiography. • SVS can be seen in 50% to 85% of cases of hyperacute stroke, predominantly in RBC-rich thrombus, whereas a lack of SVS is an indicator for fibrin-rich thrombus.(Bourcier et.al ) • Our result concluded that the SVS sign-on SWI is dependent on the territory of the artery involved. • In a similar study conducted by Bourcier et al. where 100 out of 143 (69.9%) patients were found to have positive SVS with occlusion on MCA M1 territory.
  • 17.
    • There wasa significant association between SVS on SWI with cardiac disease. • A similar observation was observed where SVS was frequently associated with cardioembolic stroke (77.5%) vs stroke of other etiology (25.5%) with p<0.001.(Jiang HF et al.) • There was a moderate correlation between the NIHSS score and the length of the thrombus in determining the acute stroke burden. • Similar findings were also observed in the study by Zheng et al. where susceptibility was positively correlated with admission to NIHSS.
  • 18.
    Limitations • It wasa retrospective study with a small sample size. • All patients were studied in 1.5T MRI, hence we were unable to compare the incidence of SVS in higher field strength of 3T MRI. • SVS has not been assessed in patients with MRA negative strokes. • We did not assess the SVS in the posterior circulation and after treatment in stroke.
  • 19.
    Conclusion • SWI canbe useful in identifying the location of the thrombus. • SWI can help to determine the thrombus length in the cases of acute stroke. • A higher incidence of SVS can be associated with risk factors and also depends upon the site of occlusion of the vessel. • A higher length of SVS can be associated with early neurologic deterioration.
  • 20.
    Authors • Subash Phuyal,1 •Sushanta Paudel, 2 • Sadina Shrestha, 1 • Prity Agrawal, 1 • Anzil Maharjan, 1 • Ghanashyam Kharel.1 1Upendra Devkota Memorial National Institute of Neurological and Allied Sciences. 2Nepalese Army Institute of Health Sciences, Kathmandu, Nepal.
  • 21.