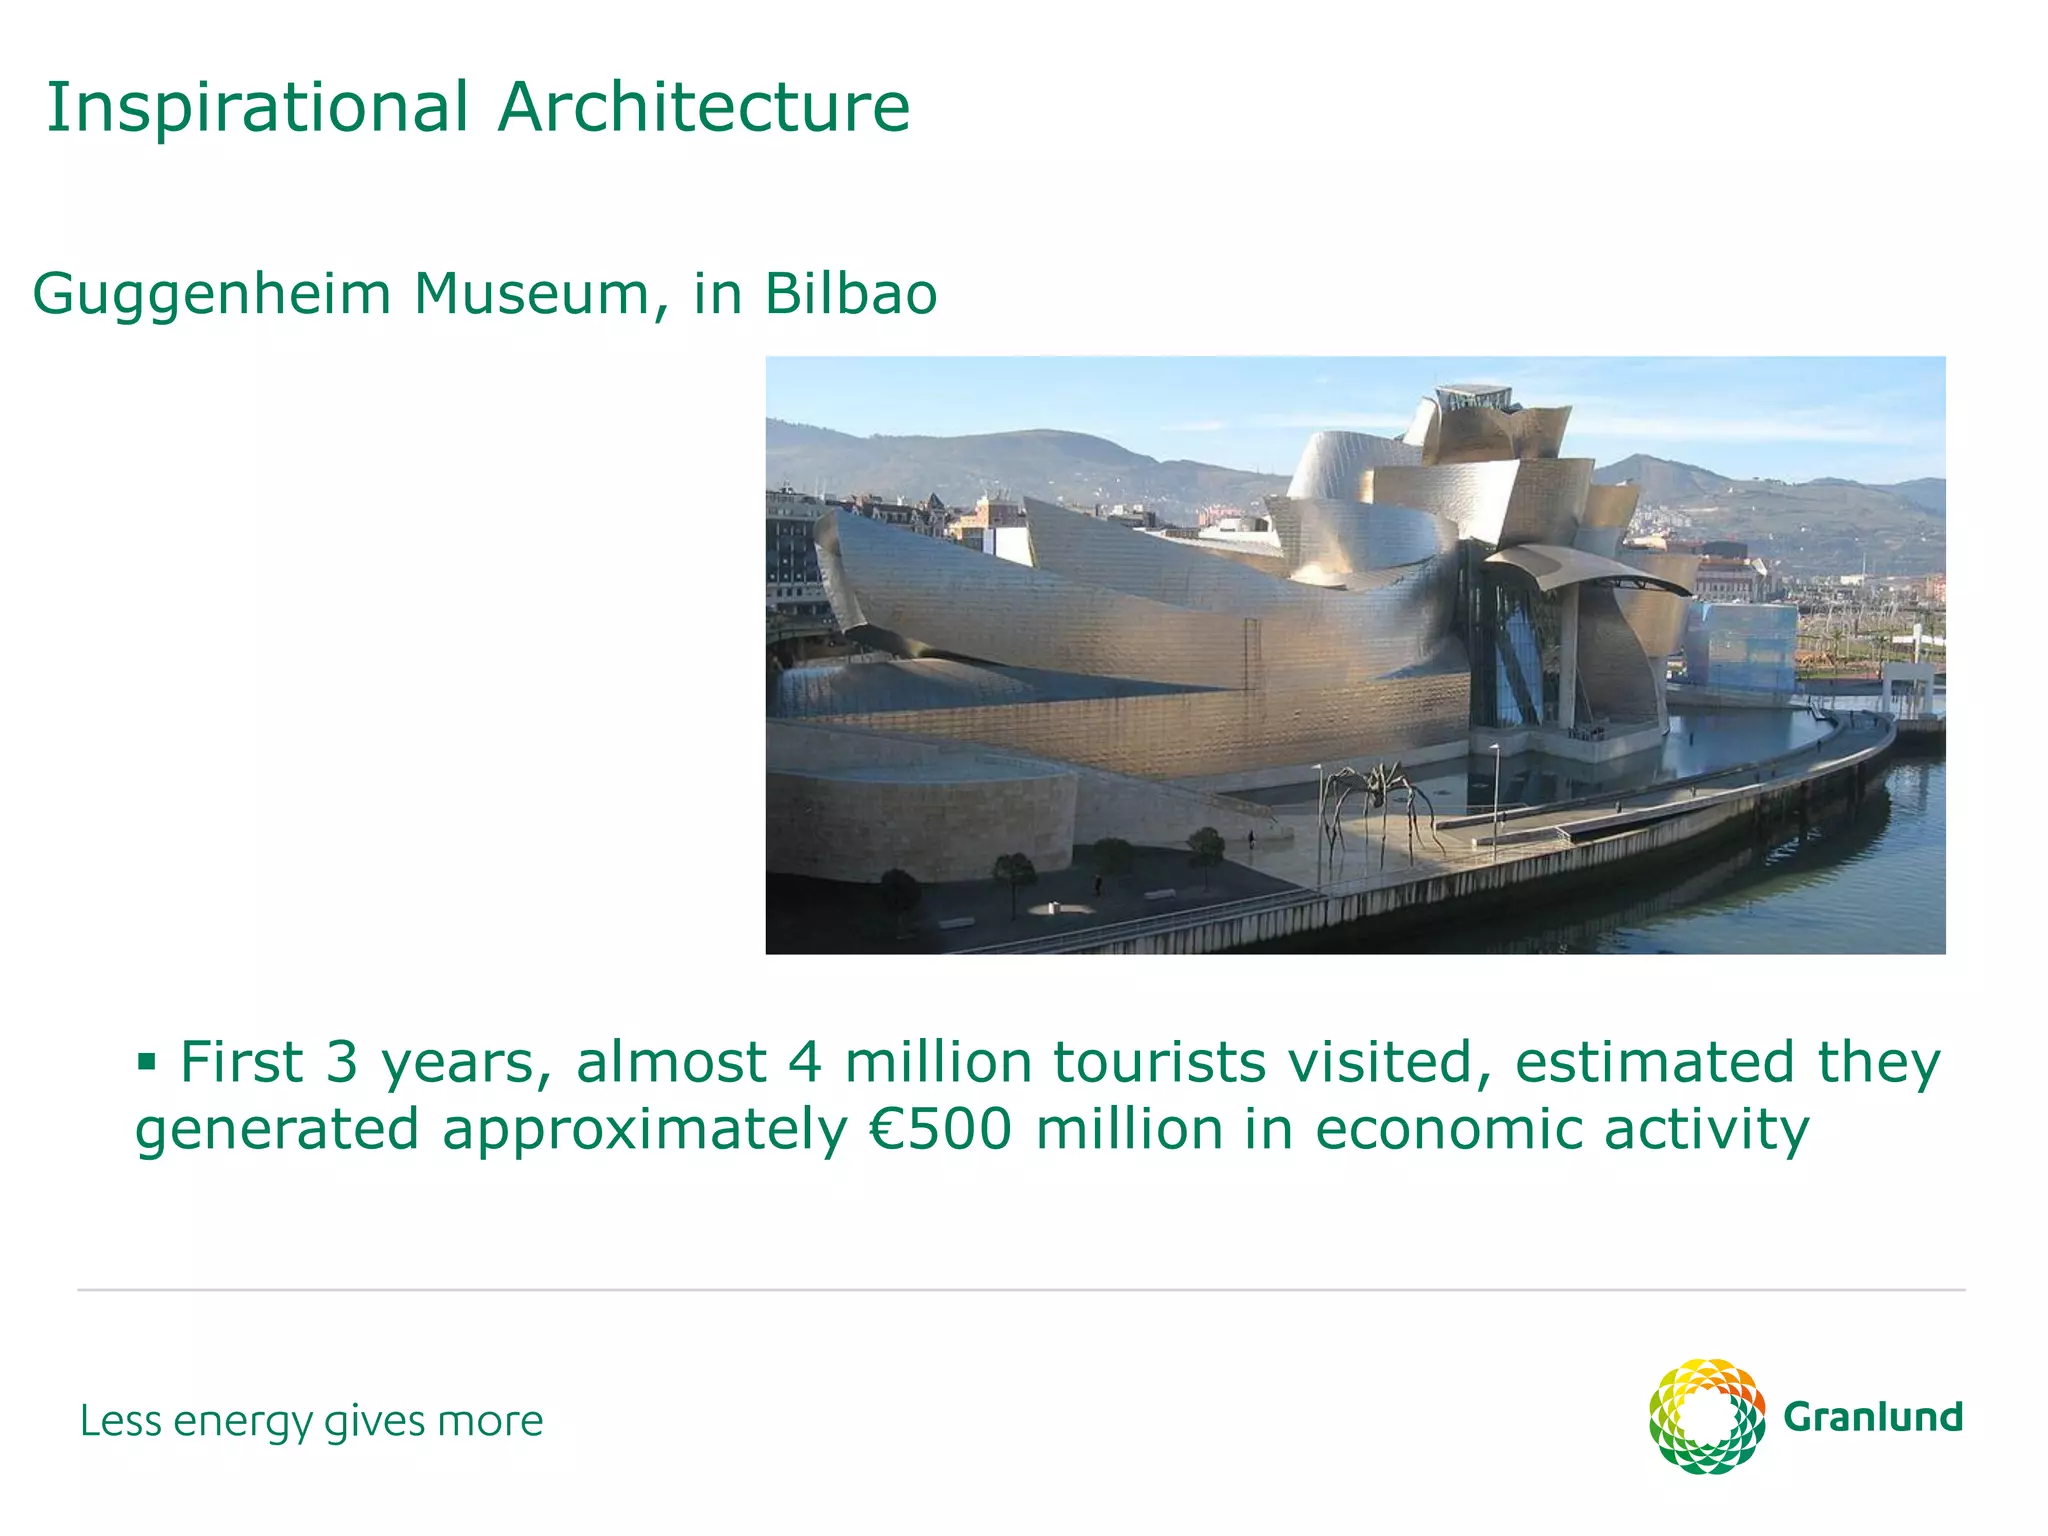
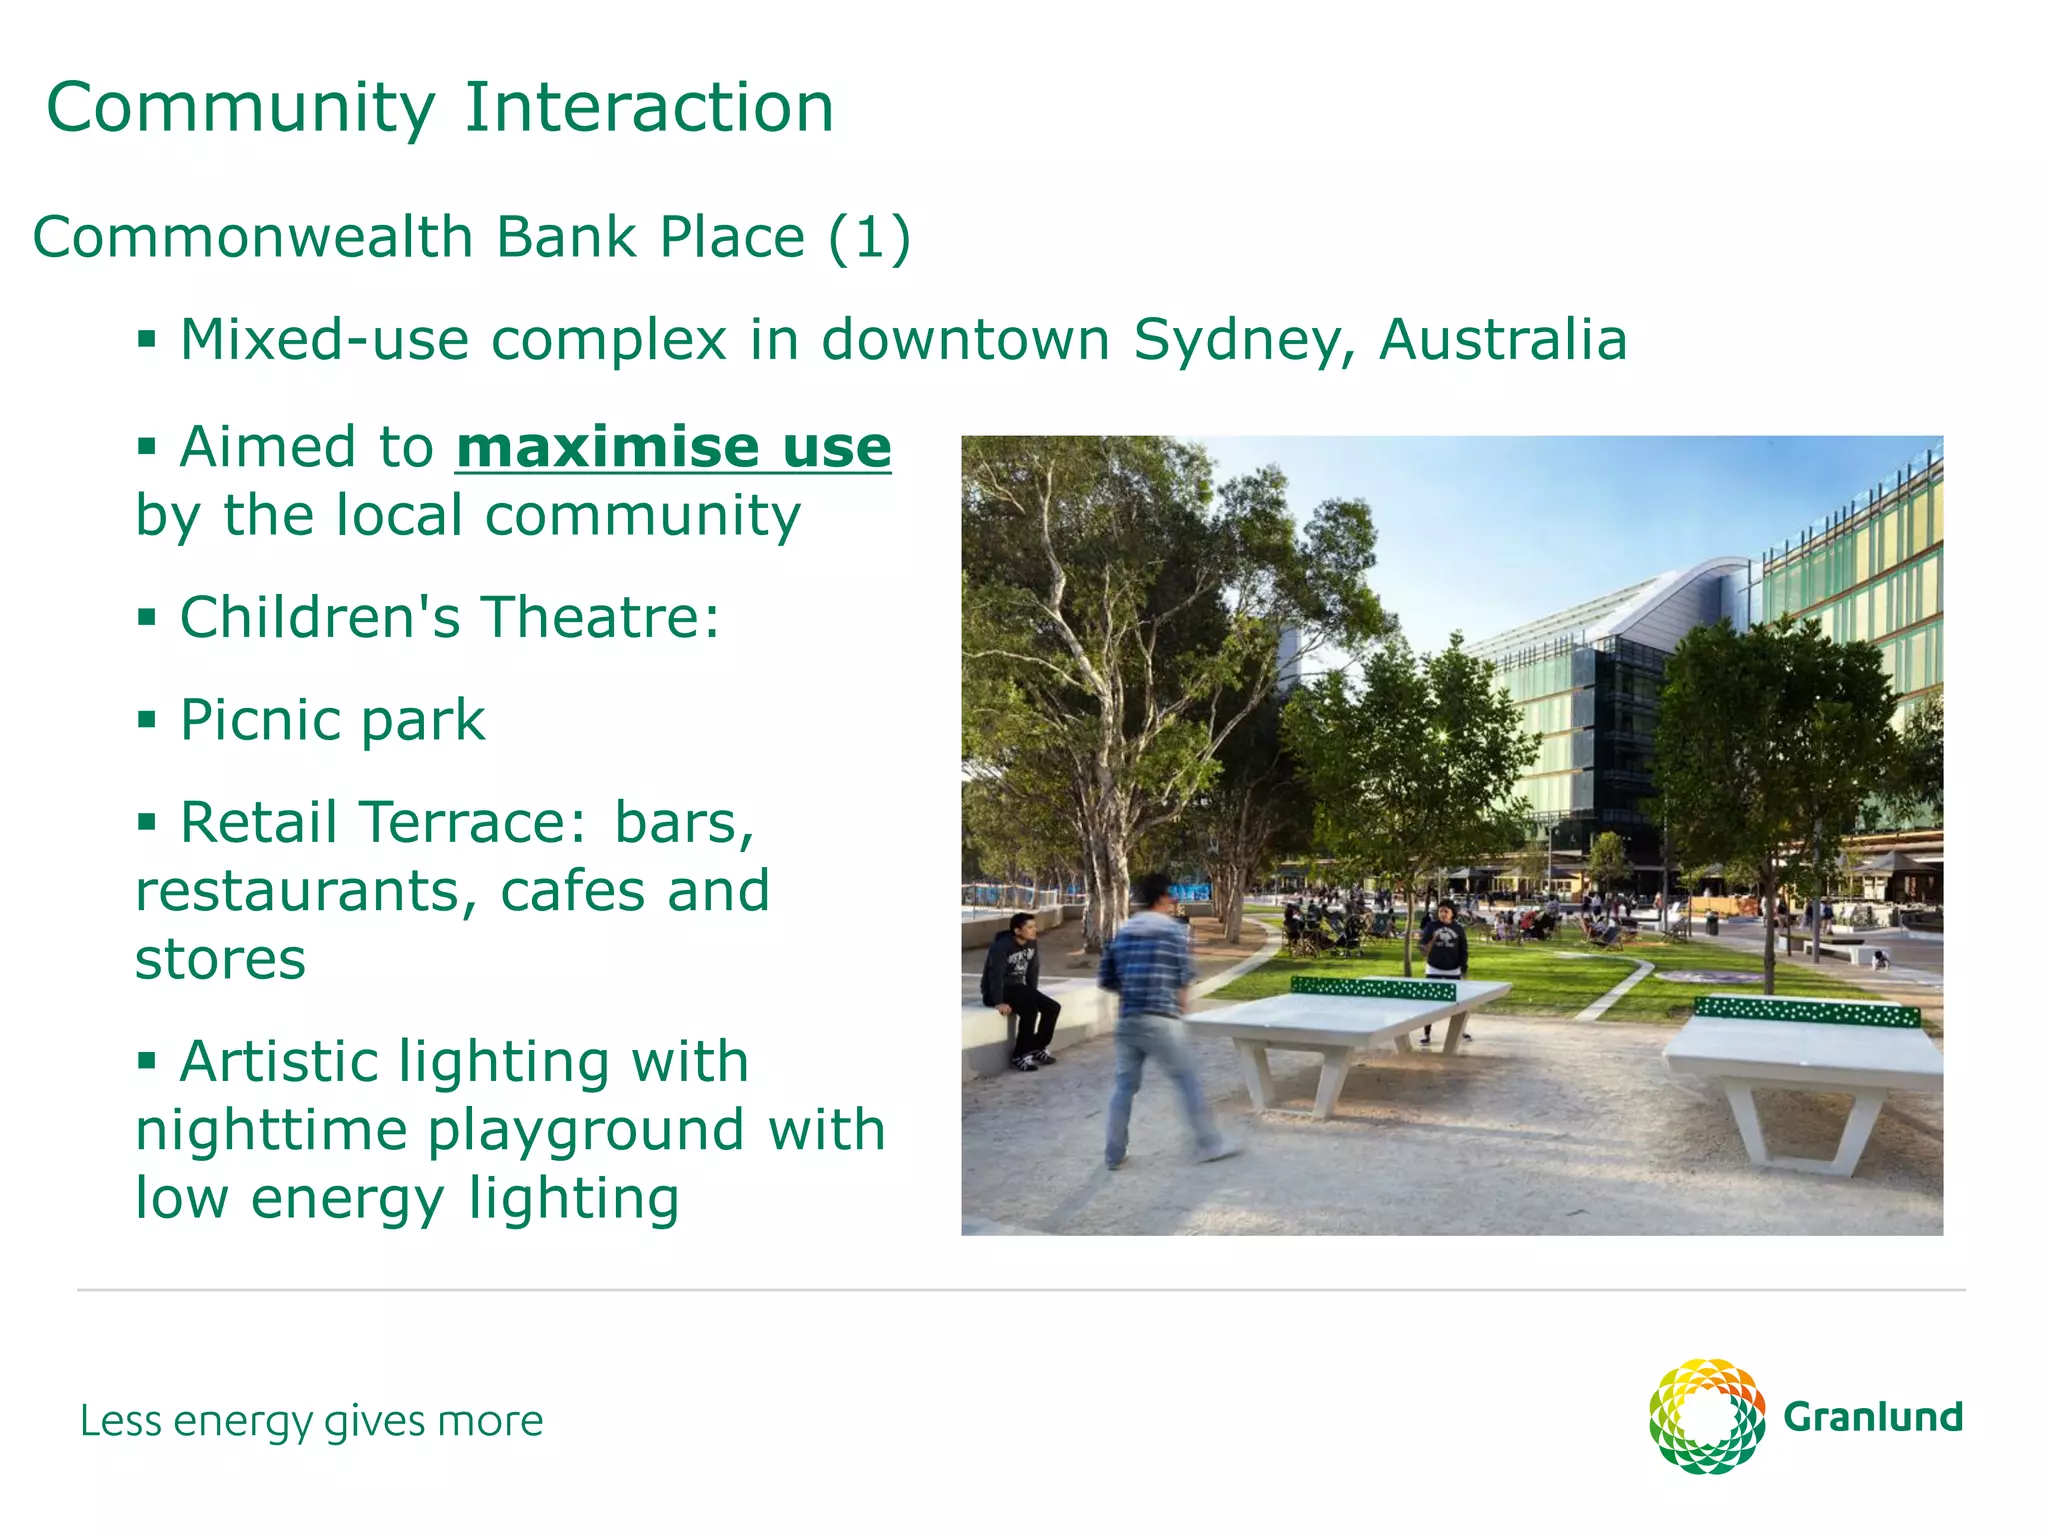
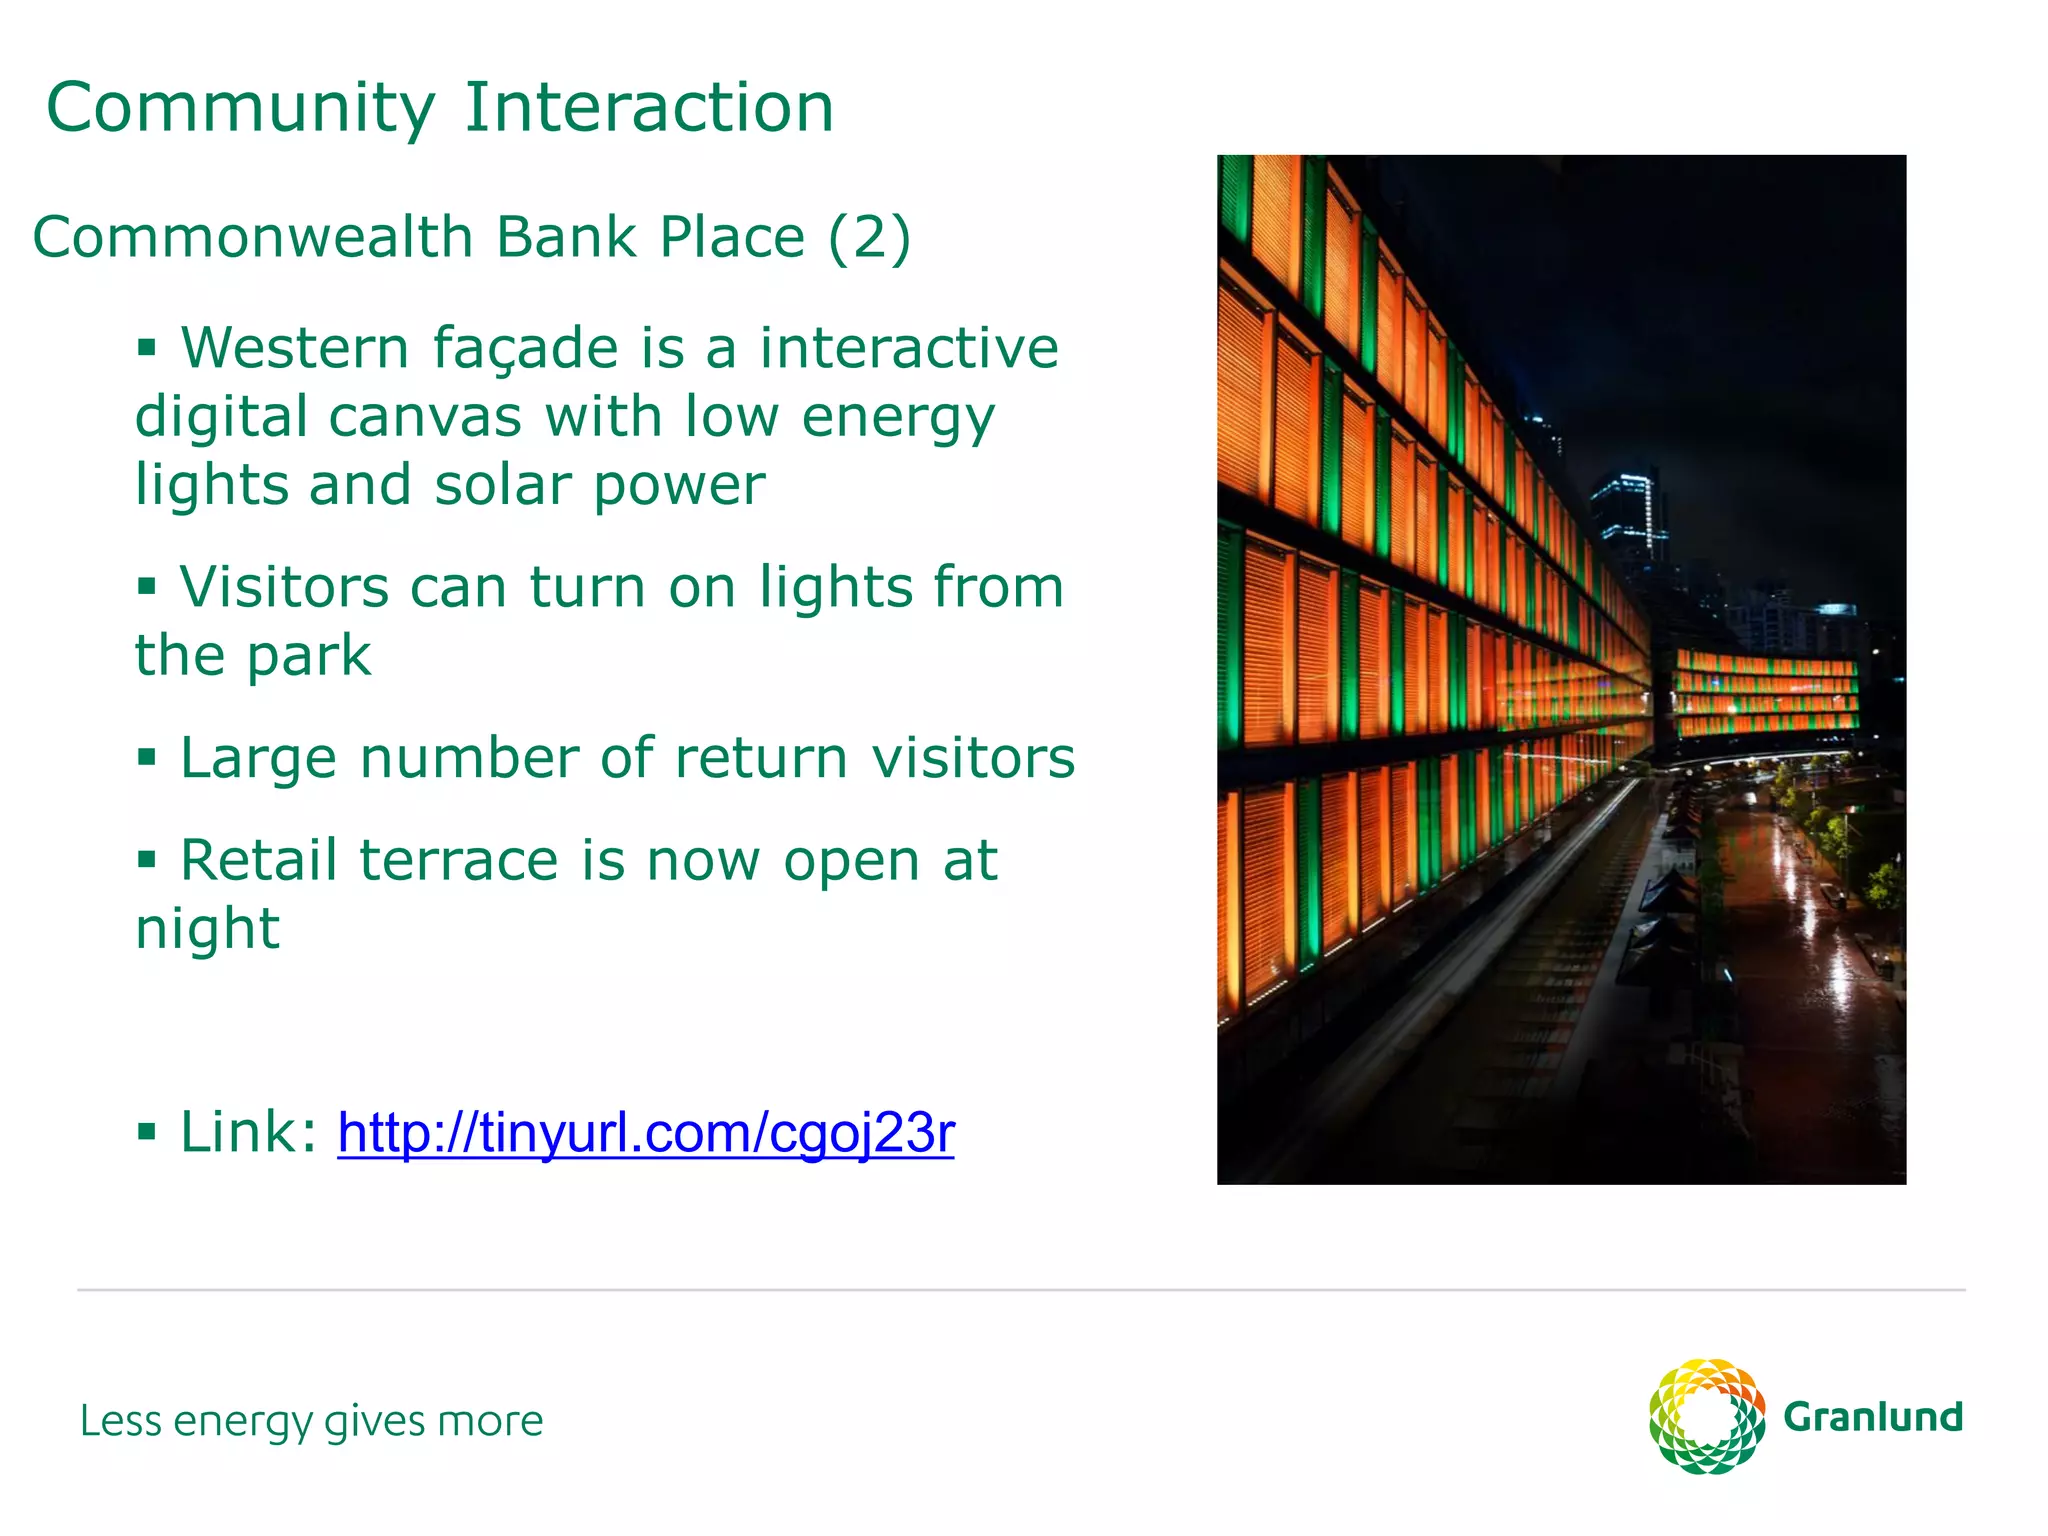
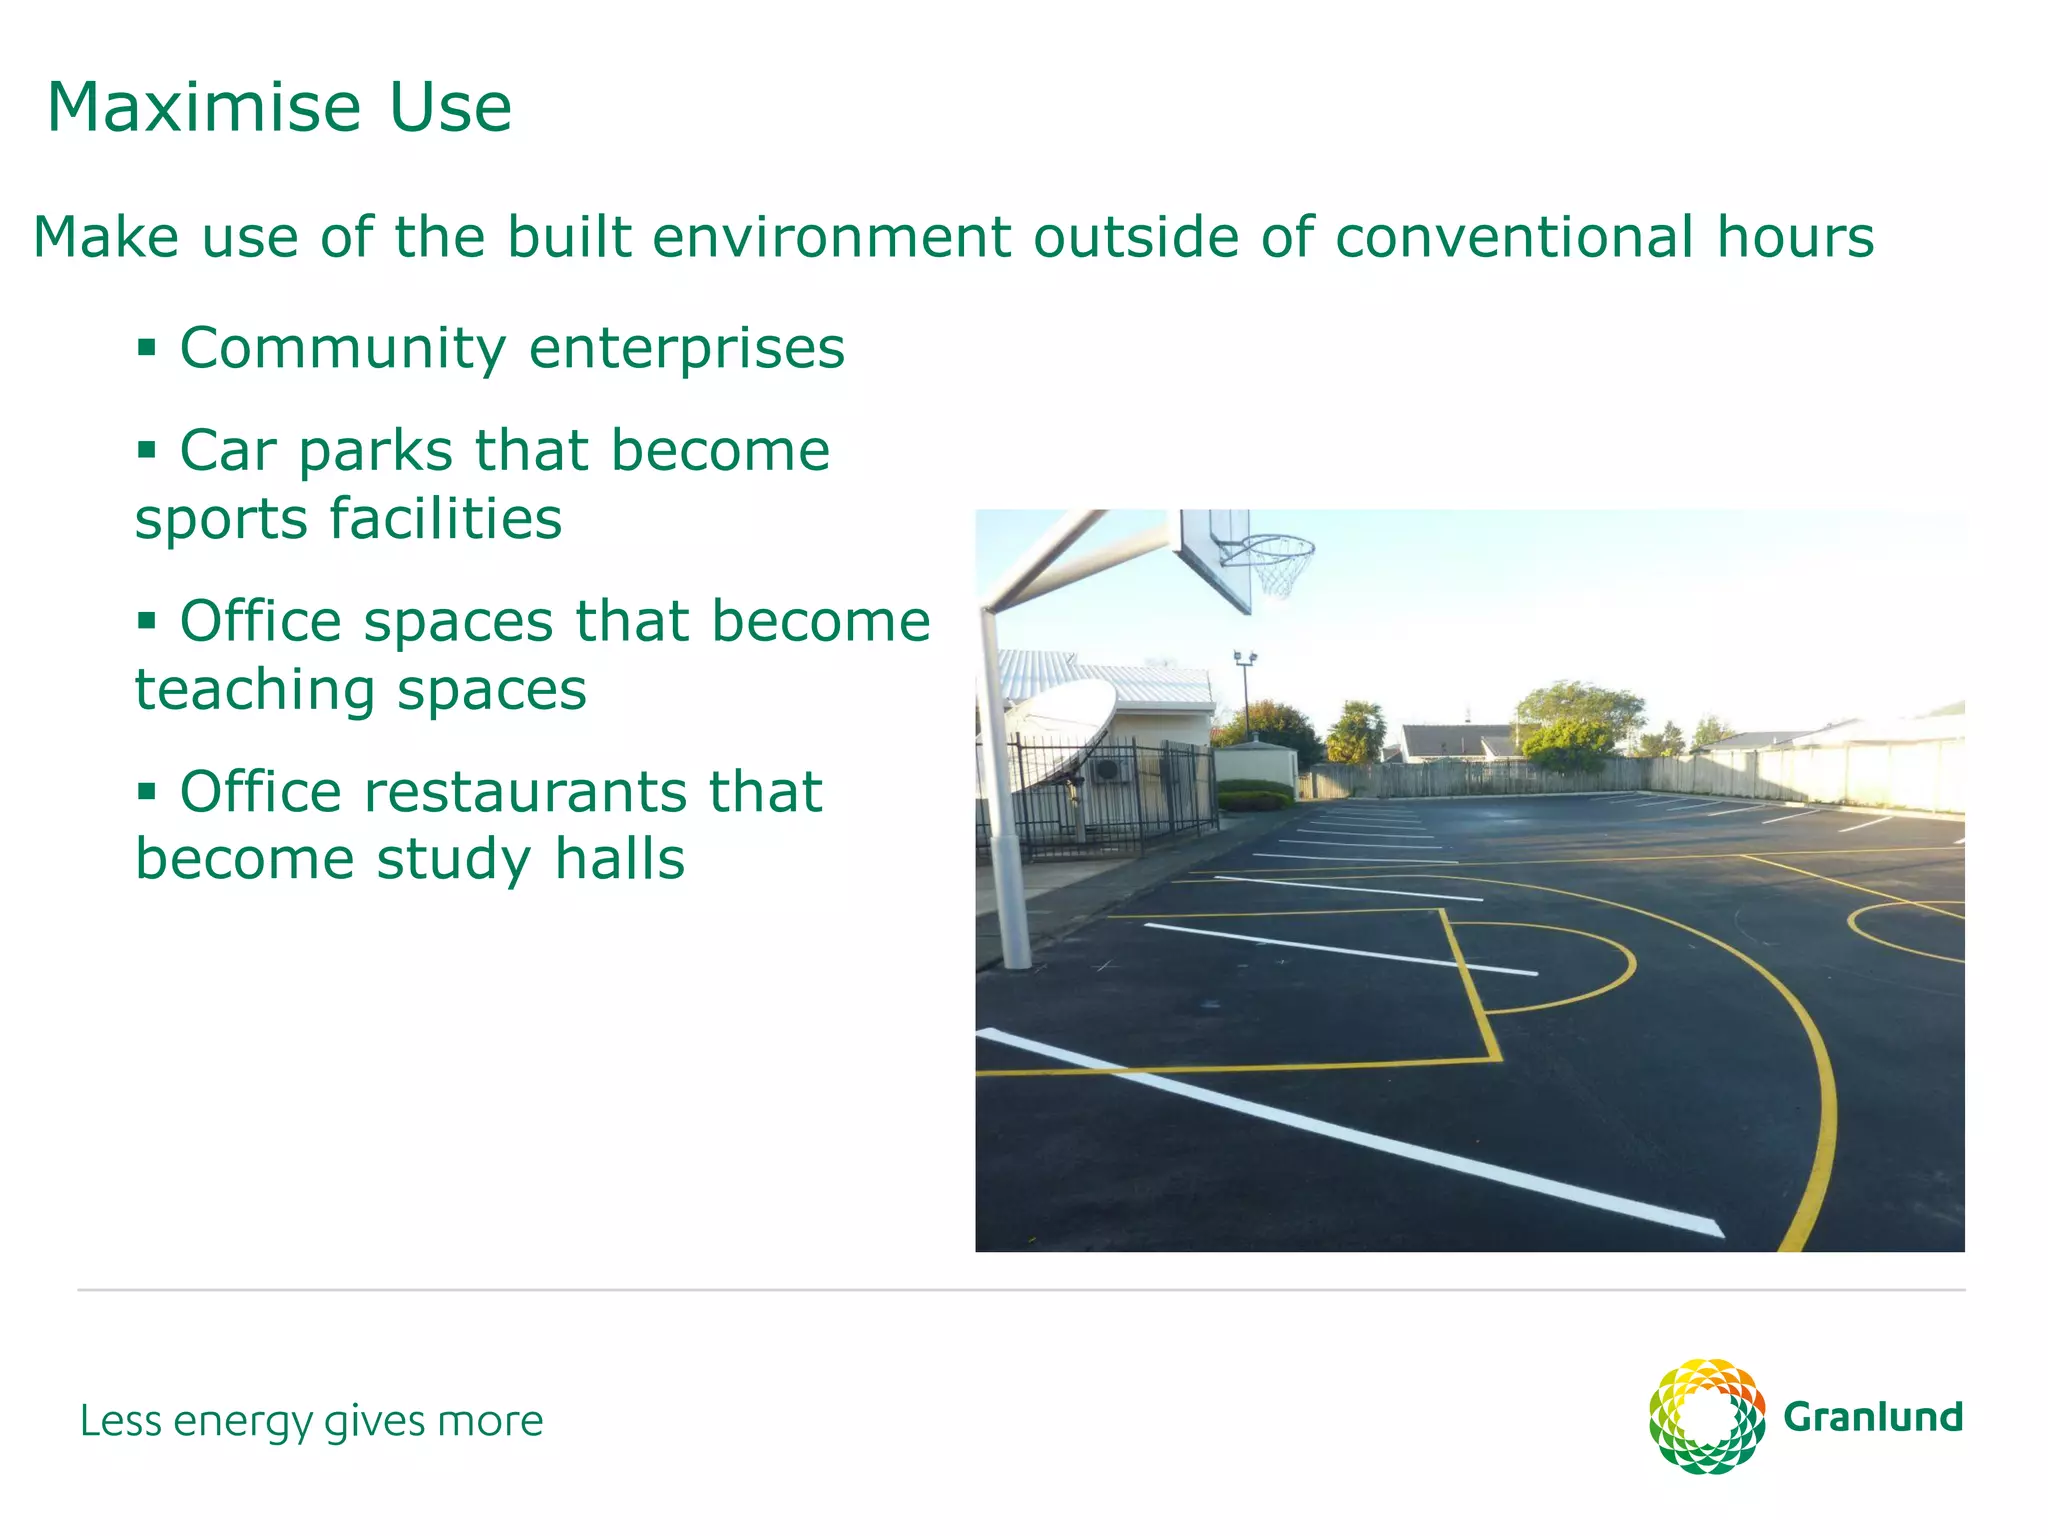
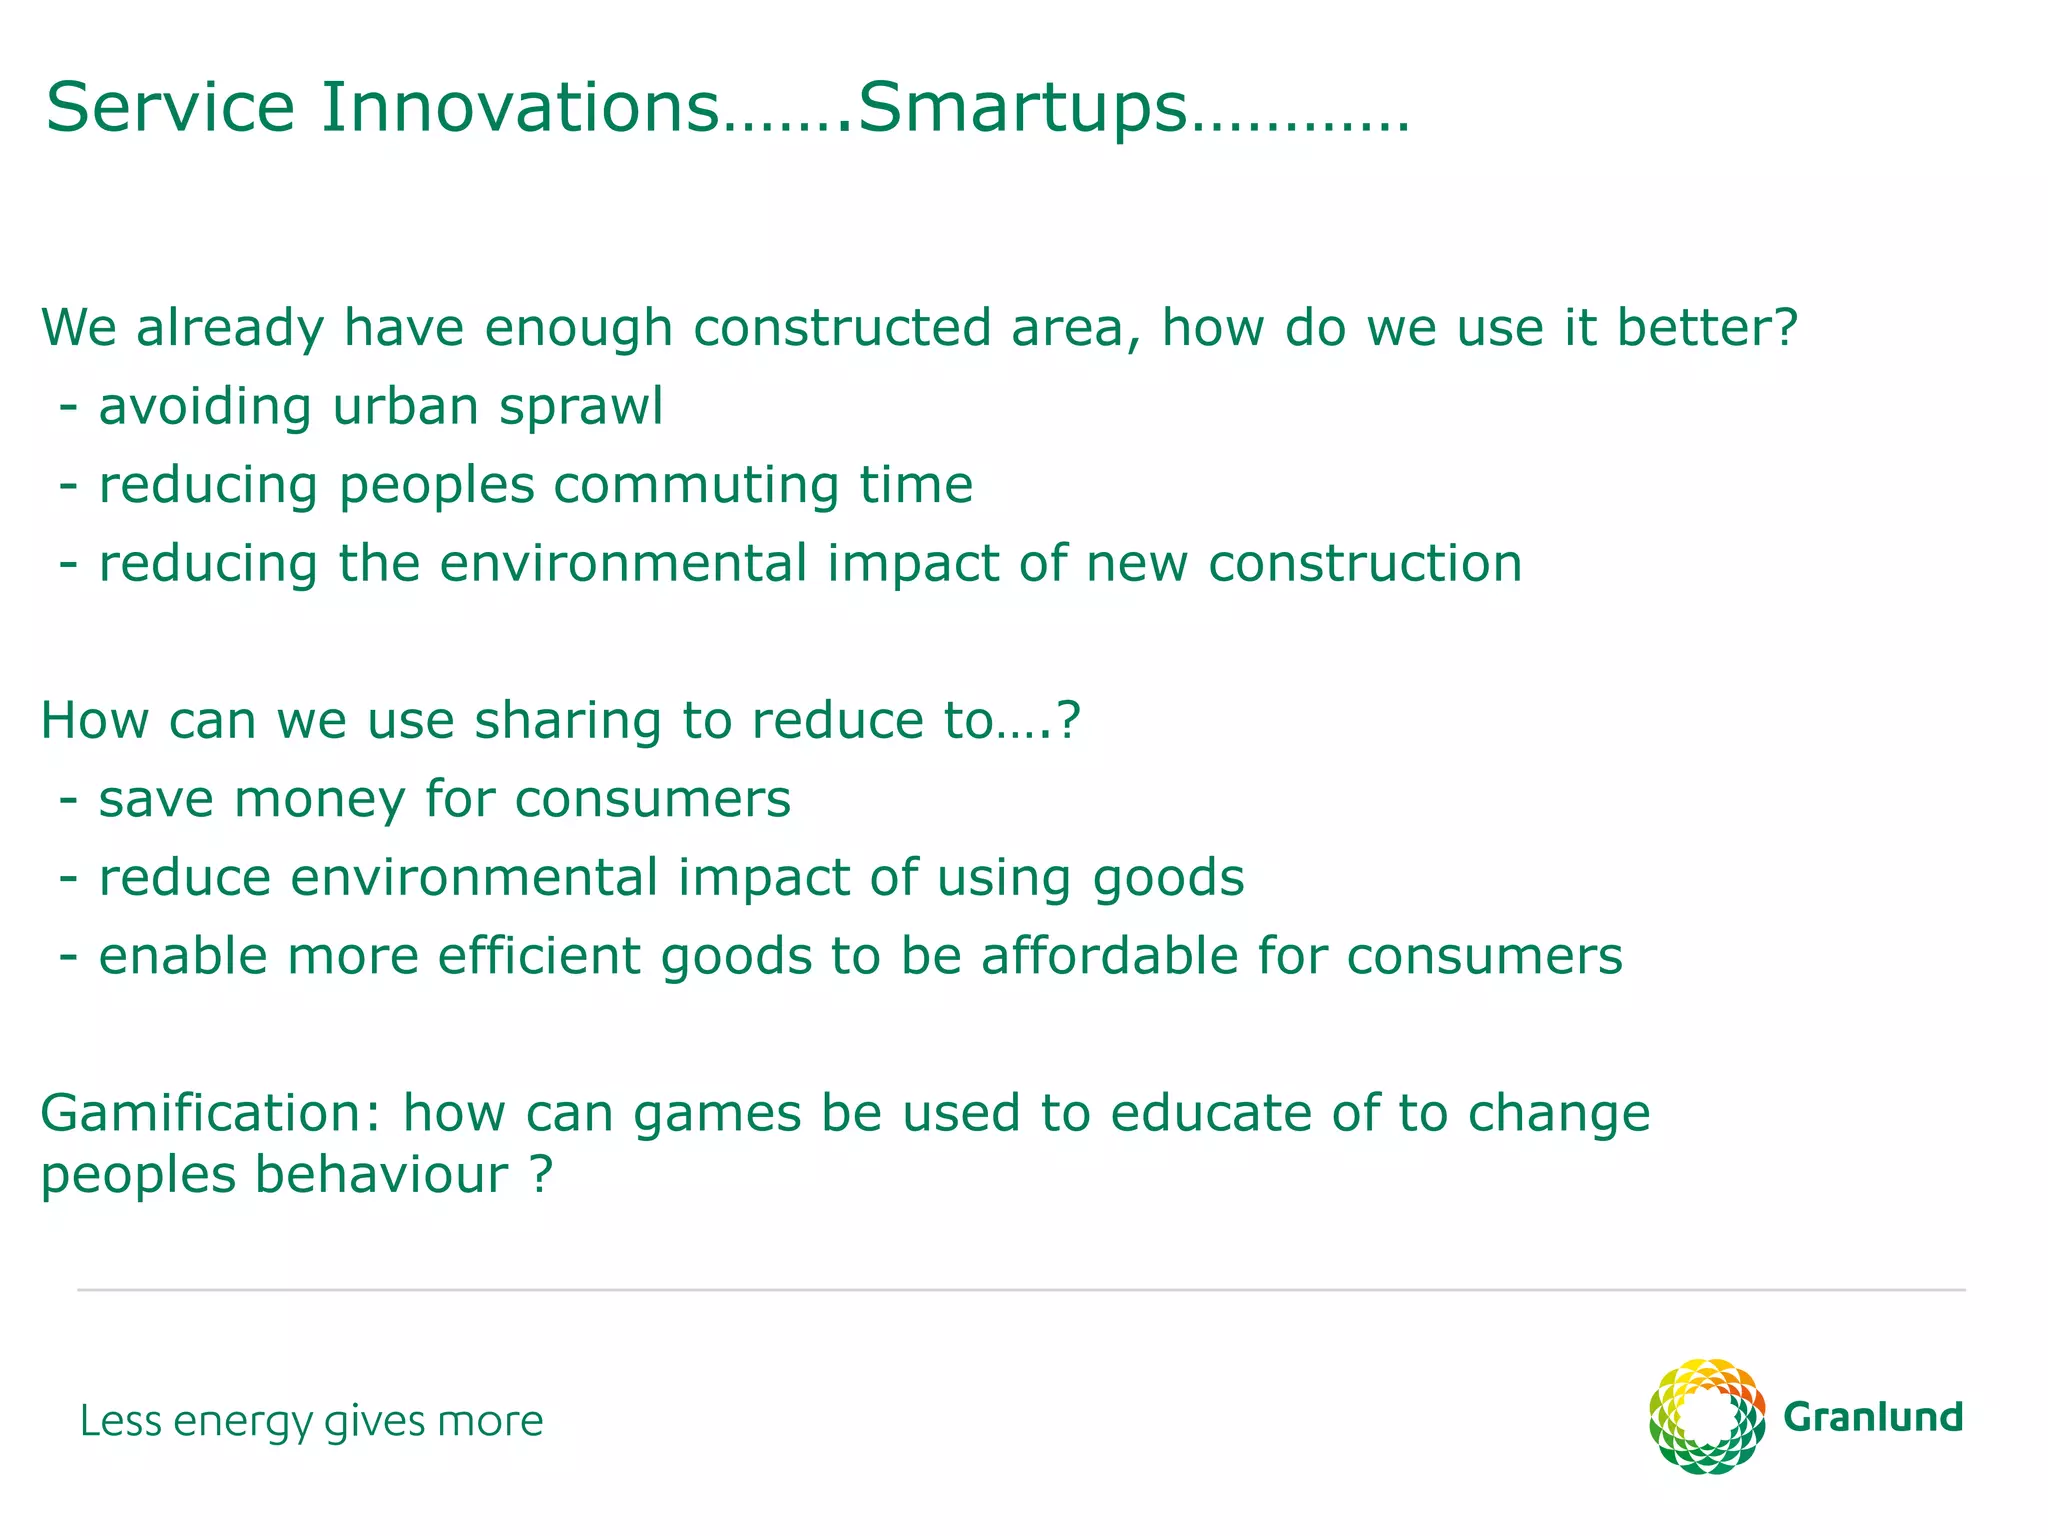
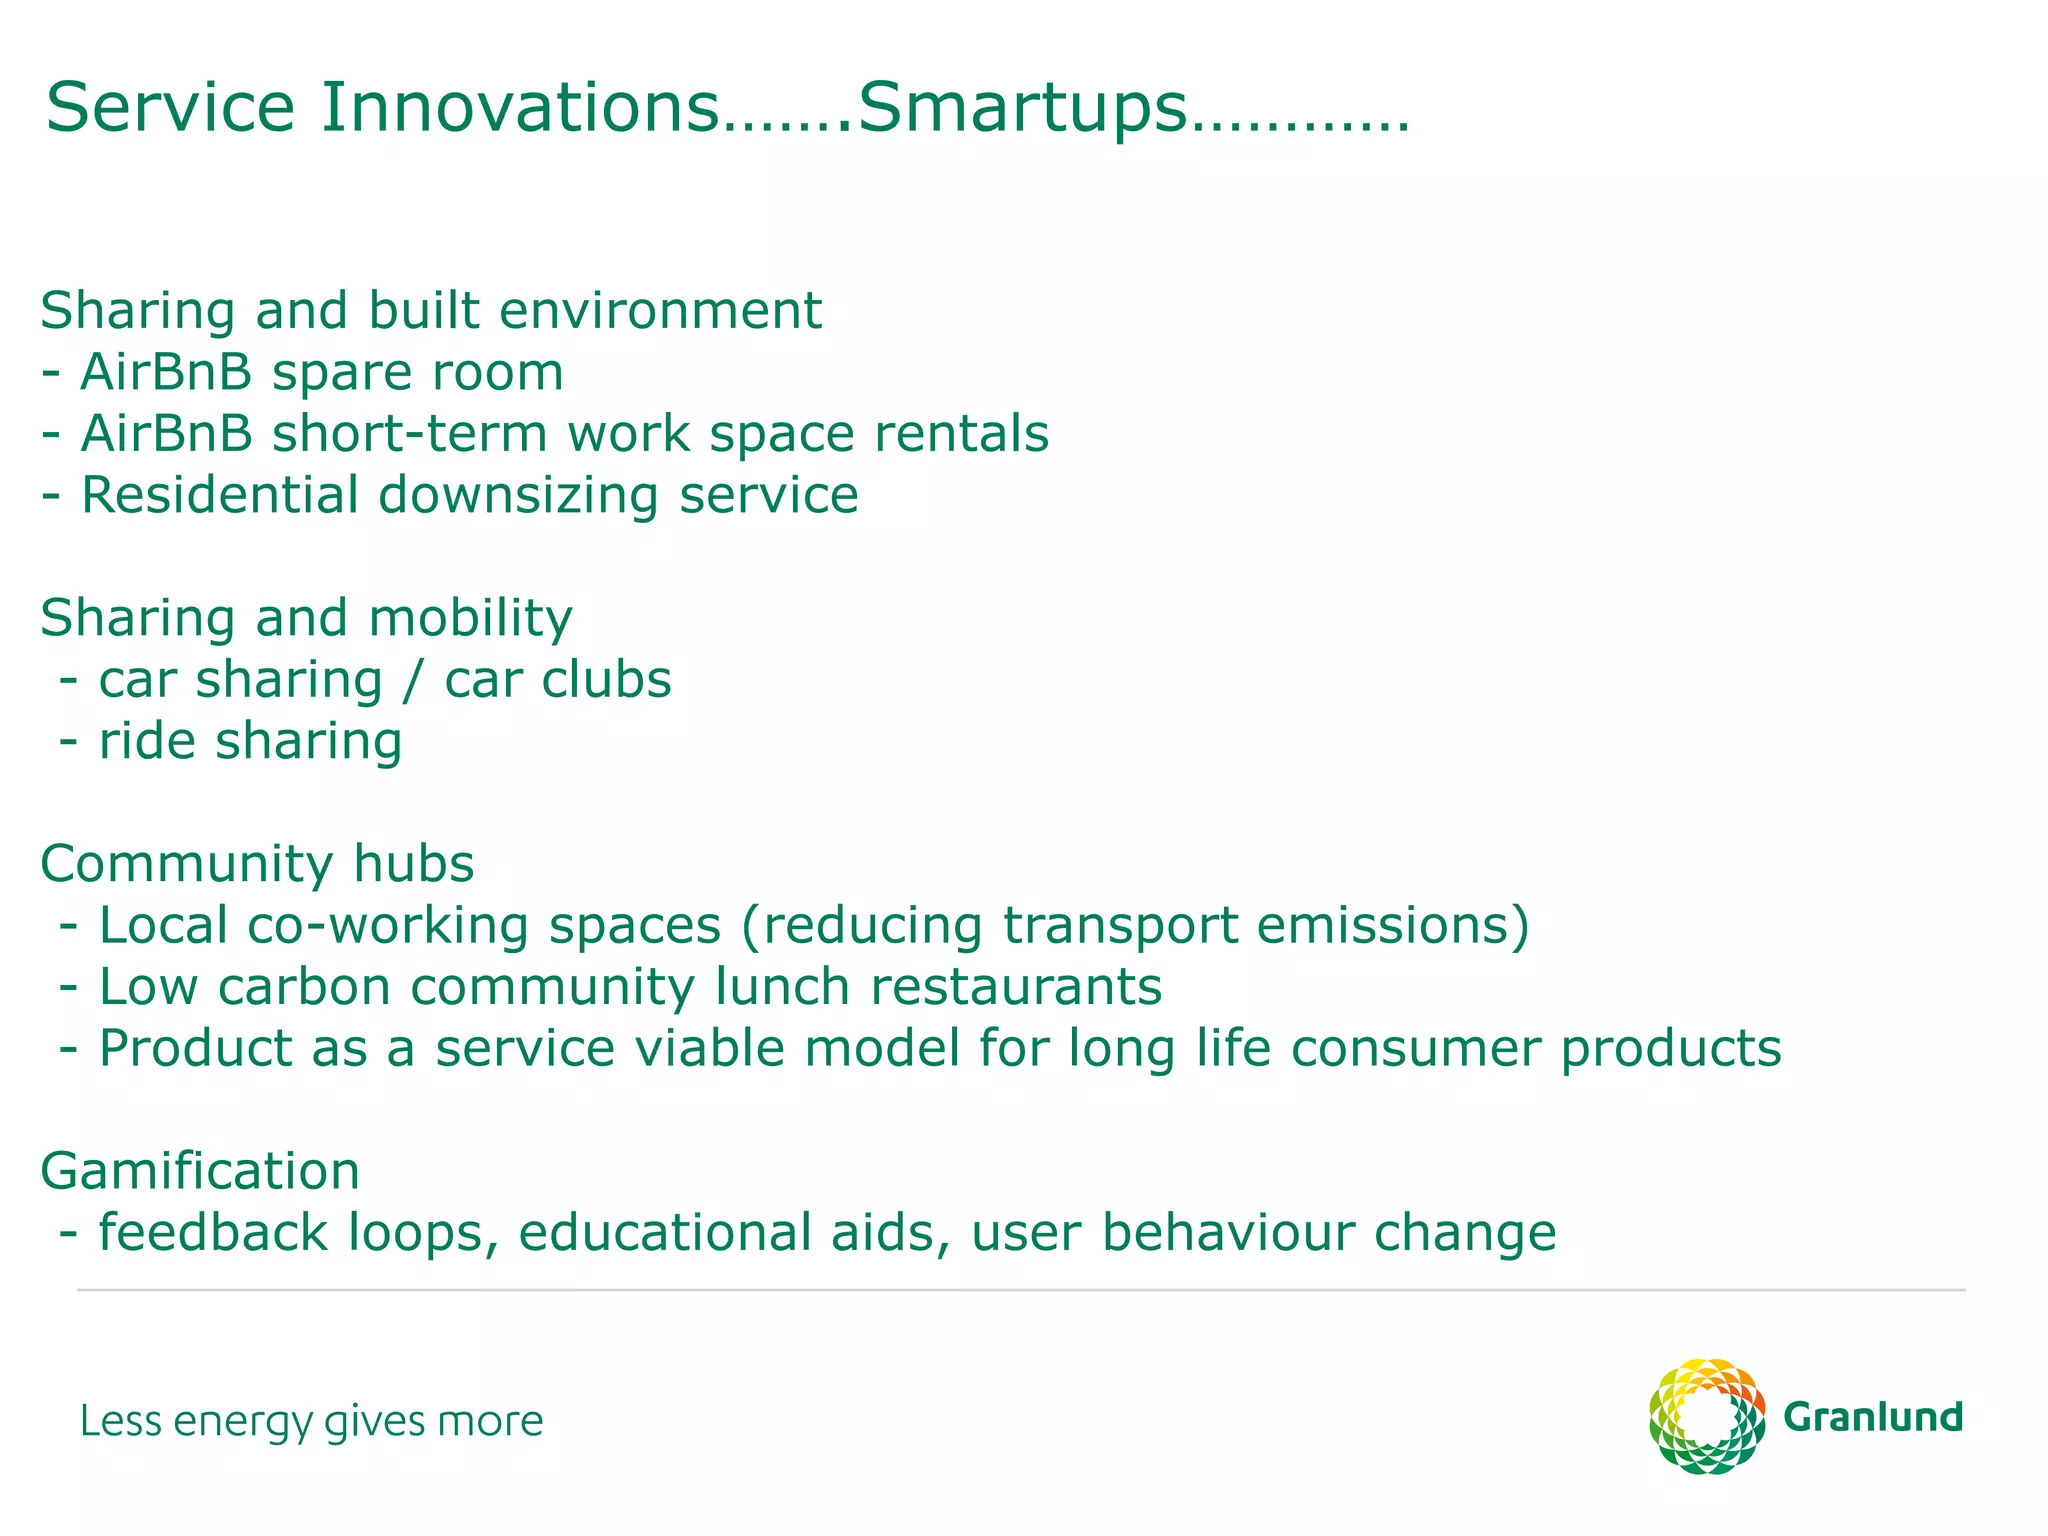
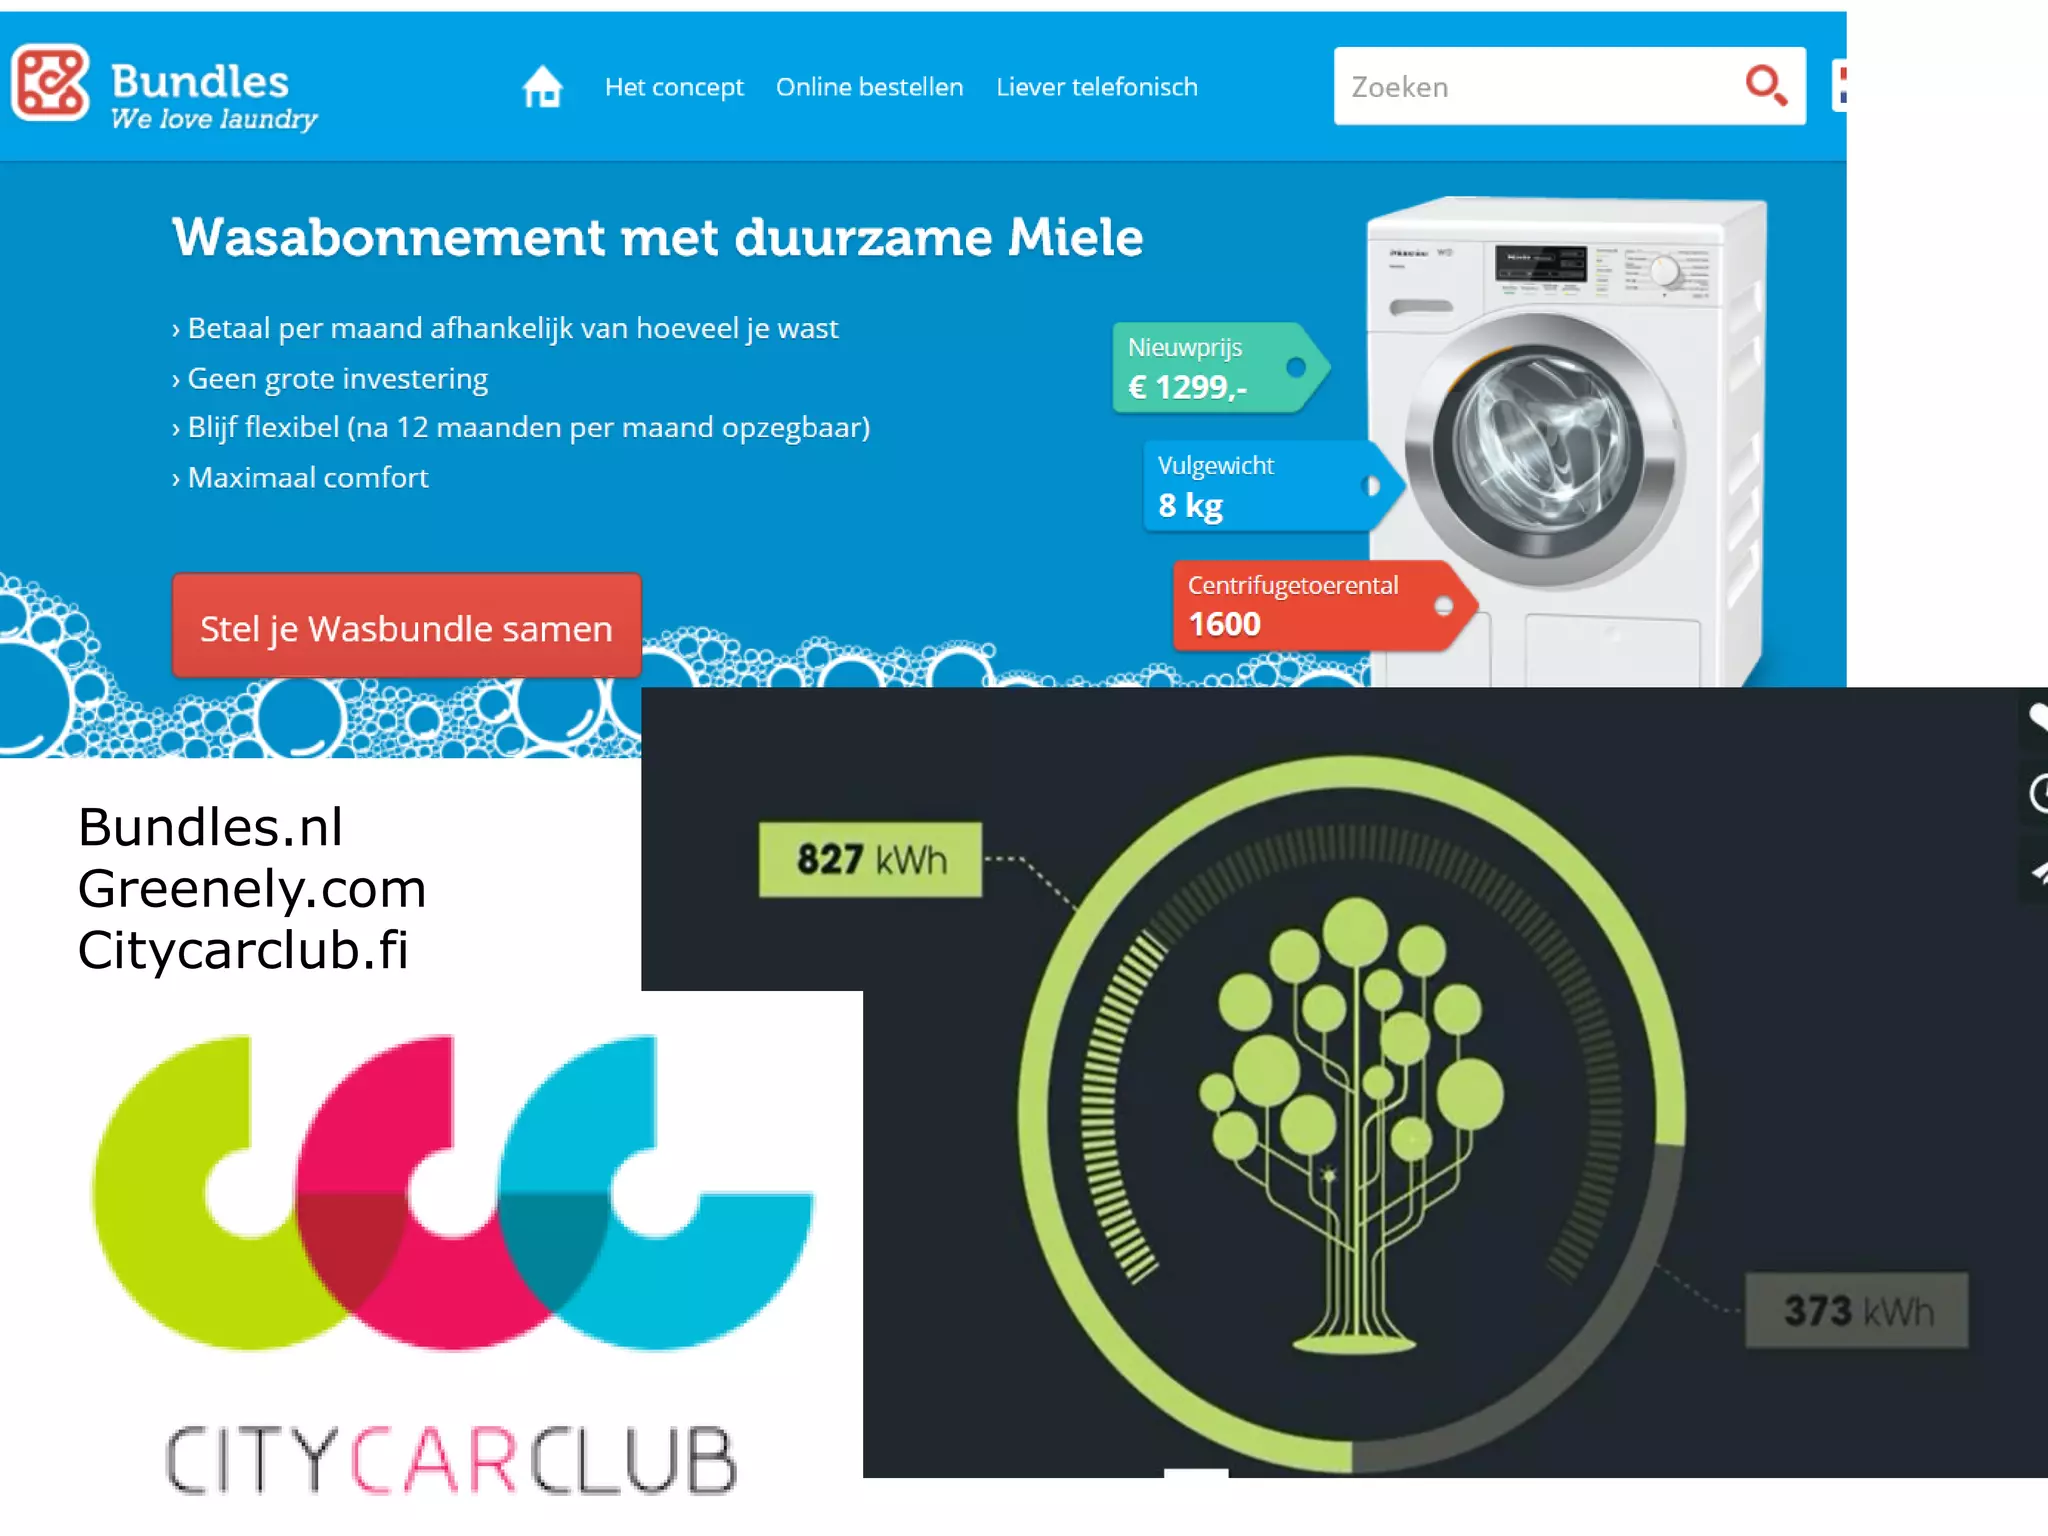
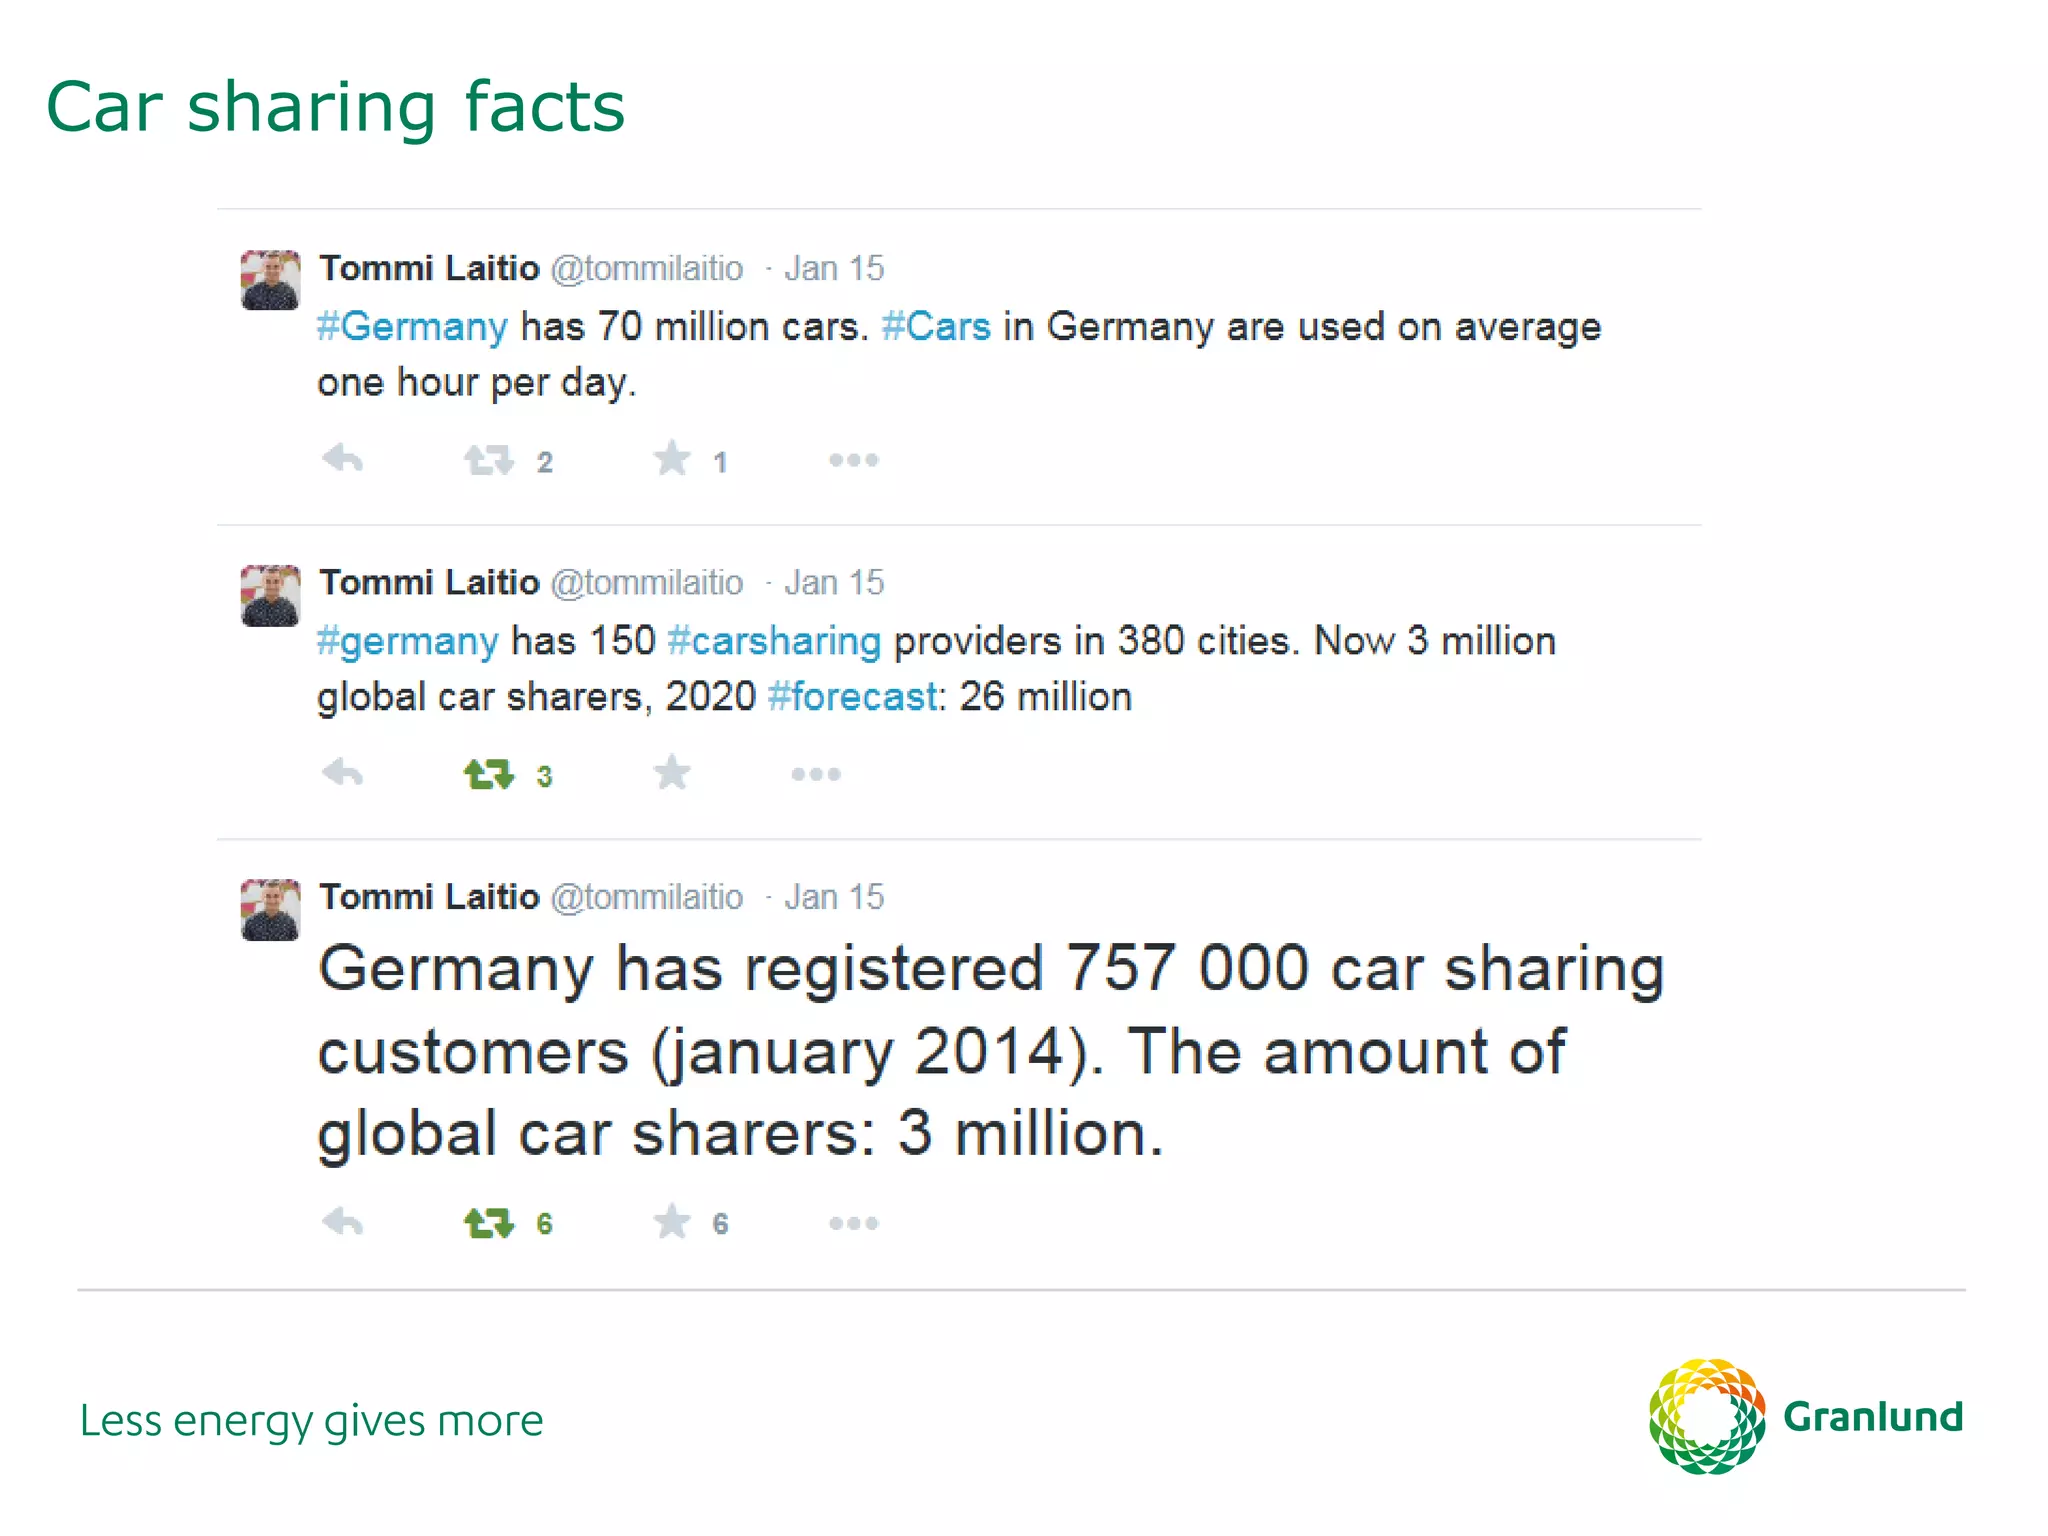
Download as PDF, PPTX

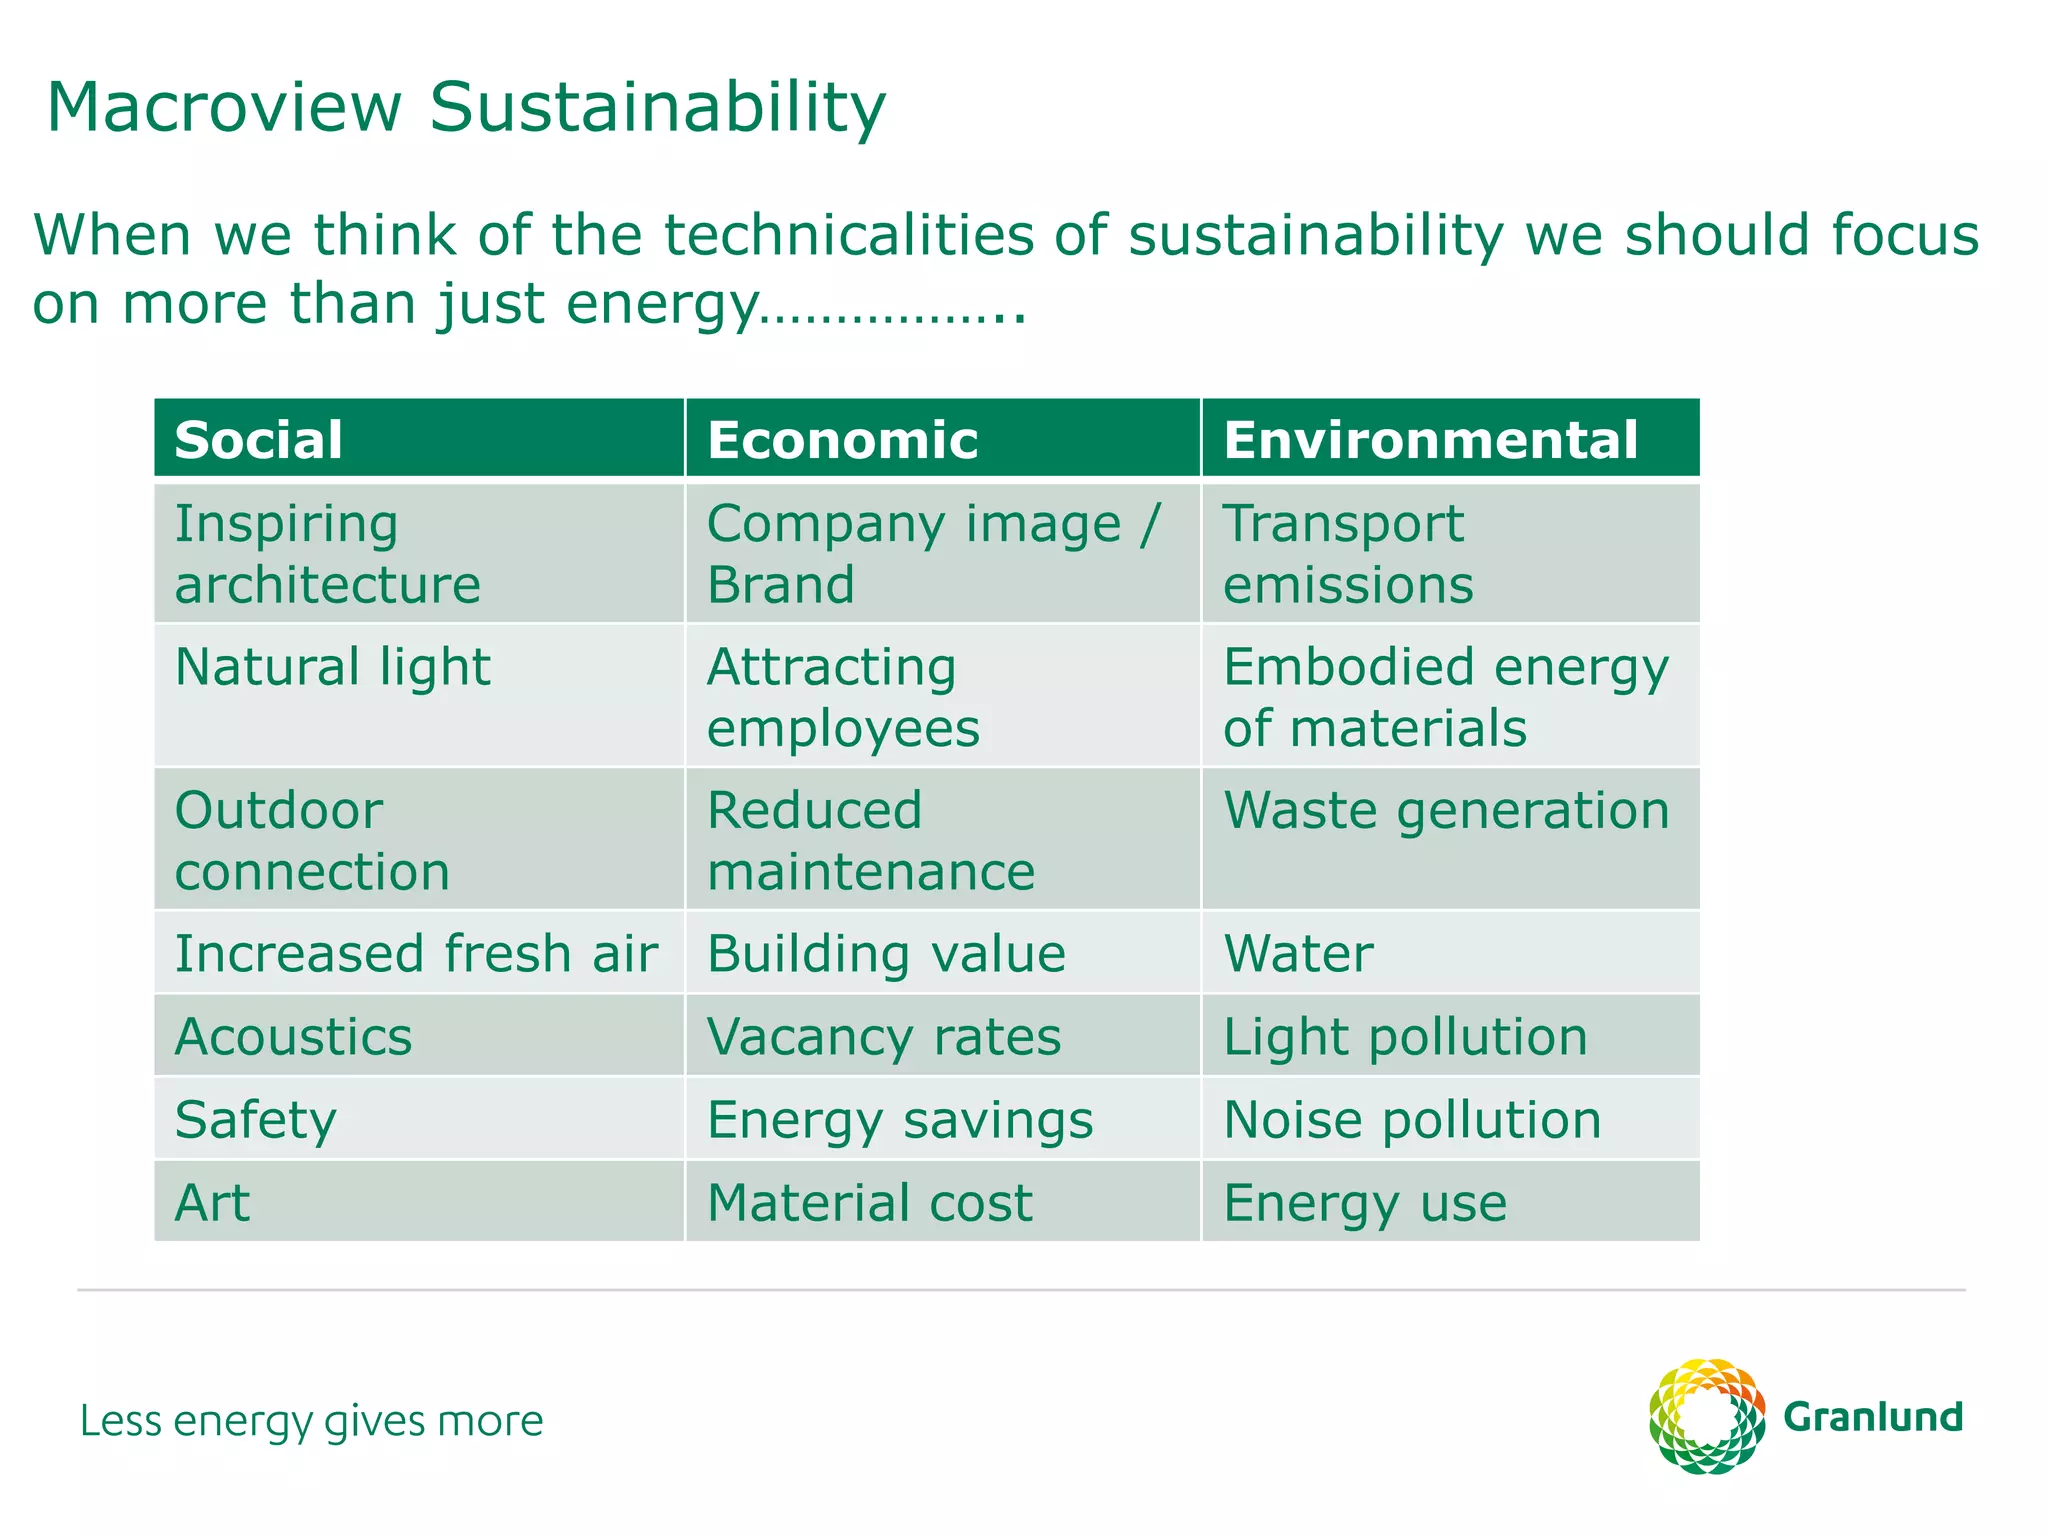
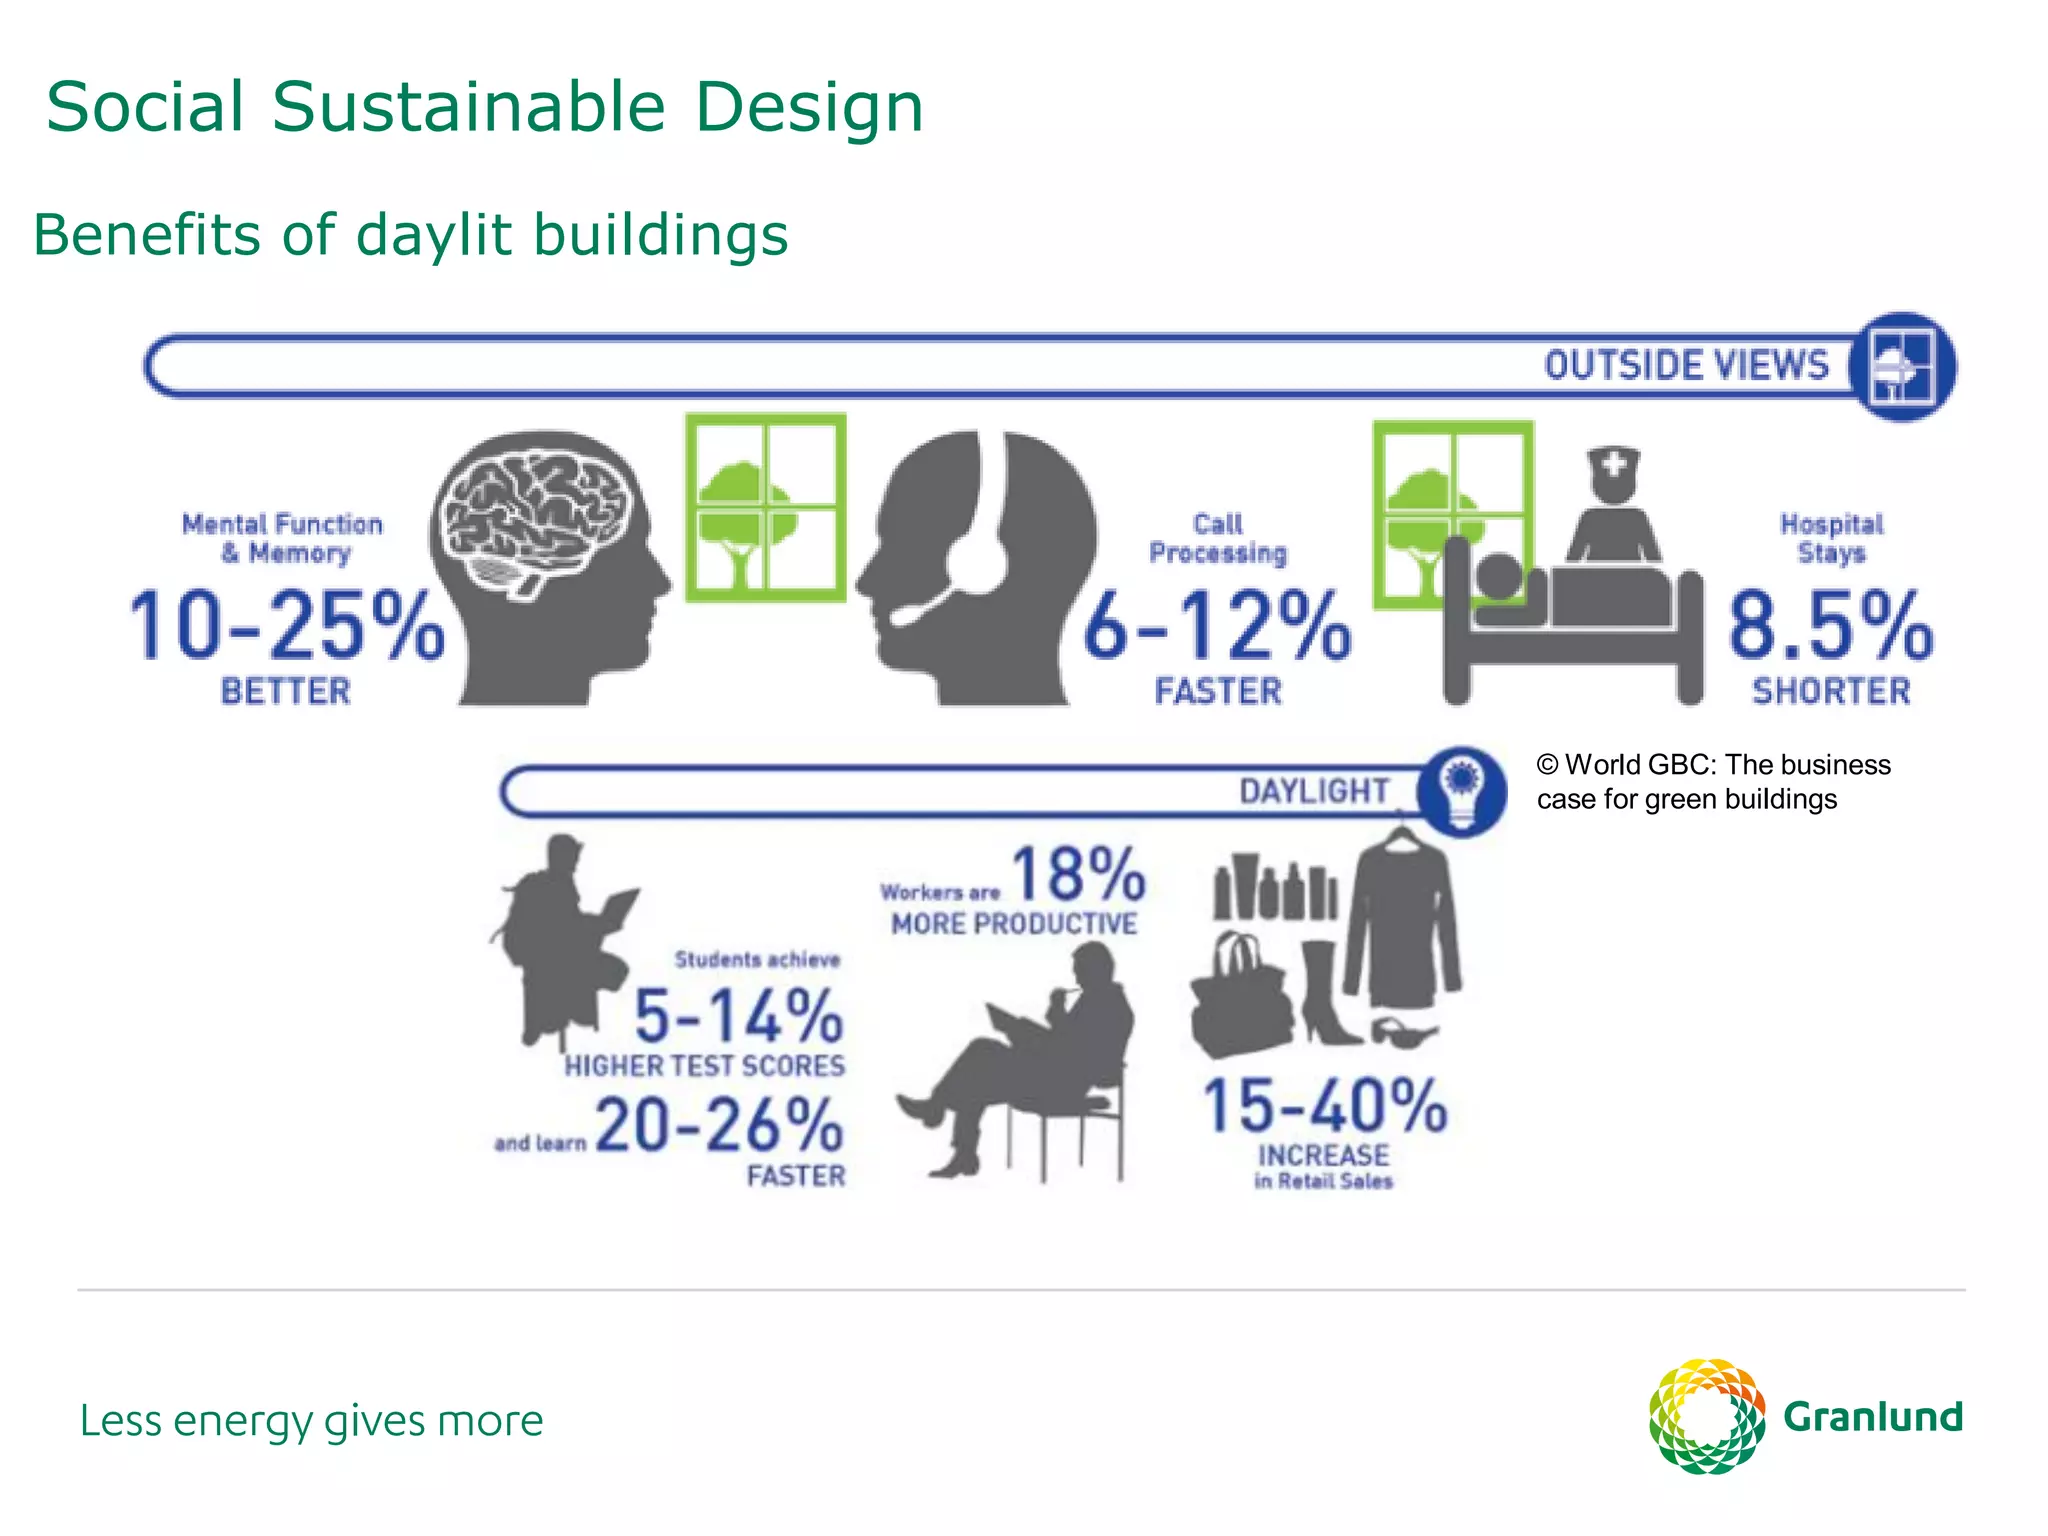
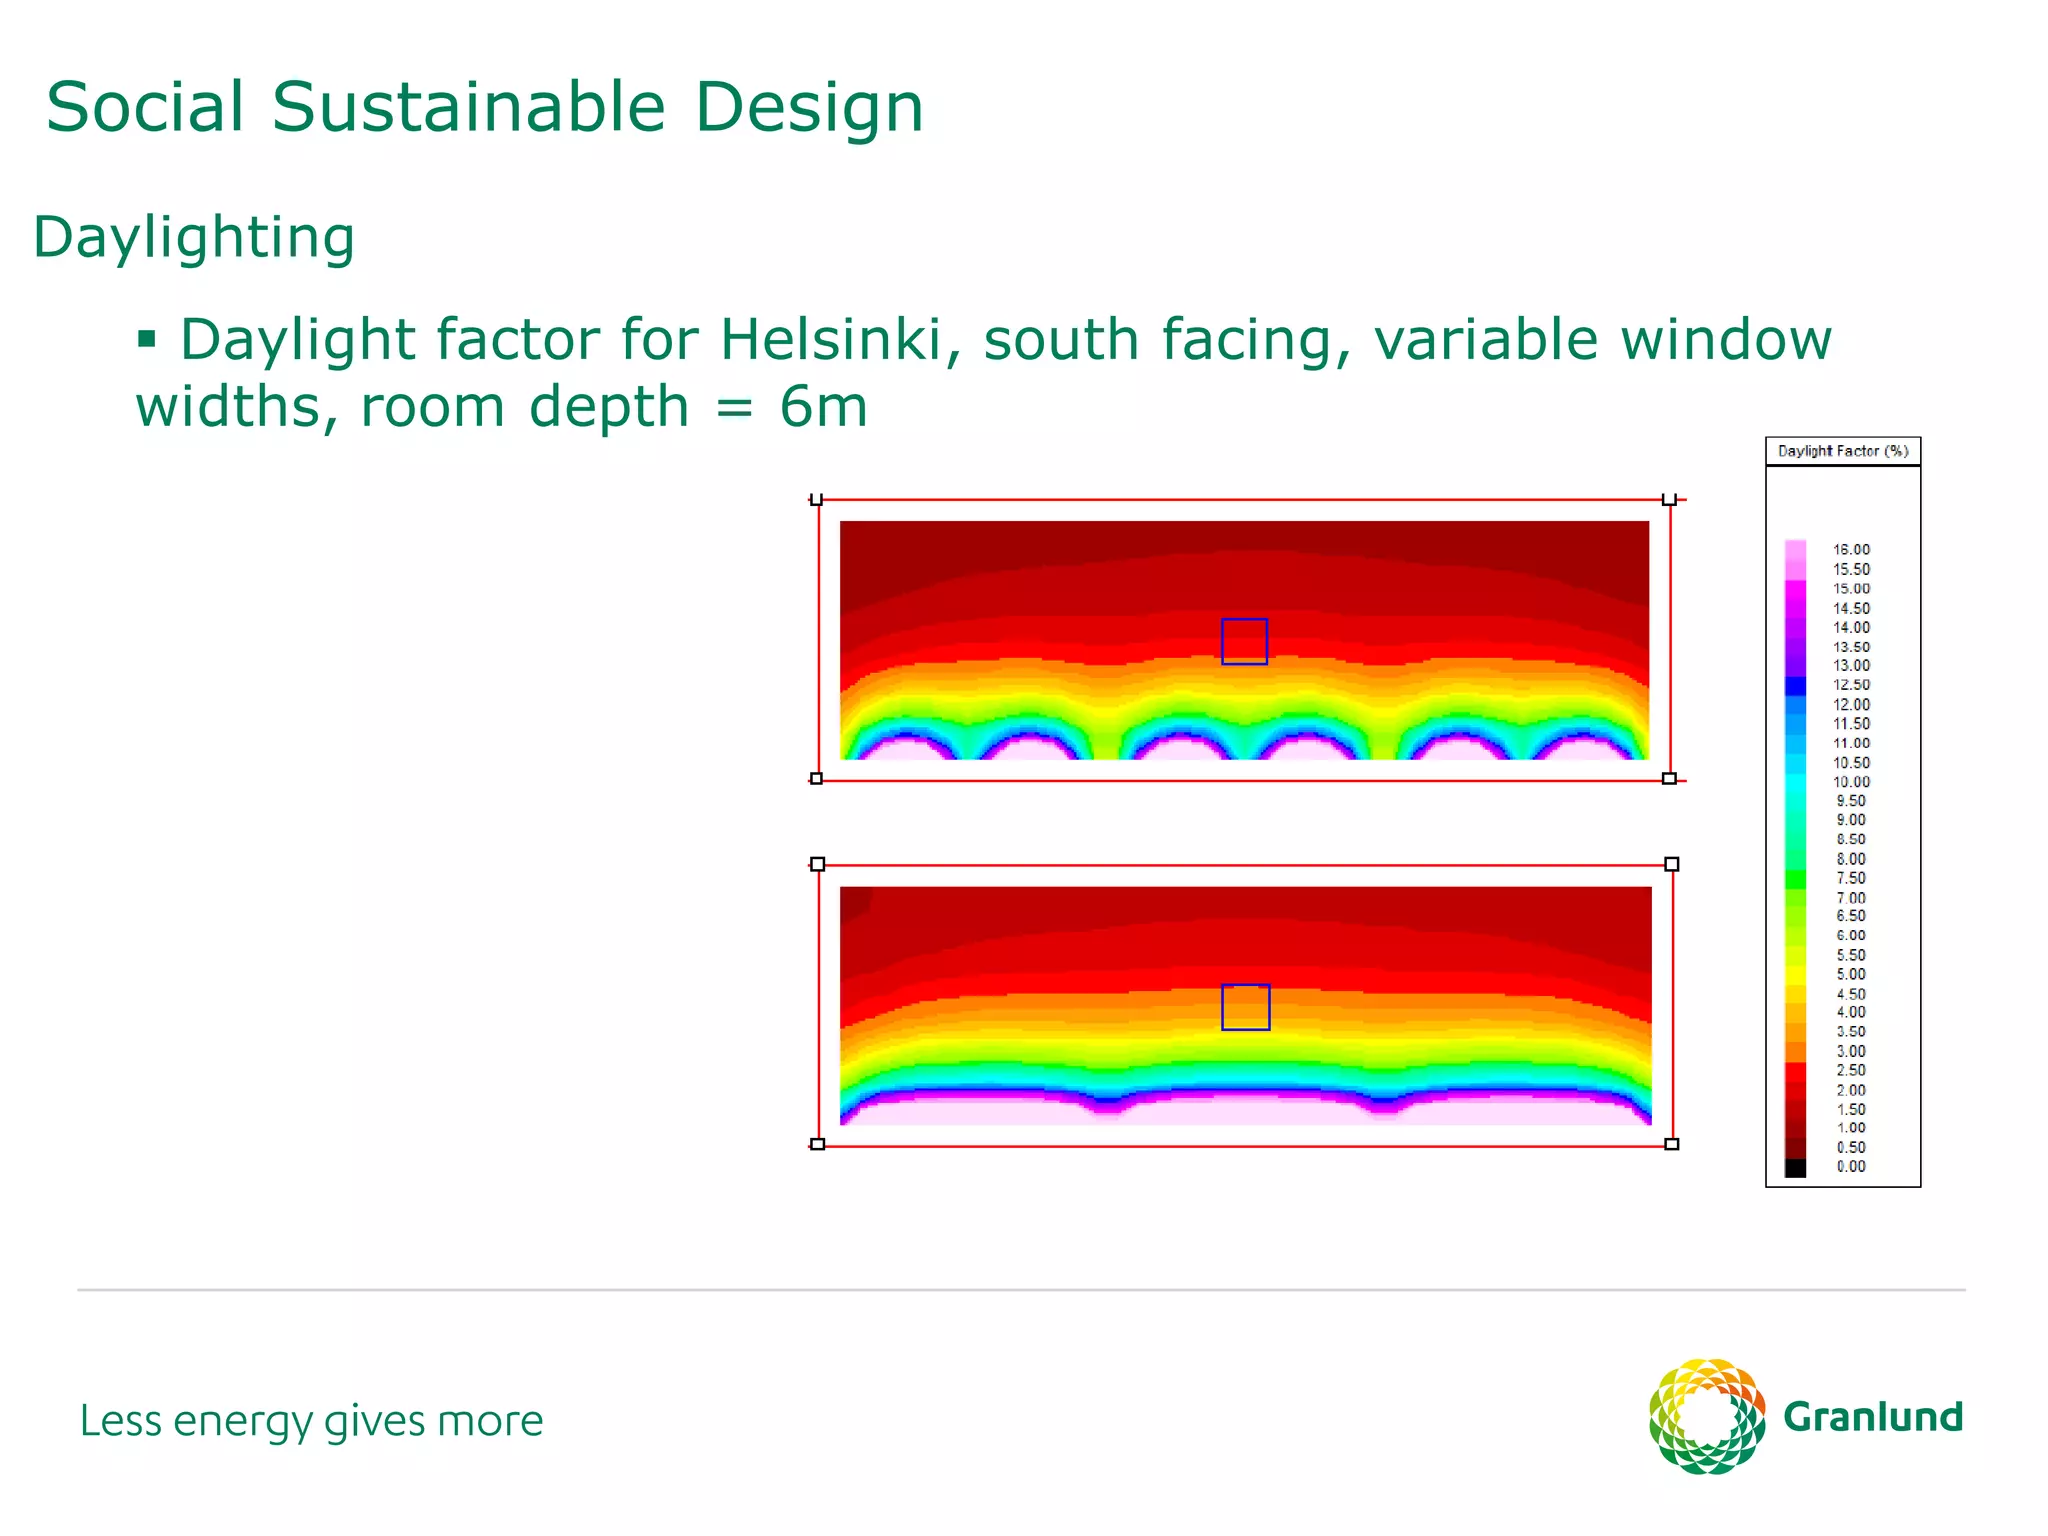
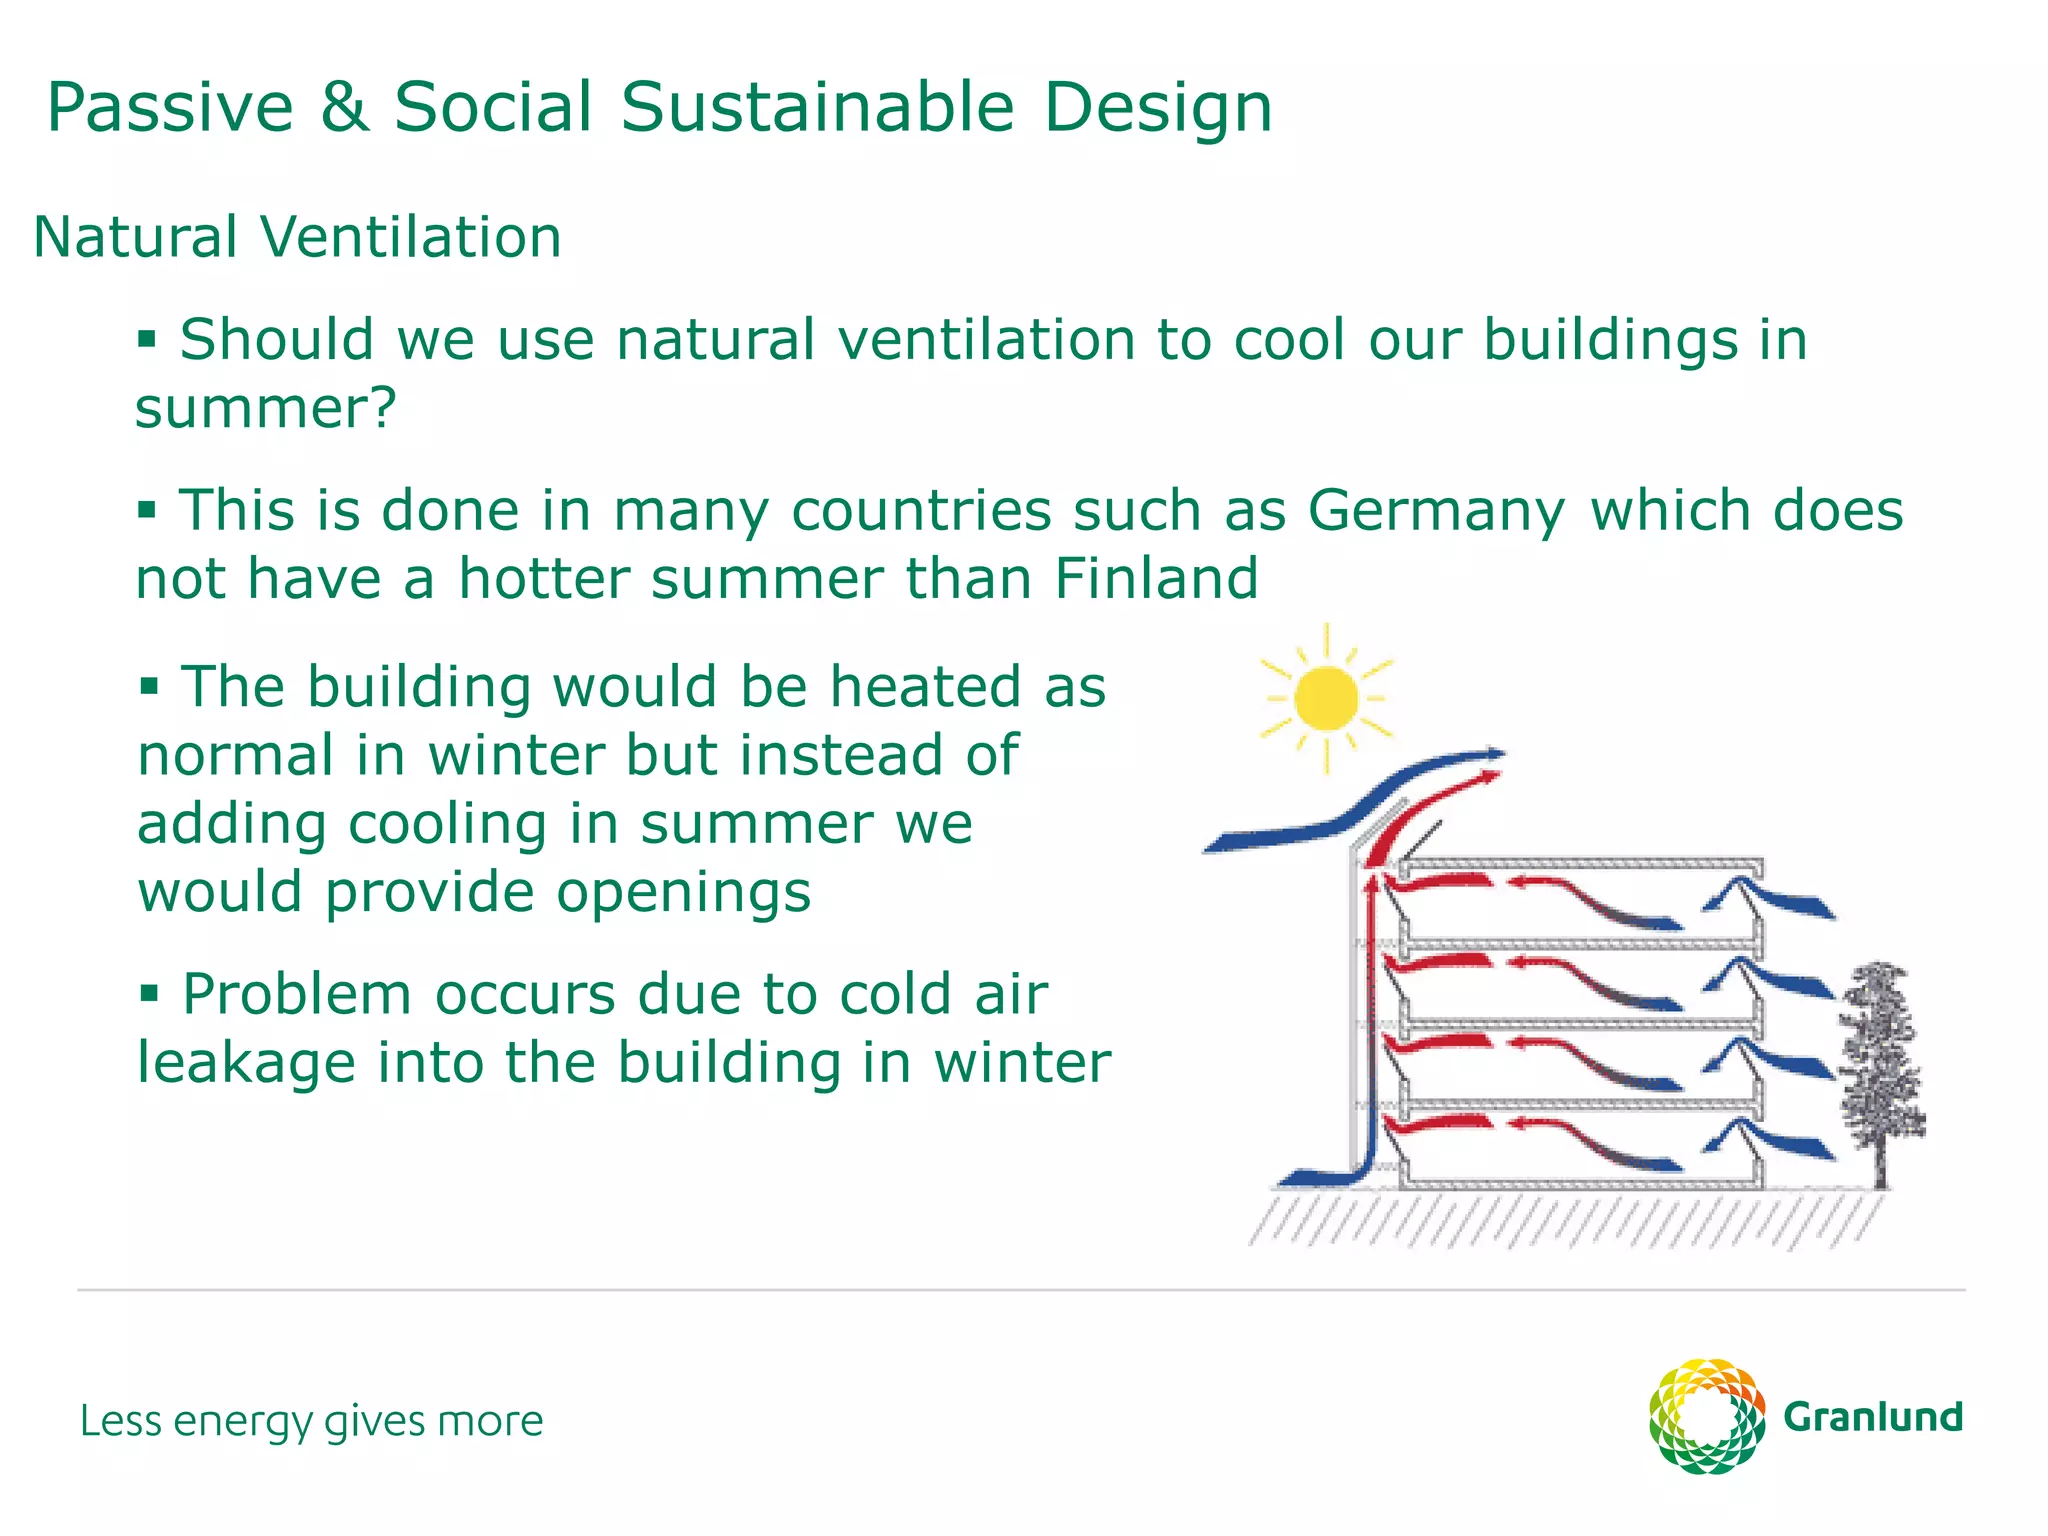
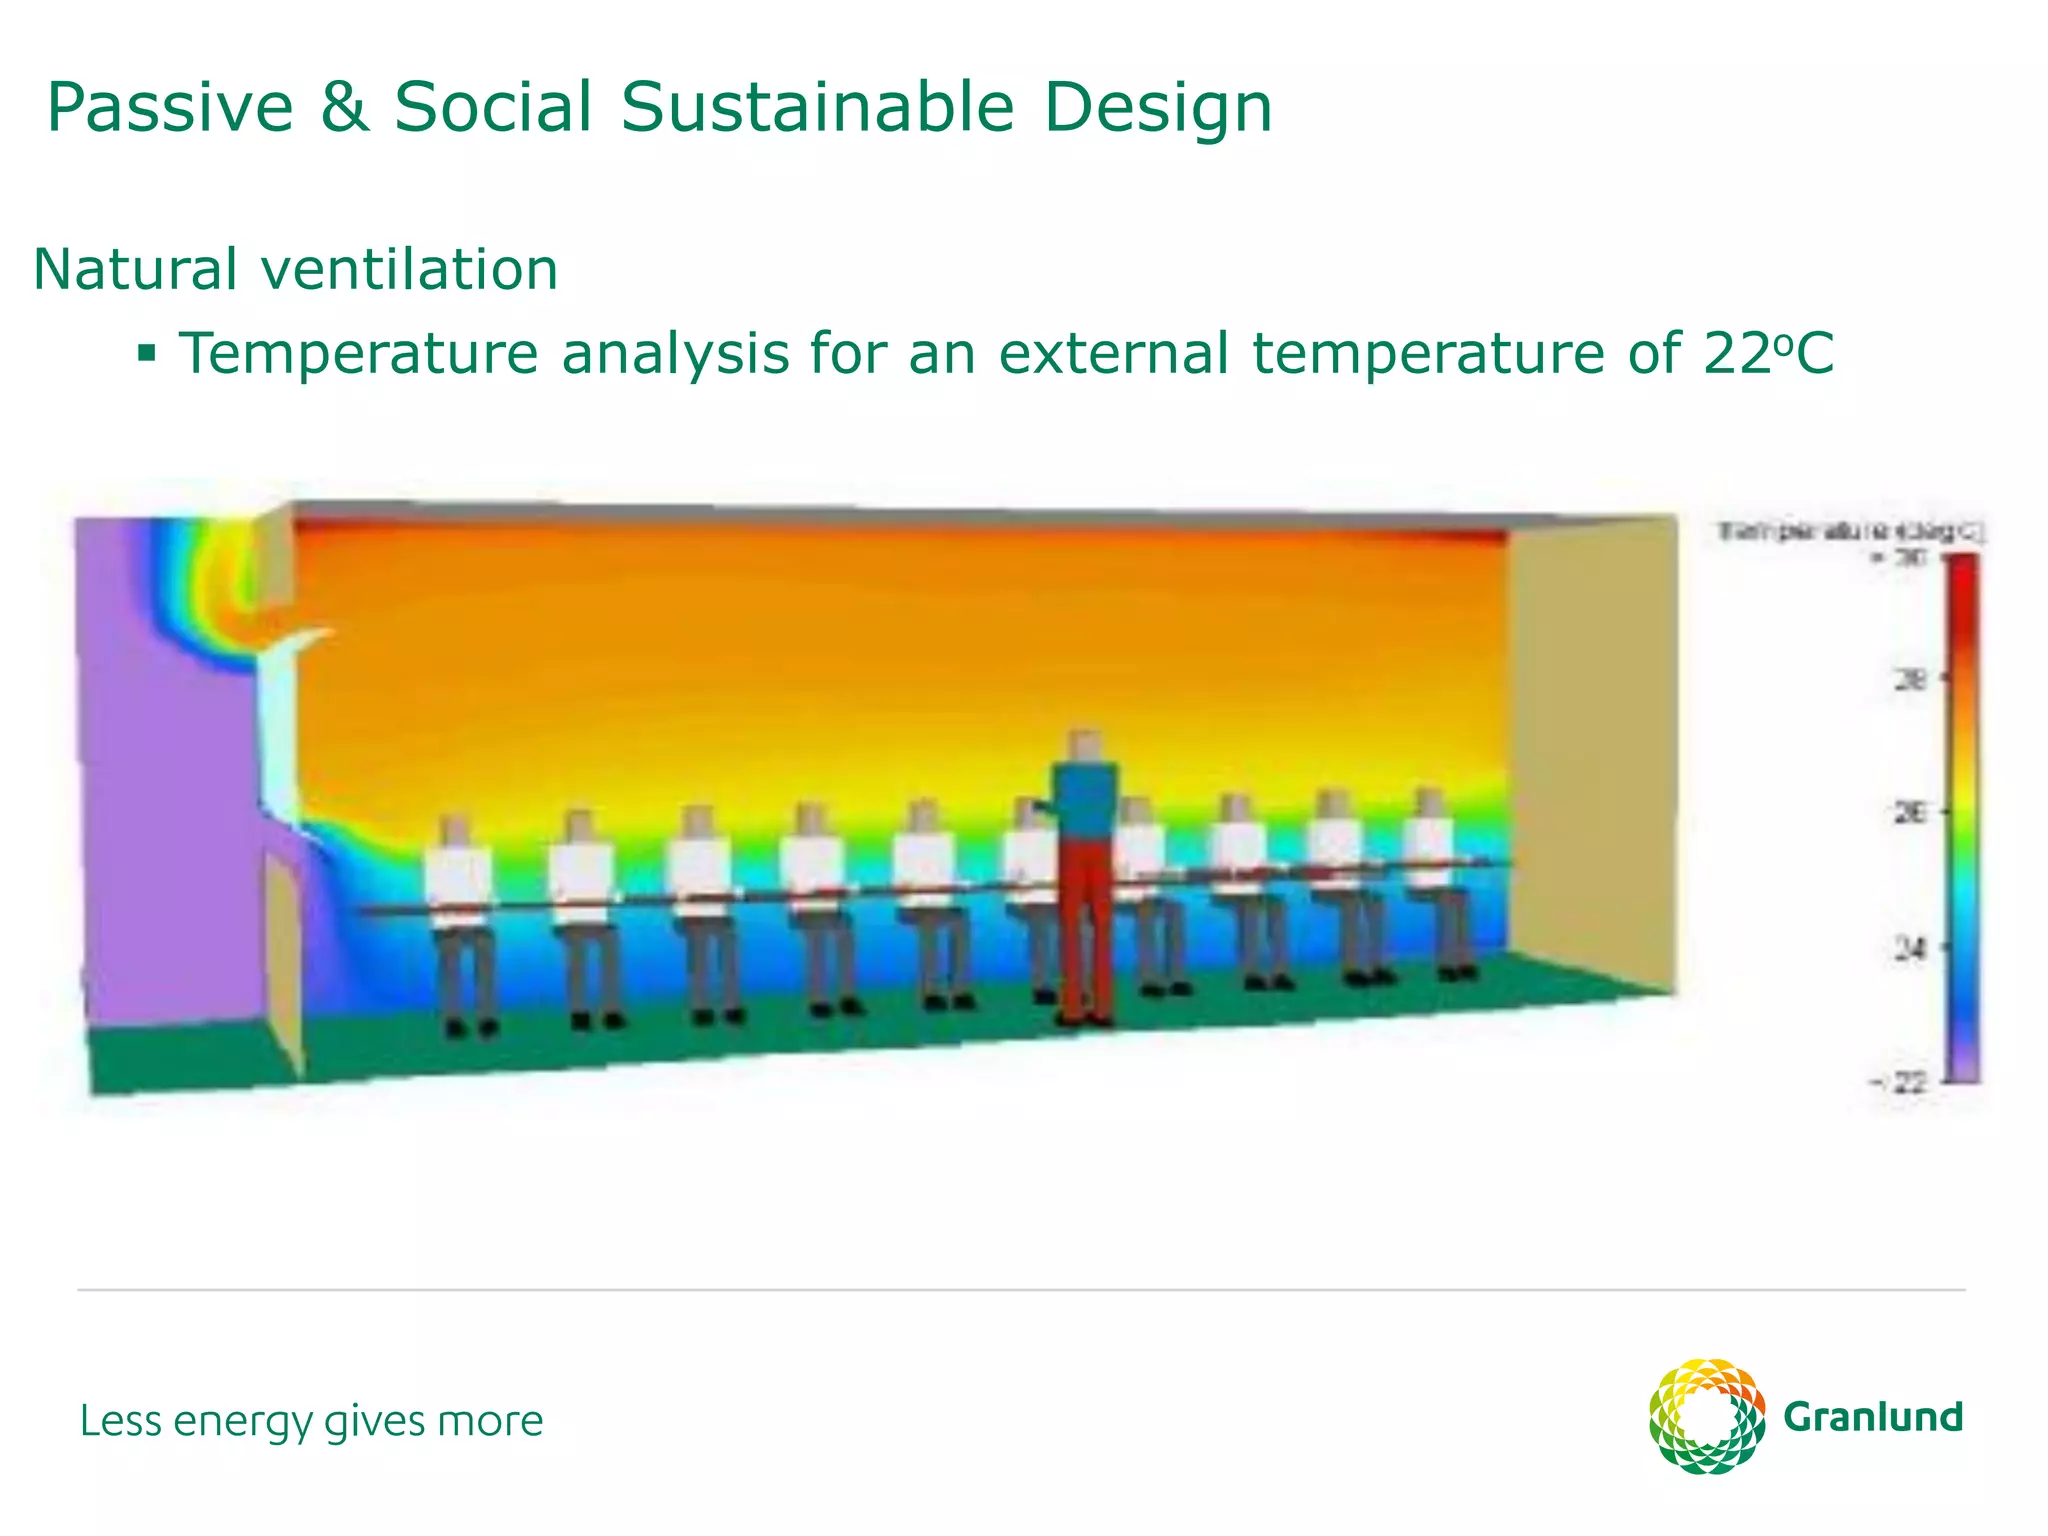
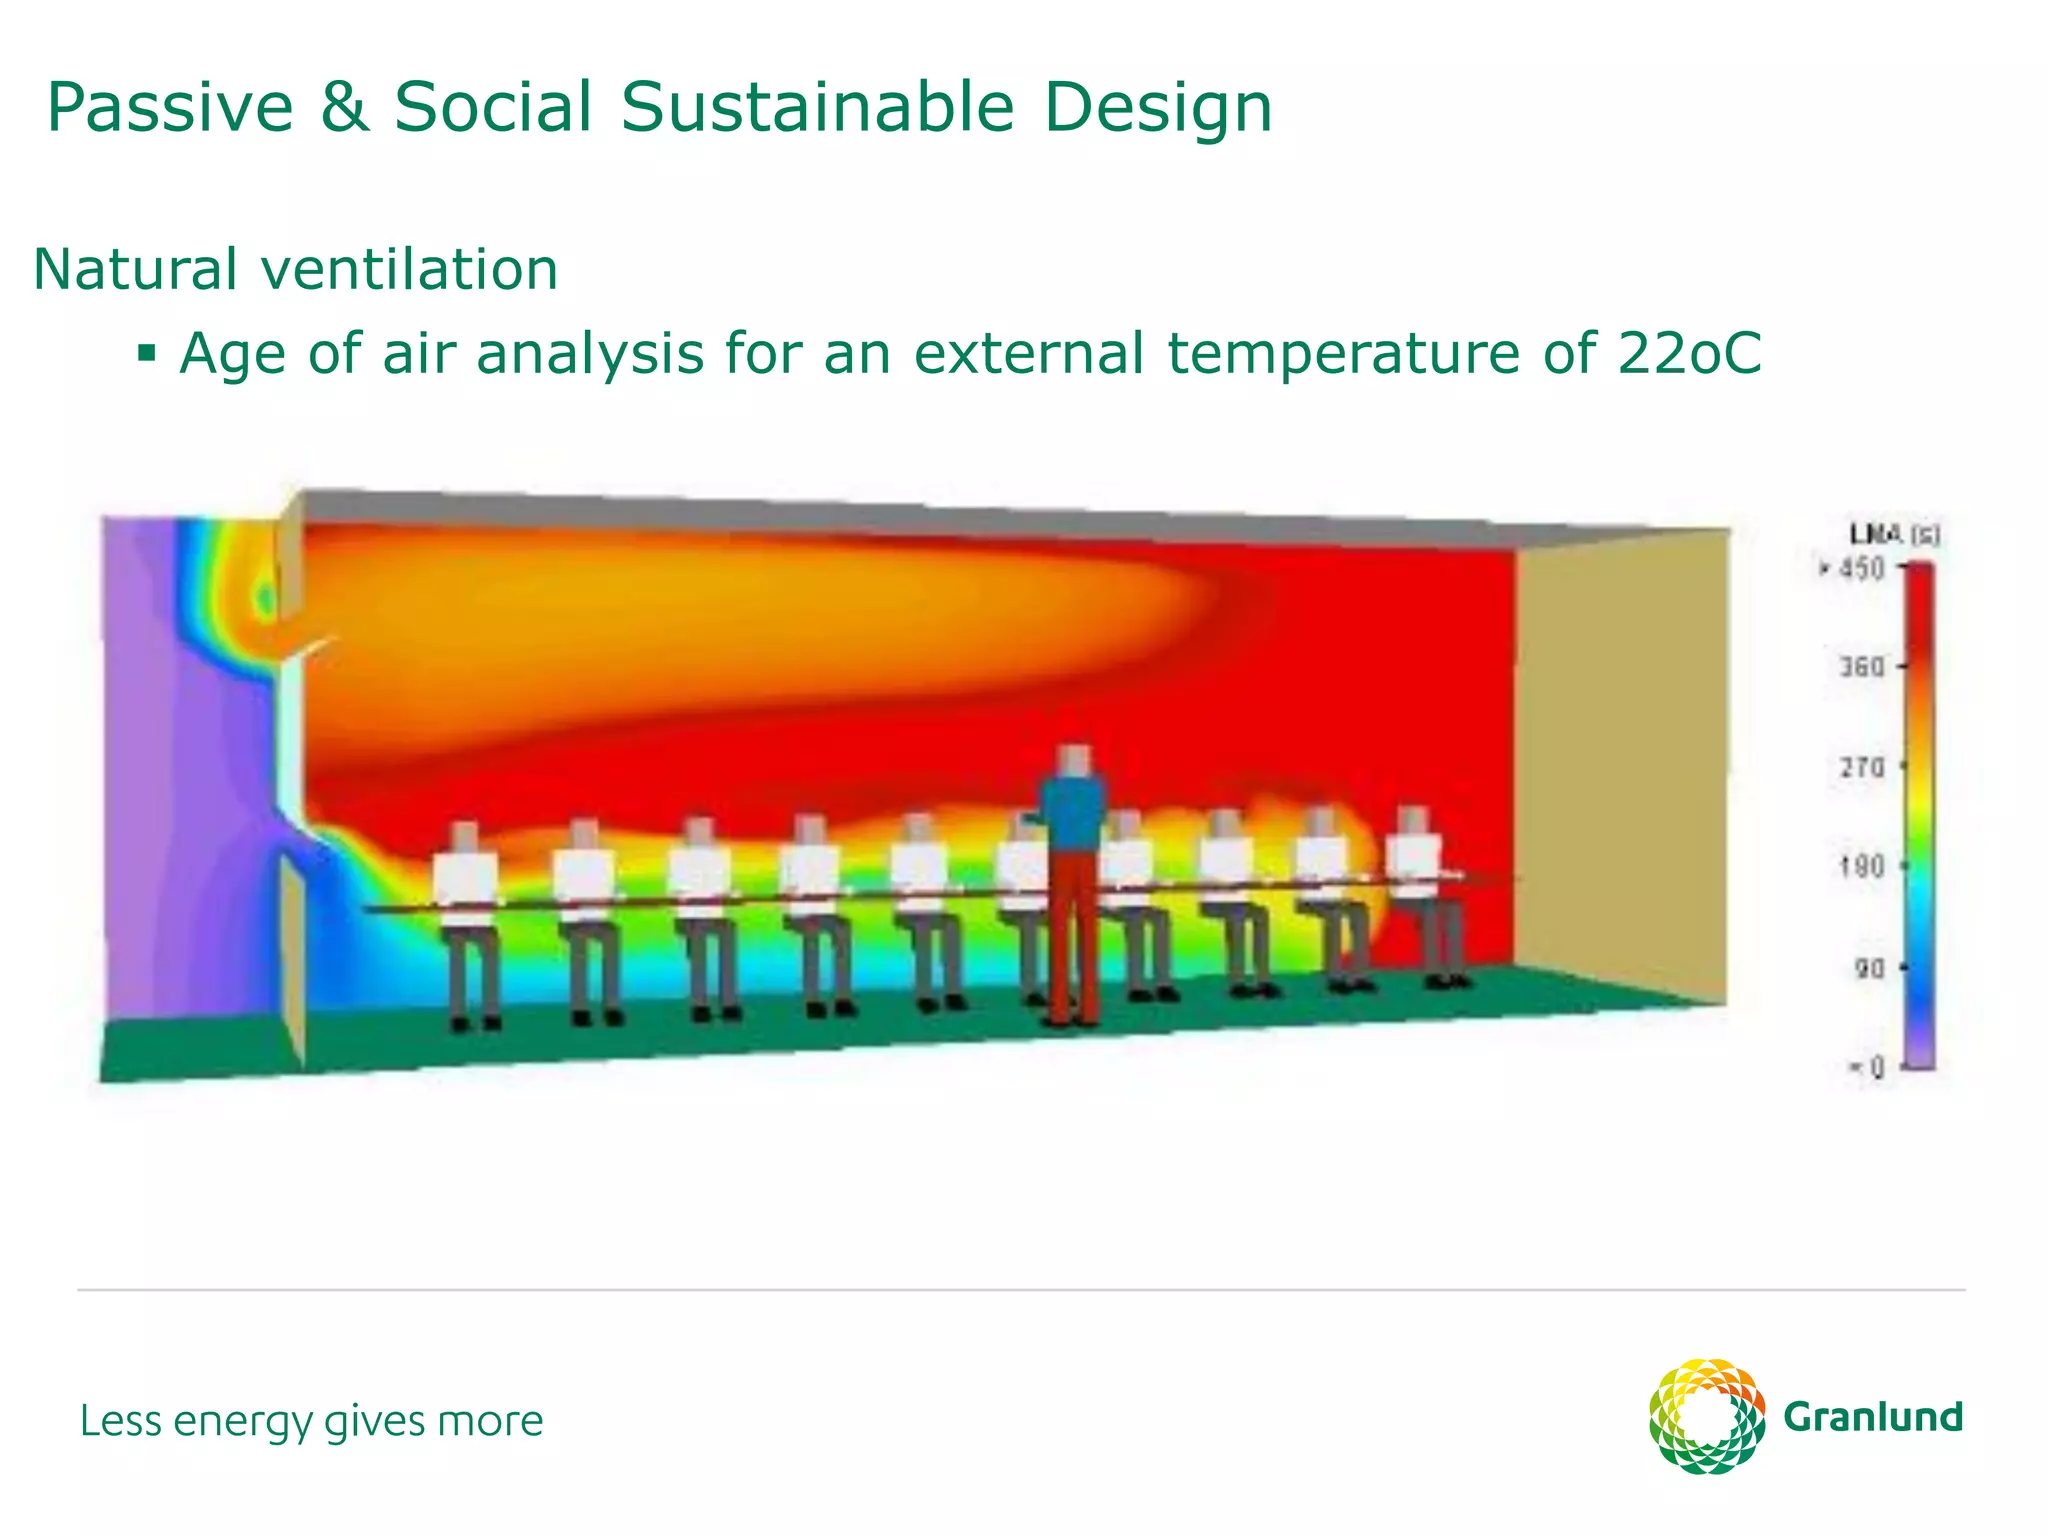
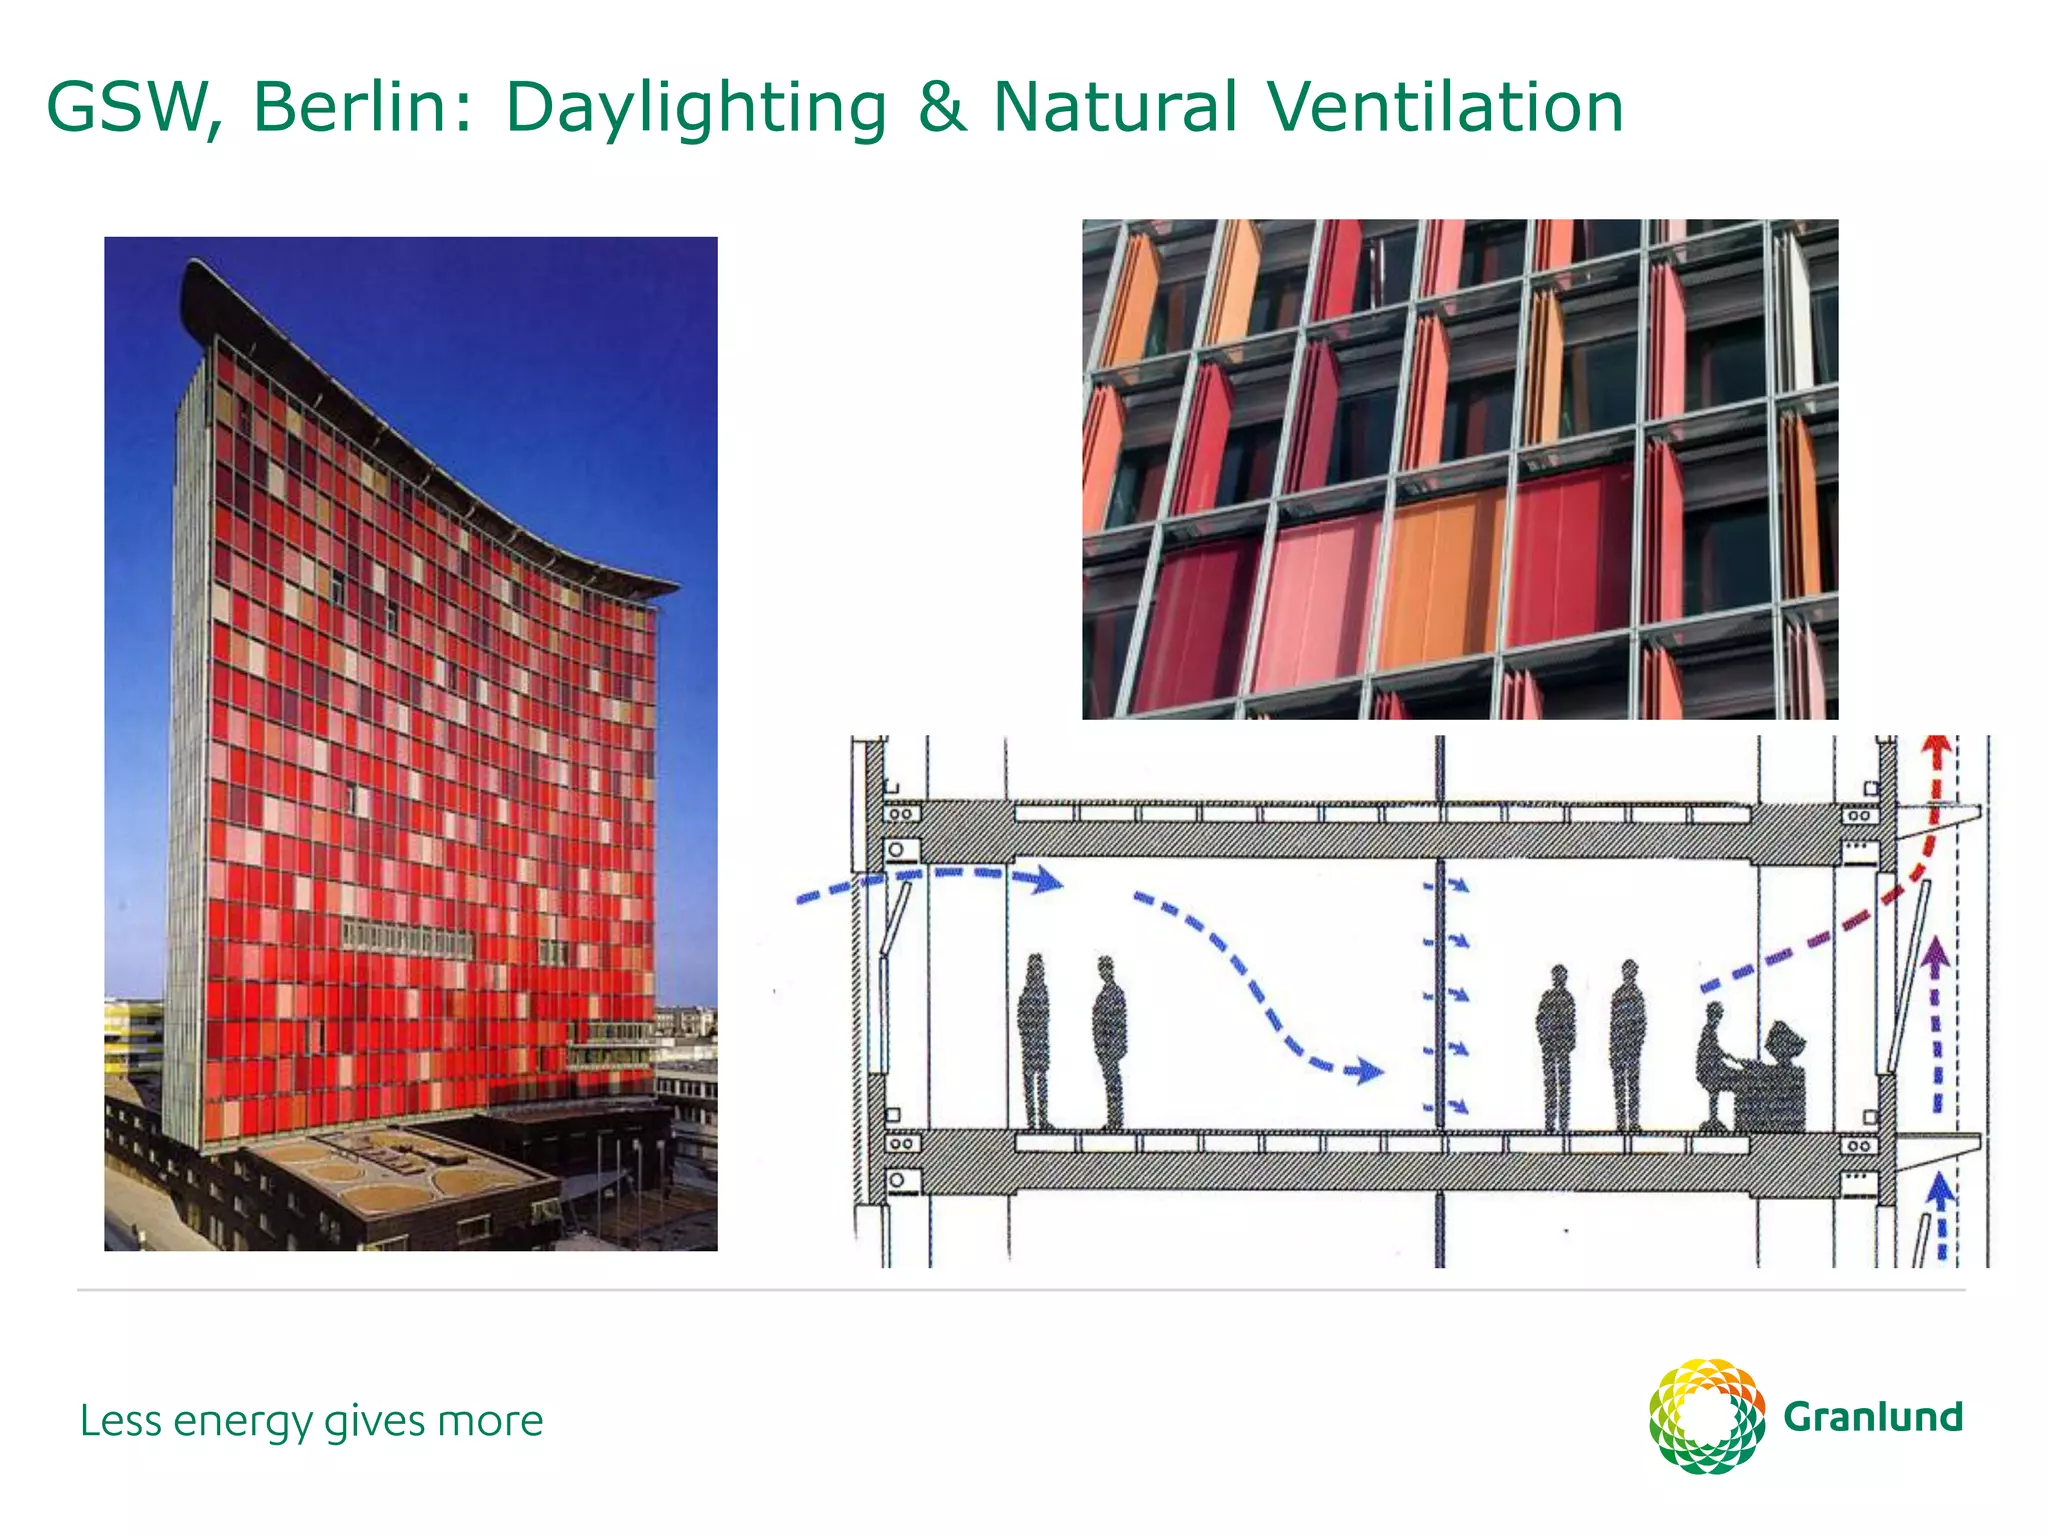
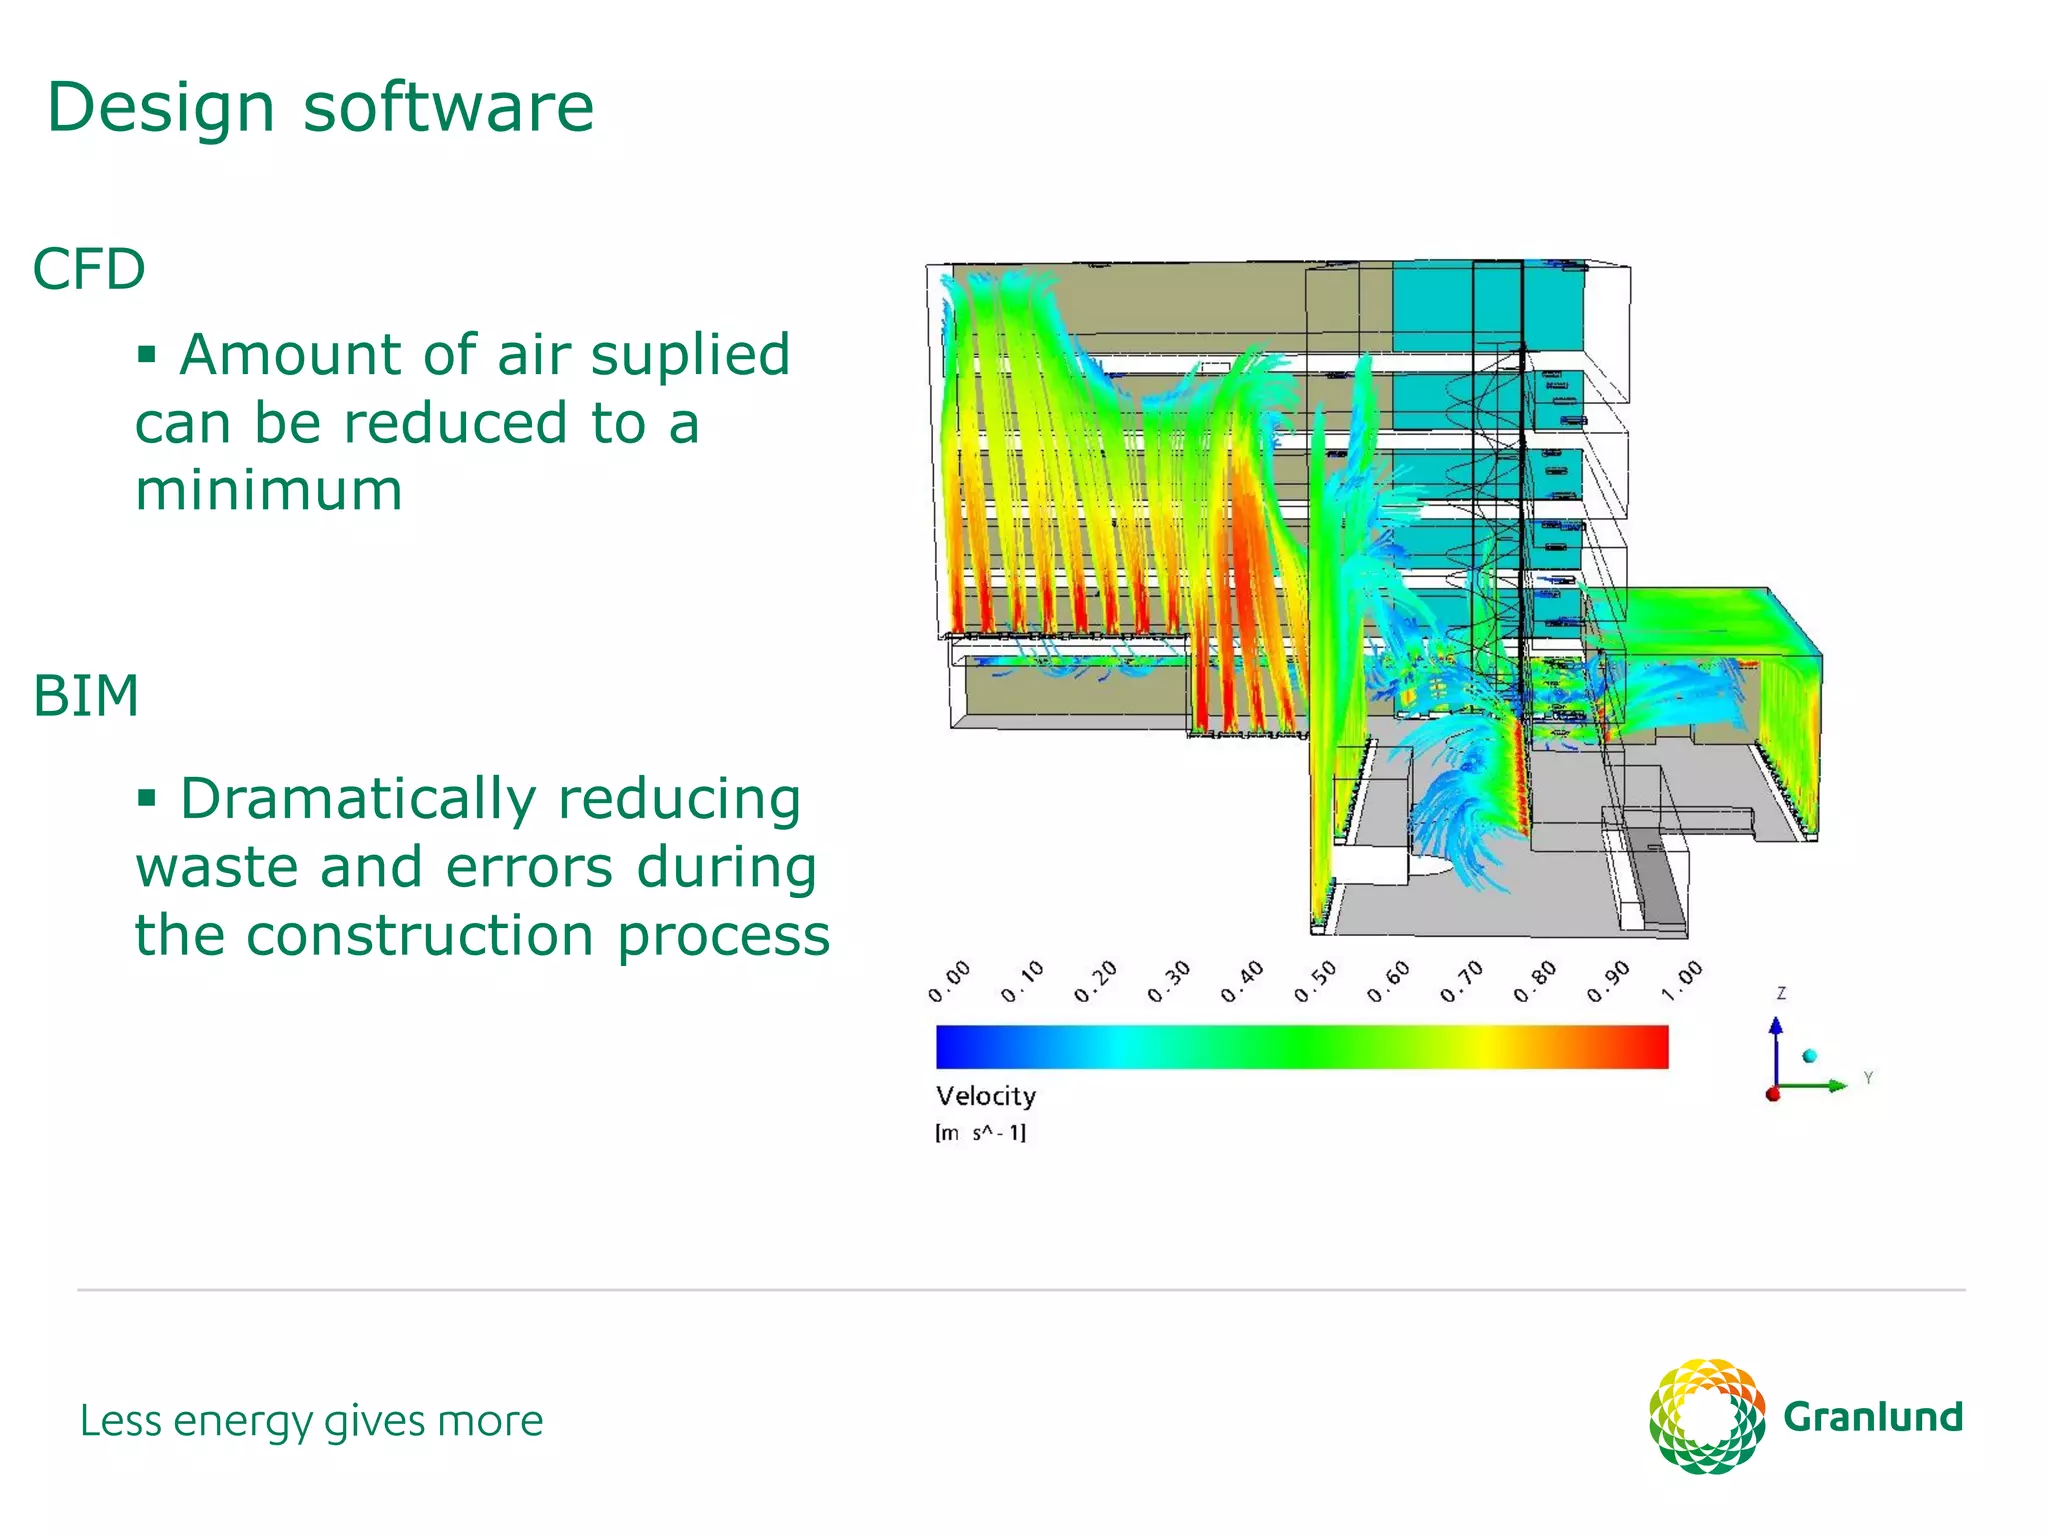

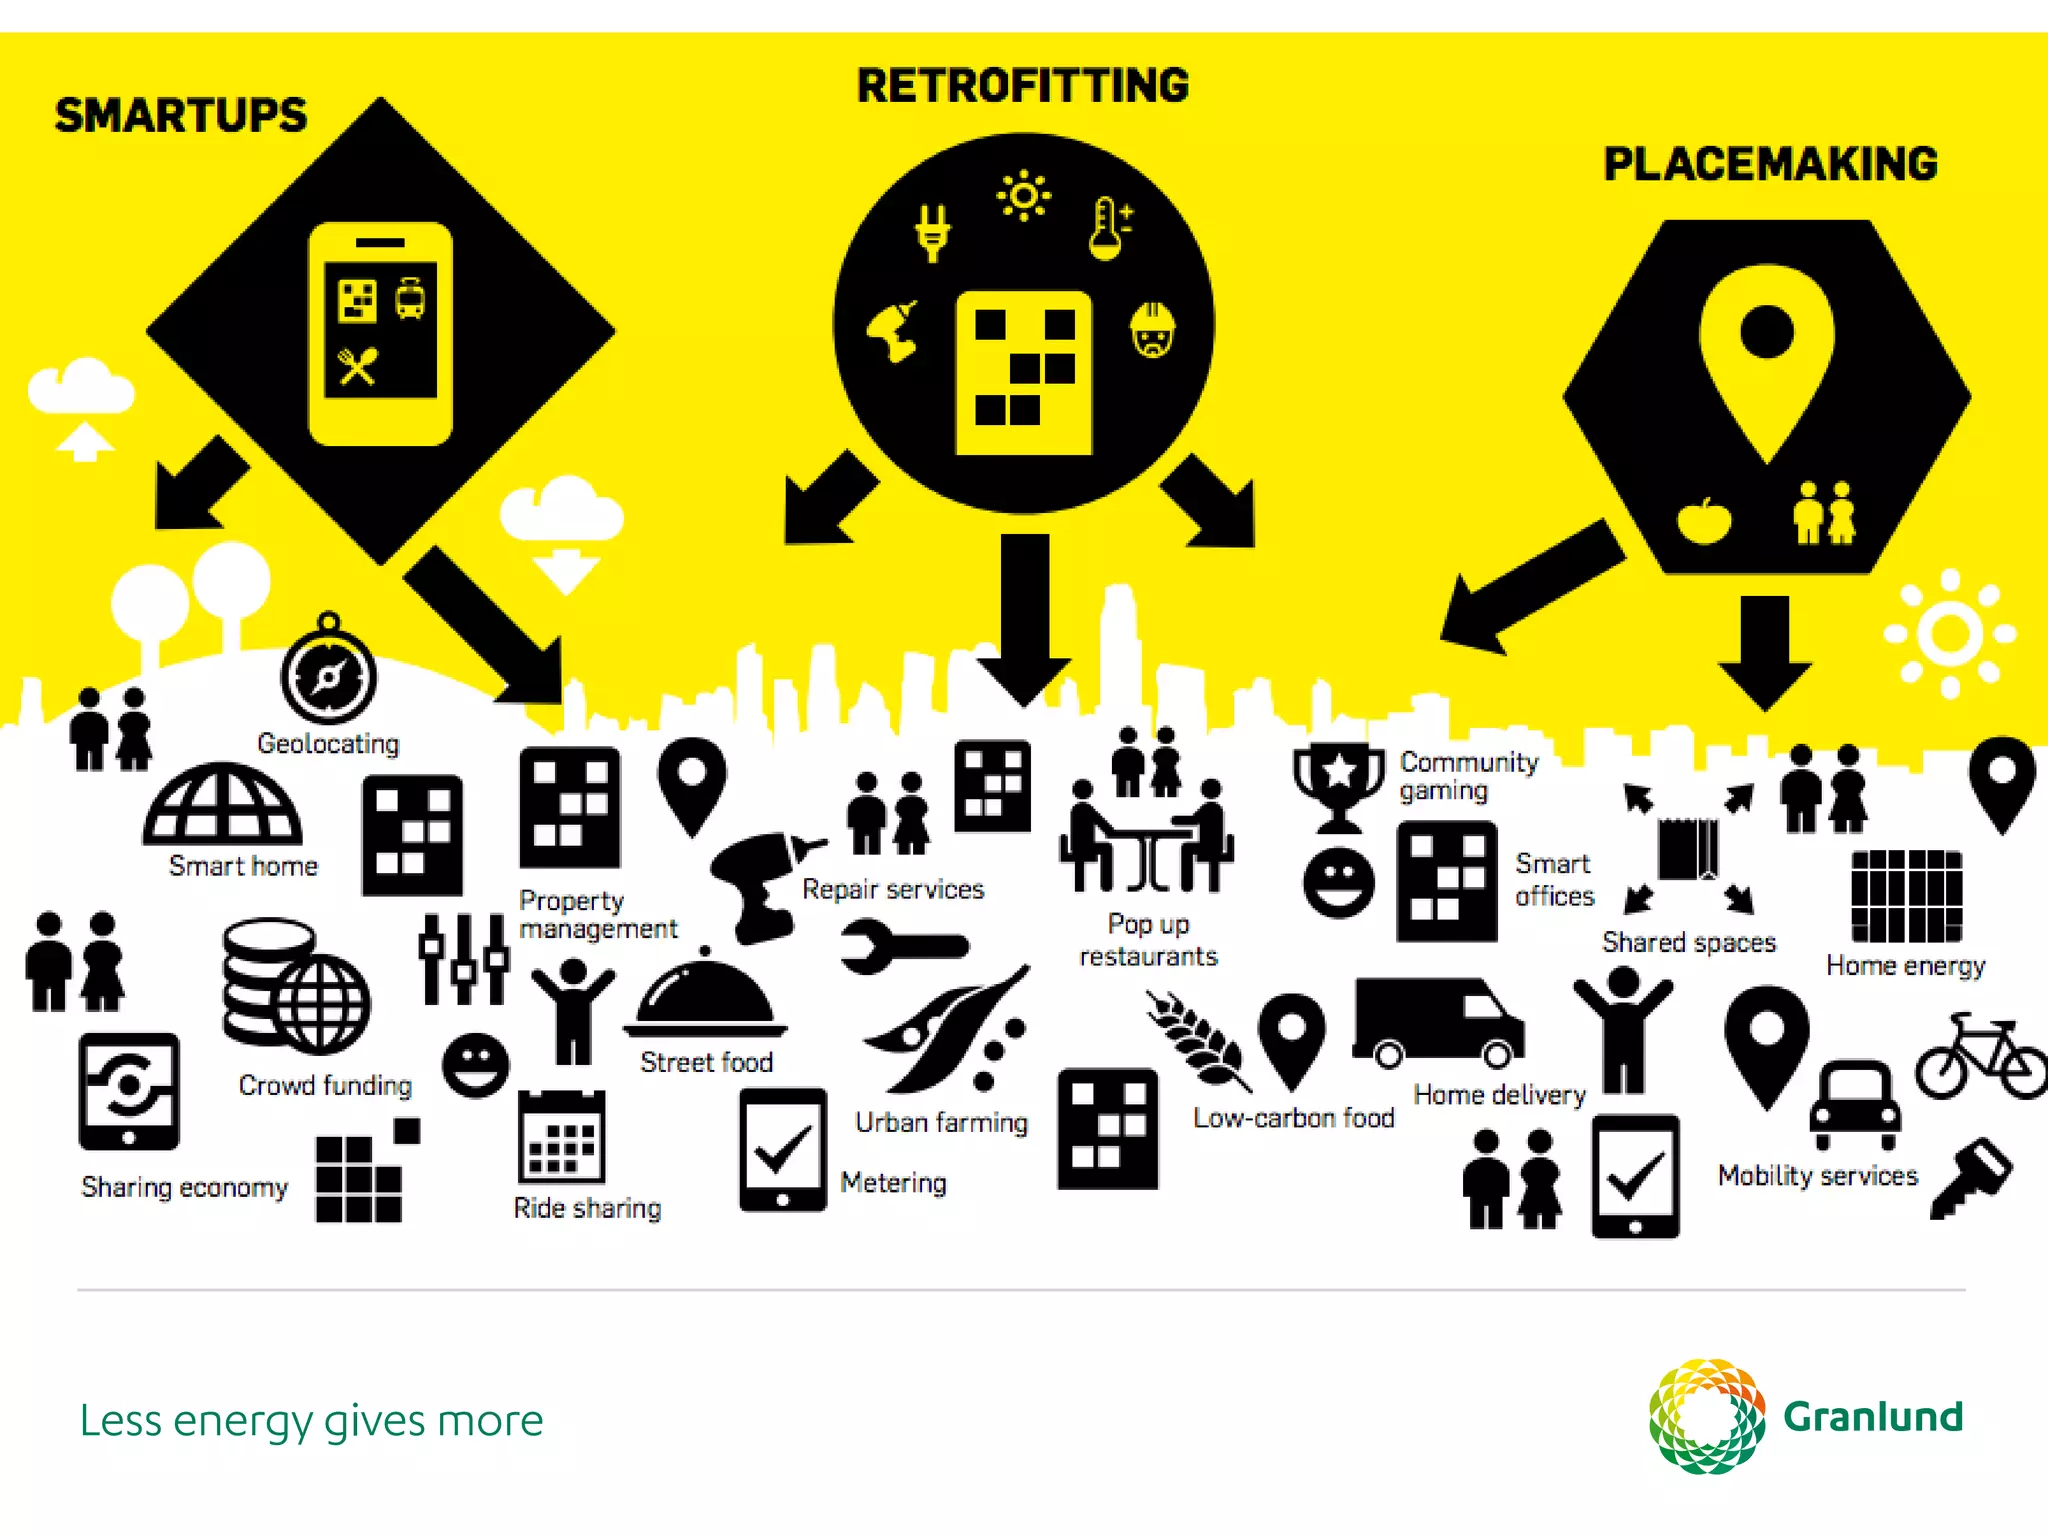
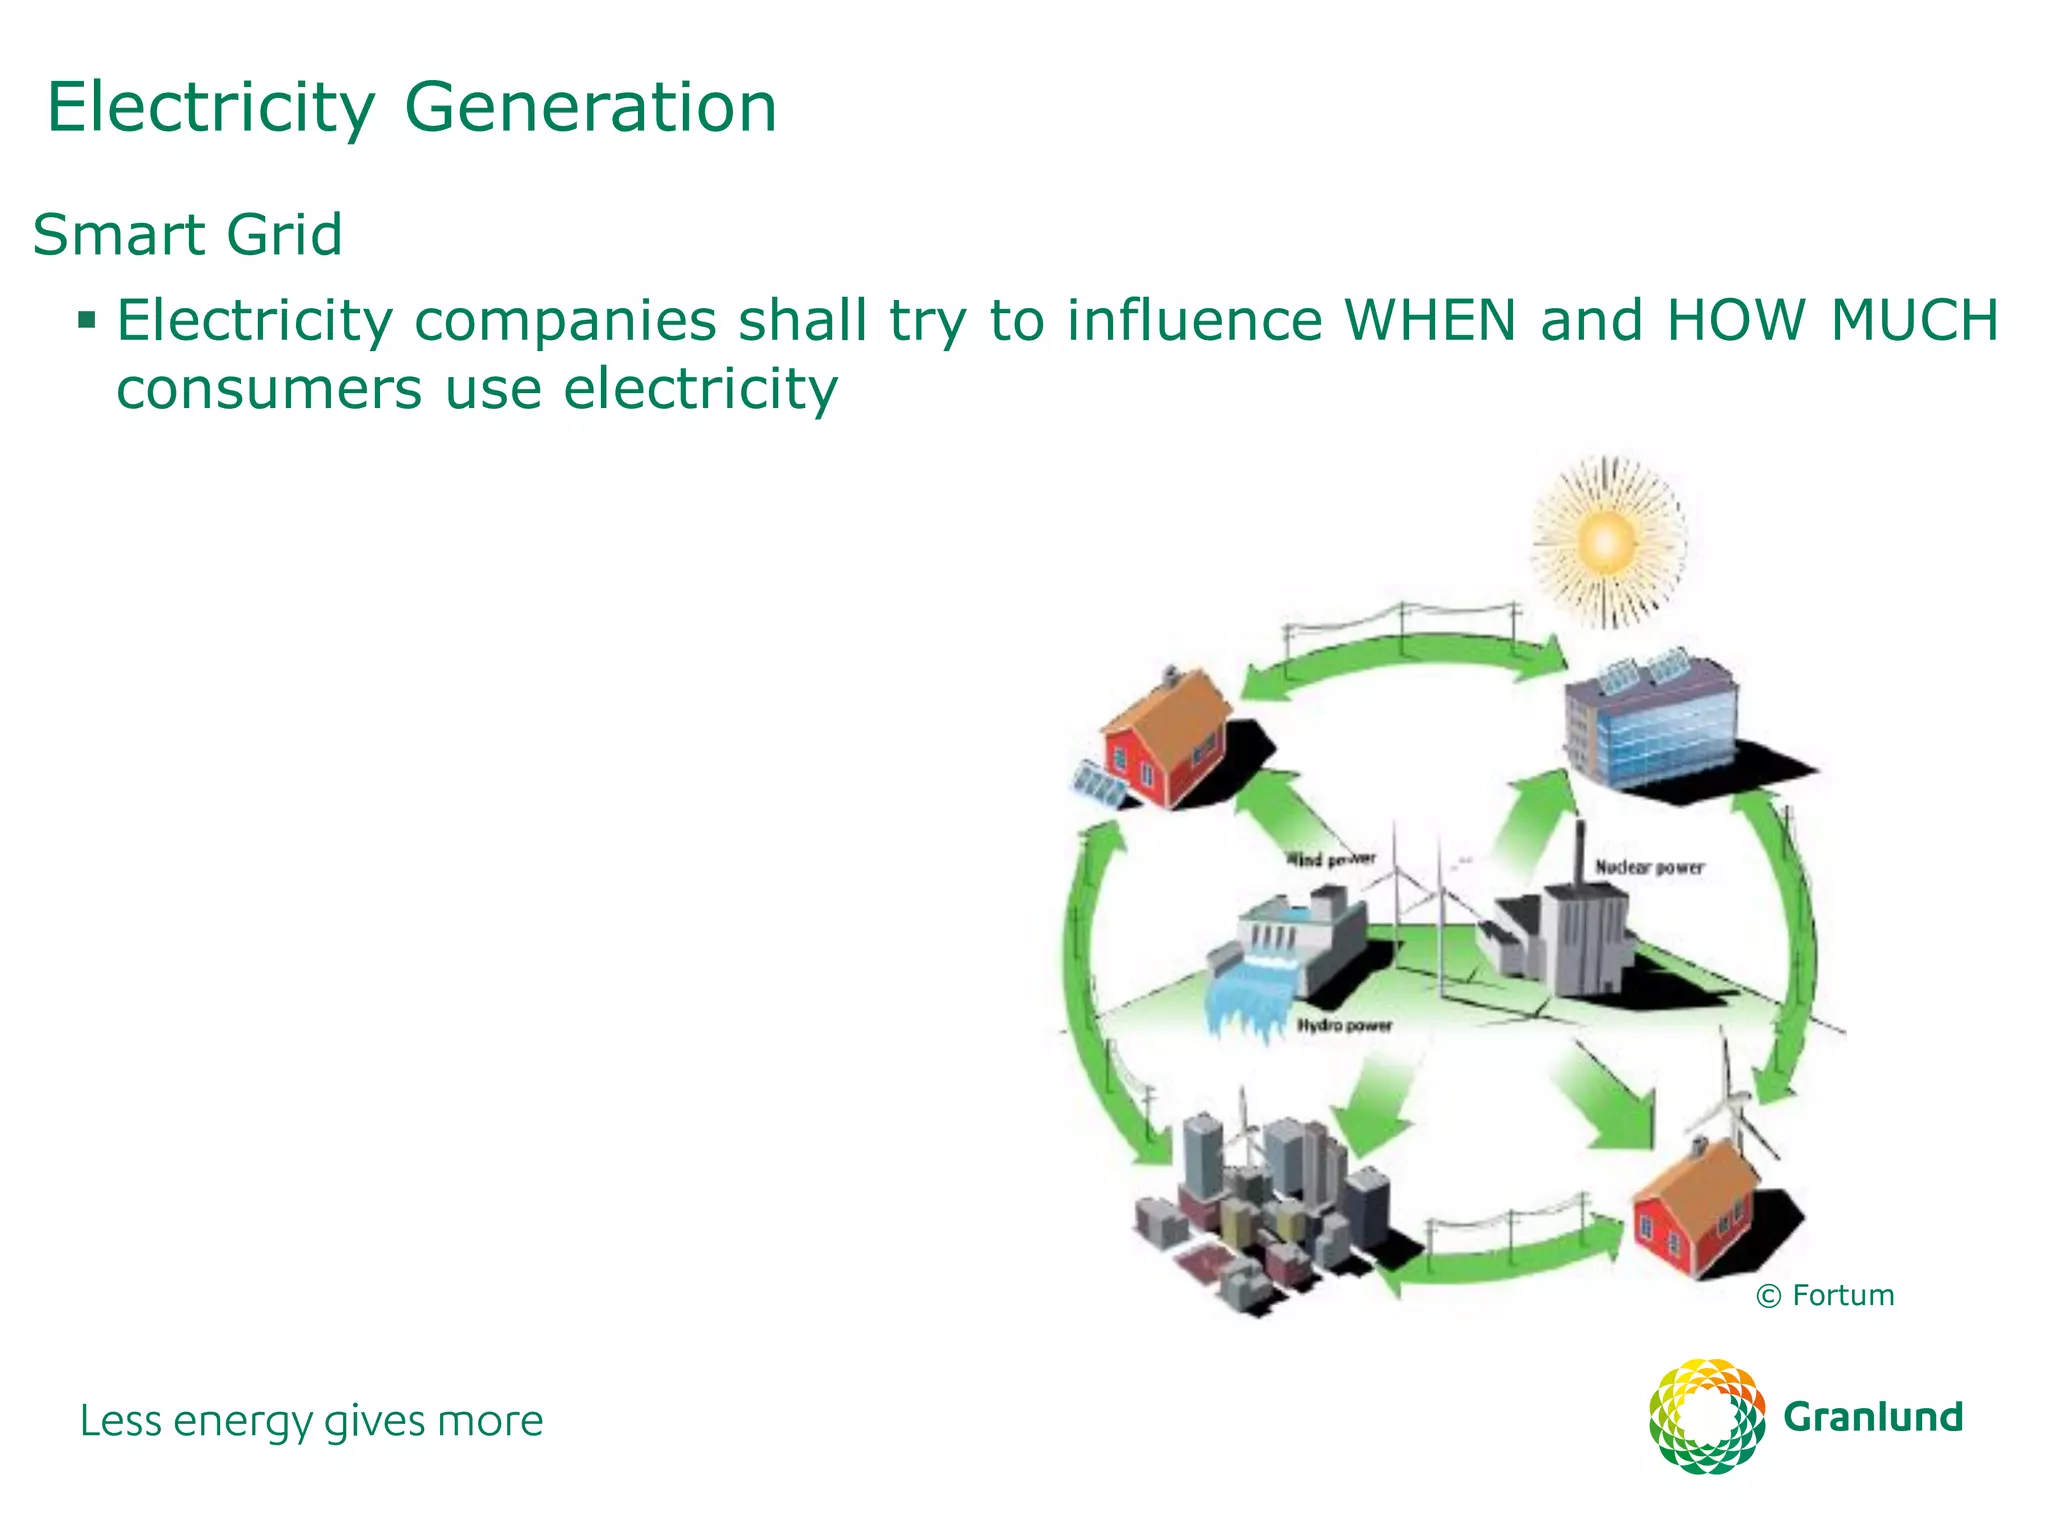
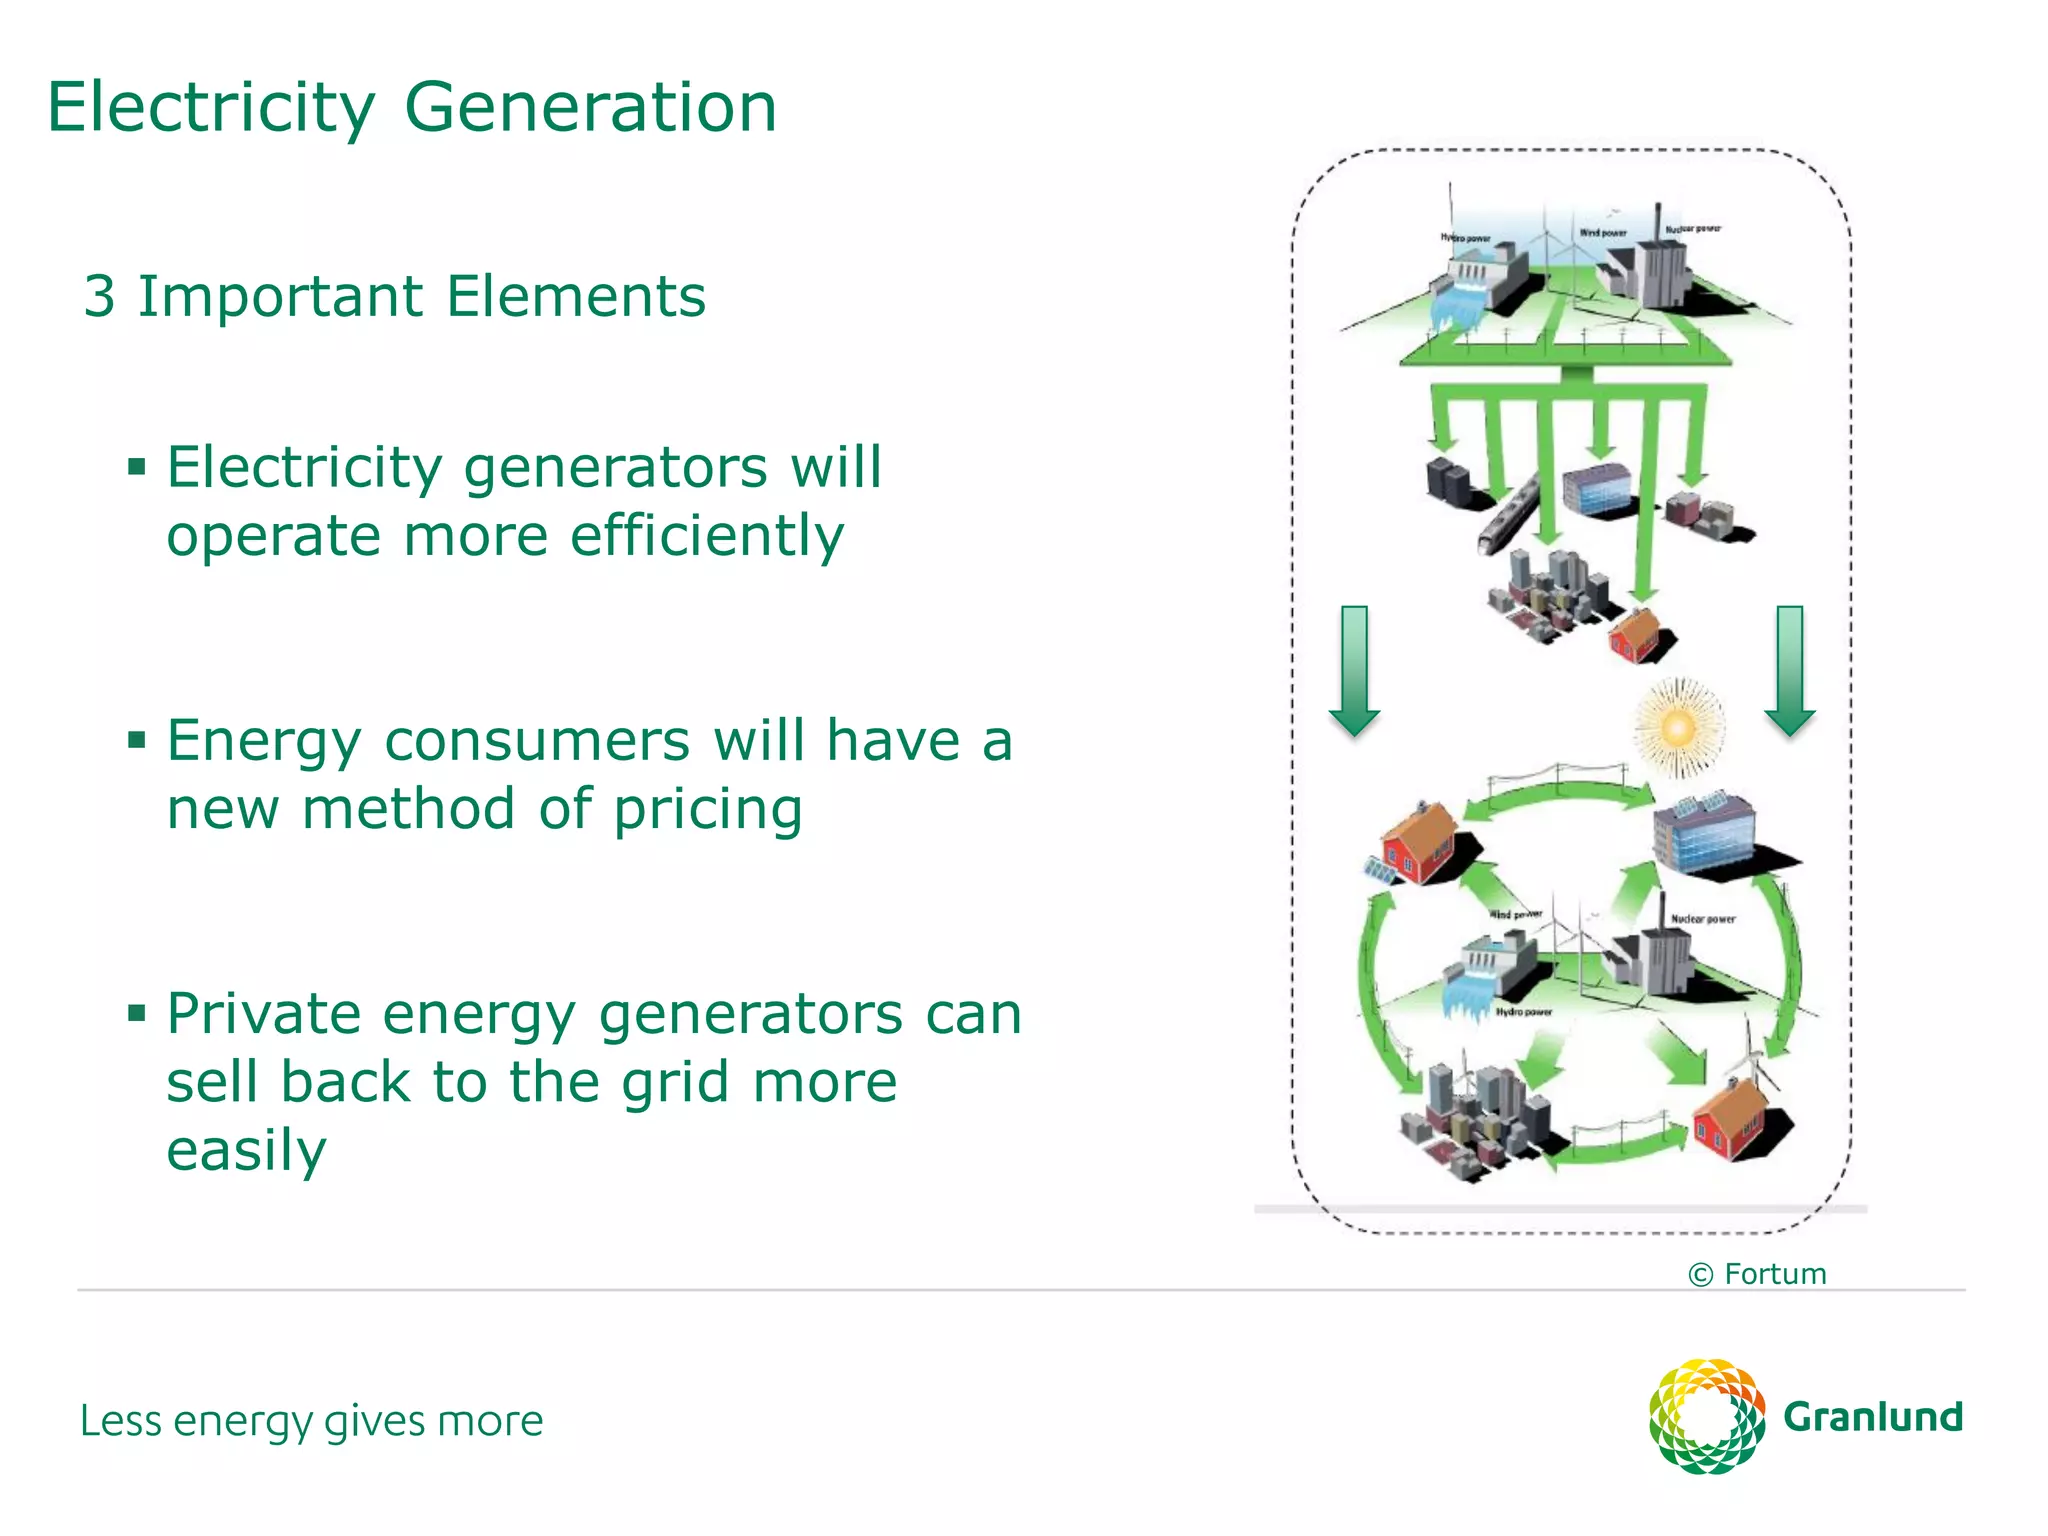
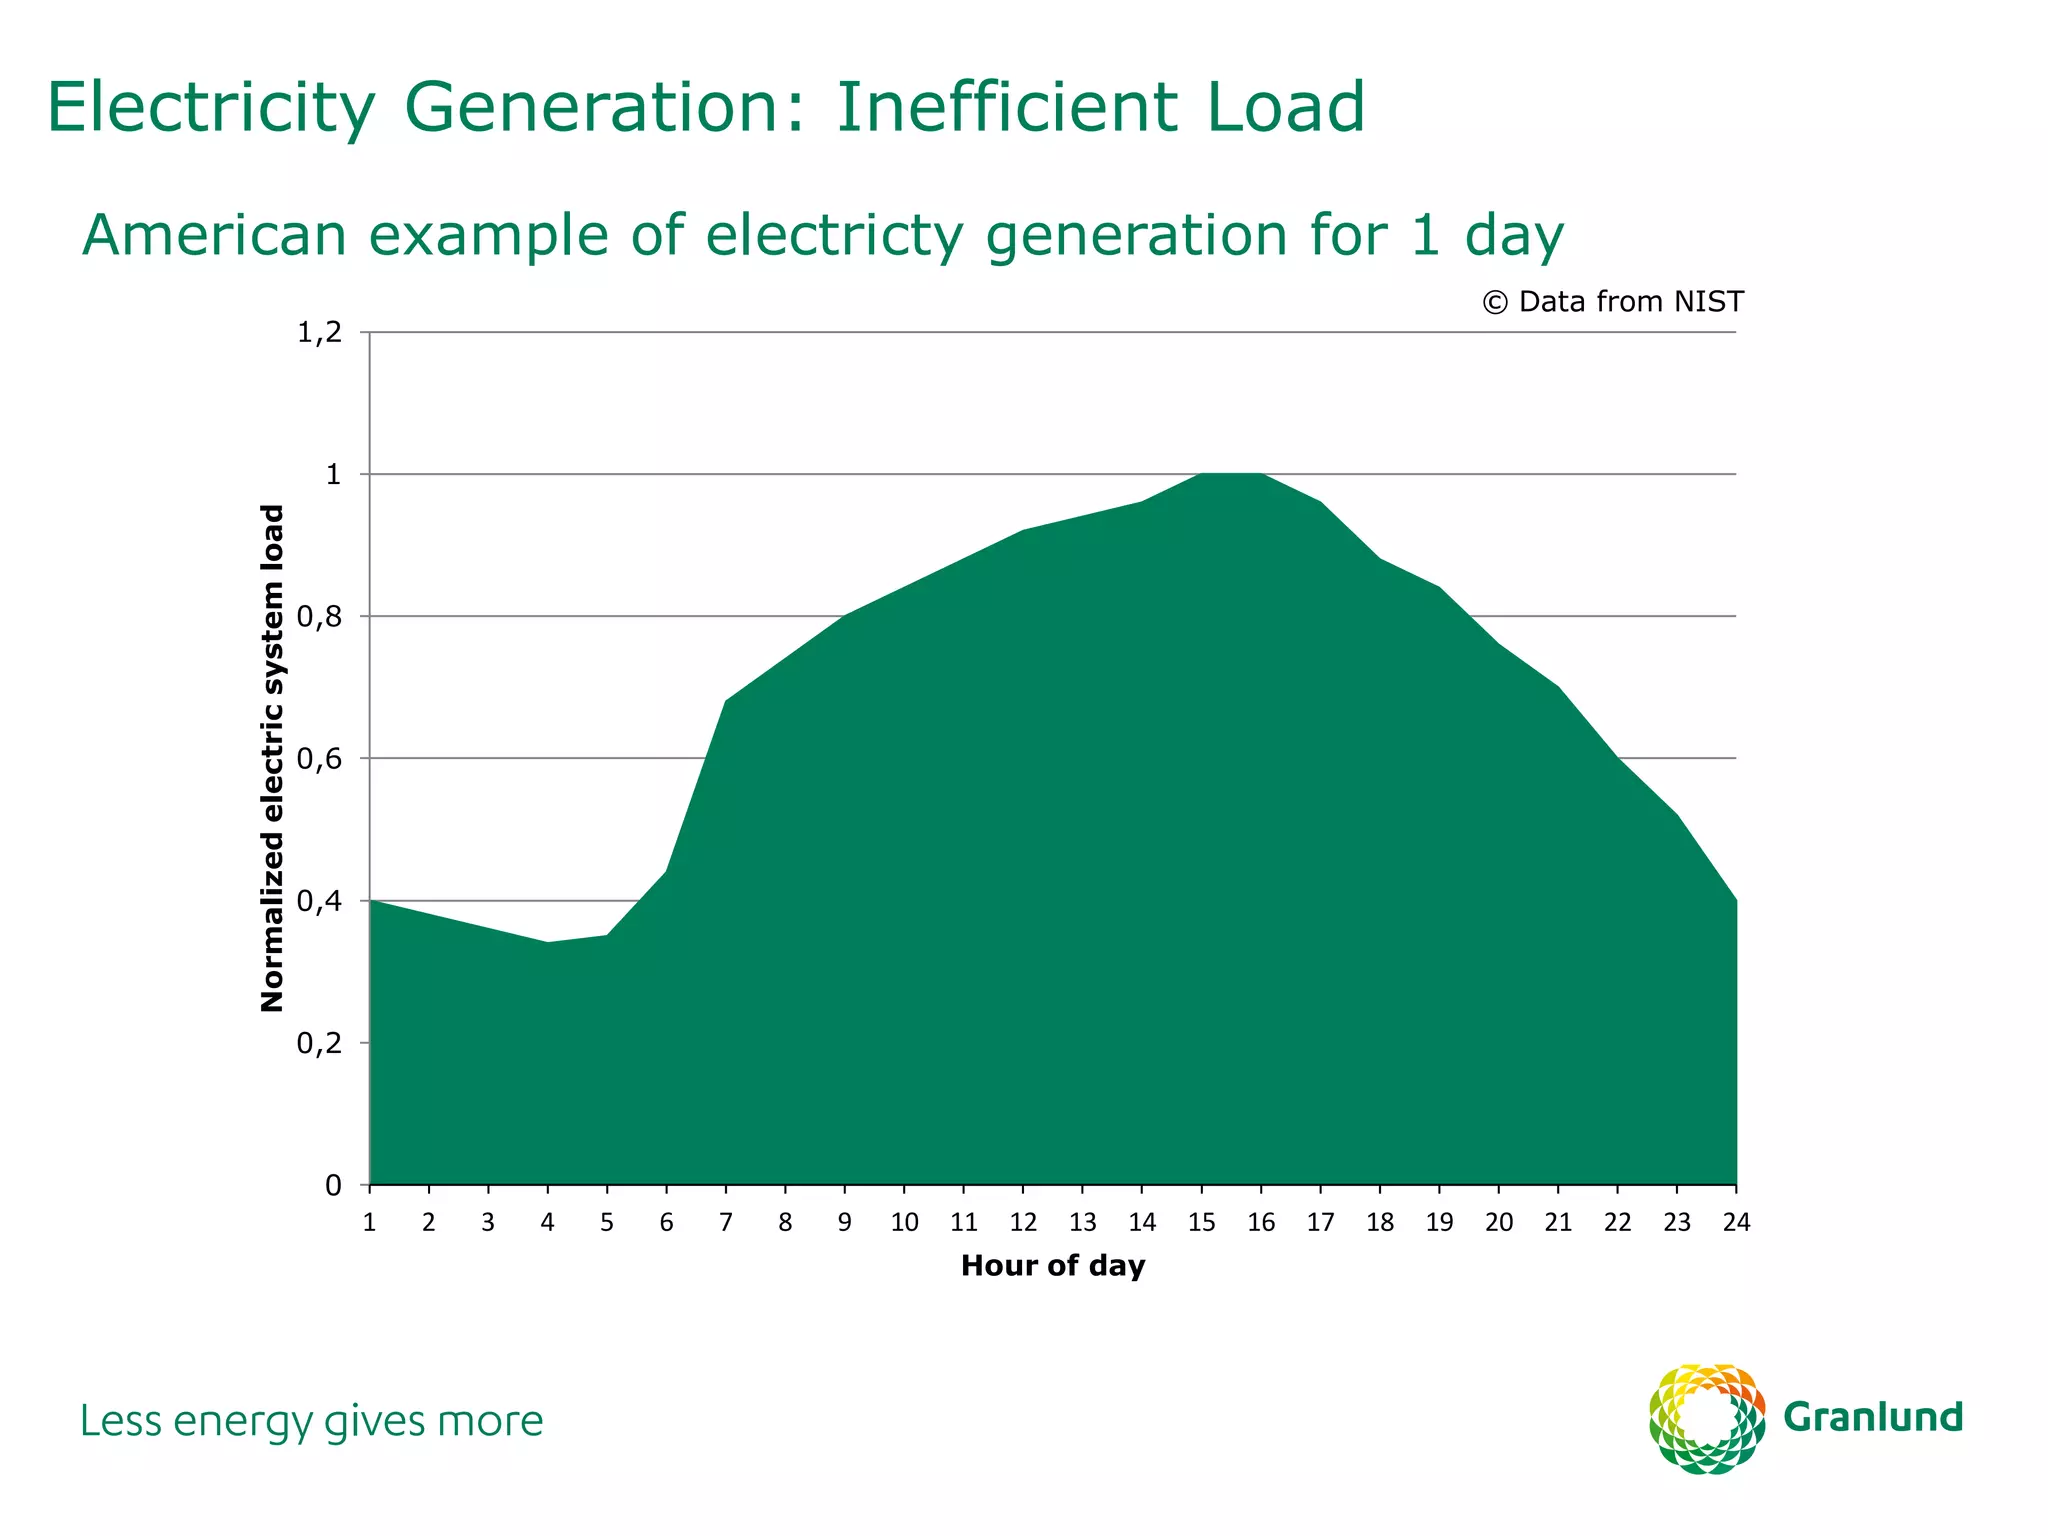
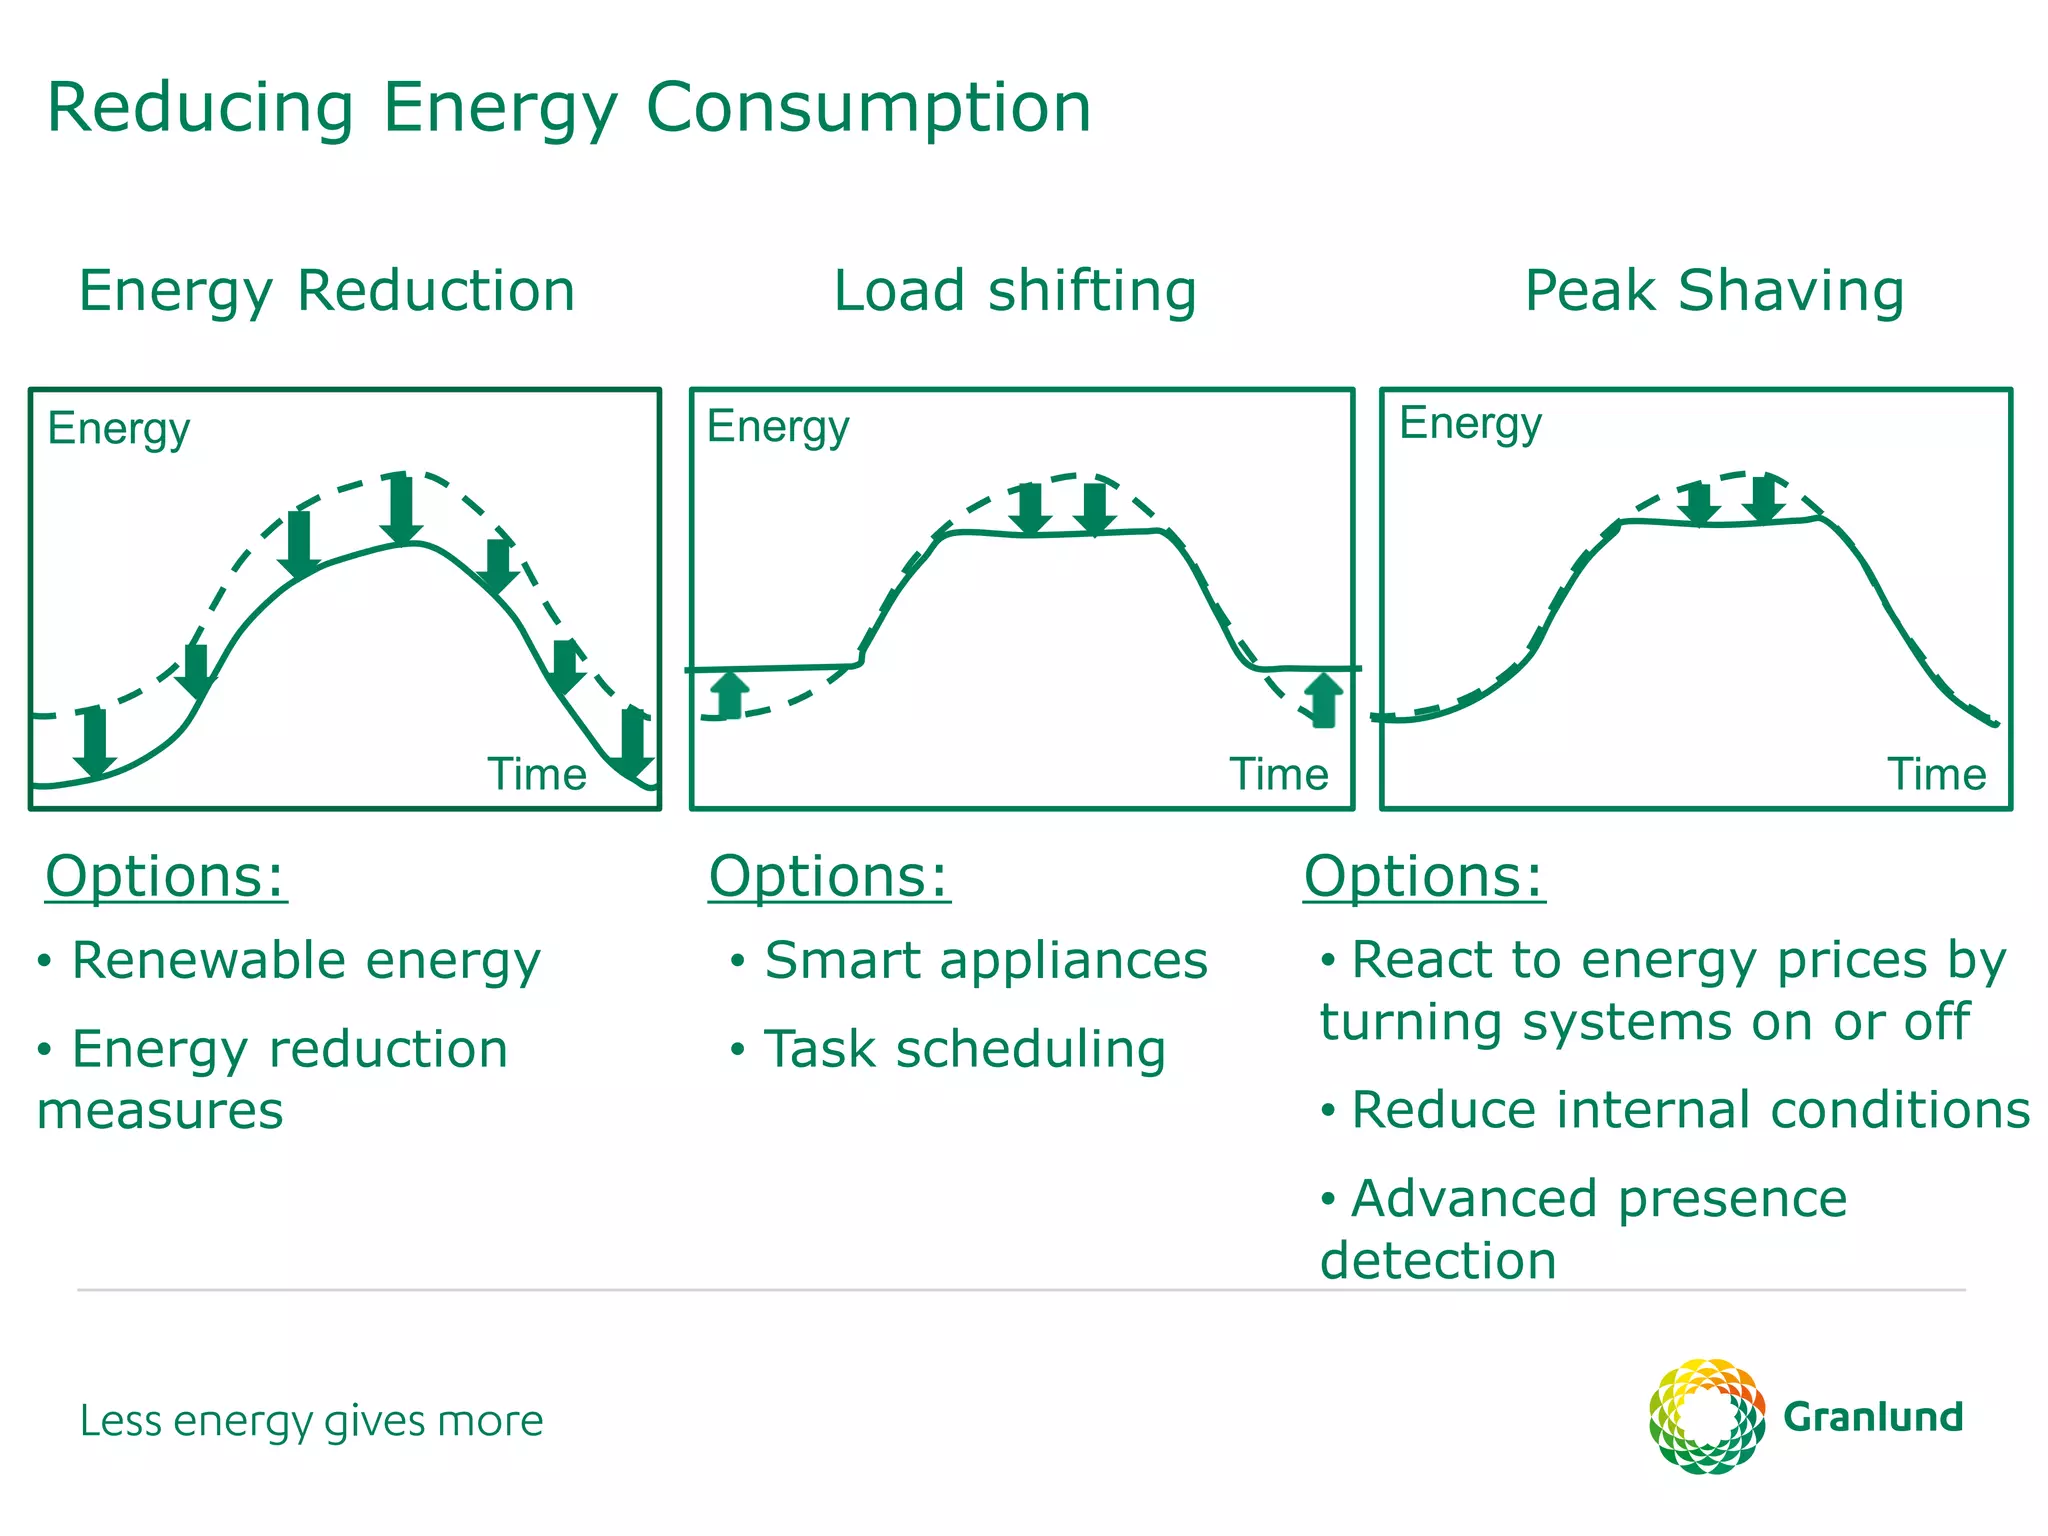
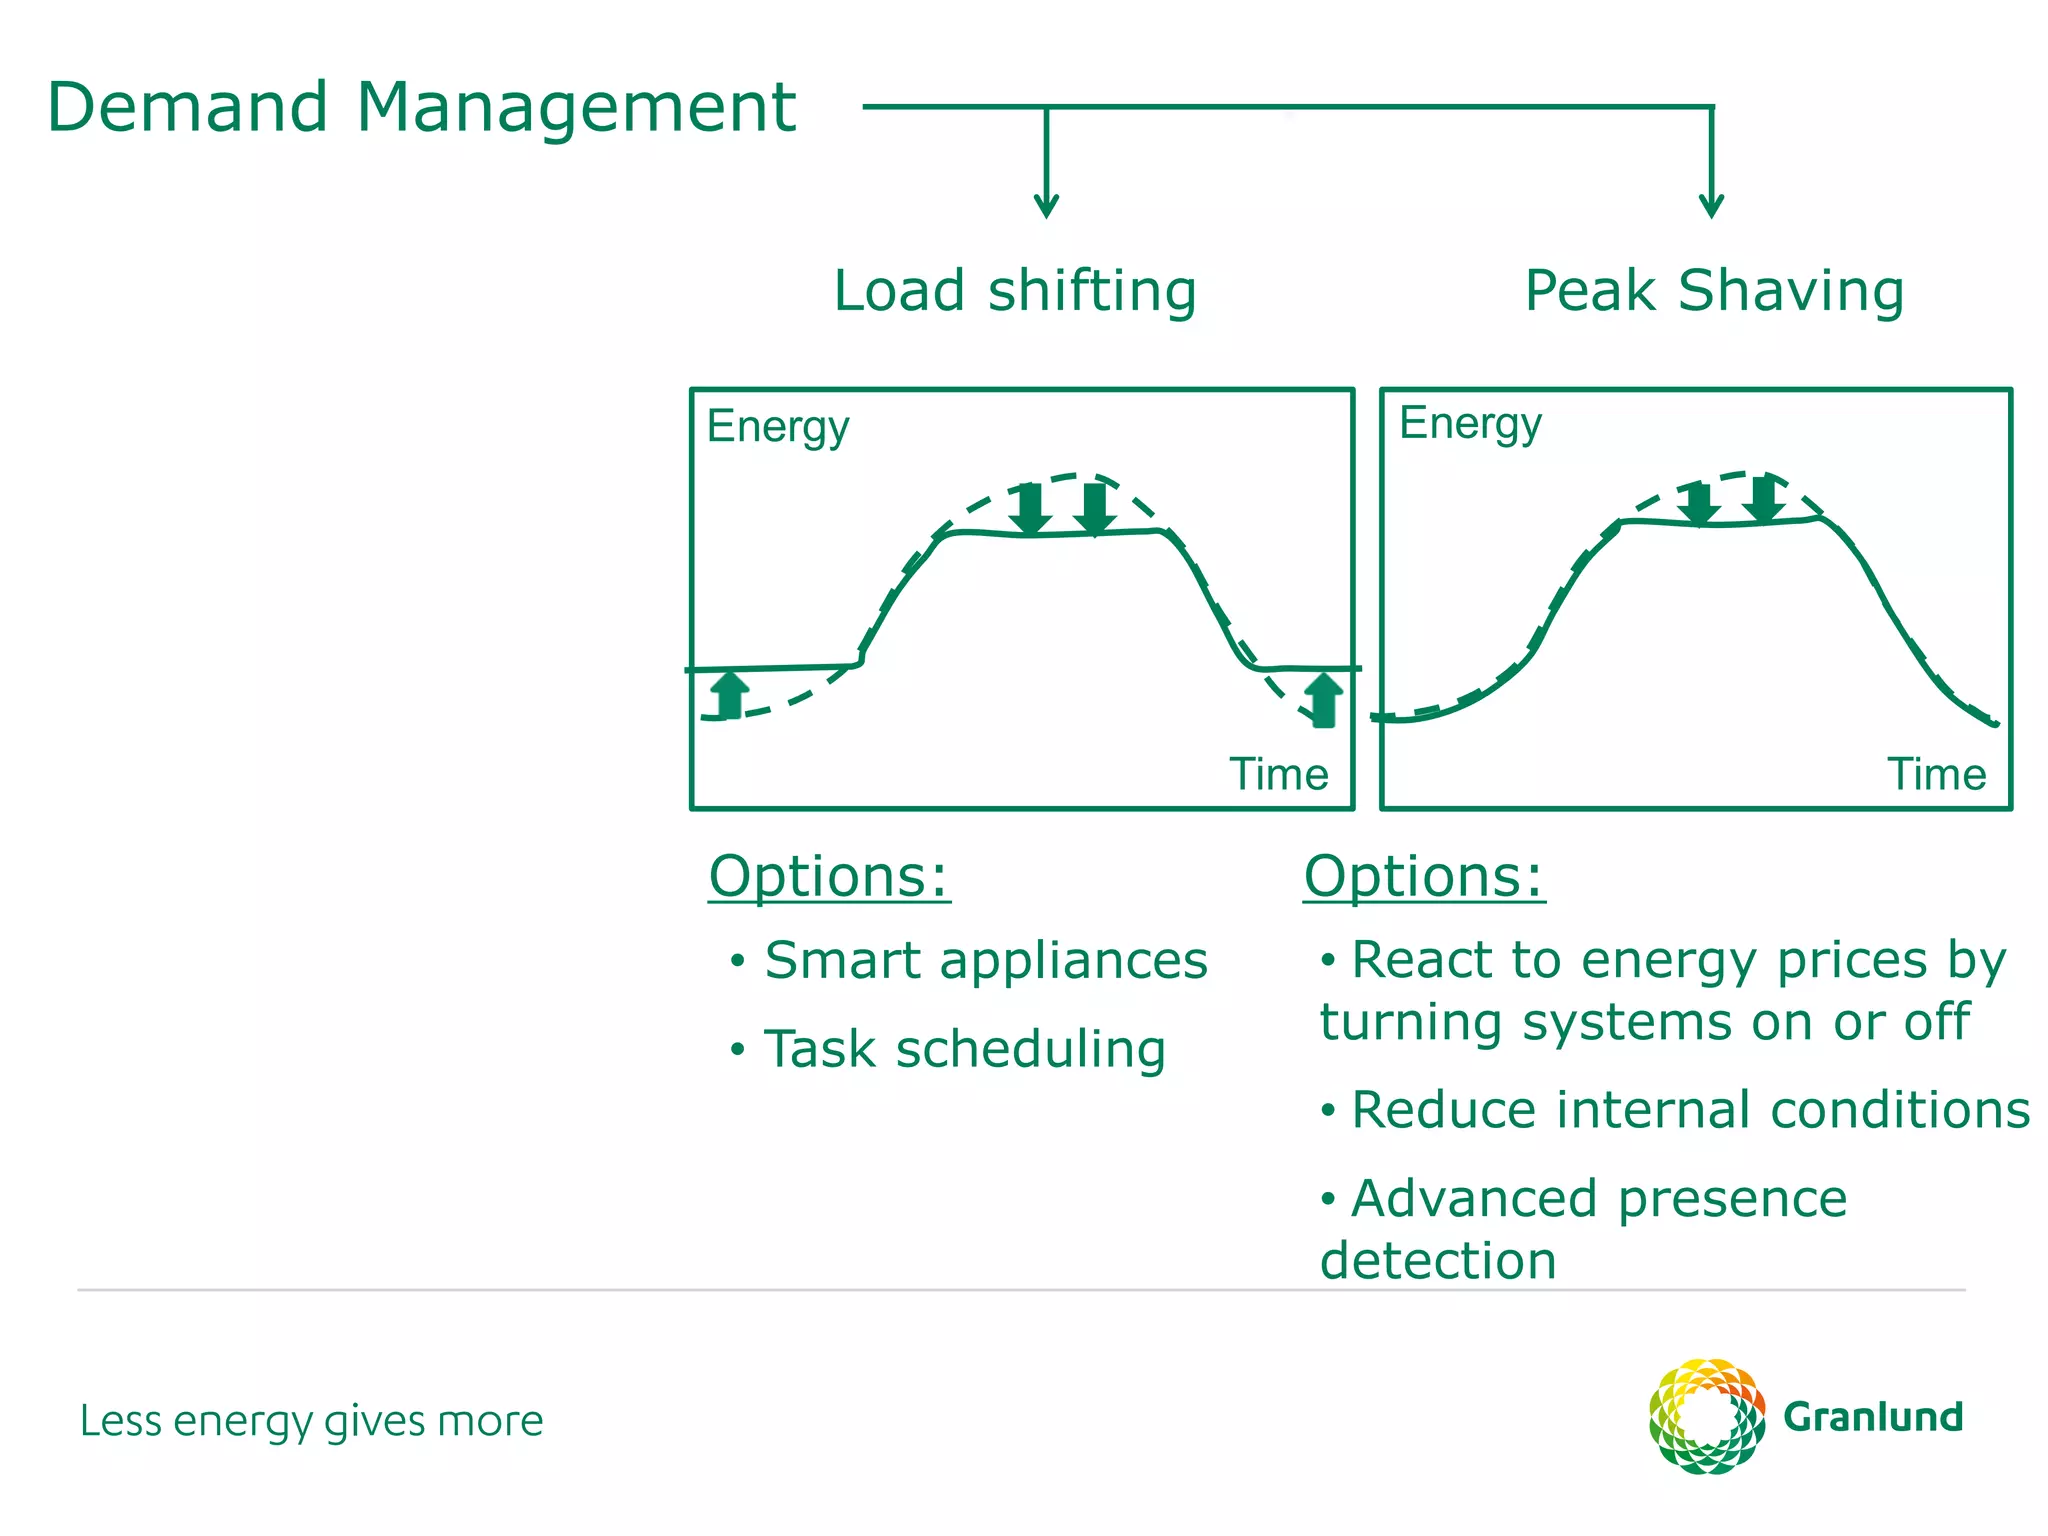
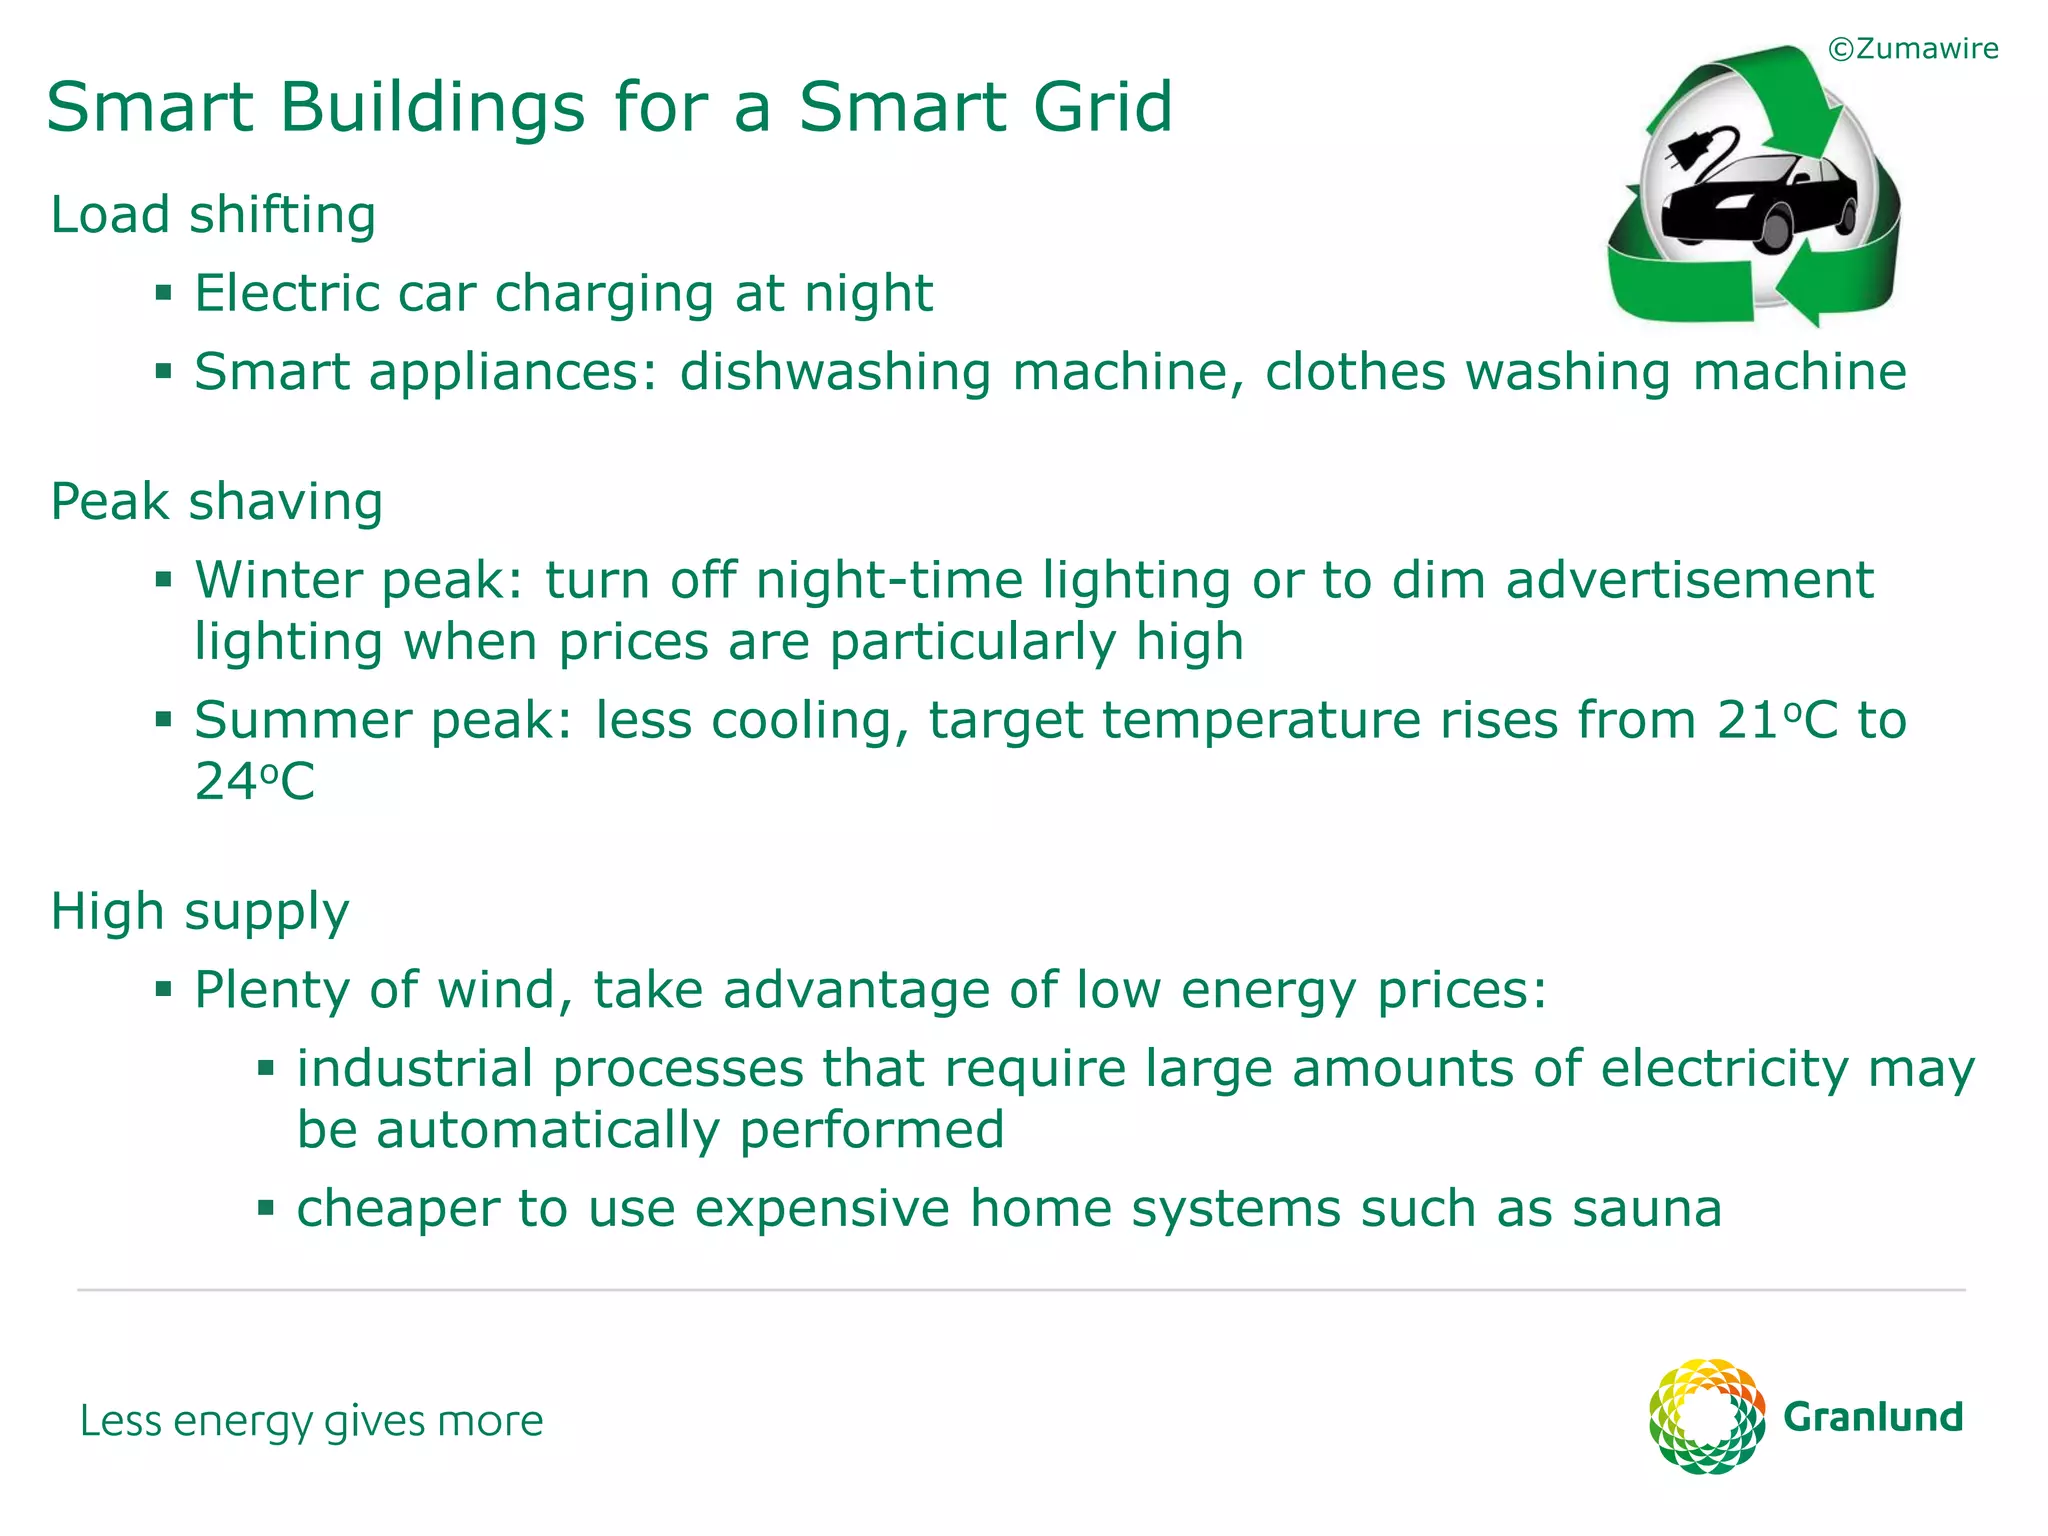
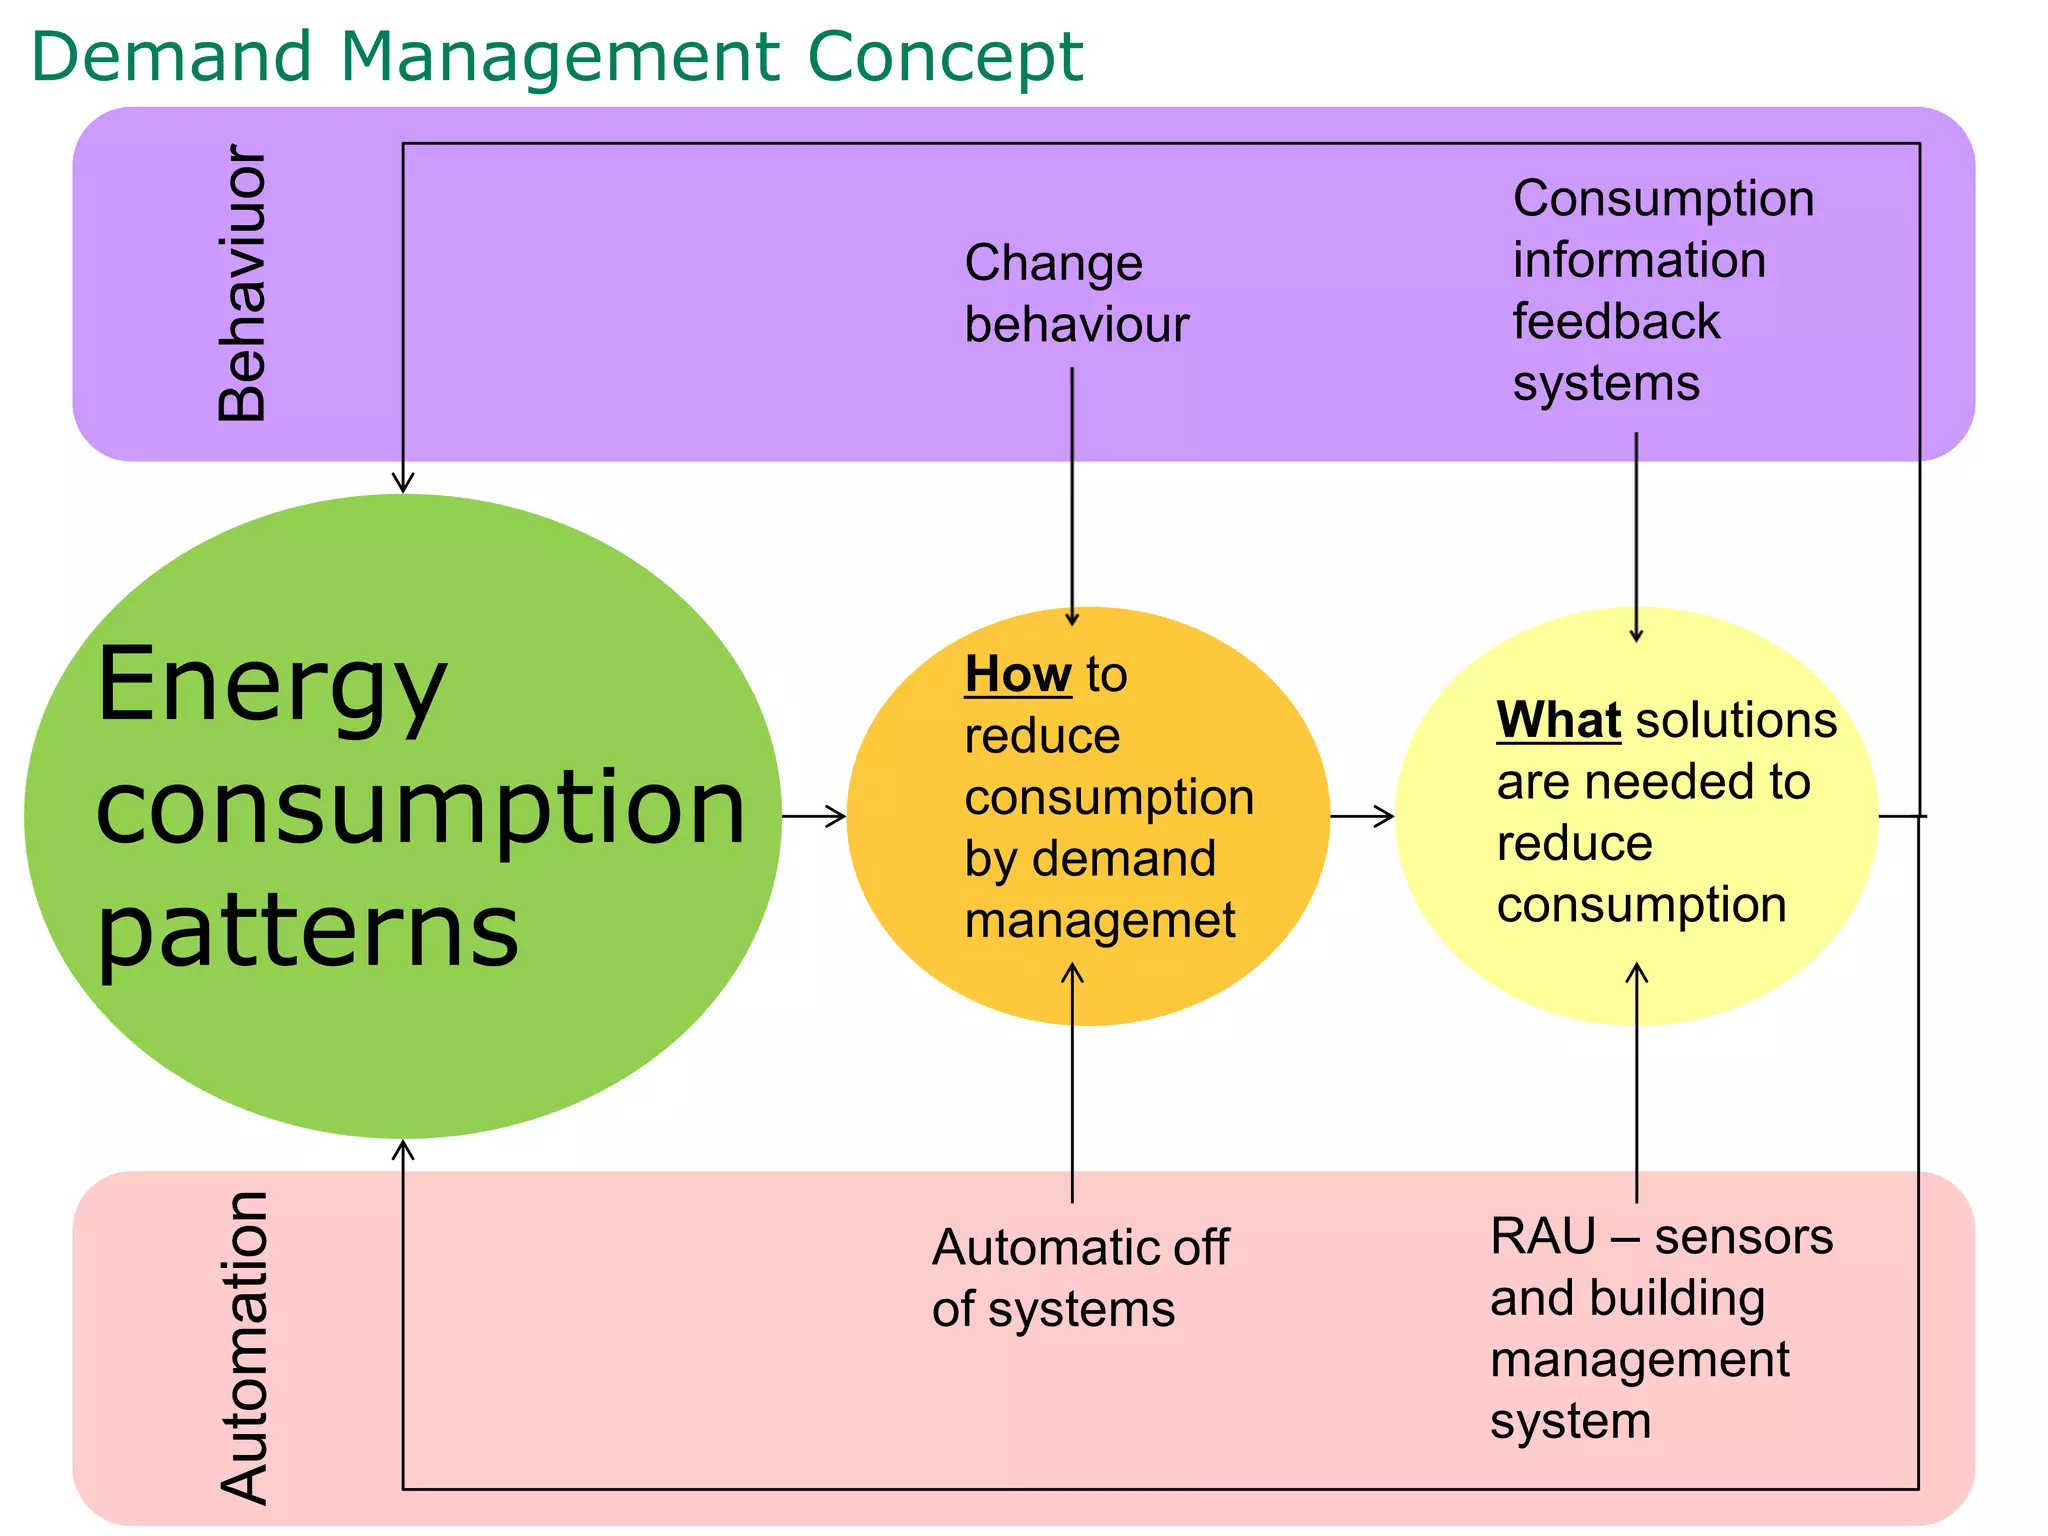

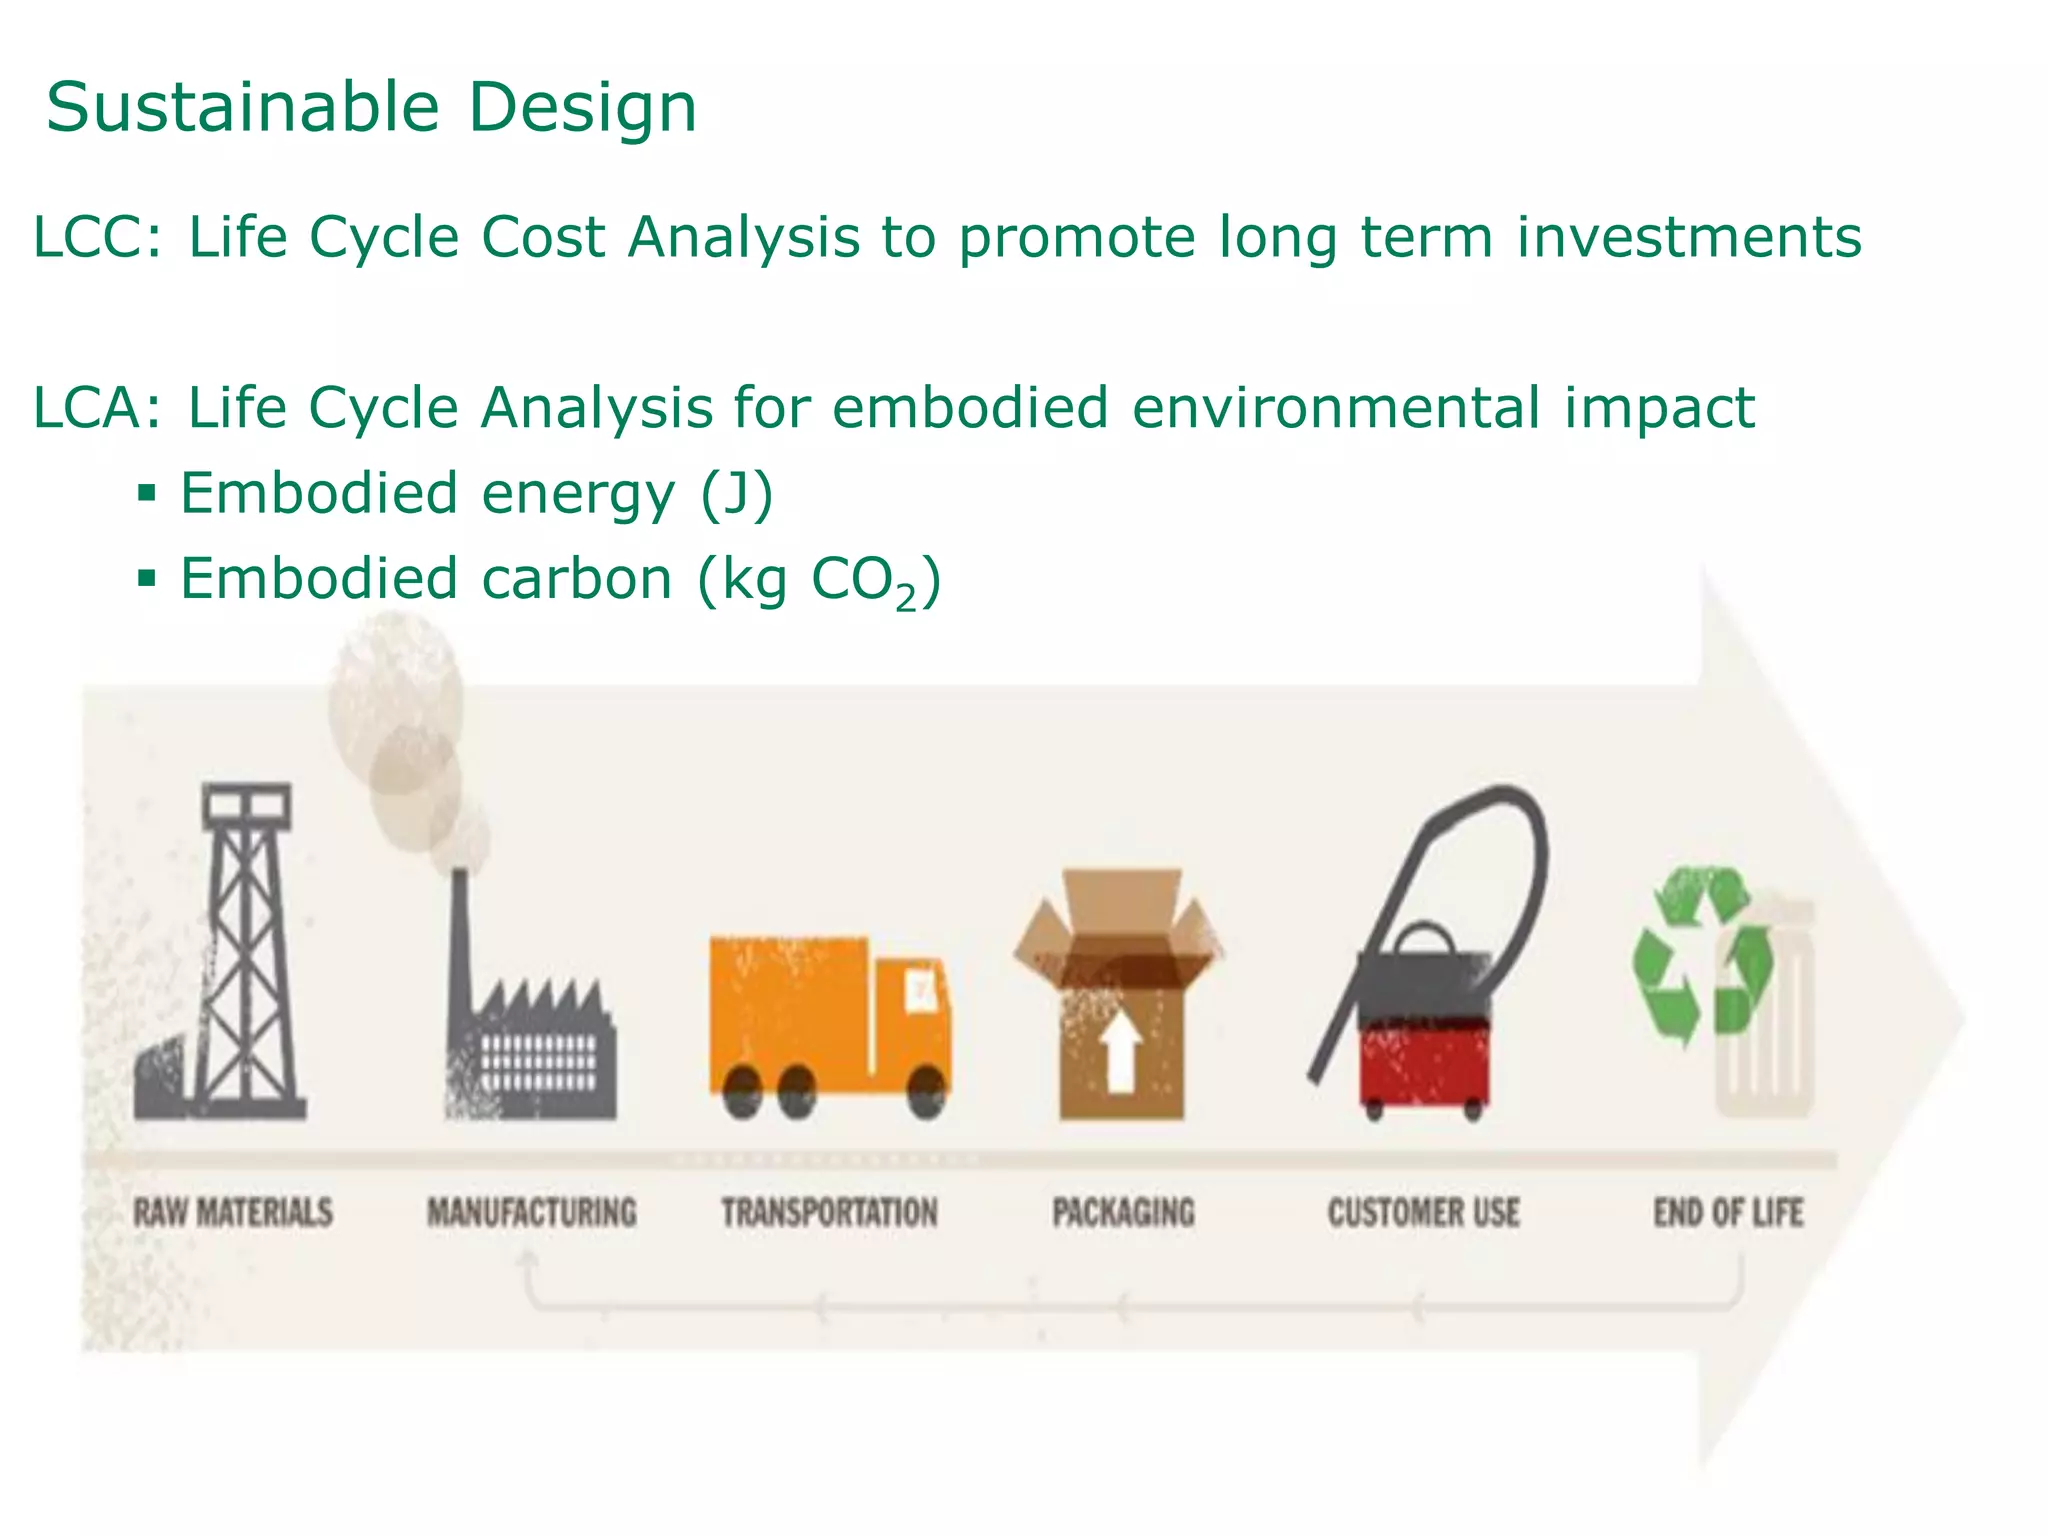
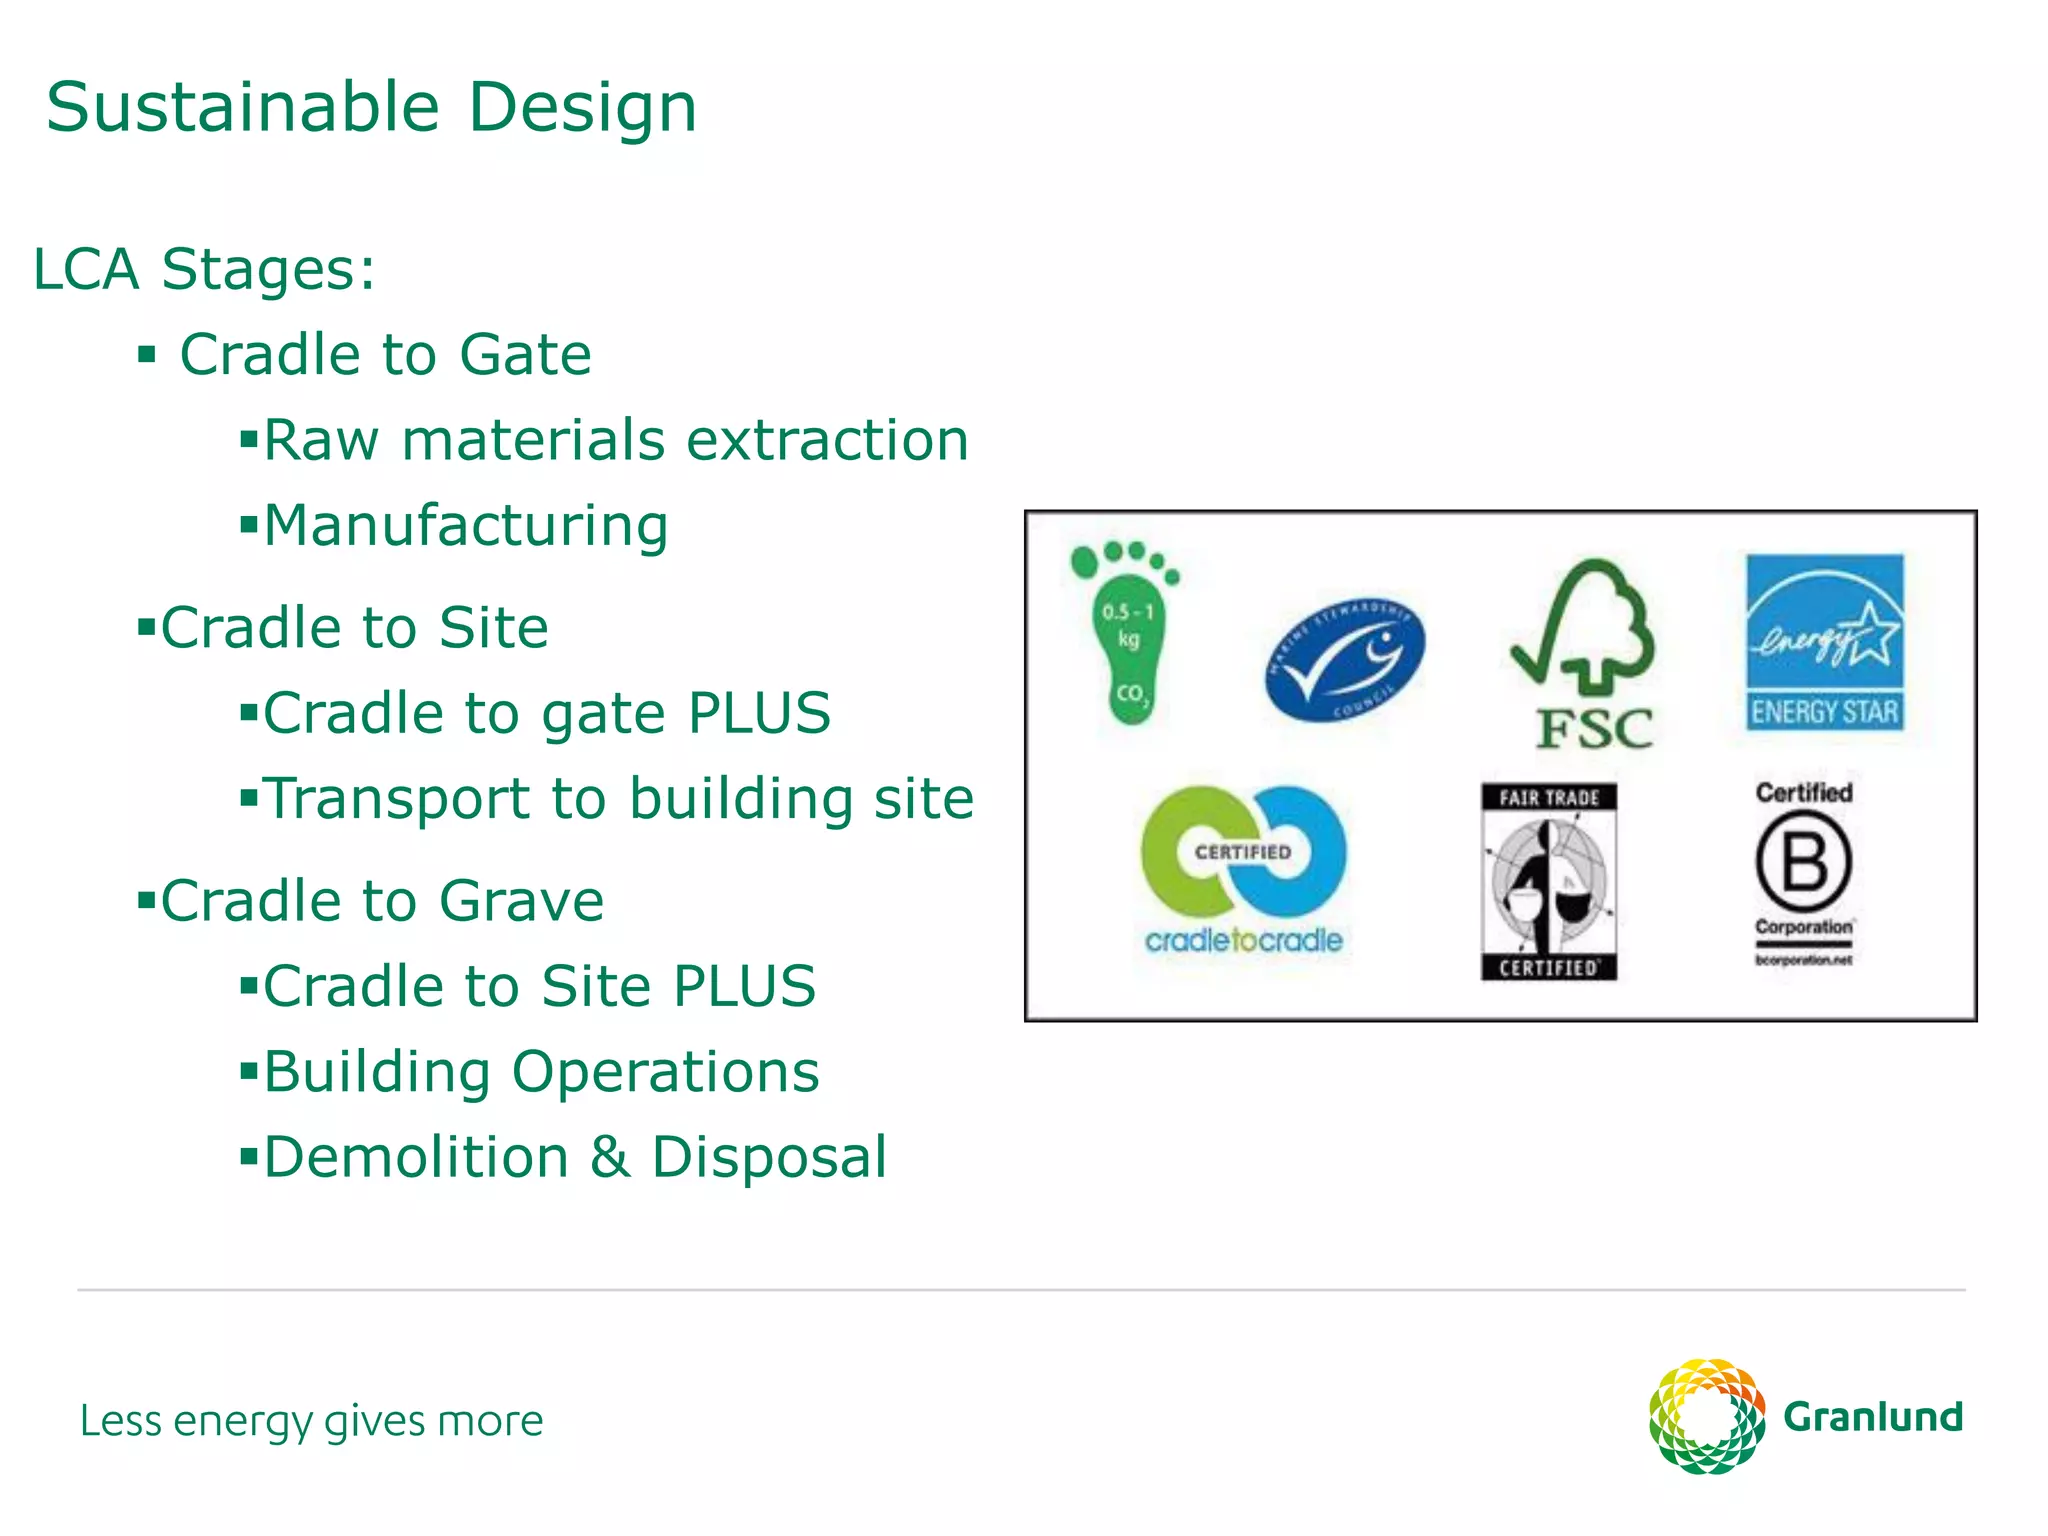
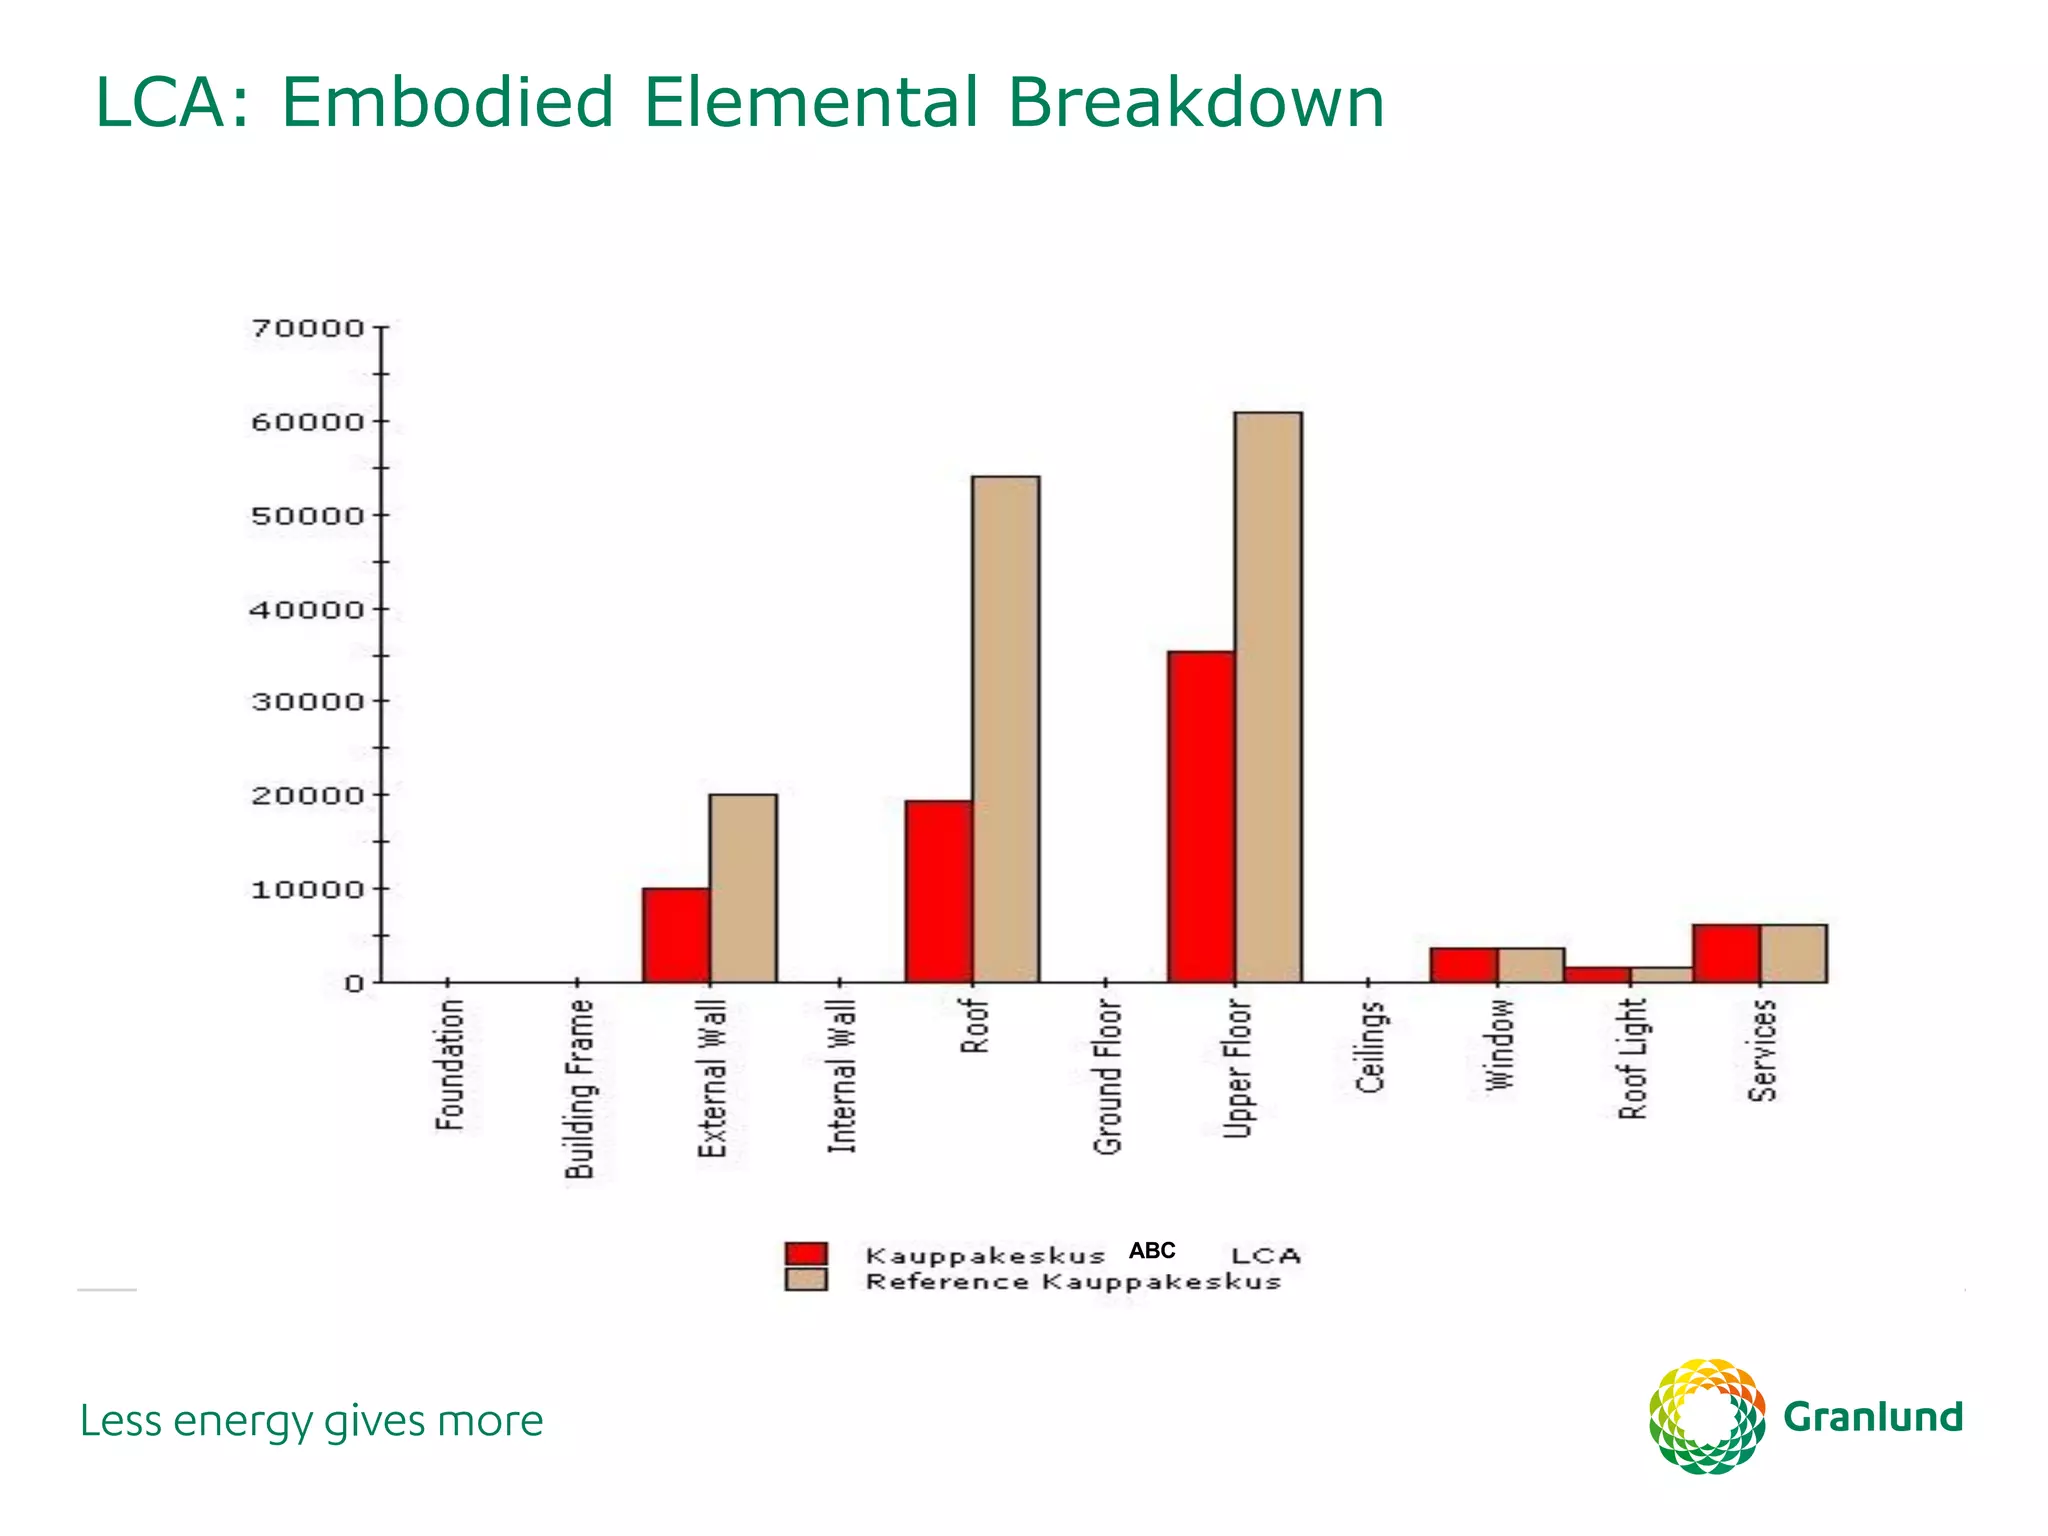
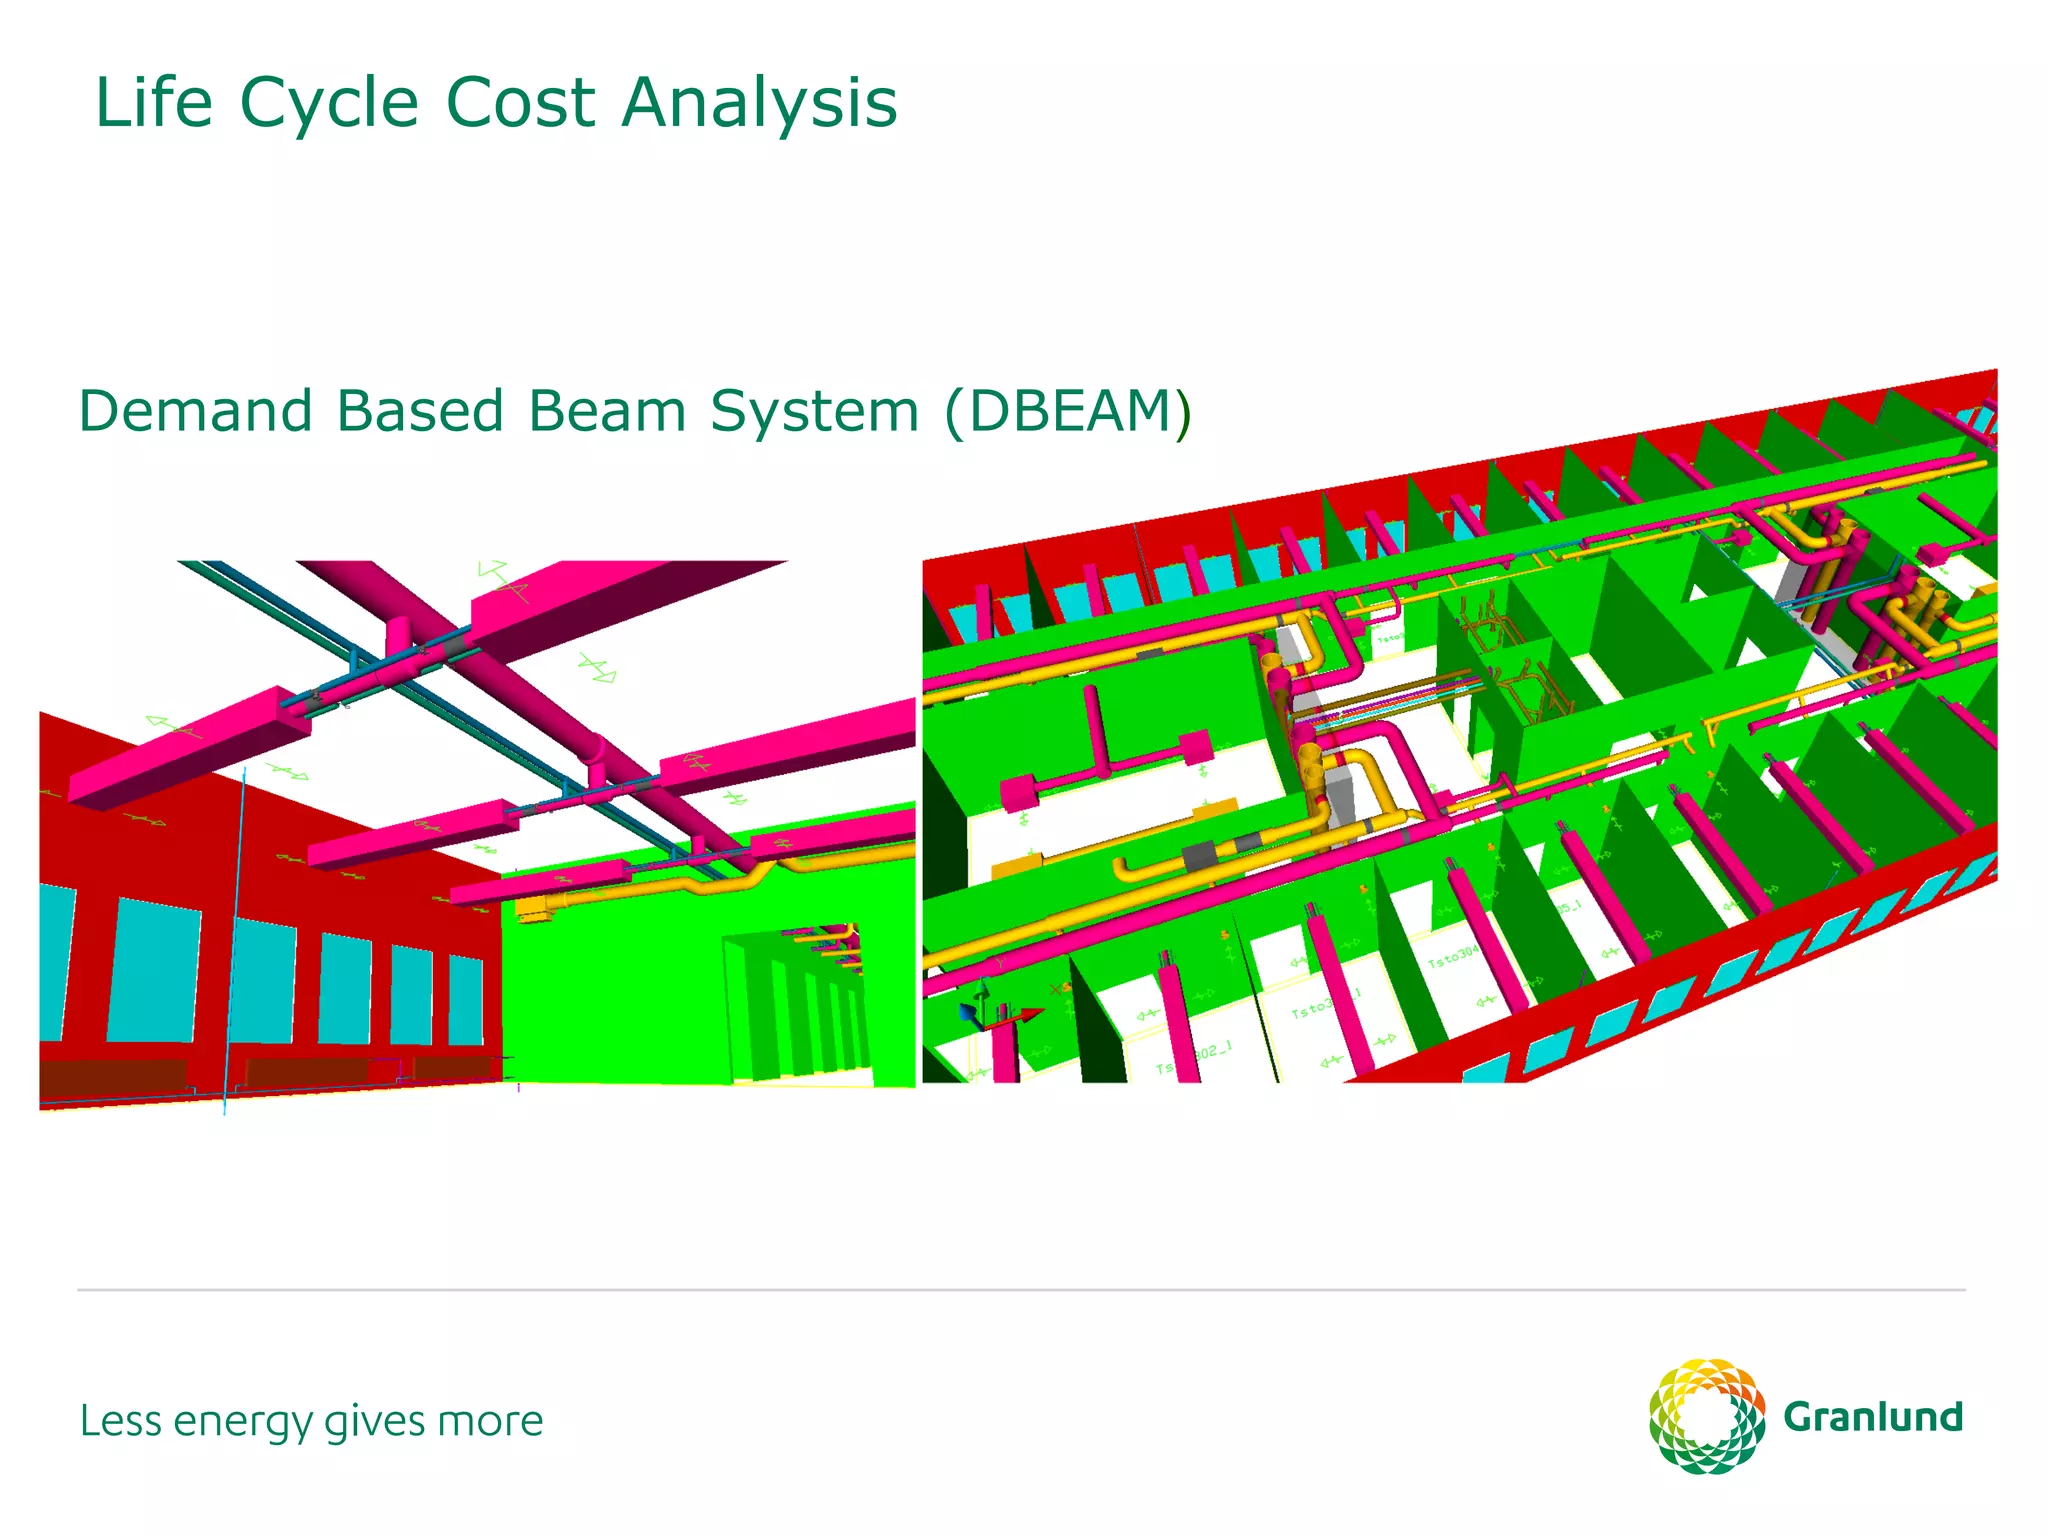
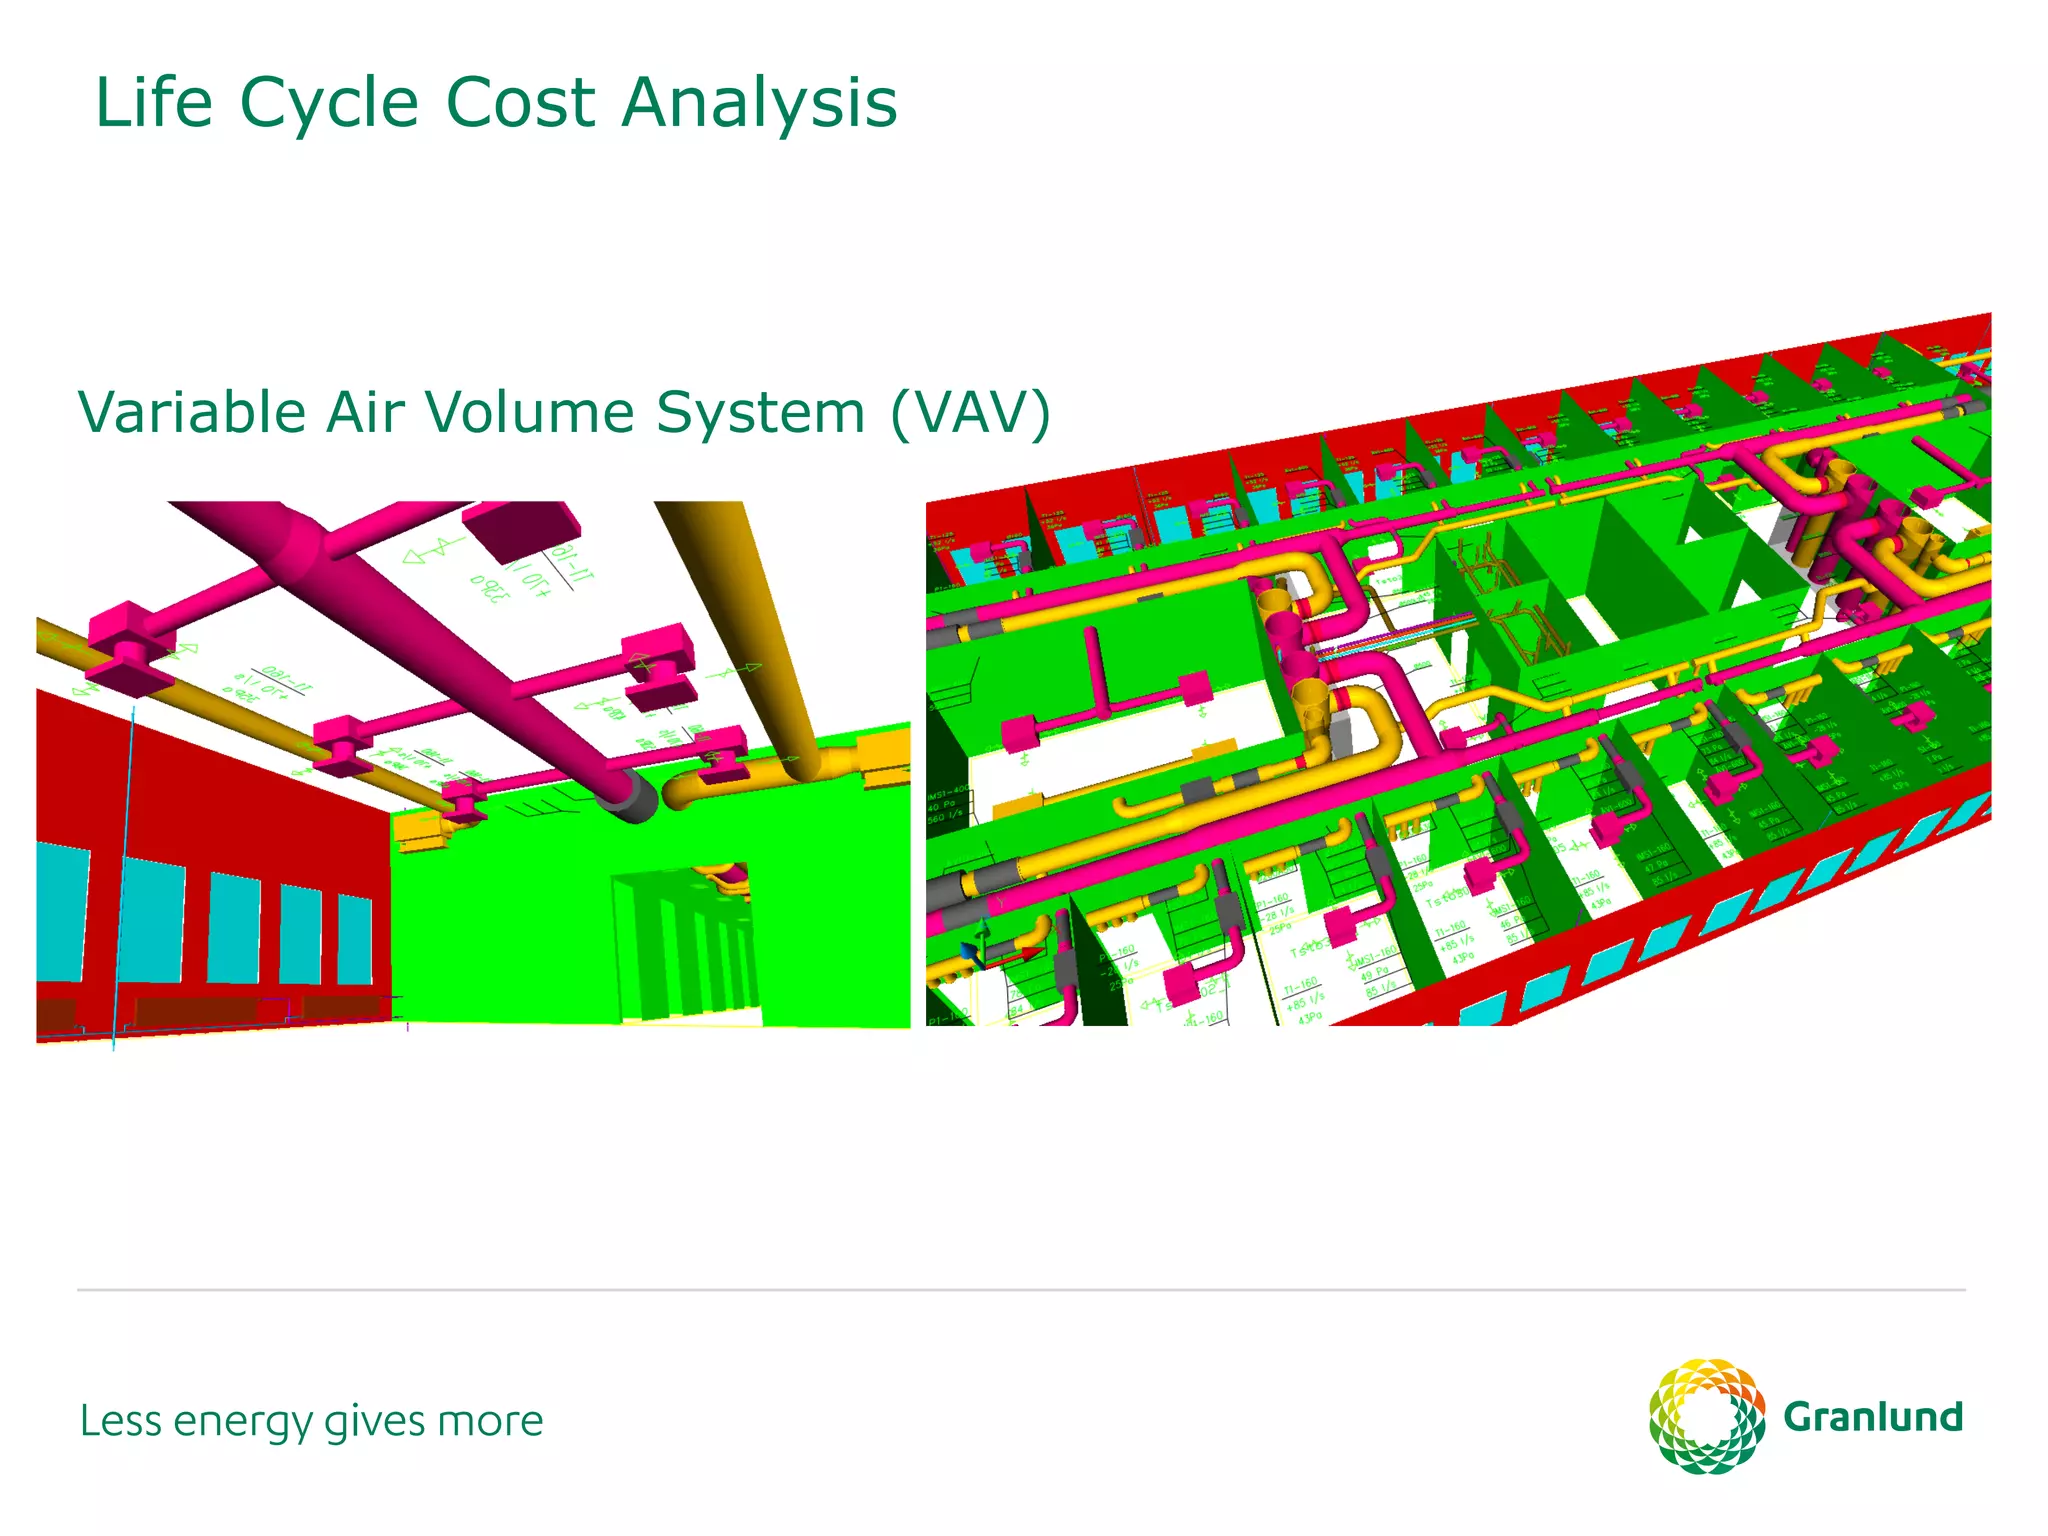
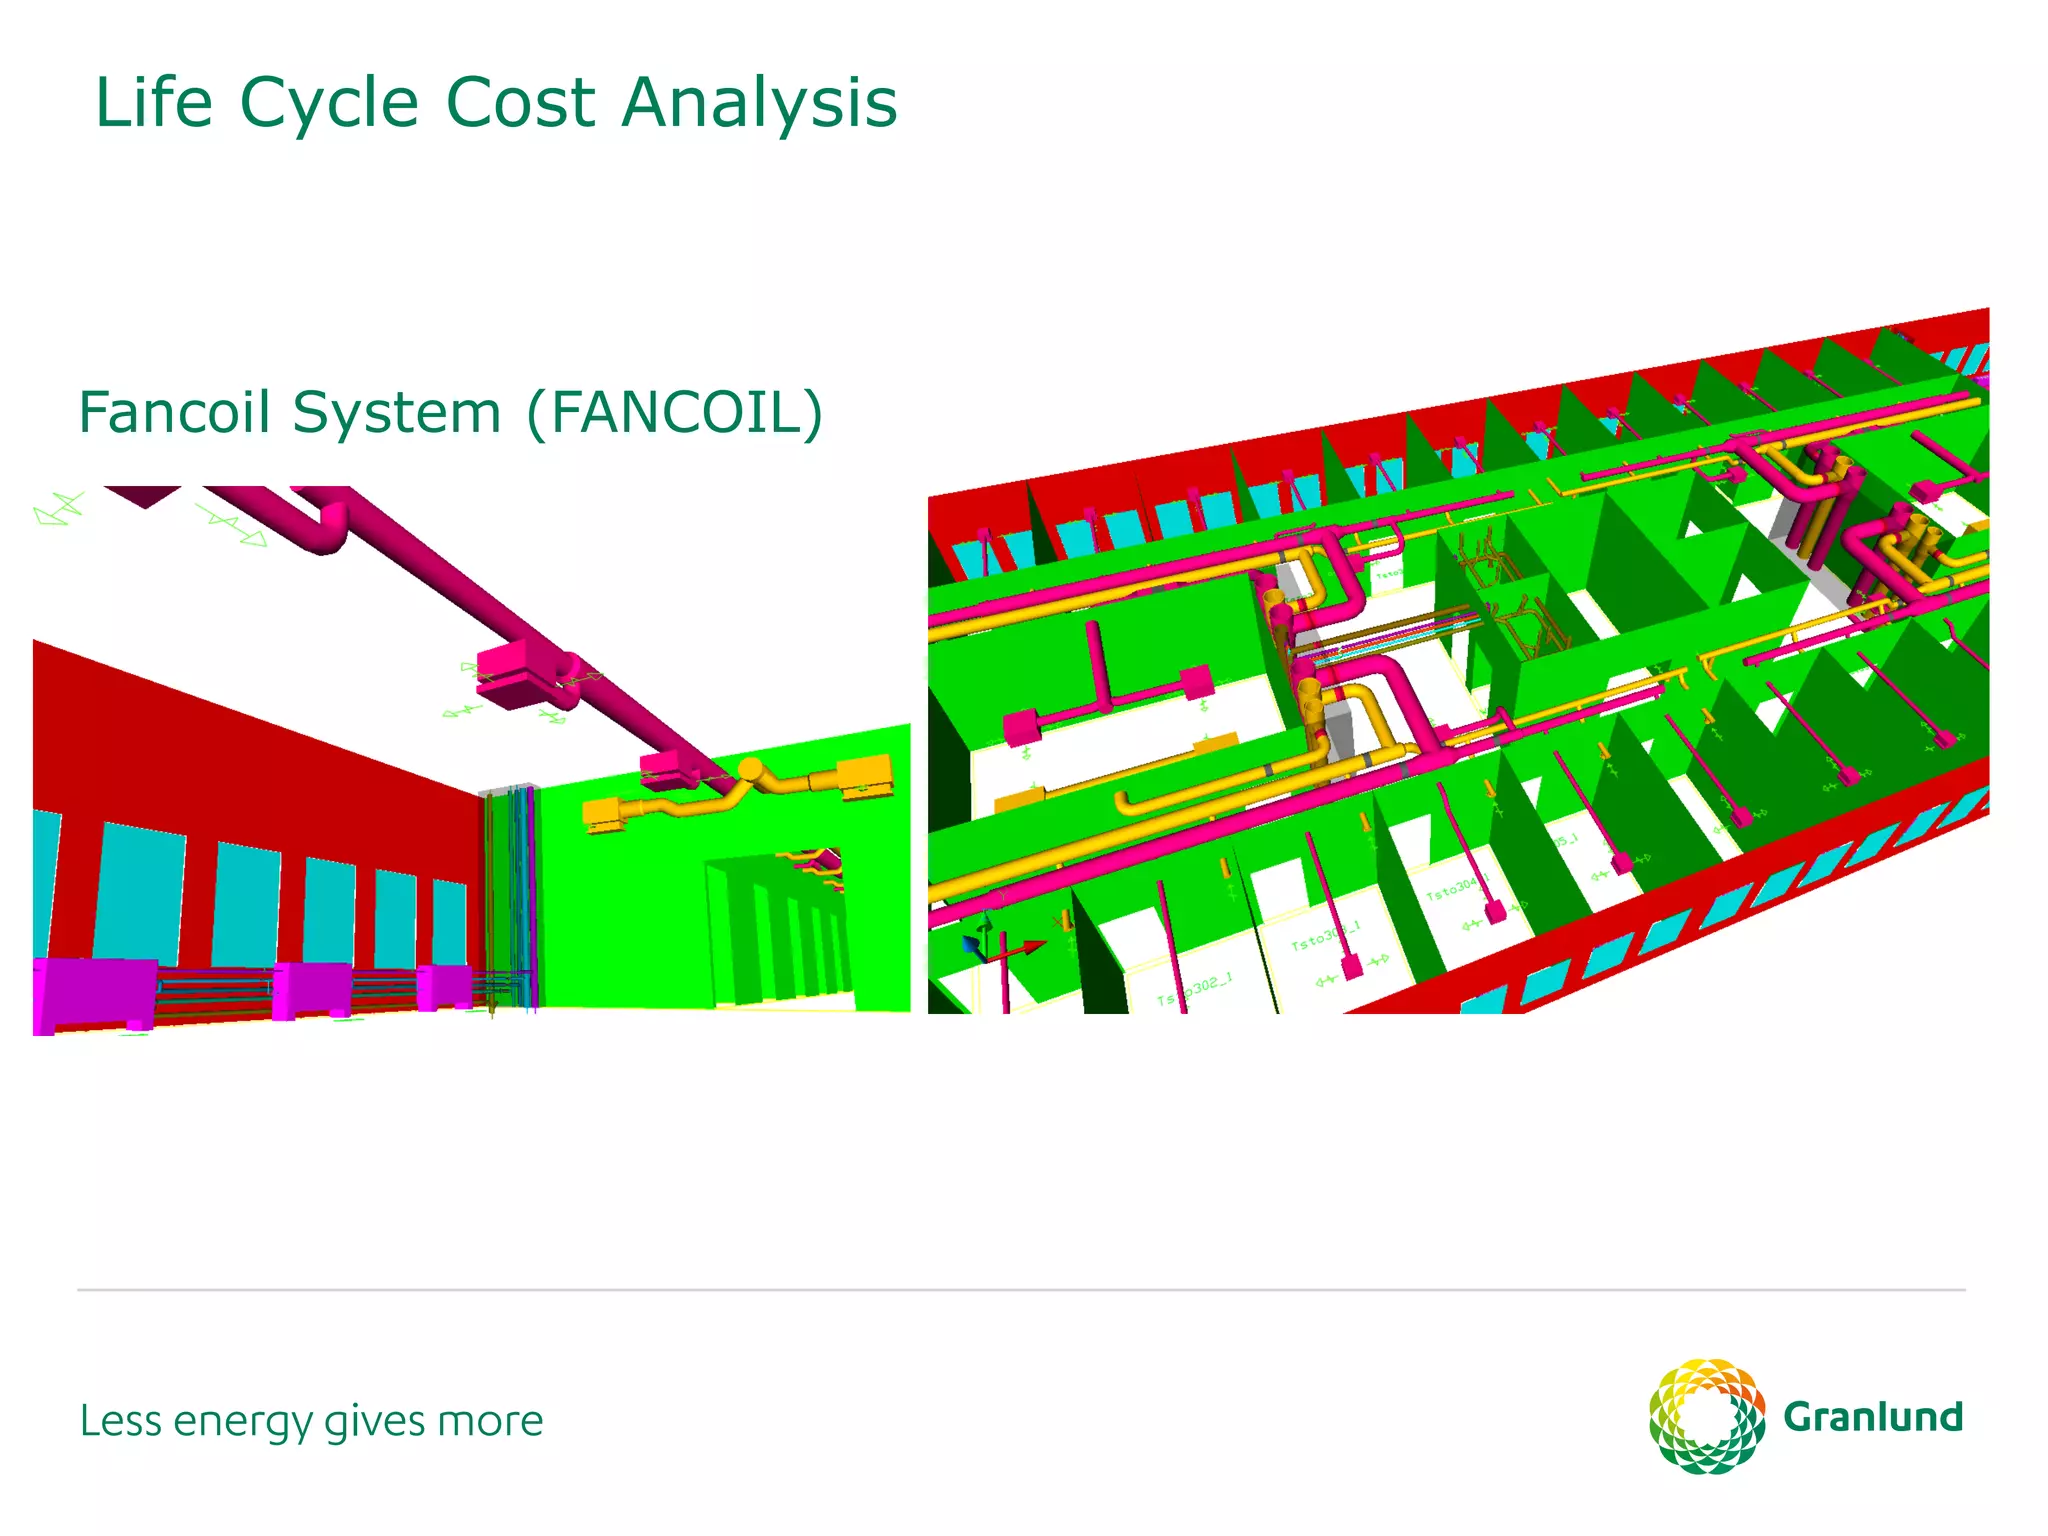
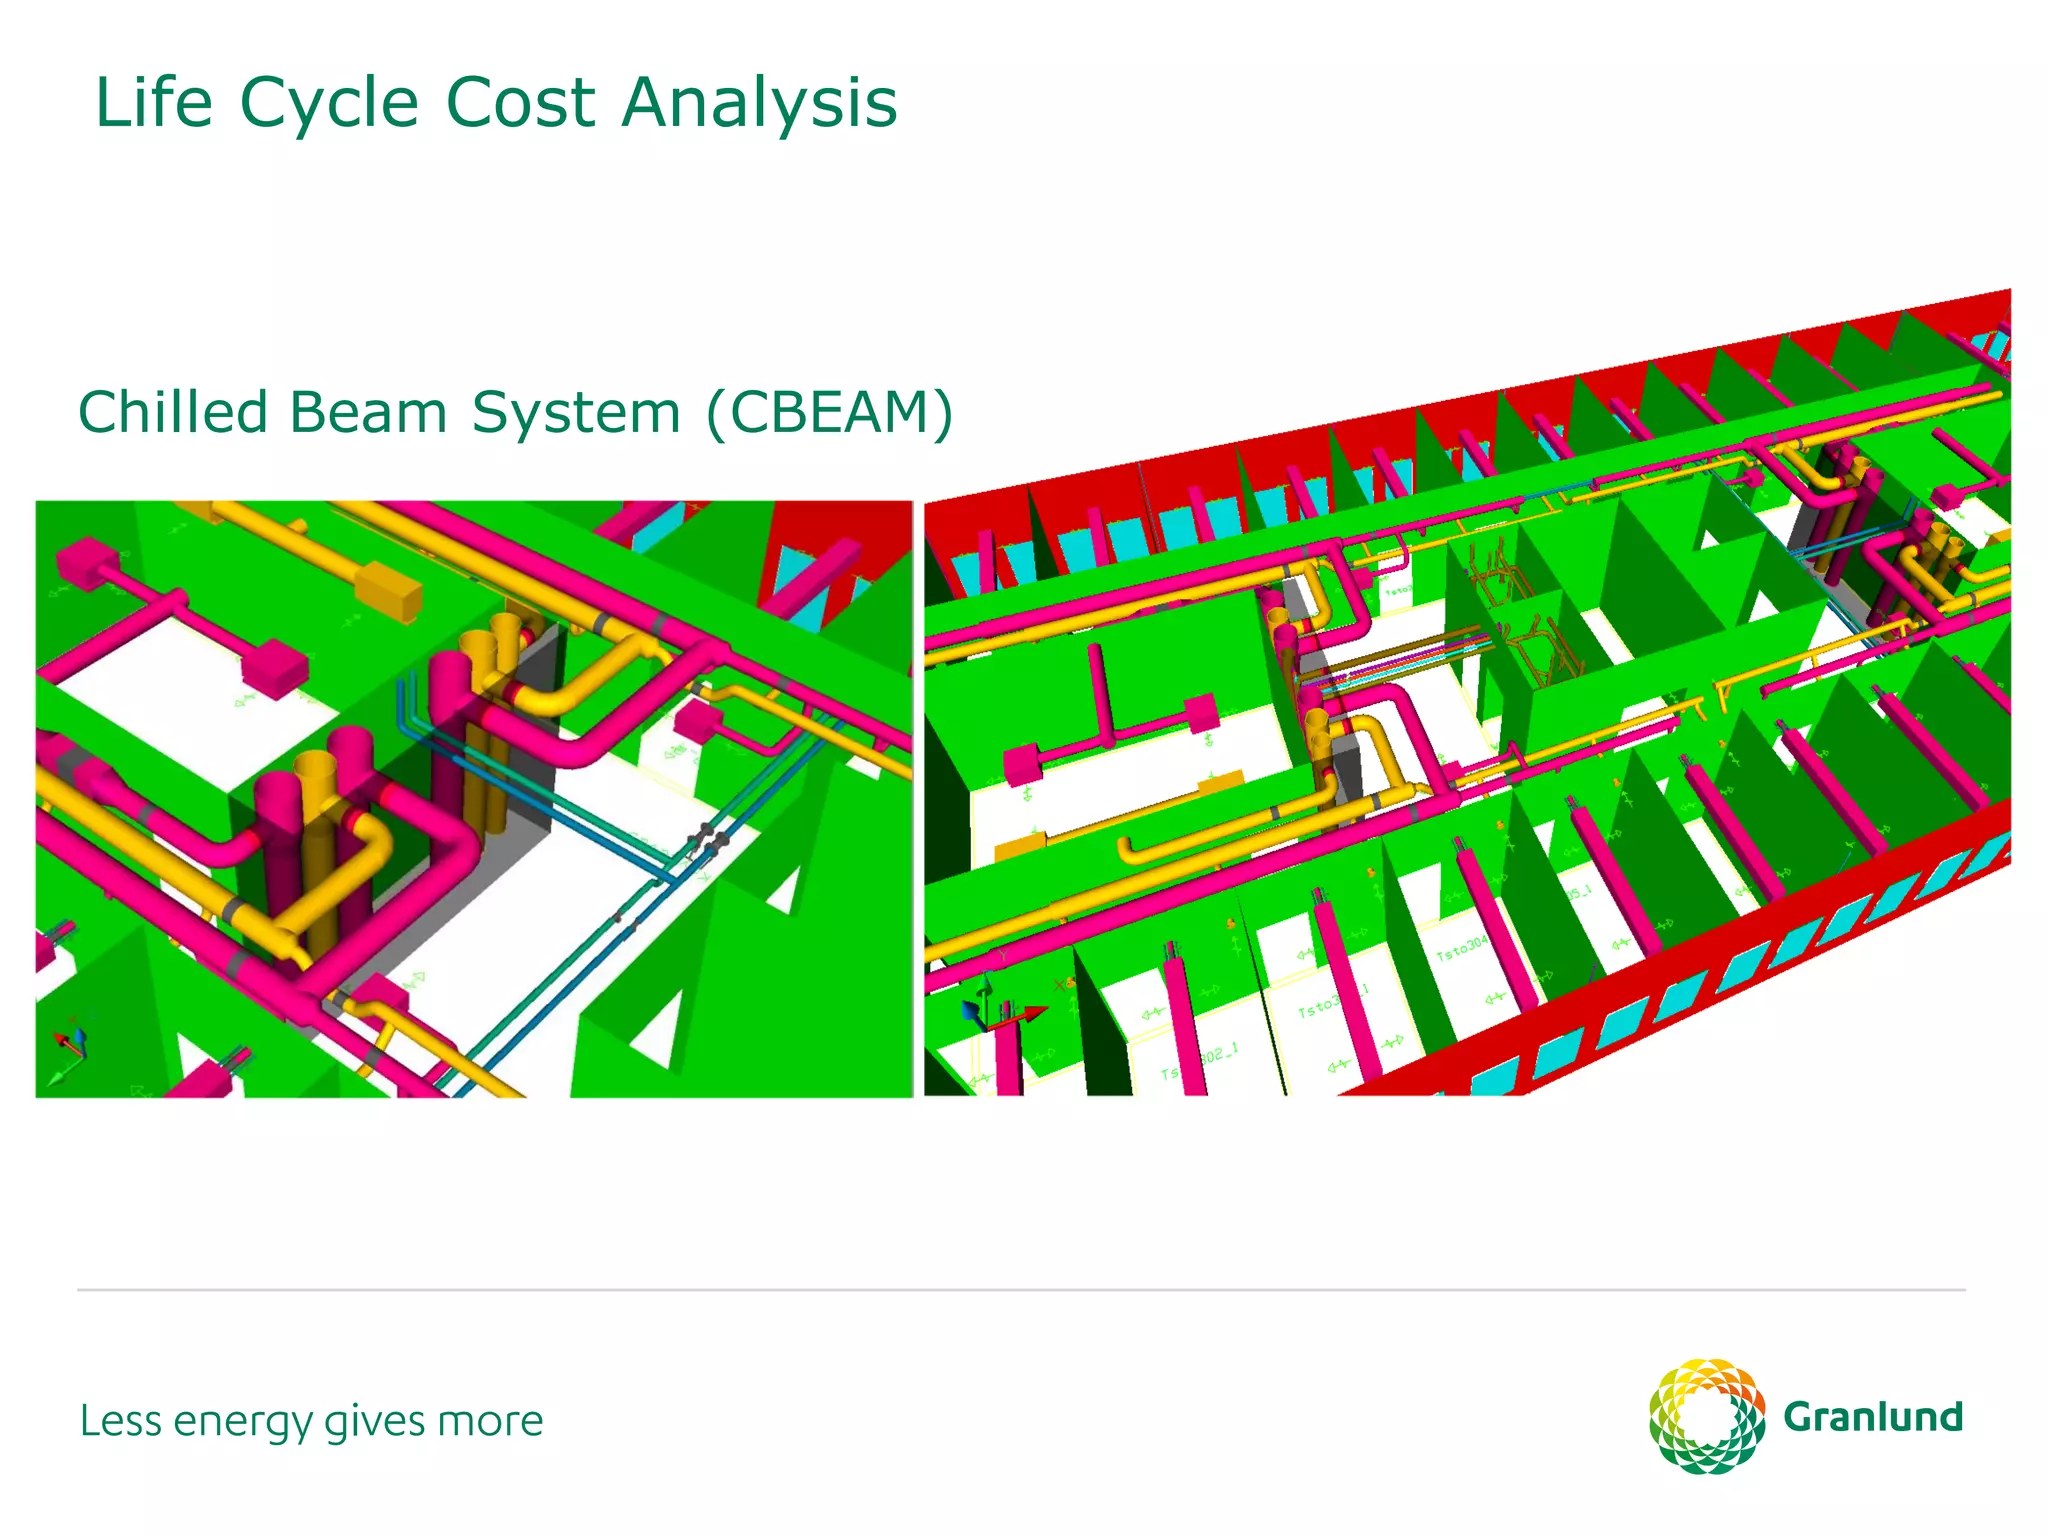
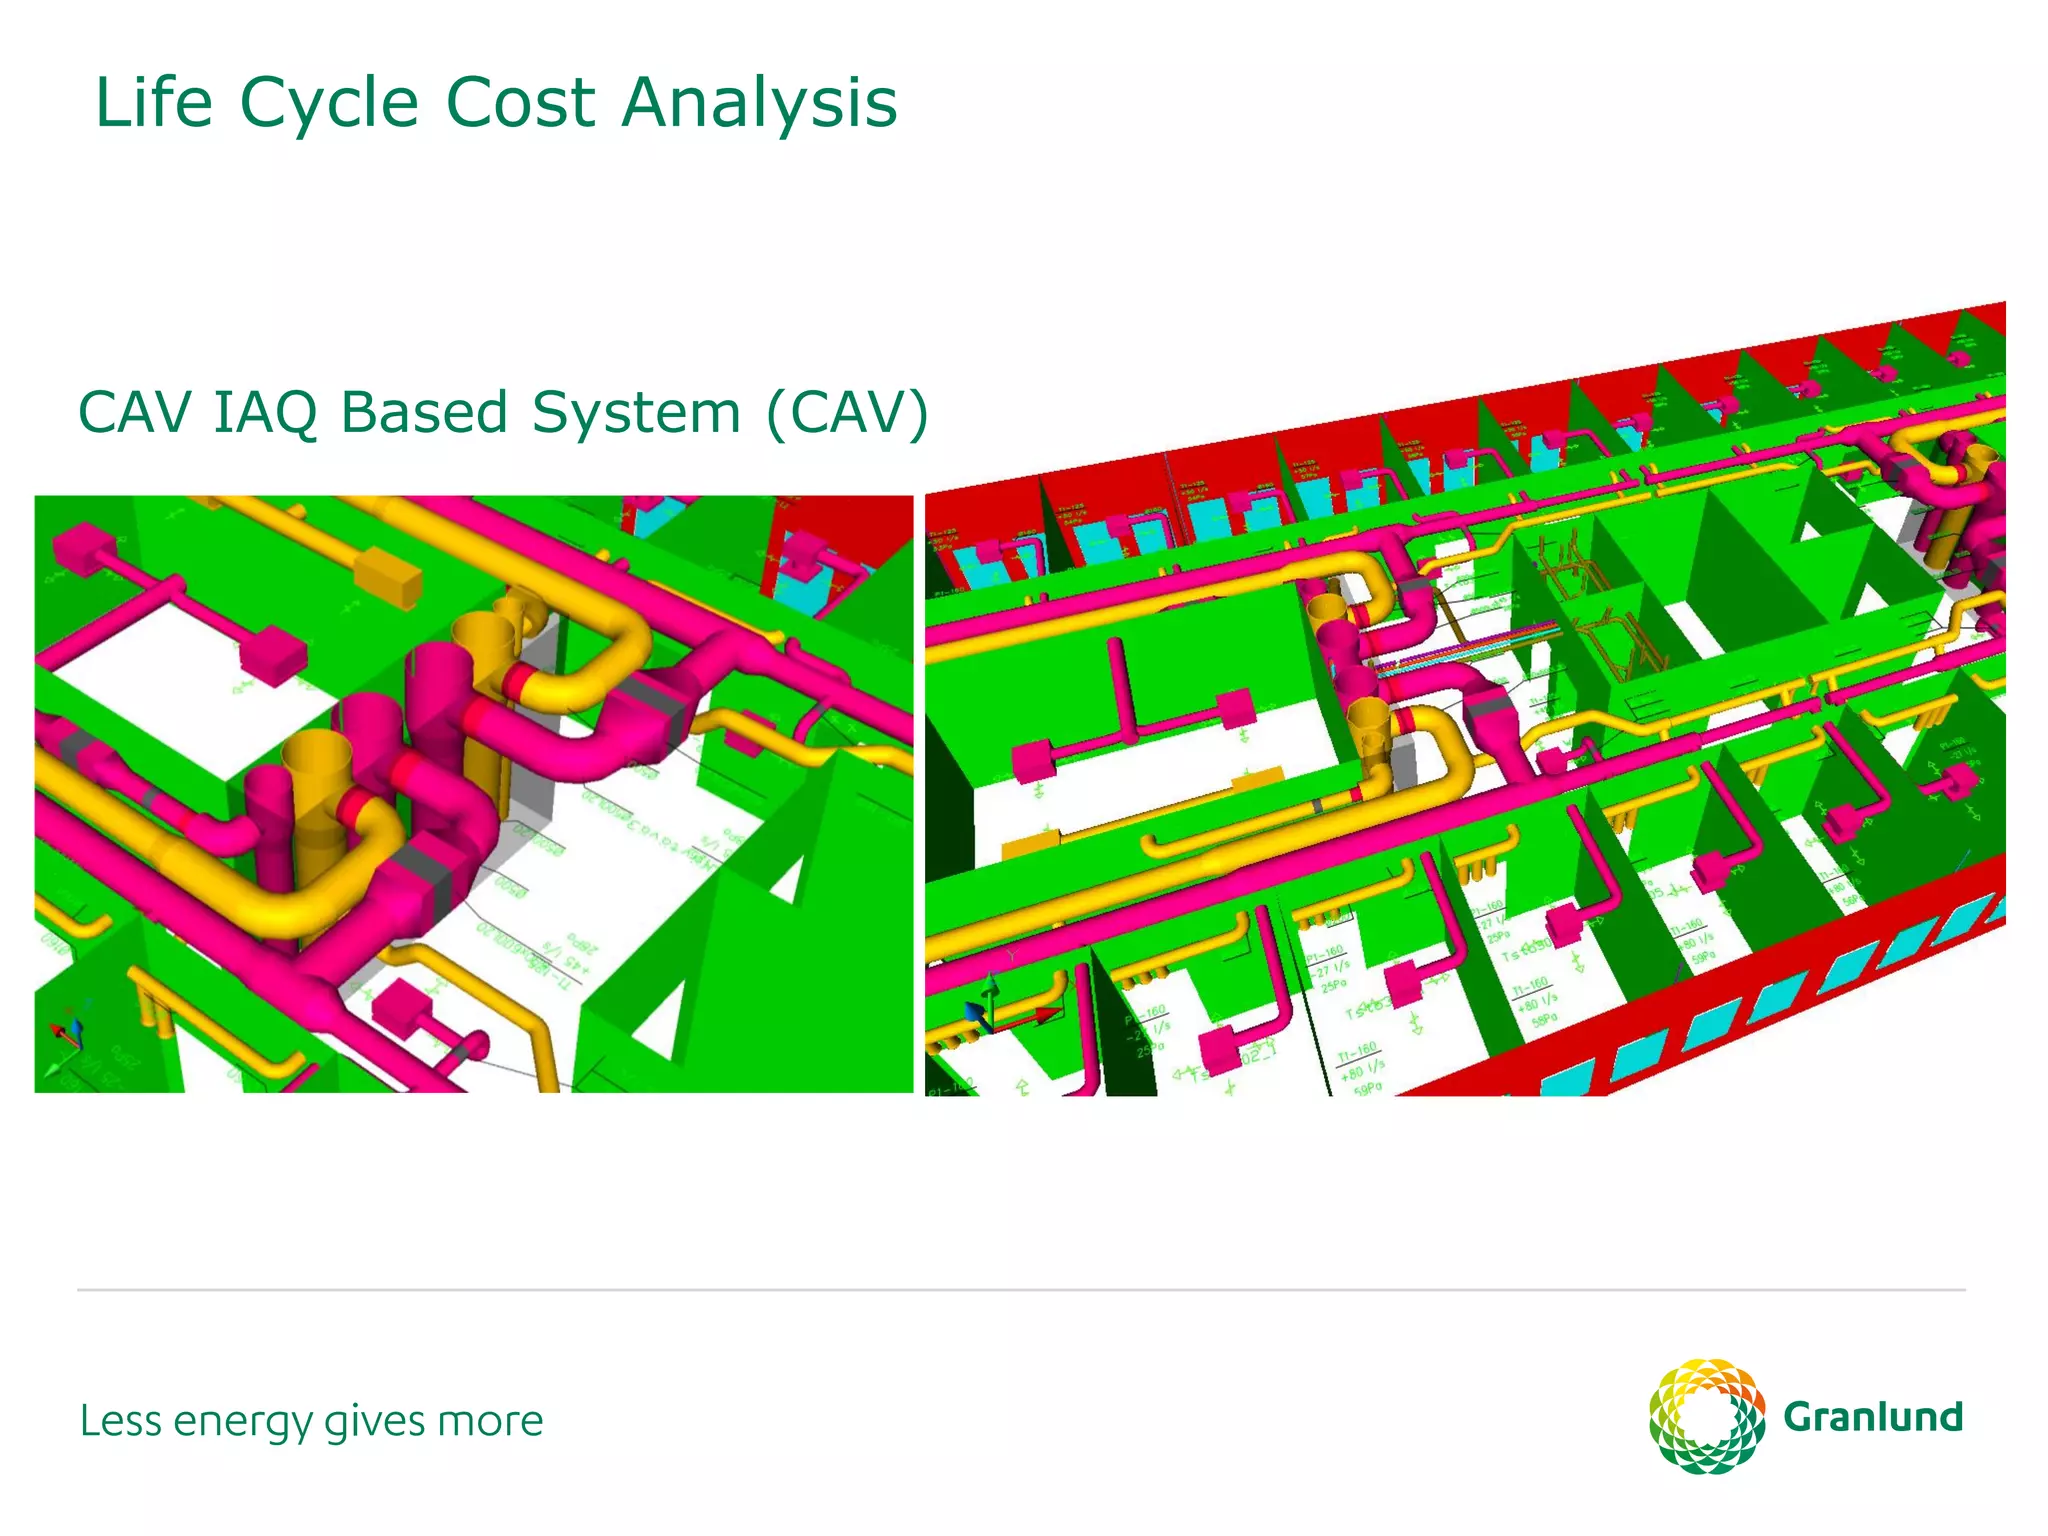
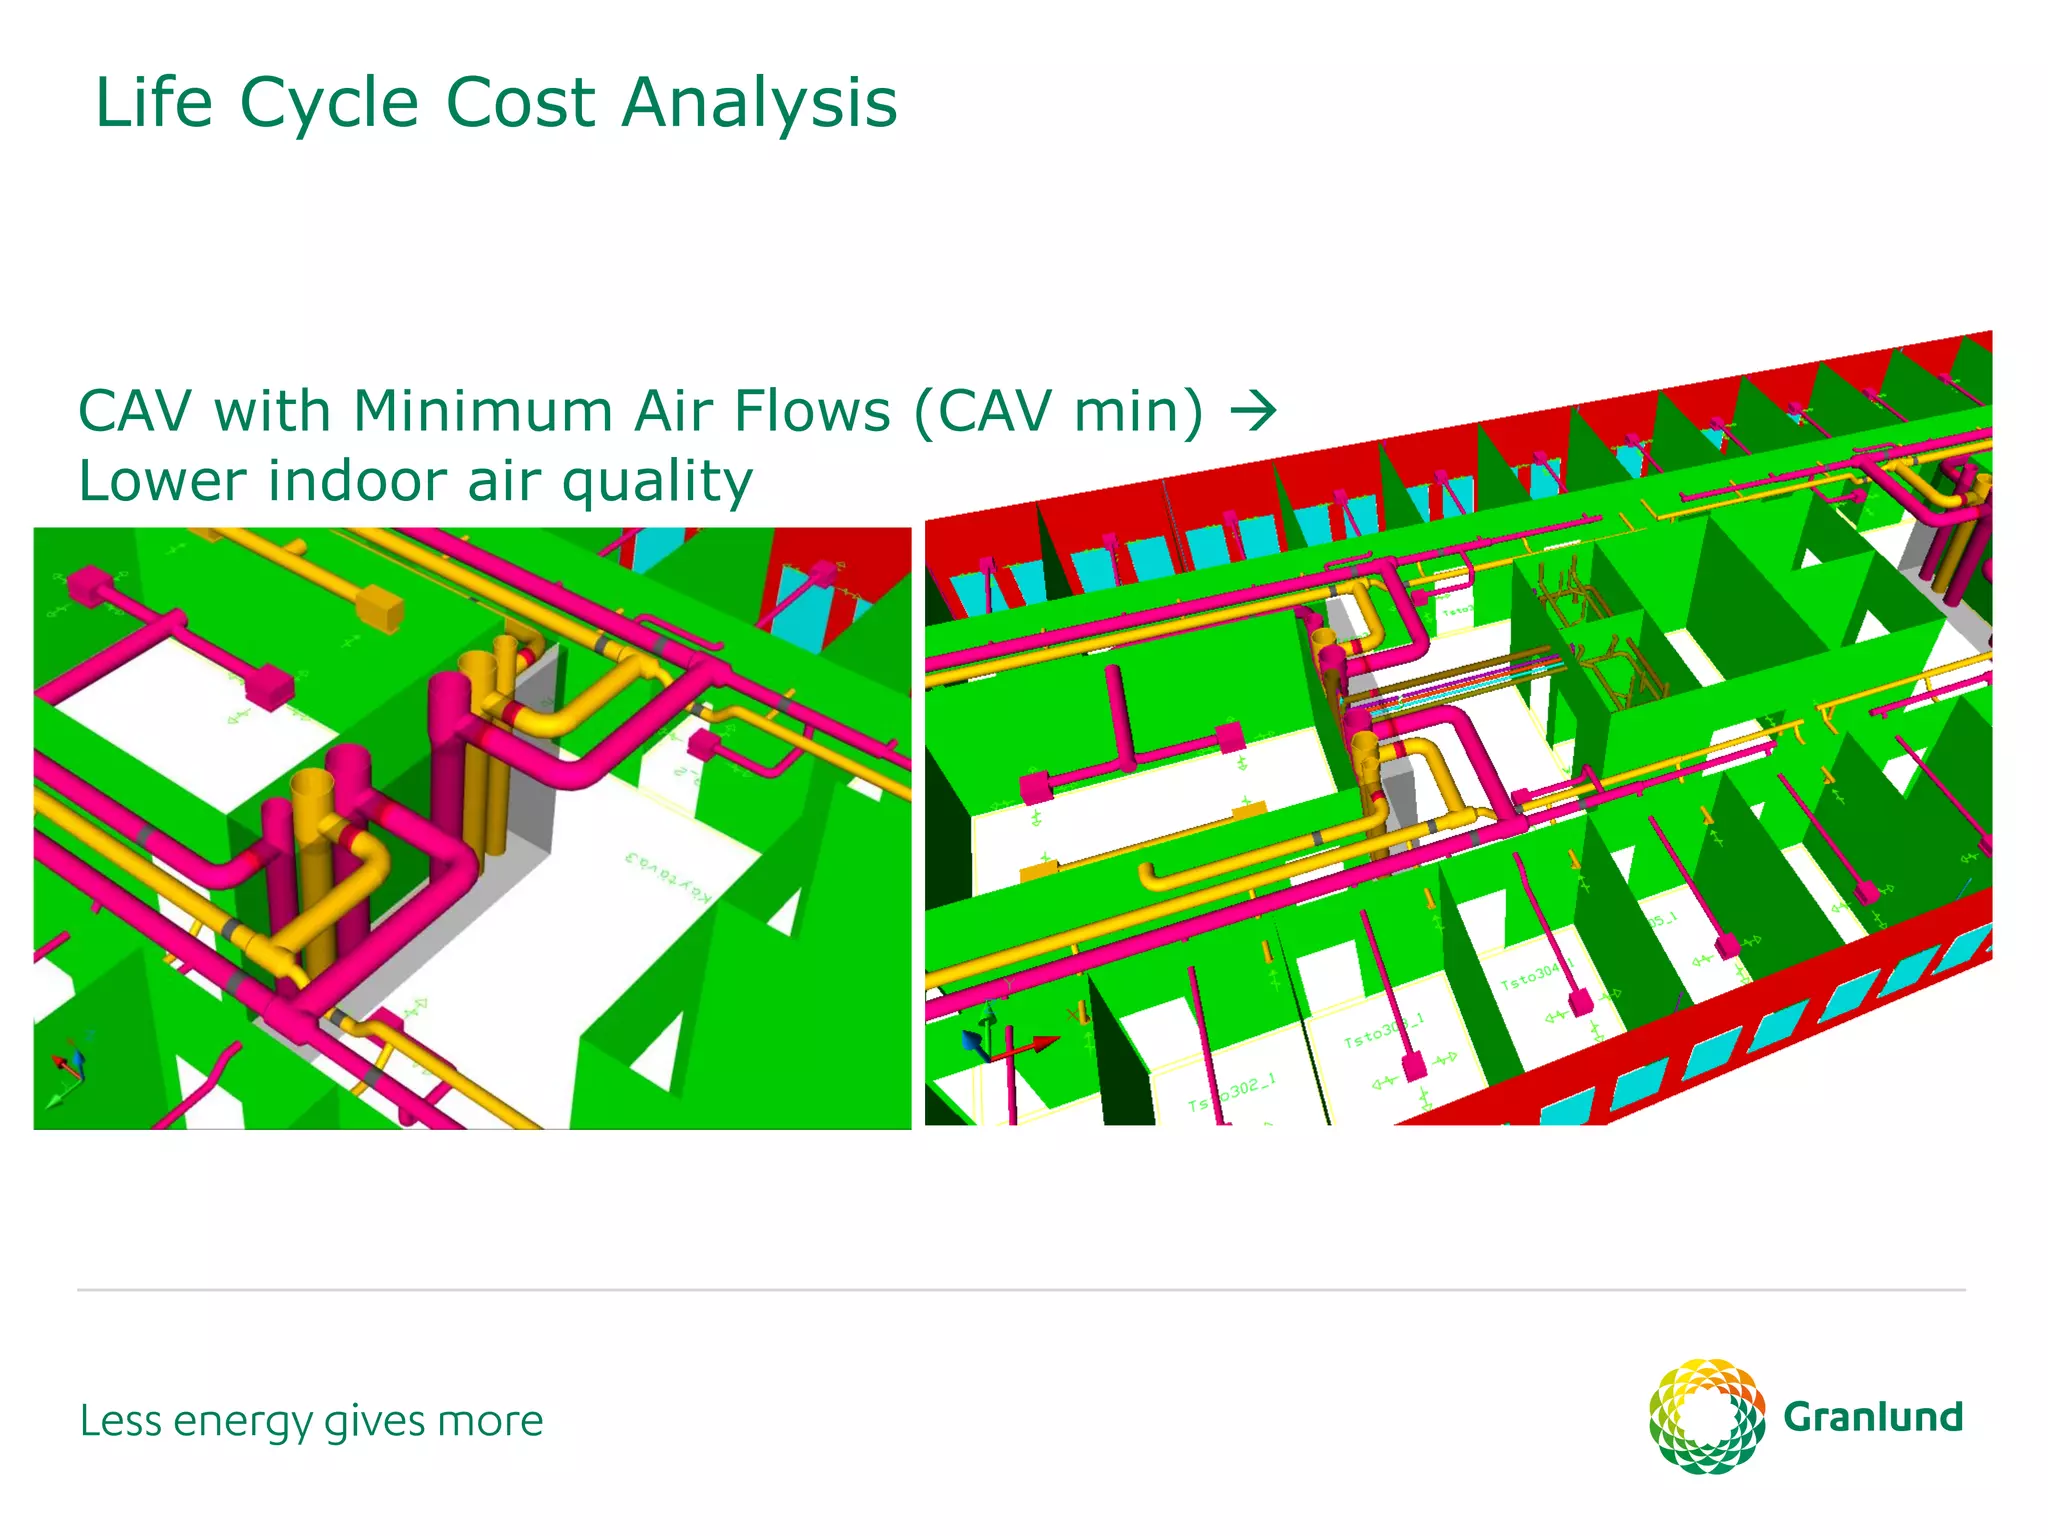
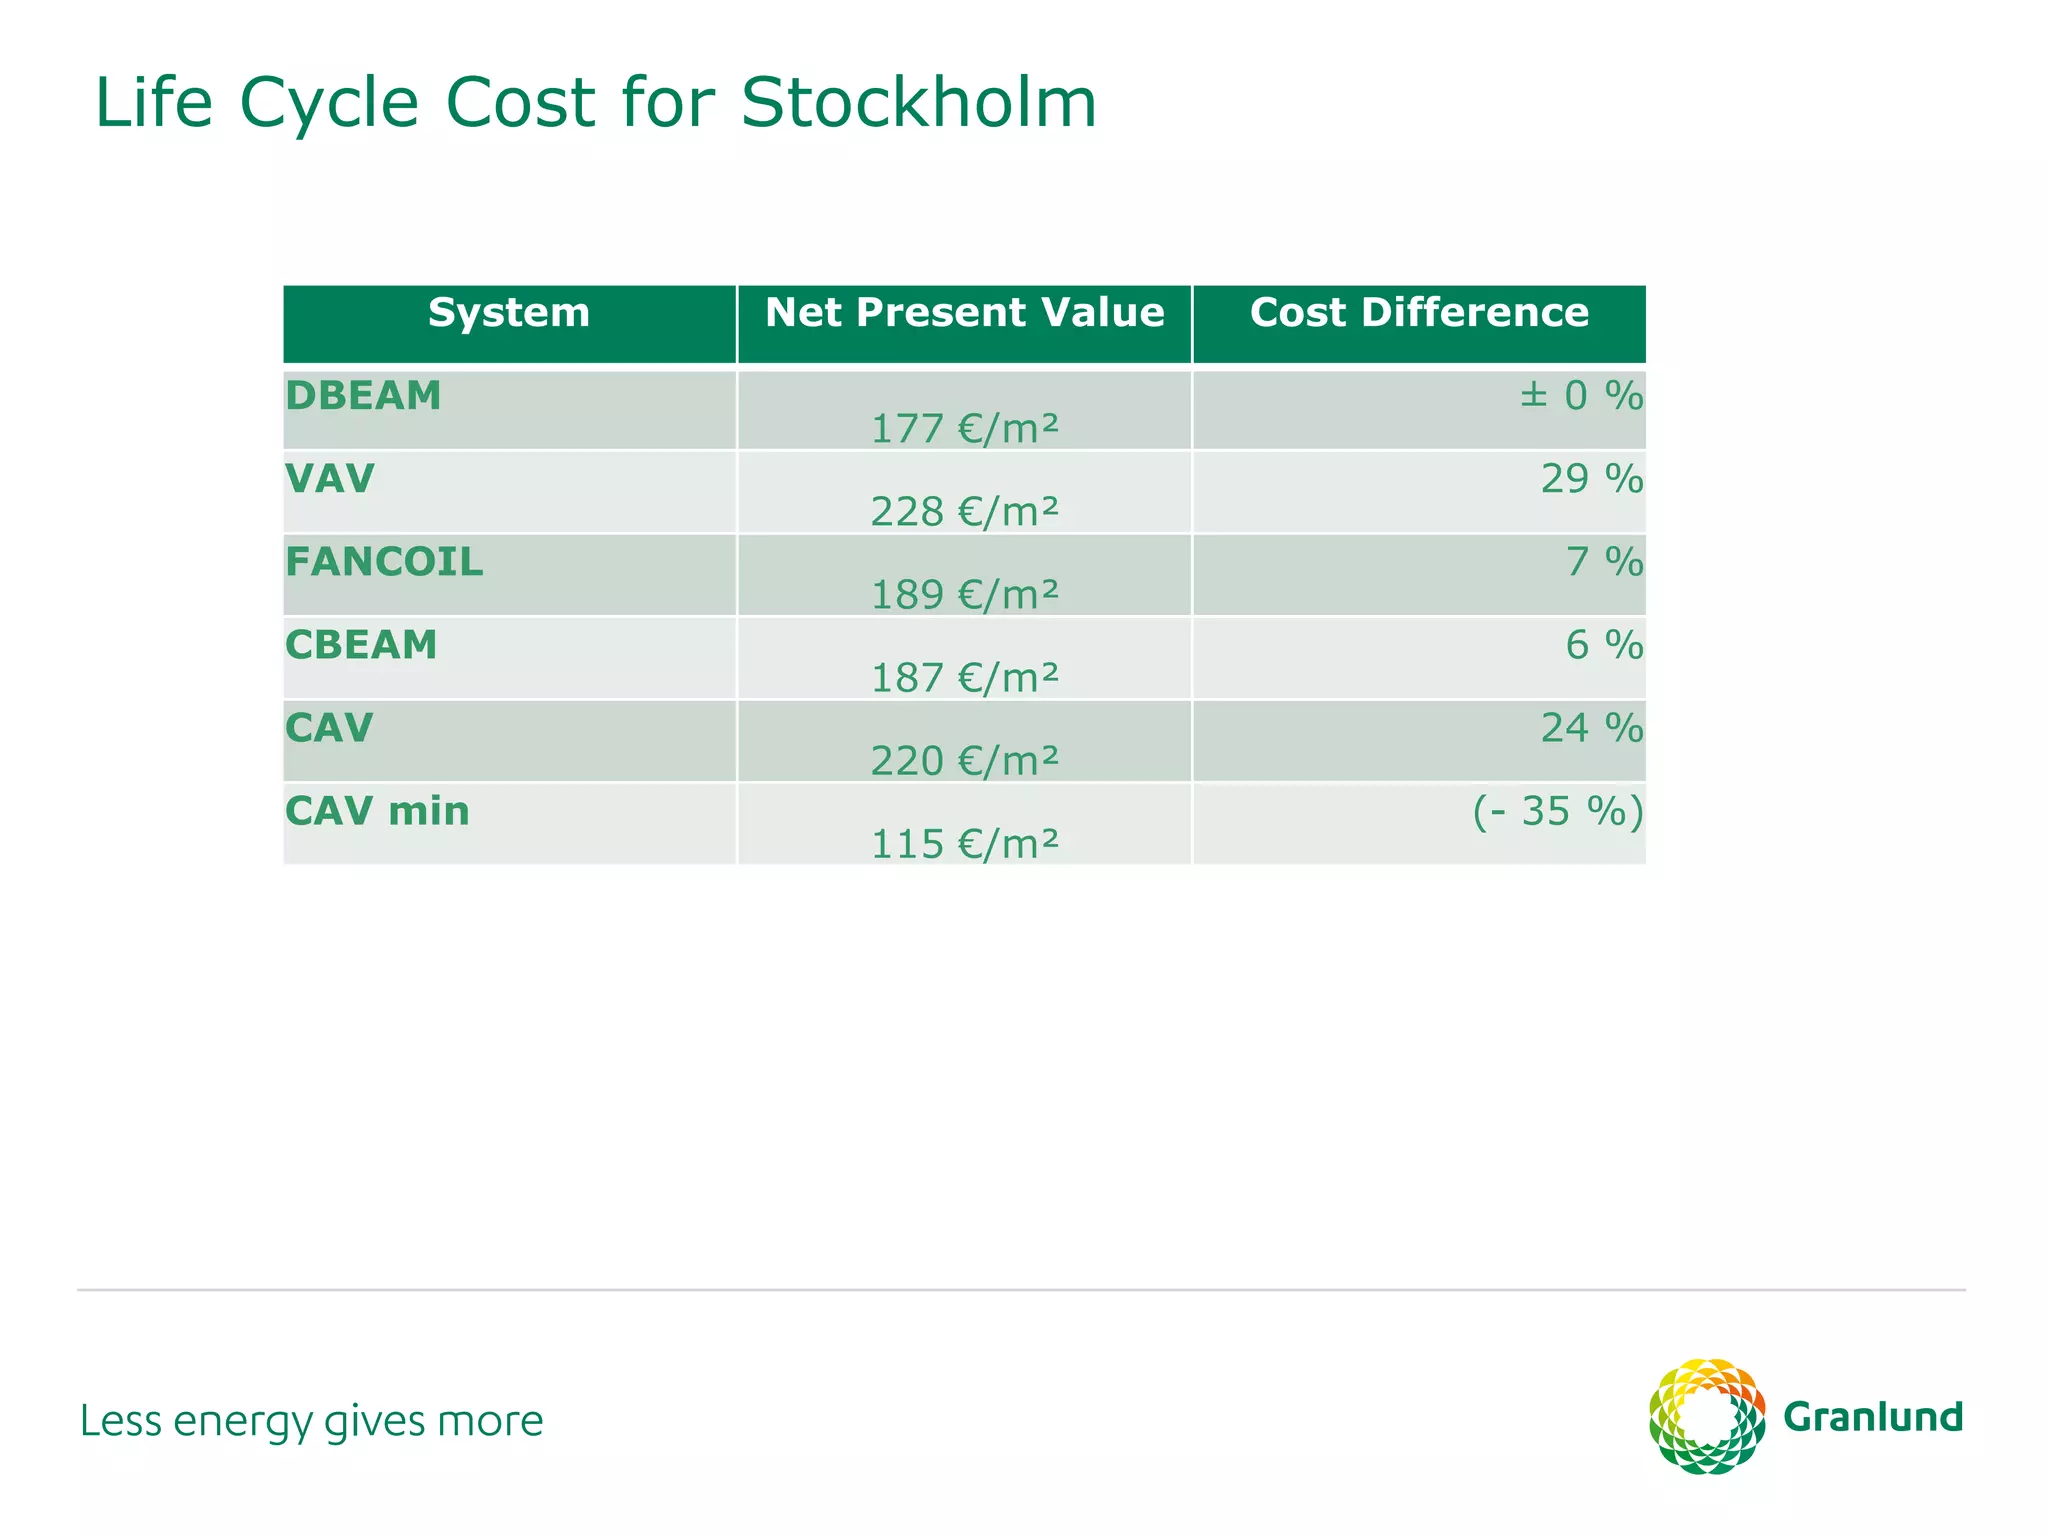


1. The document discusses technical aspects of sustainability in the built environment, including passive design strategies like daylighting and natural ventilation to reduce energy usage. 2. It also covers active systems like smart buildings that can optimize energy generation and usage through automation, demand response, and renewable energy integration. 3. Life cycle cost analyses and life cycle assessments are presented as tools to evaluate the long-term economic and environmental impacts of different building design and technology choices.


![[Metropolia Student Project Seminar 24.5.] Zero Energy Buildings, Group A](https://cdn.slidesharecdn.com/ss_thumbnails/zeroenergybuildings-presentation24-5-2012-120528082031-phpapp01-thumbnail.jpg?width=640&height=640&fit=bounds)


![[Nordic GBC Conference 2013] Pekka Pajakkala - Business Opportunities with Re...](https://cdn.slidesharecdn.com/ss_thumbnails/pajakkalanordicgbc29-1-130212054159-phpapp01-thumbnail.jpg?width=640&height=640&fit=bounds)


