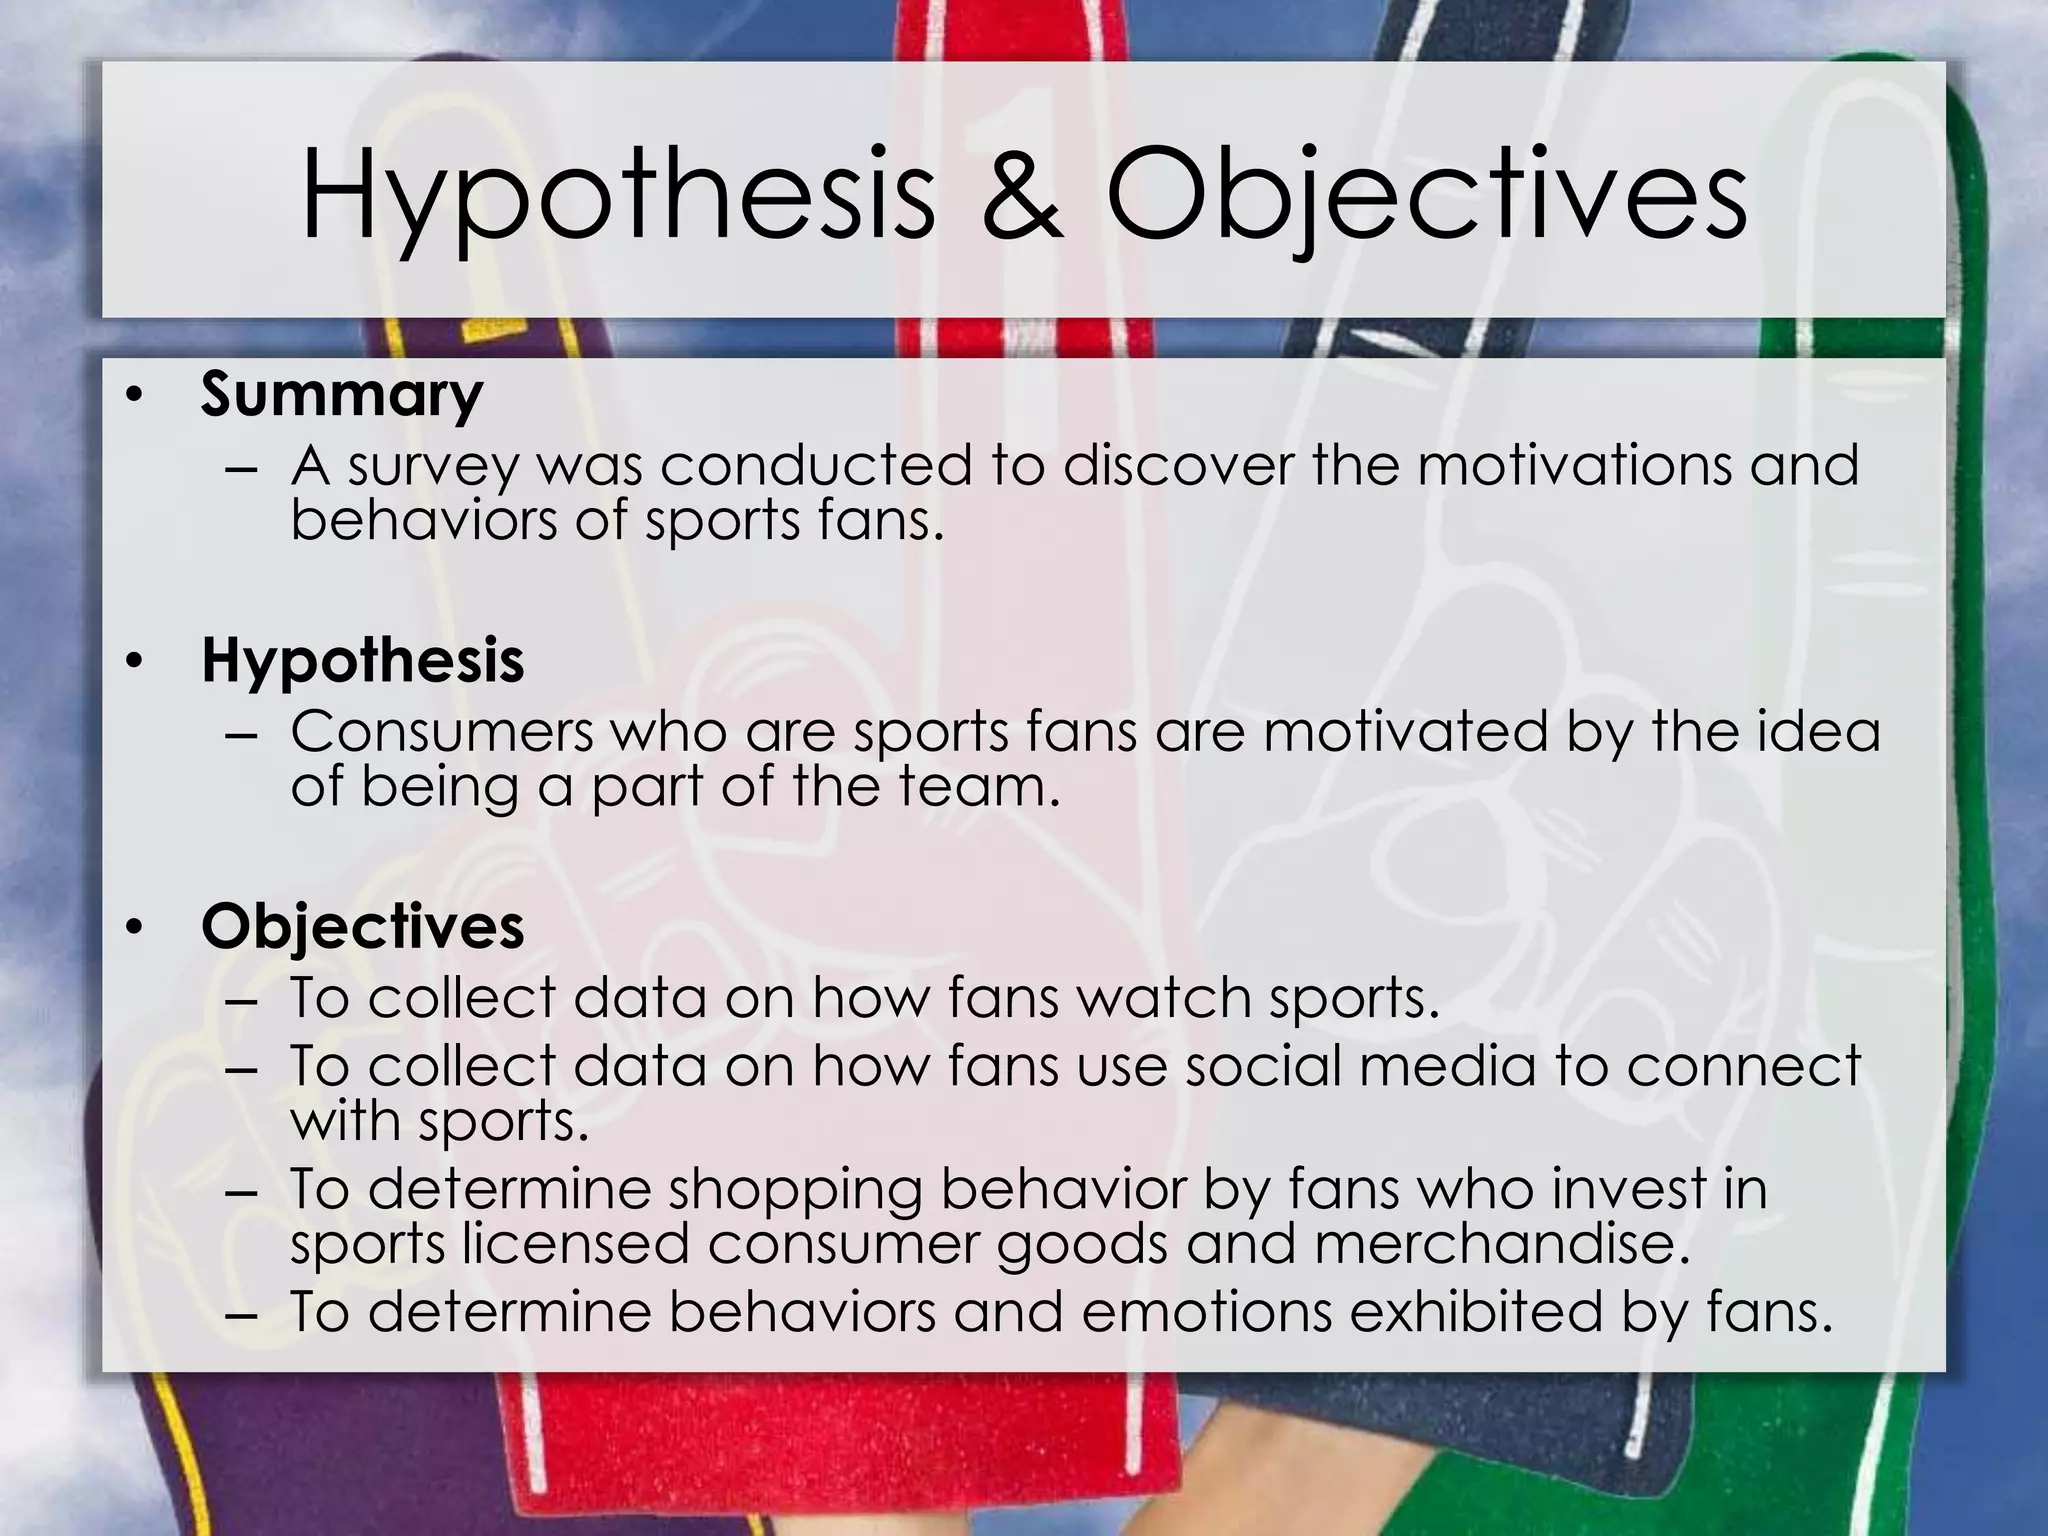
The document summarizes research from a survey of sports fans. Key findings include:
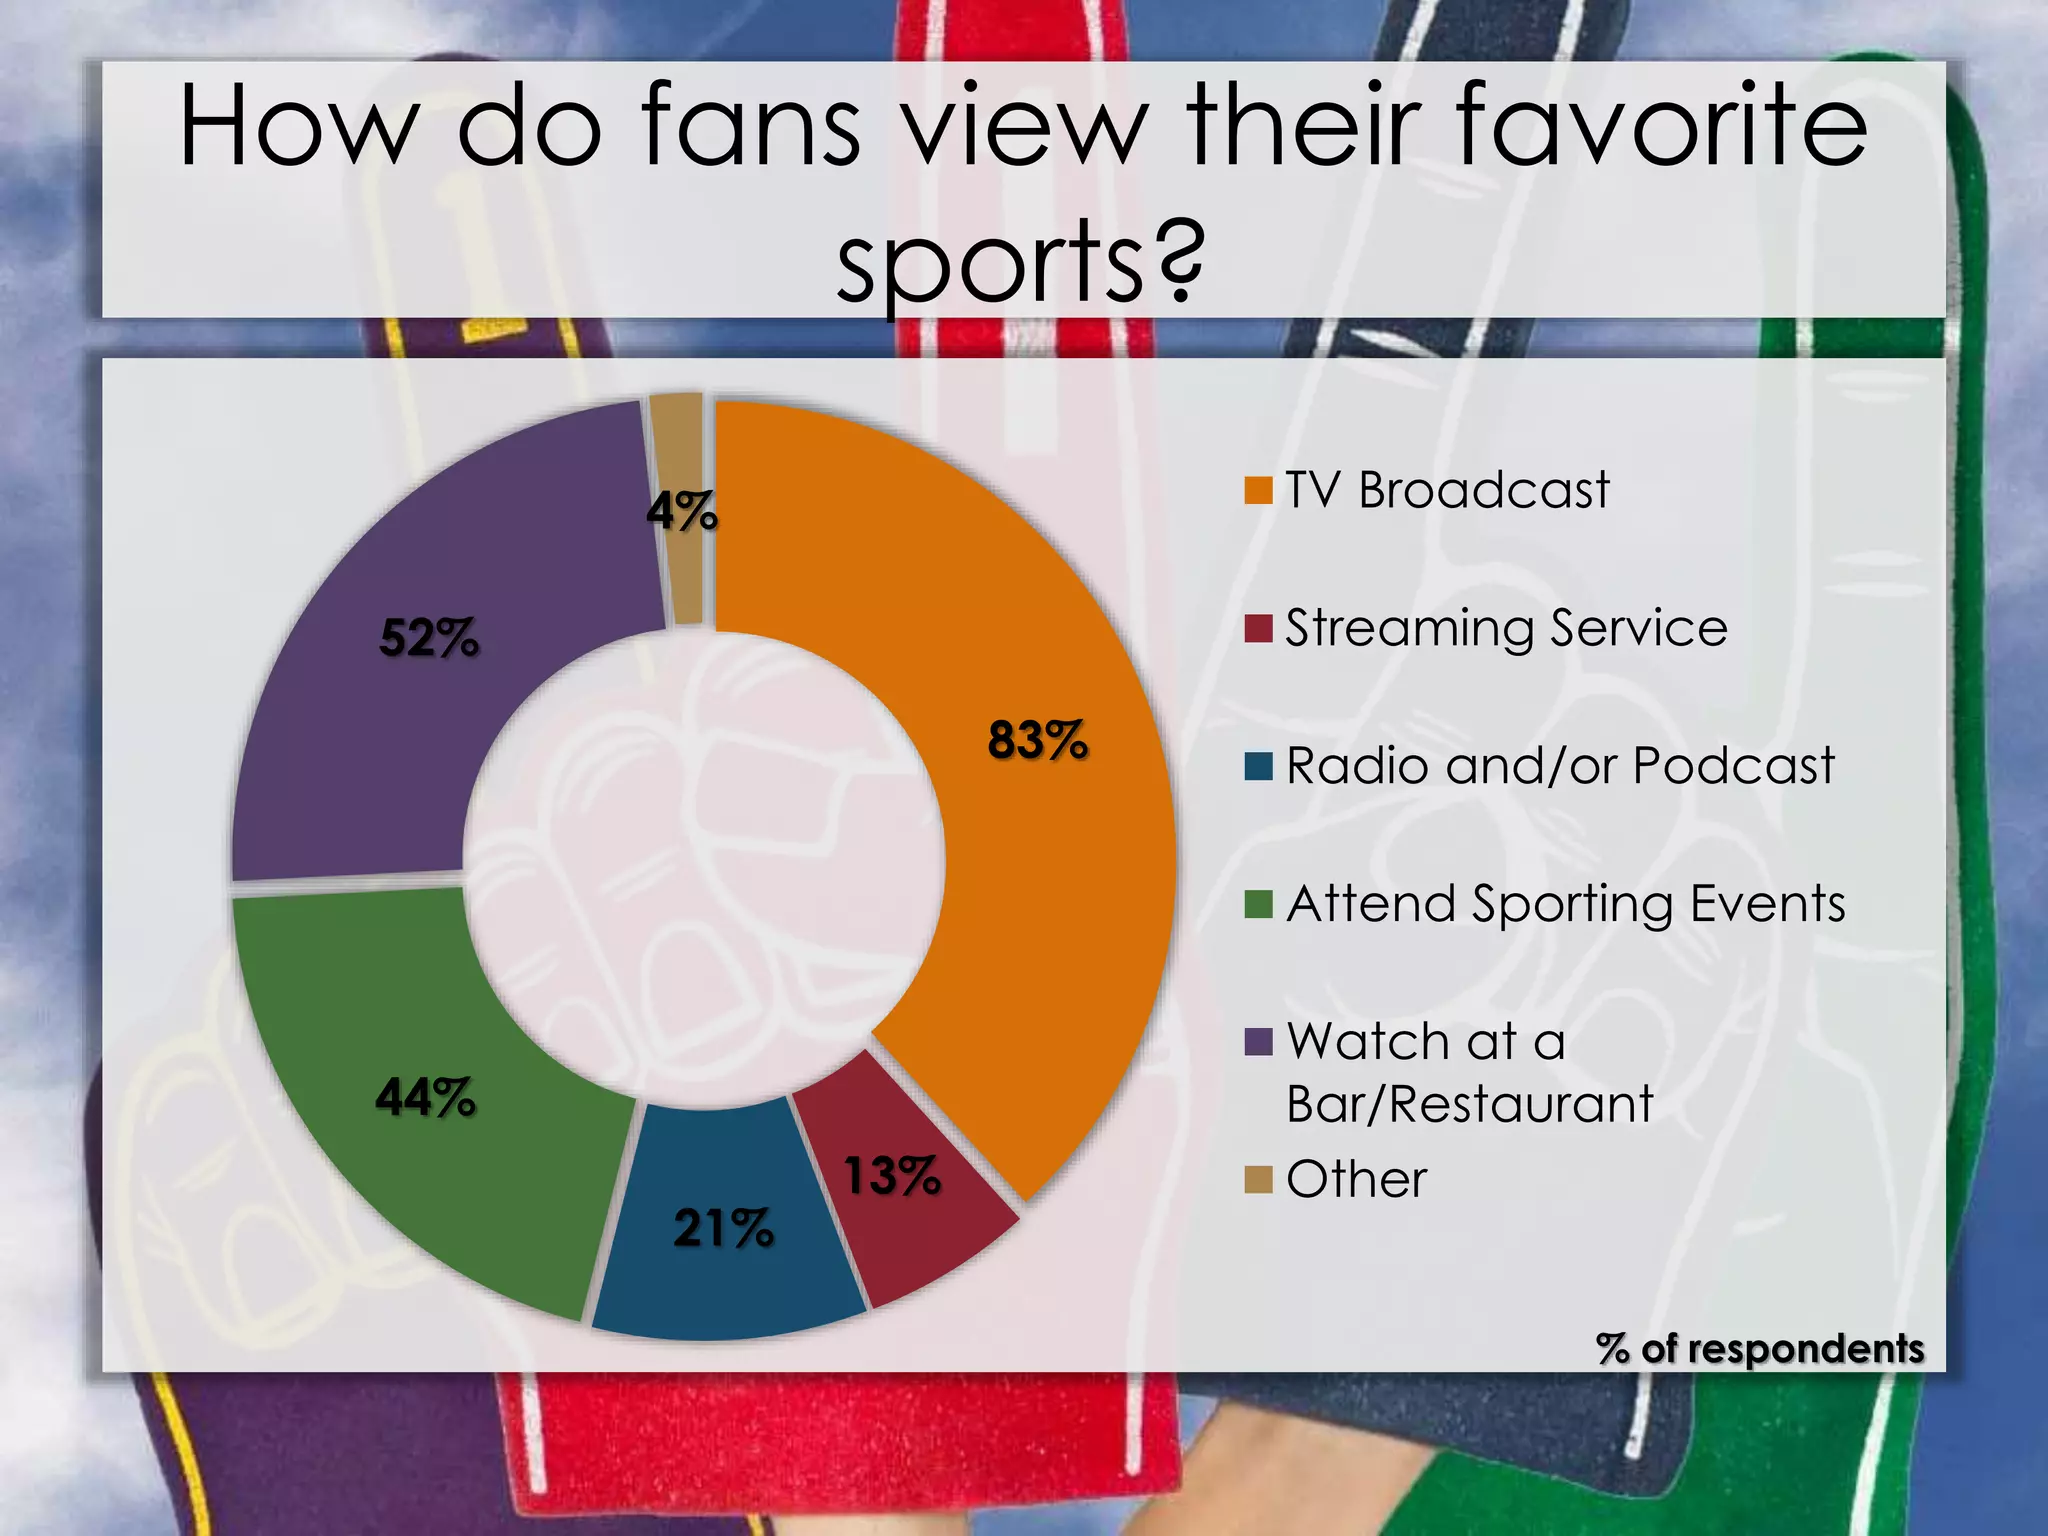
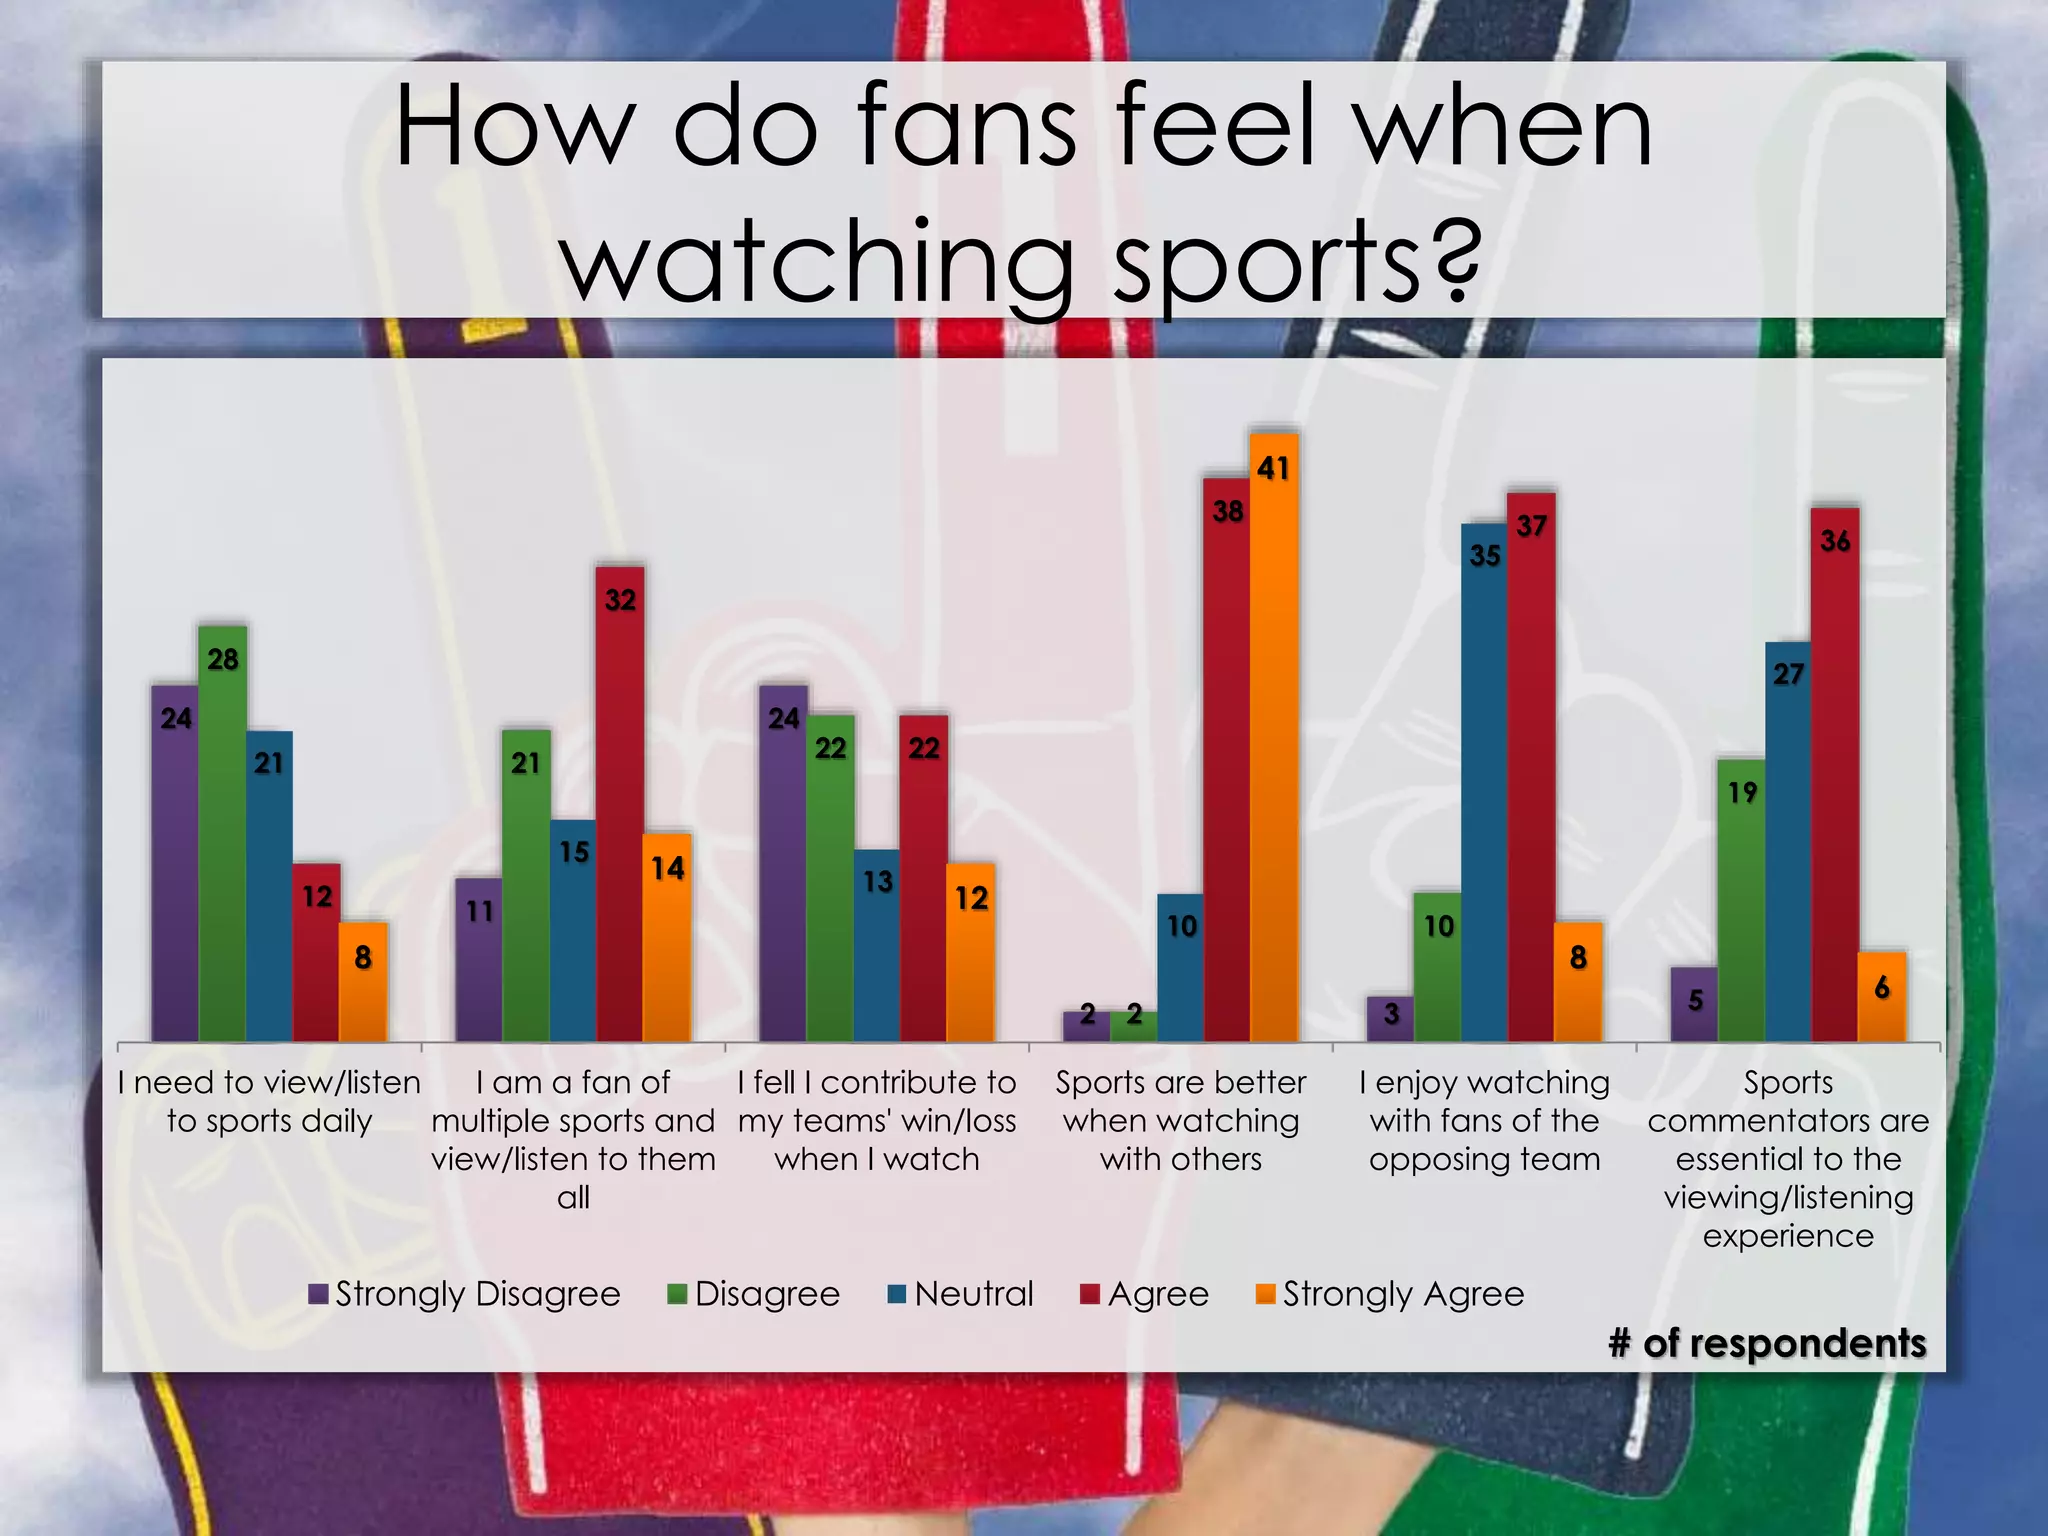
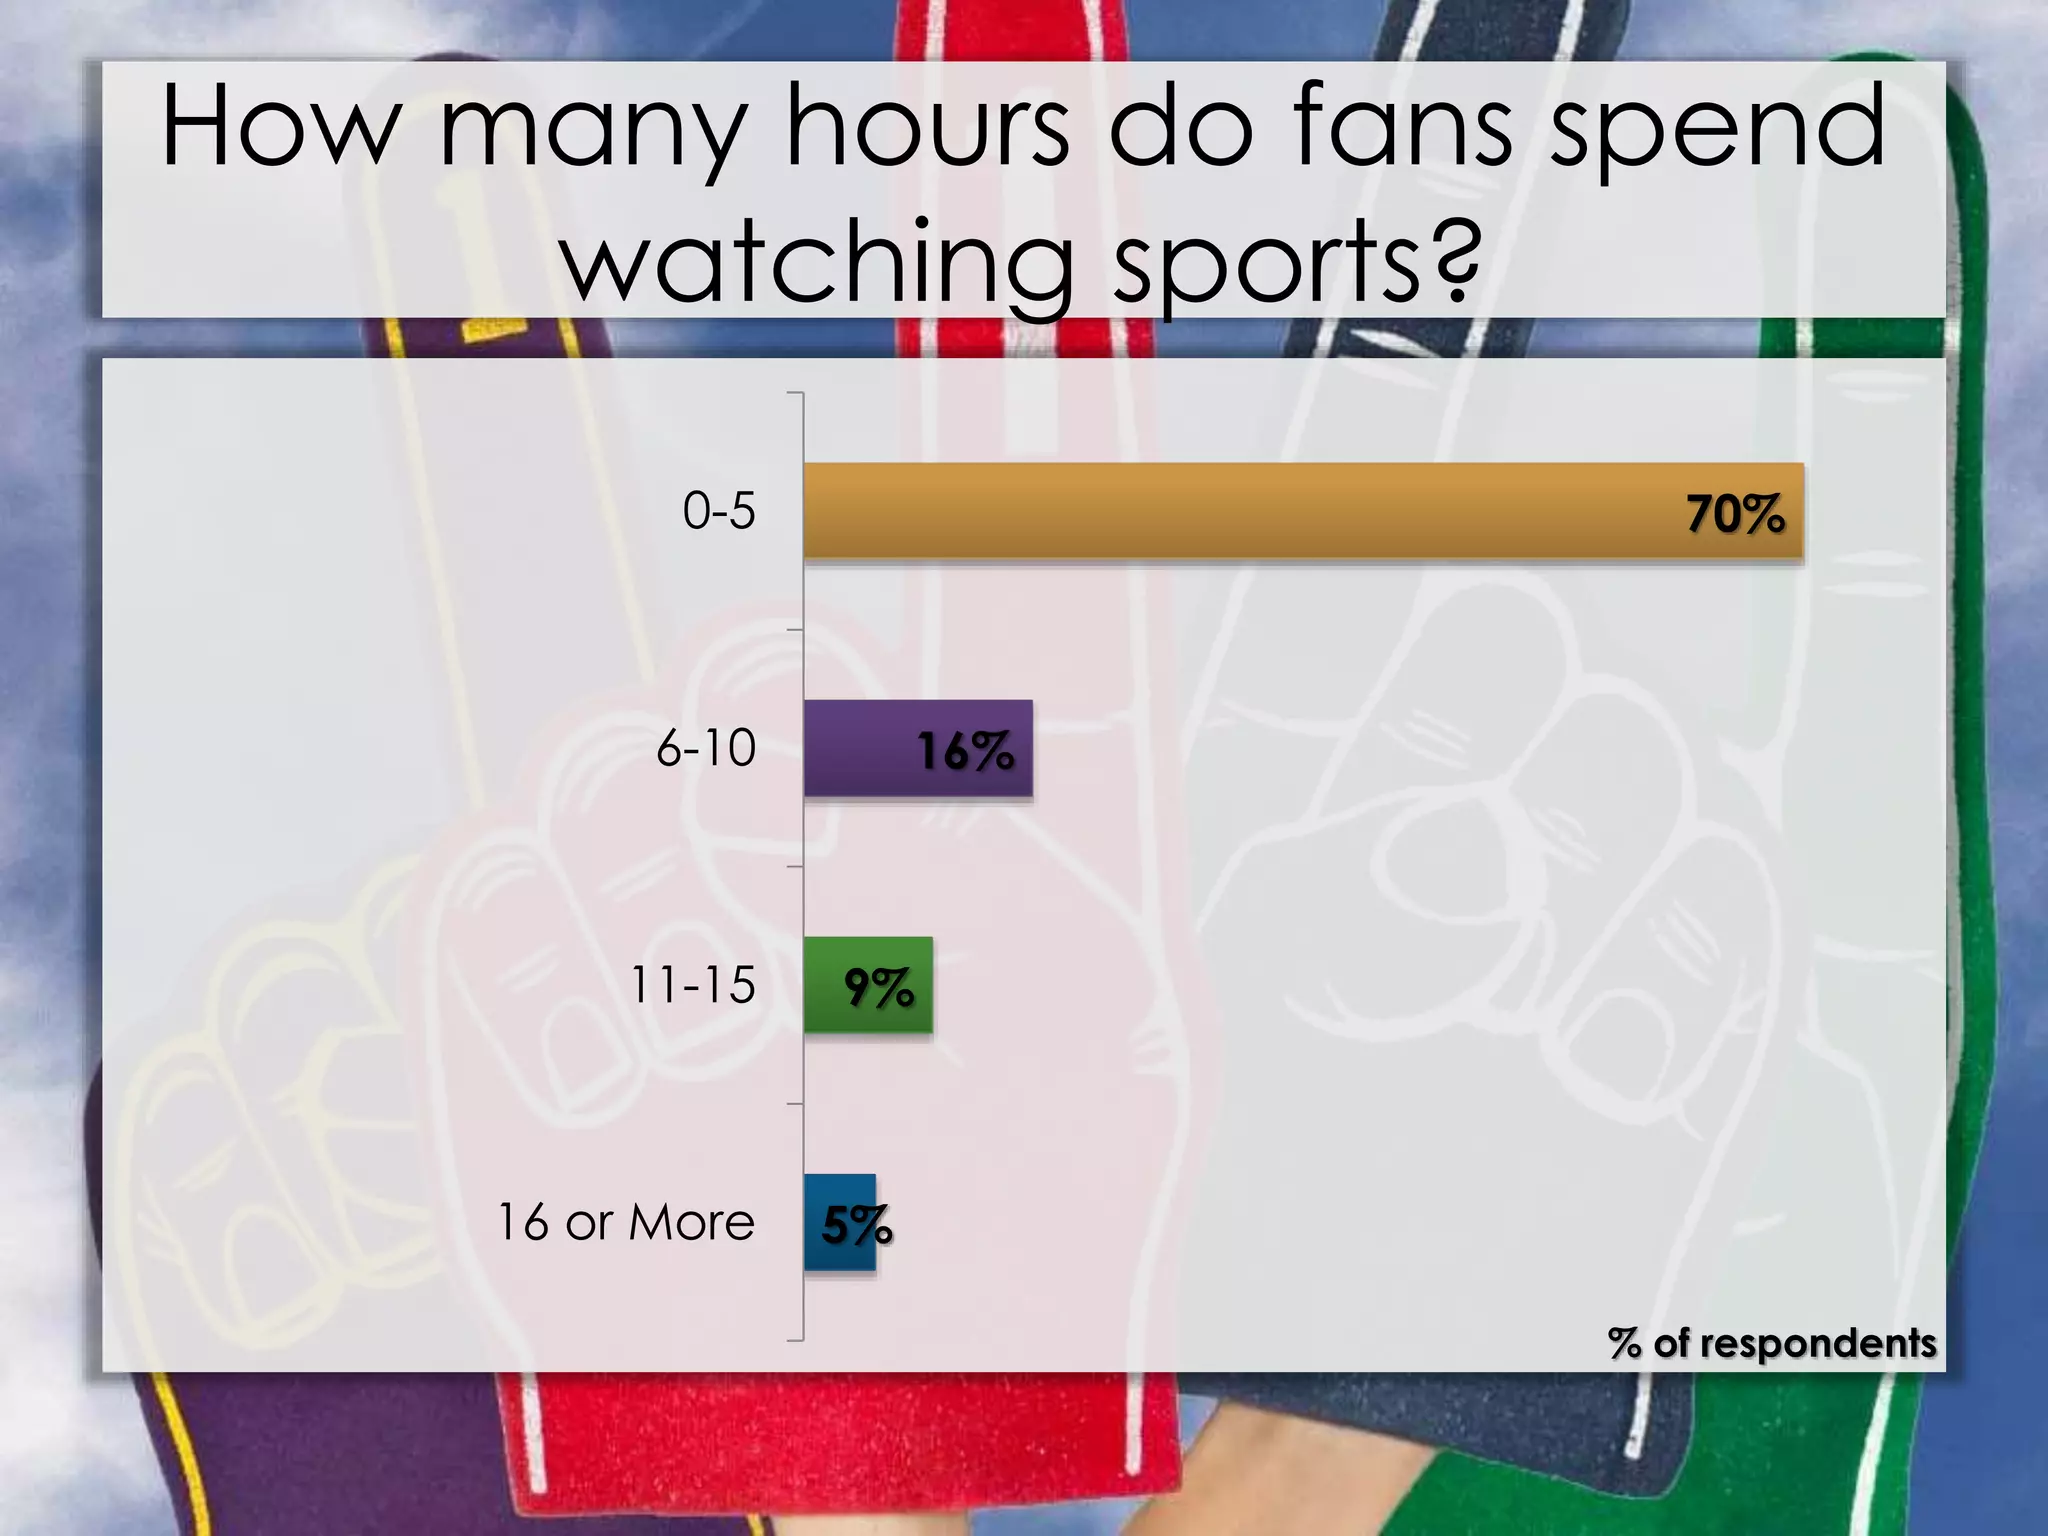
- Fans spend most of their time watching sports on TV, at bars/restaurants, or attending games directly. They prefer watching with others.
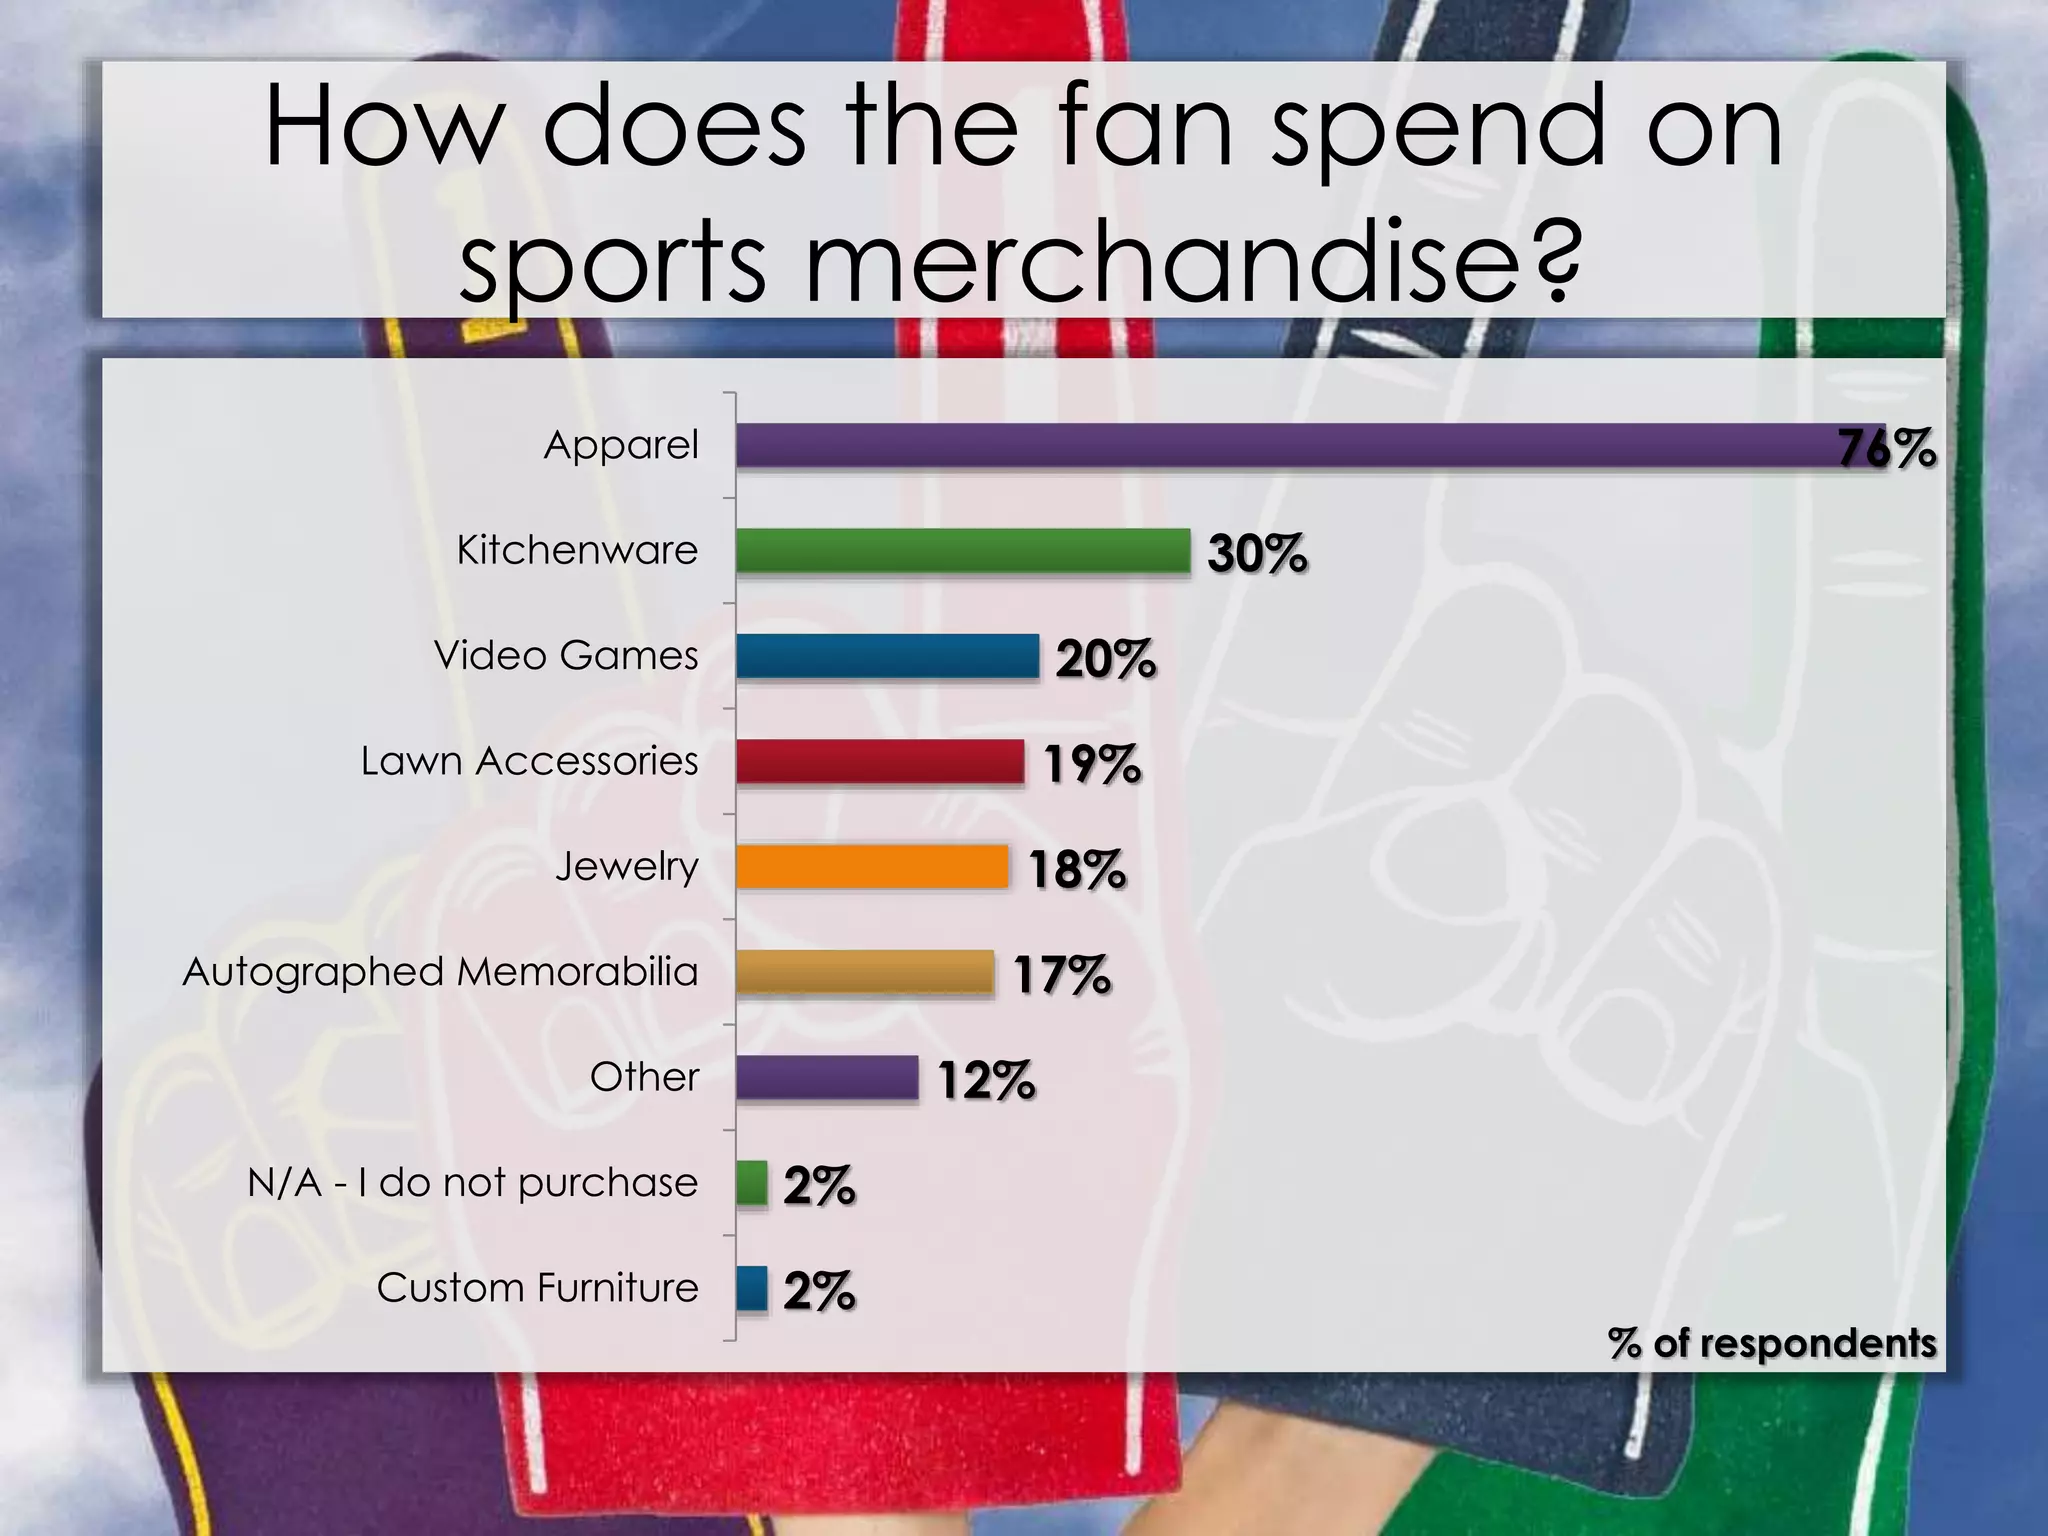
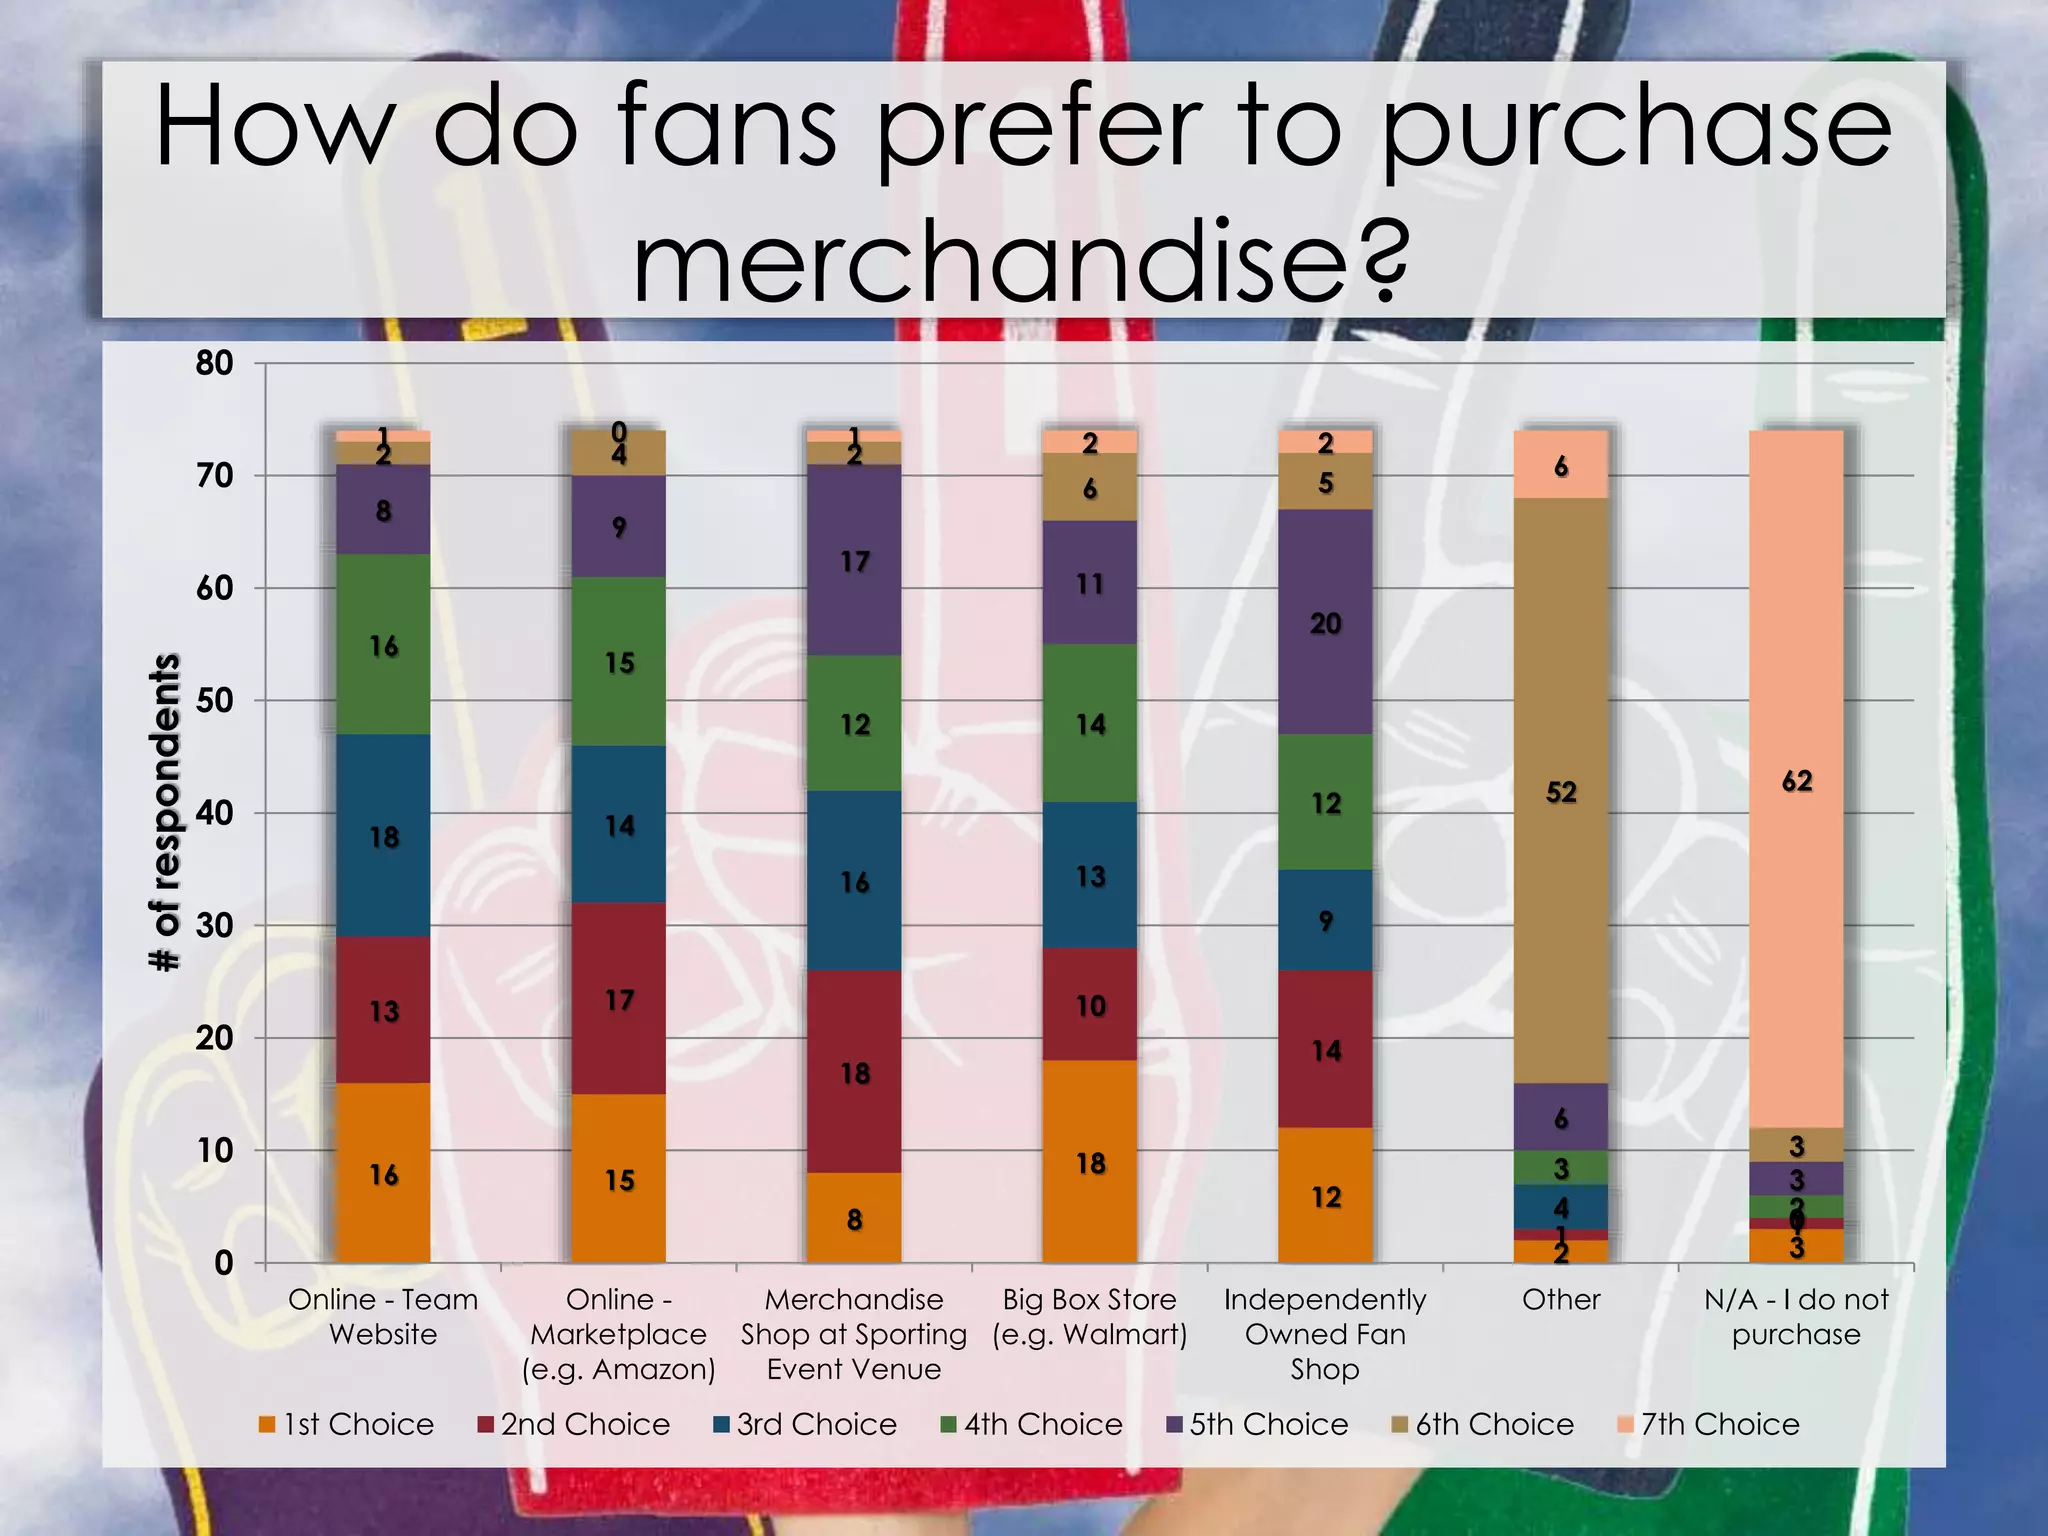
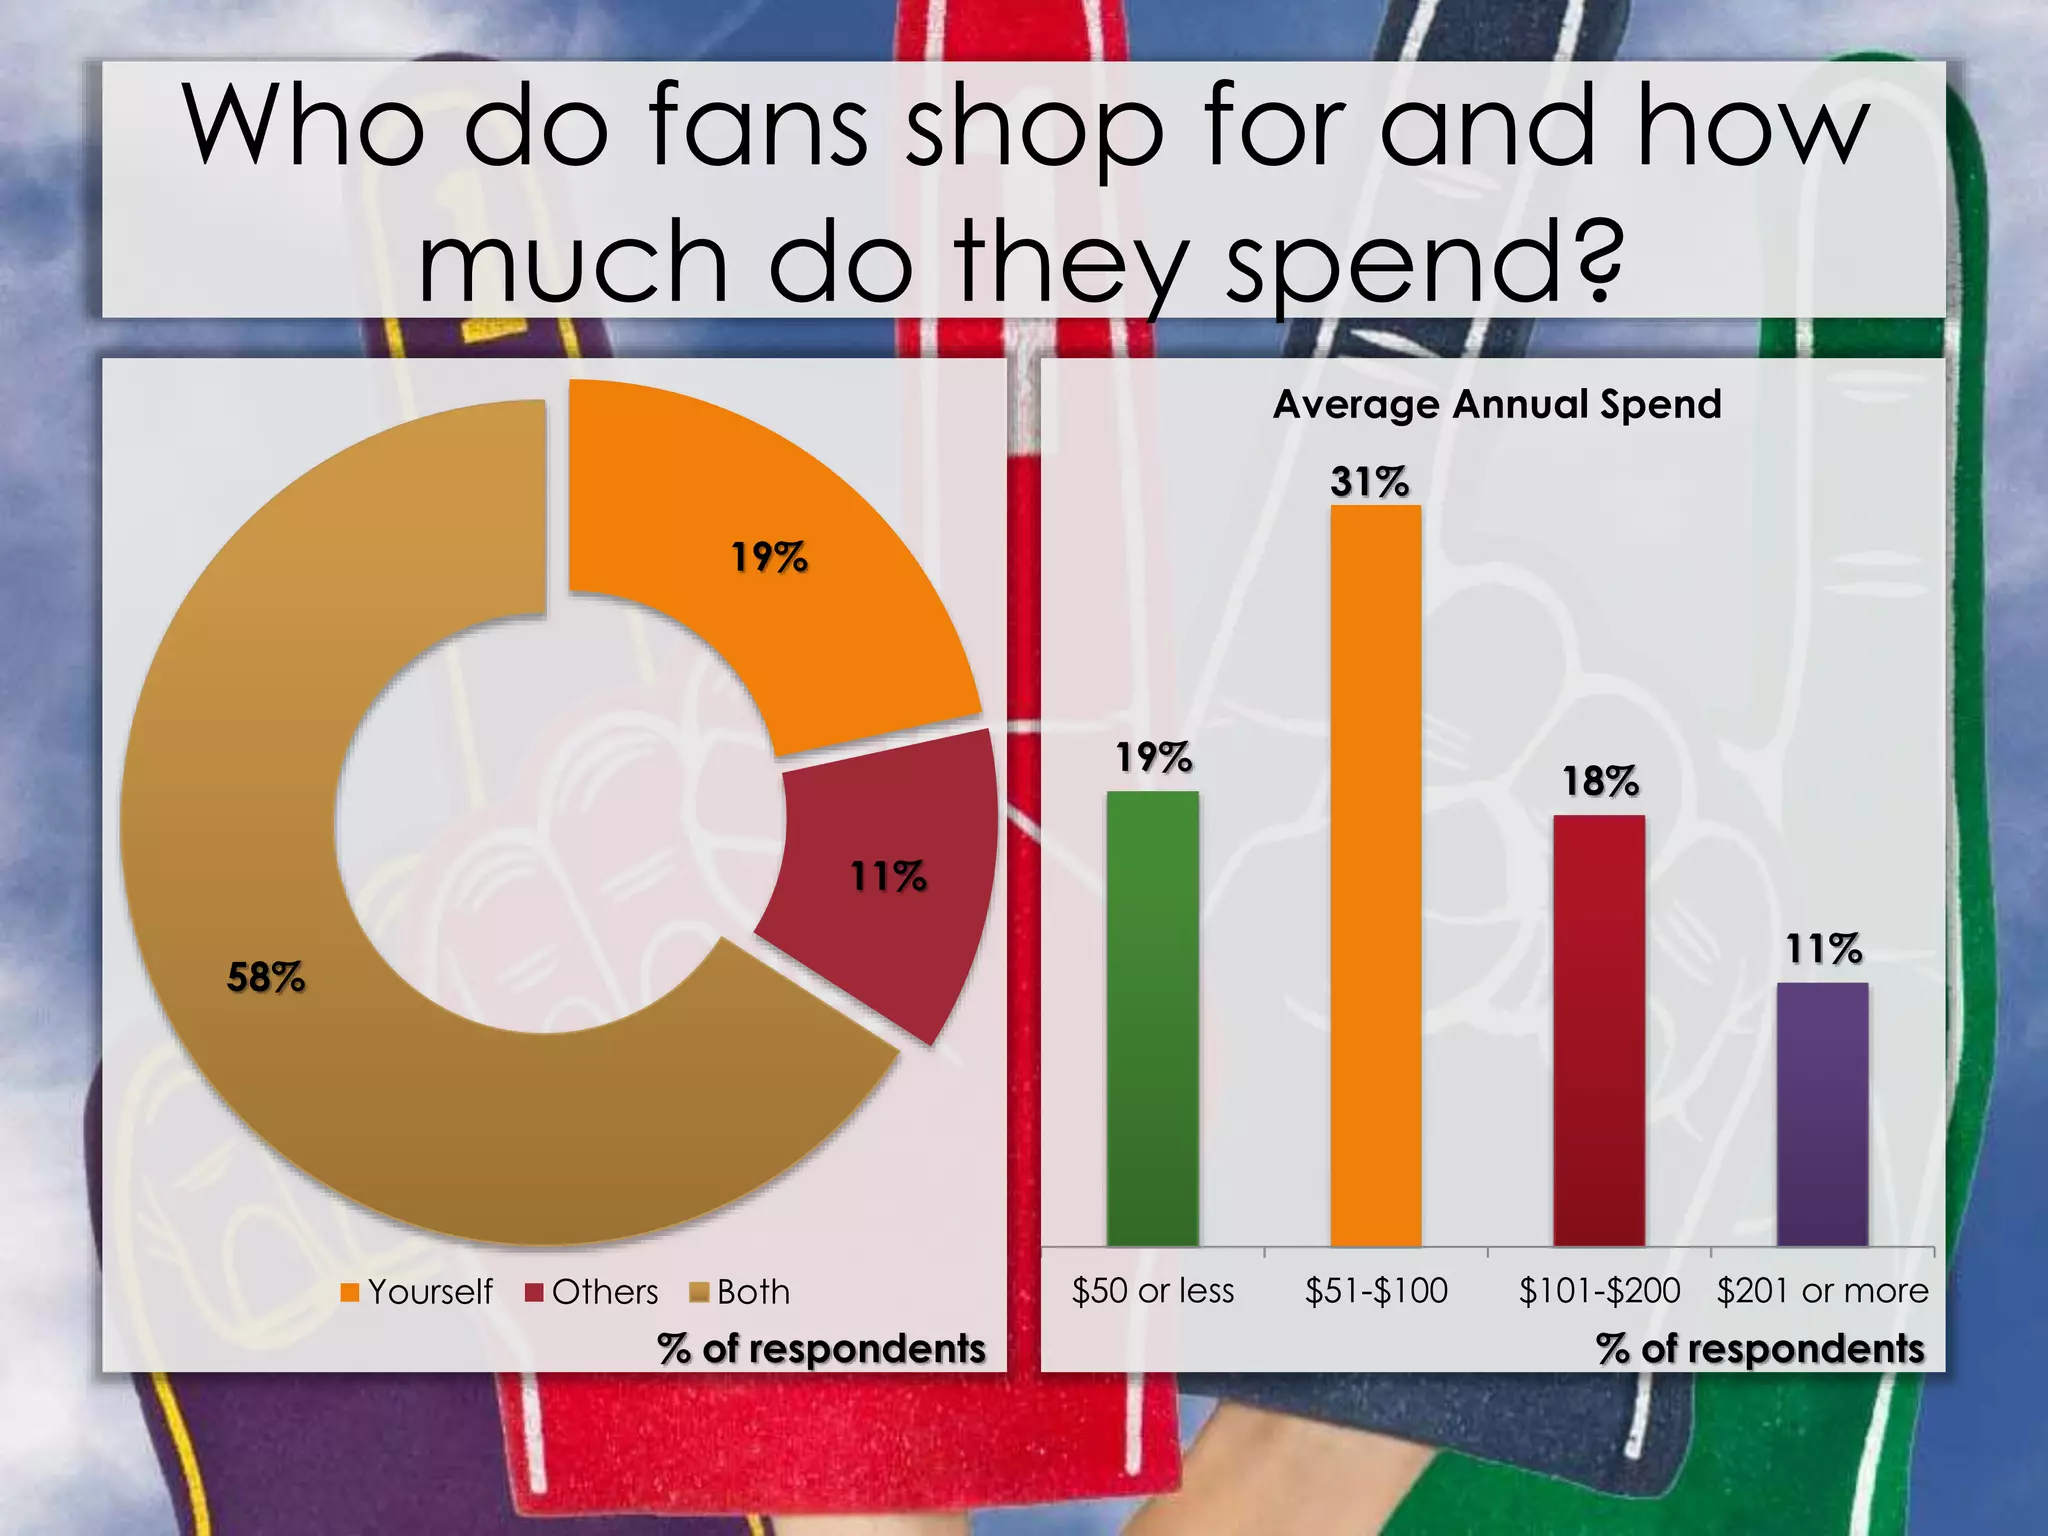
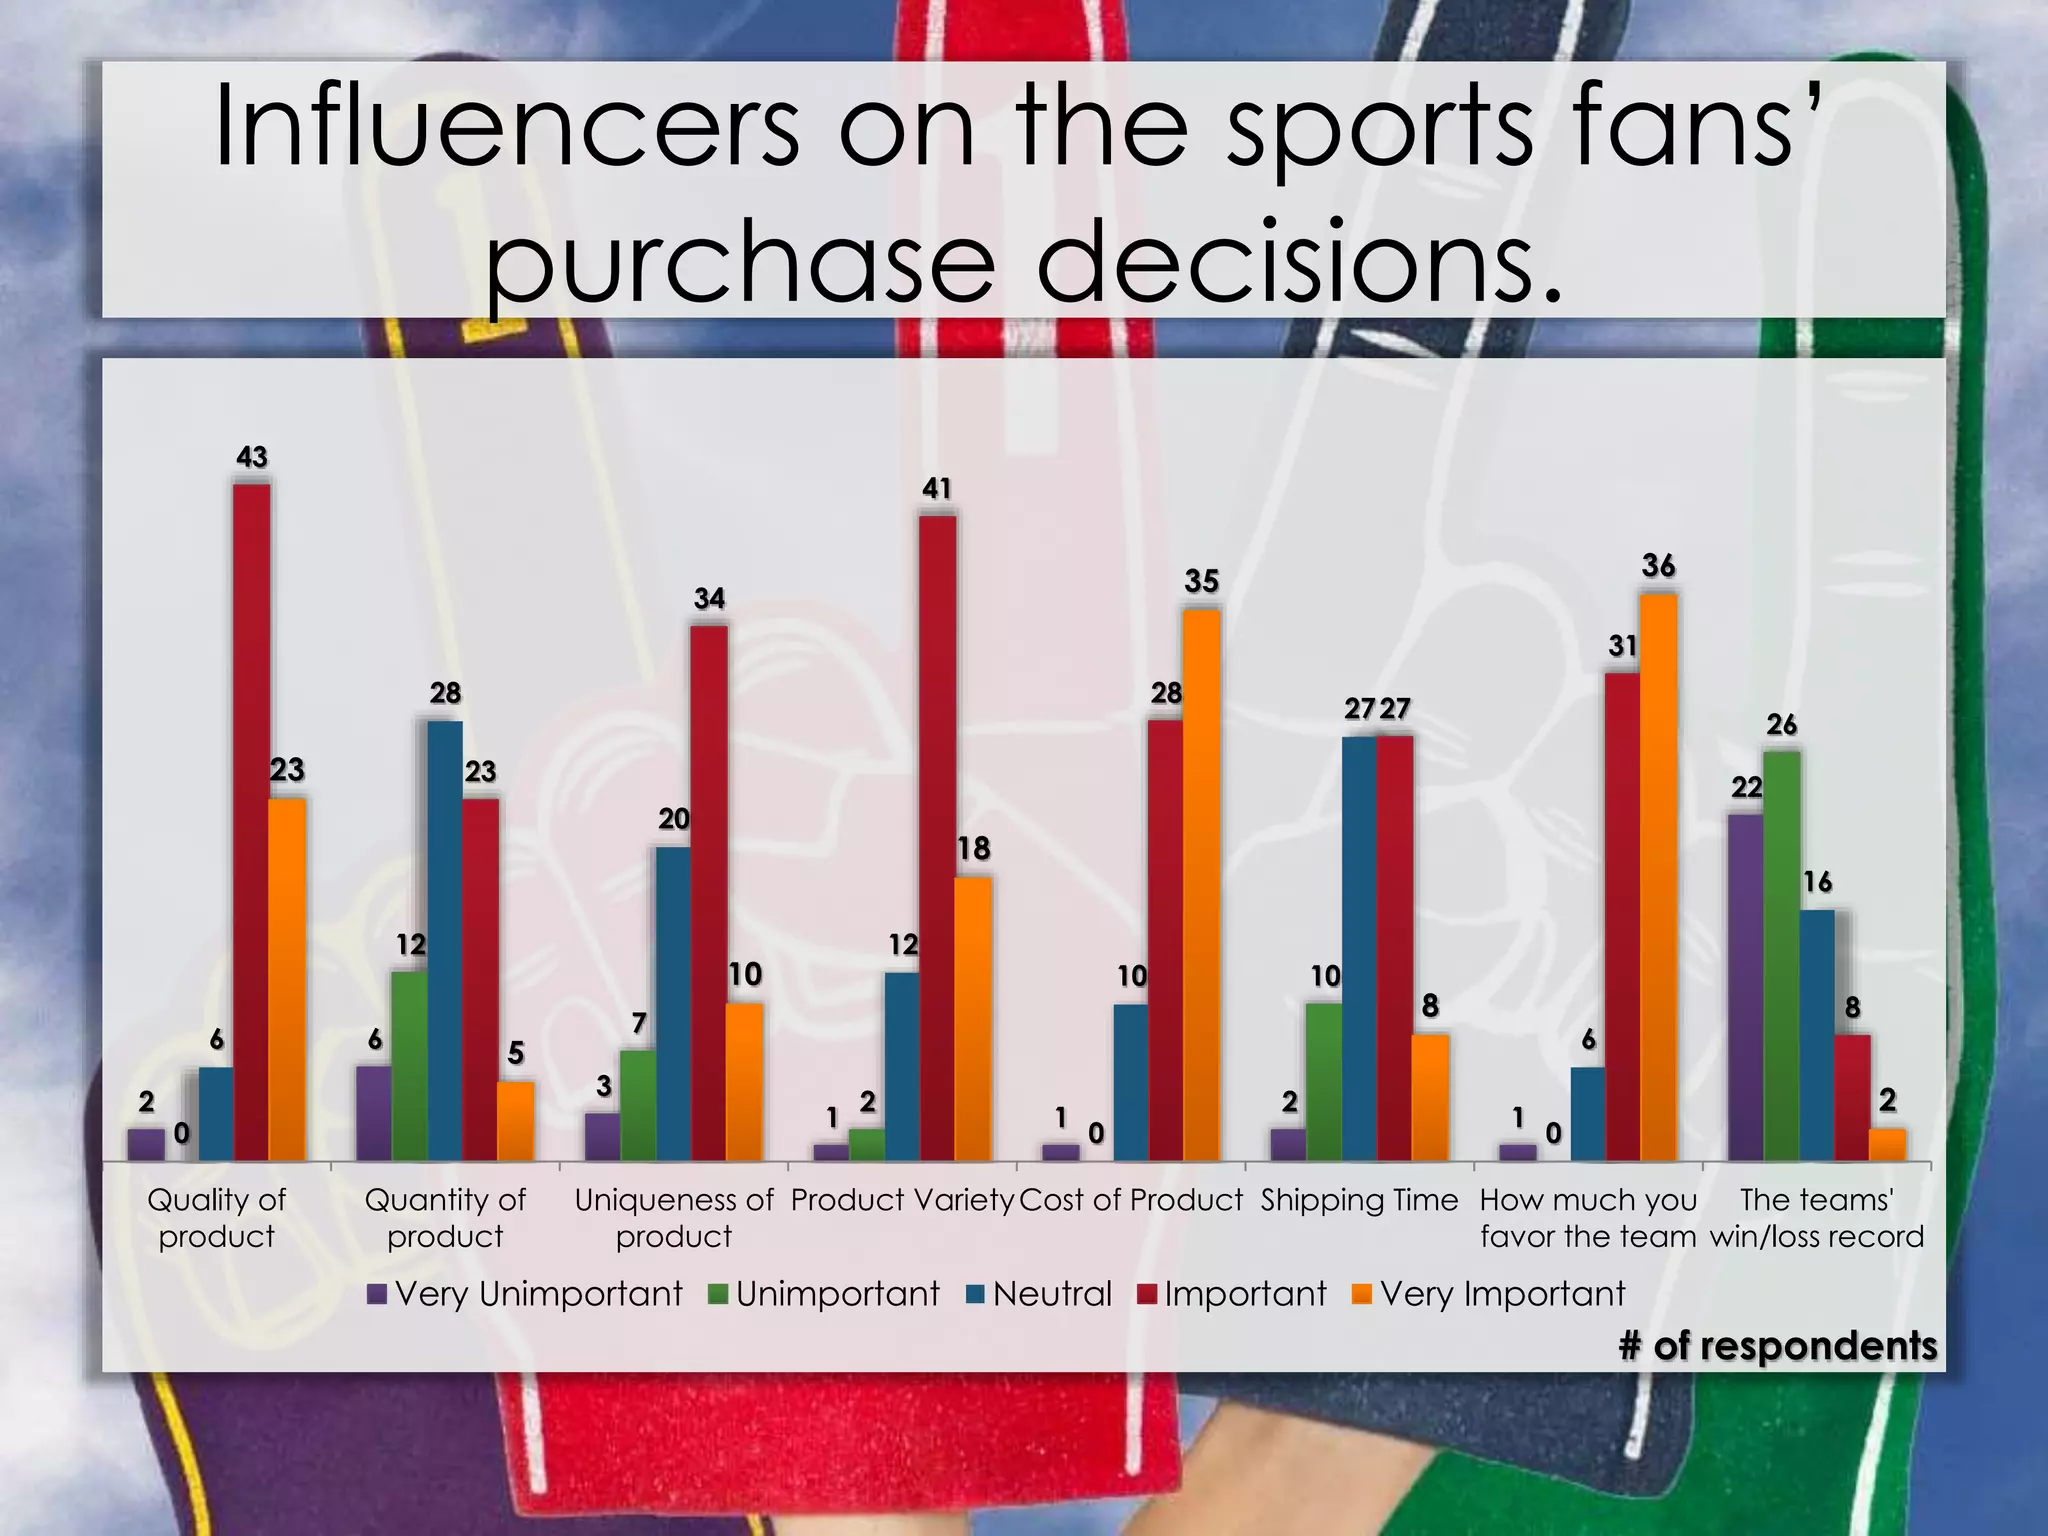
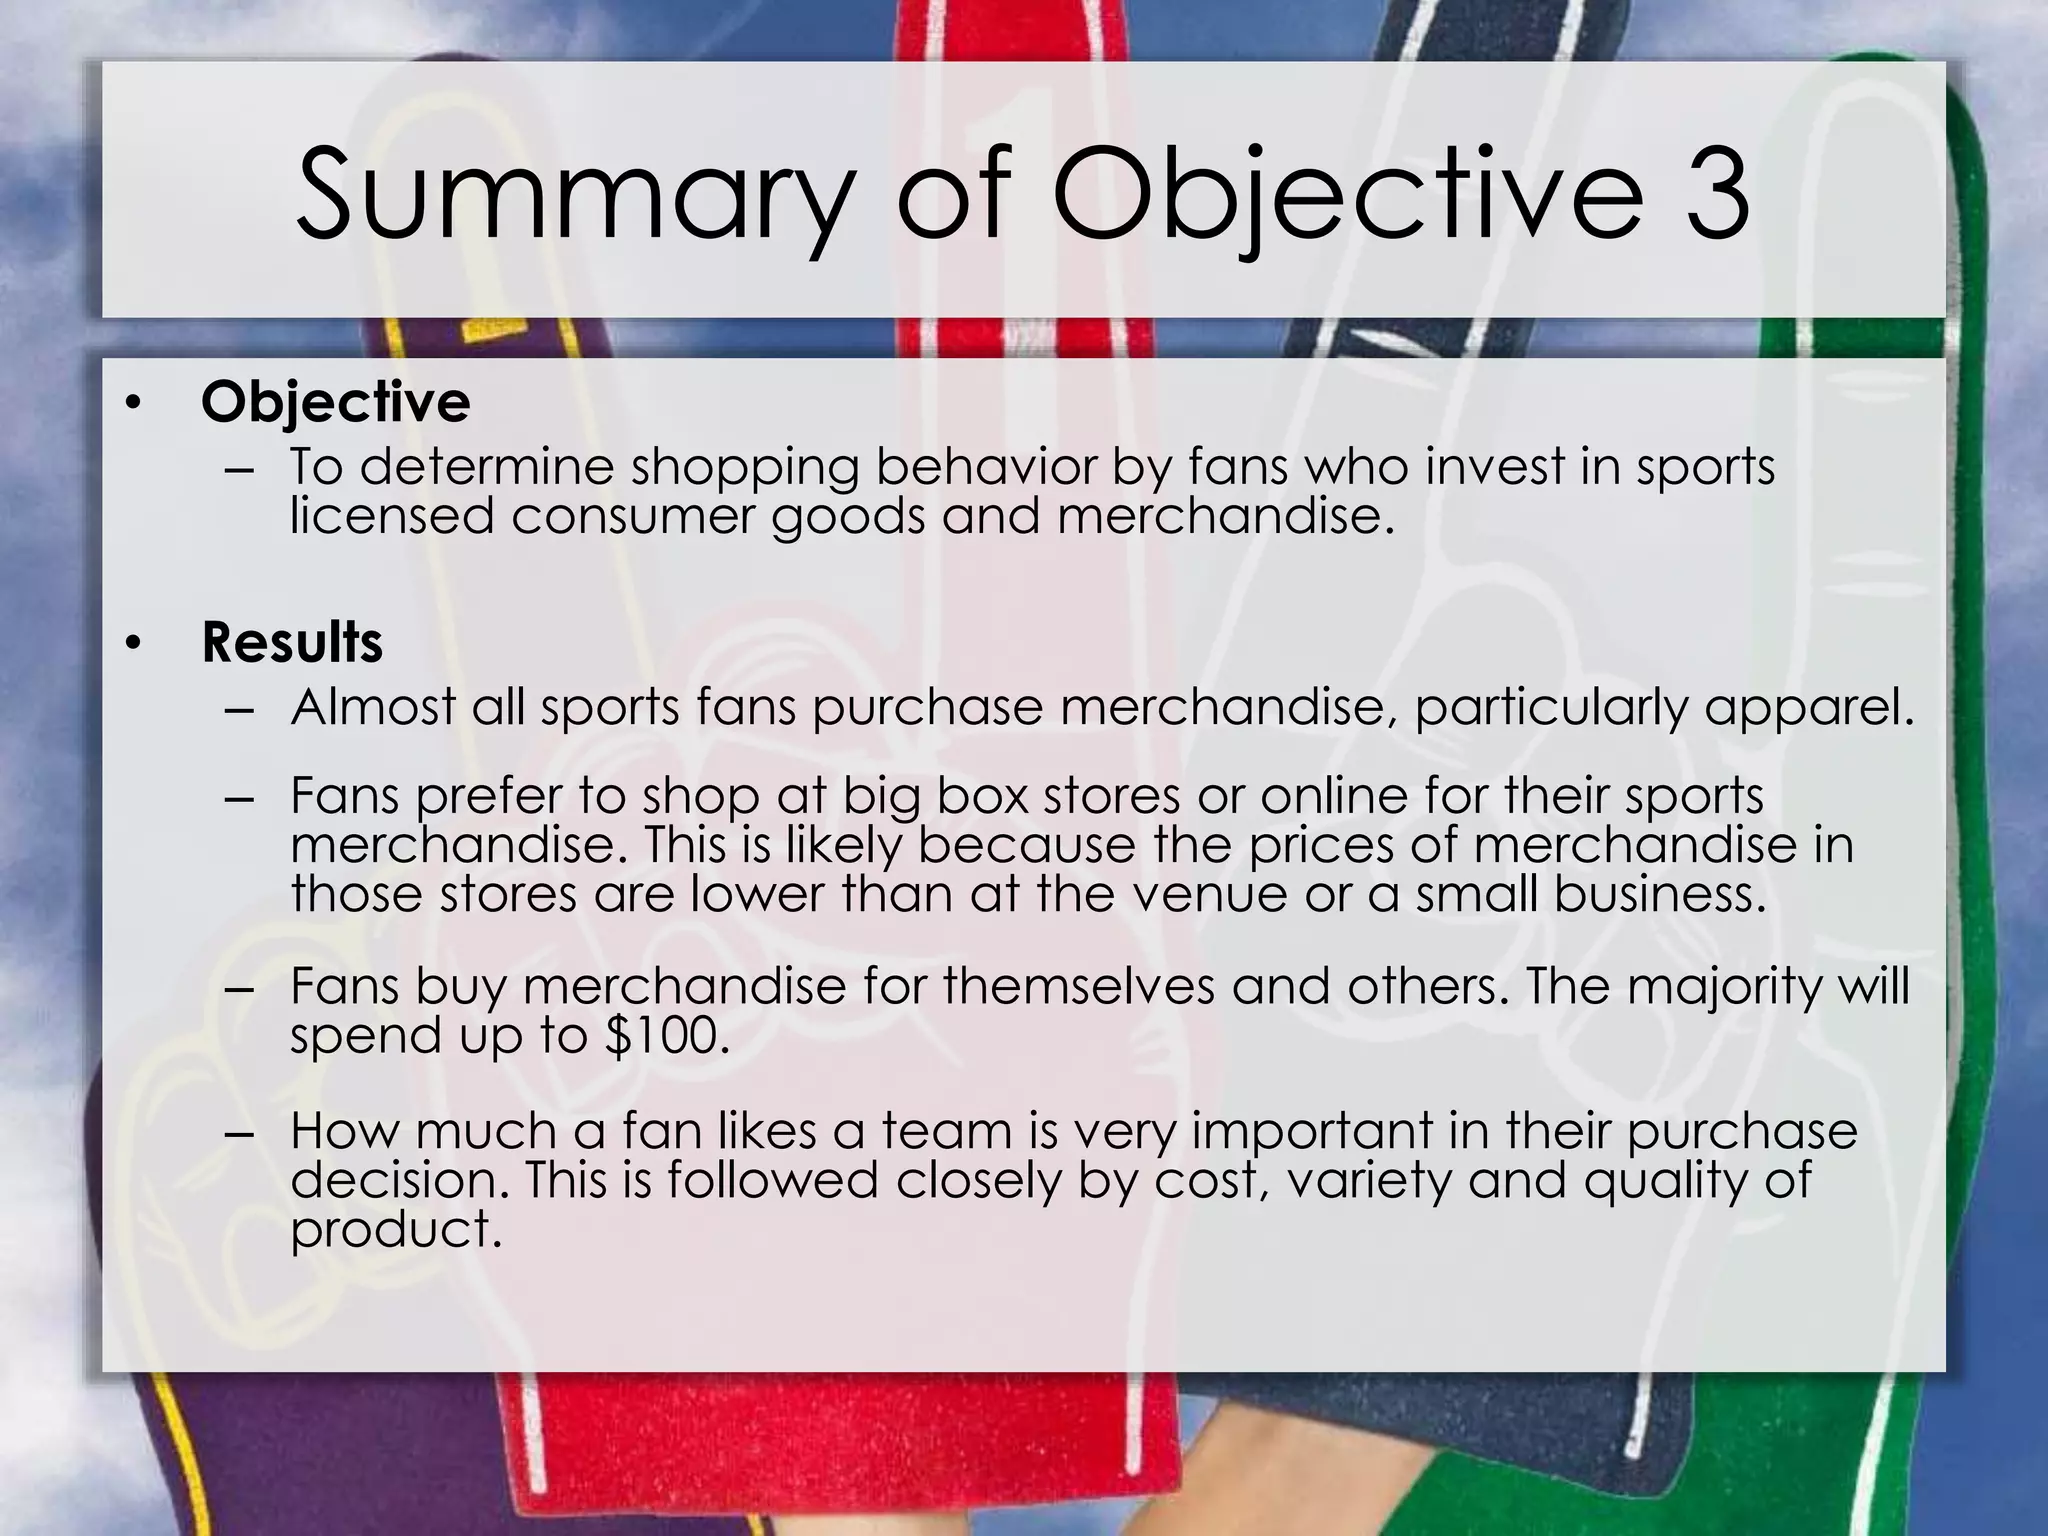
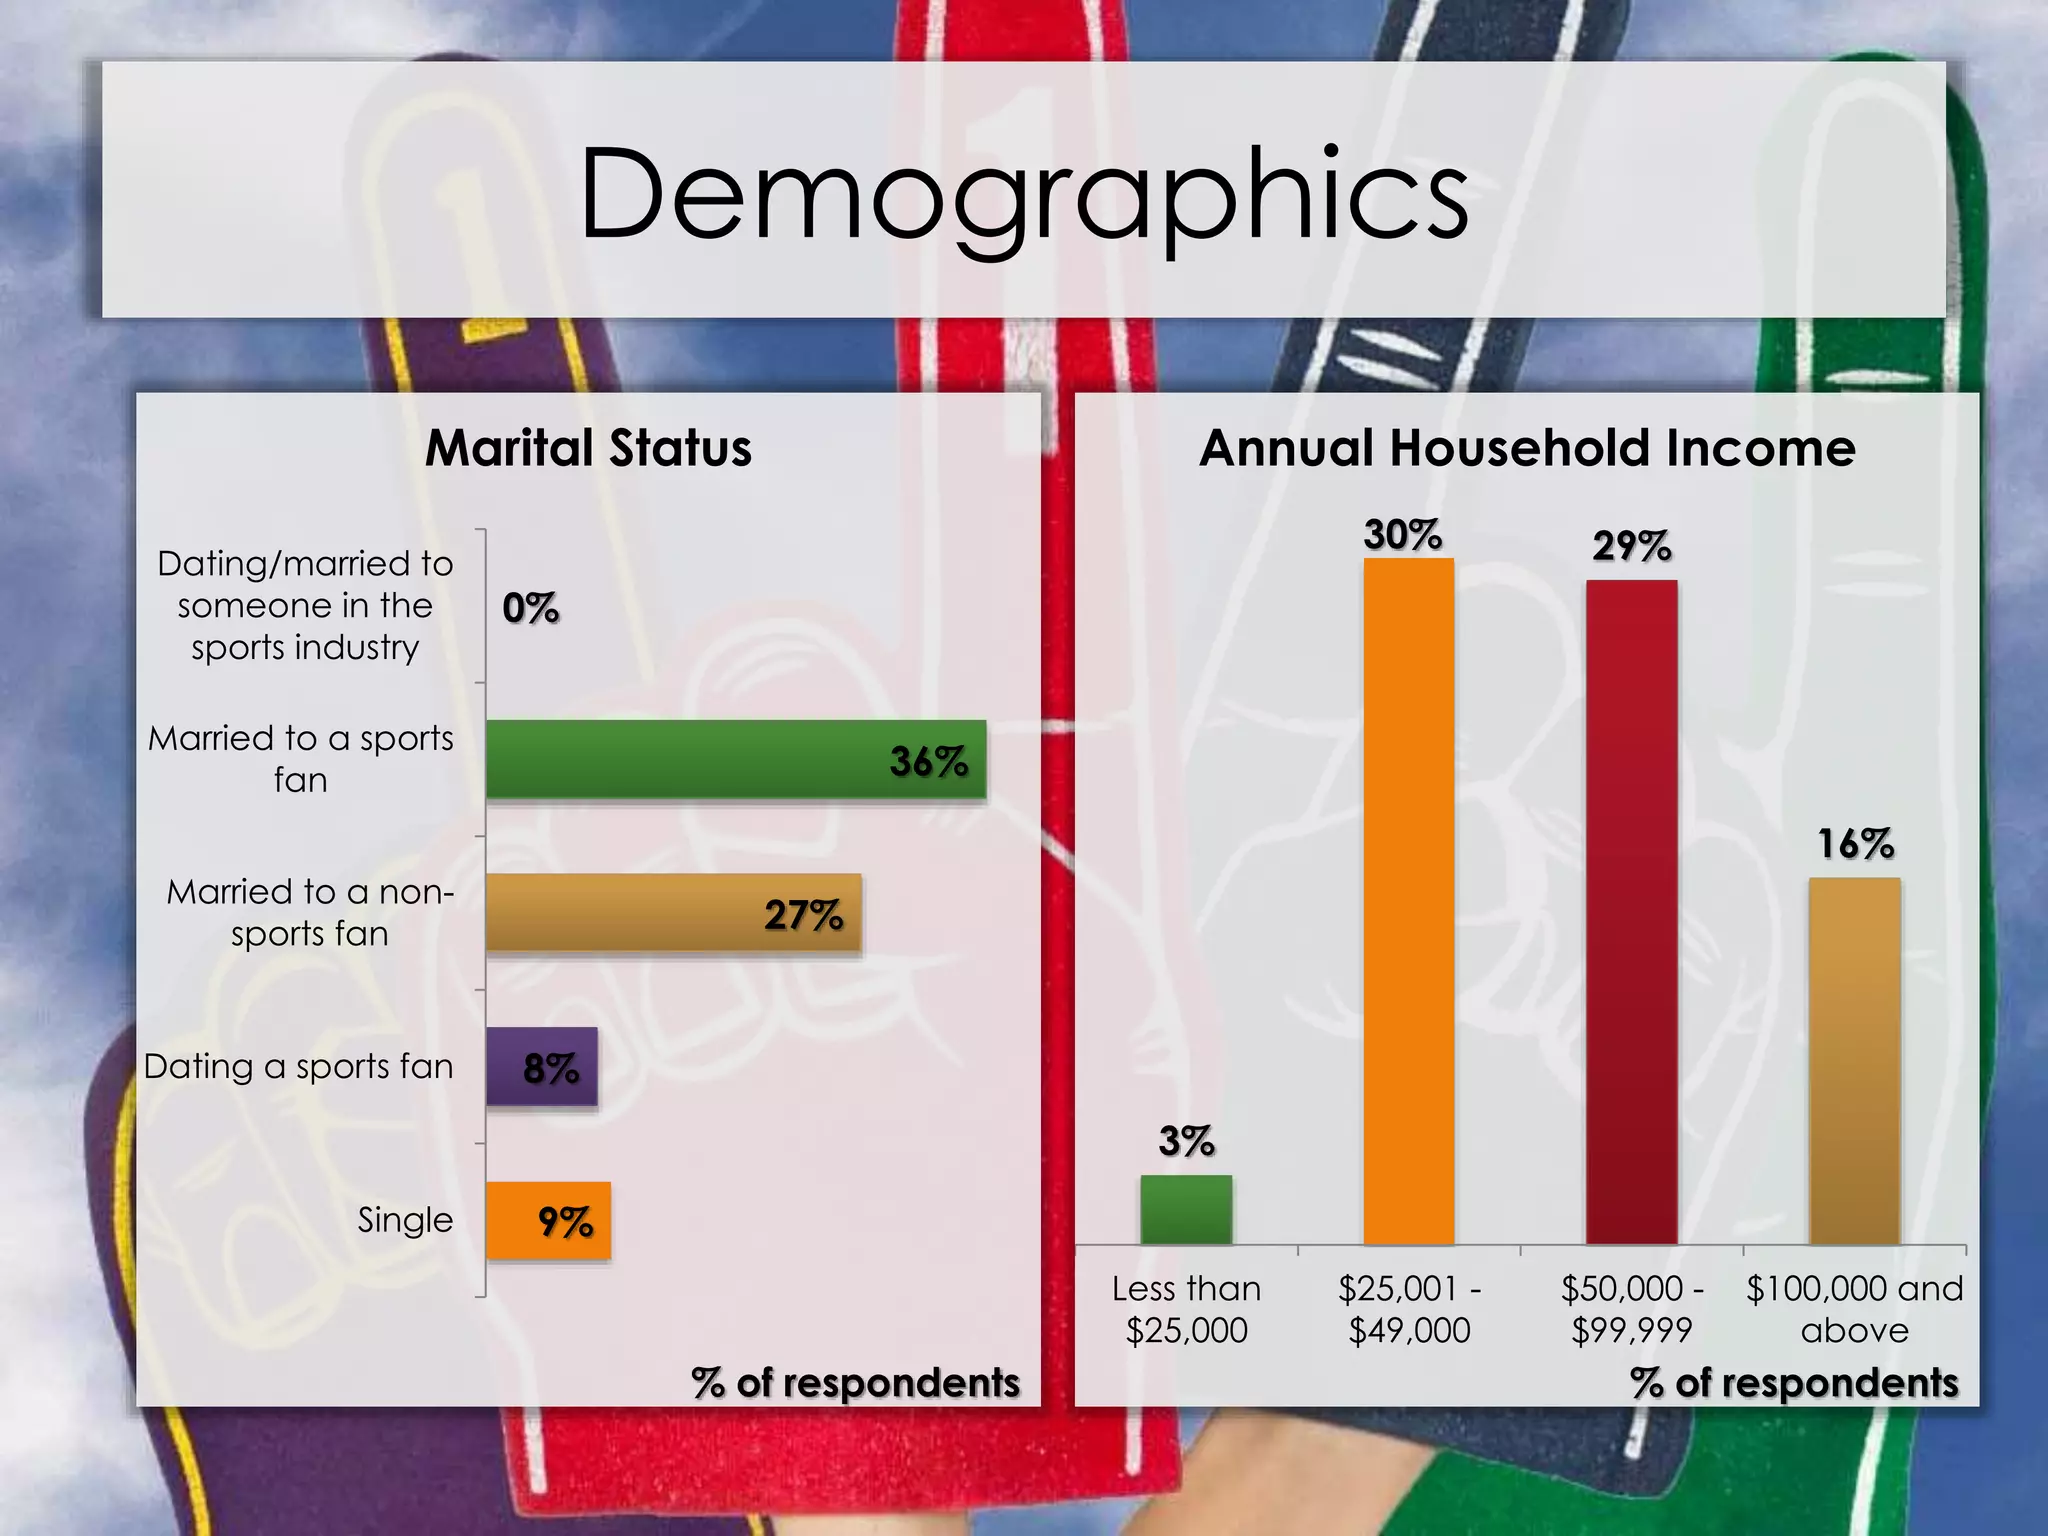
- Fans are willing to spend up to $100 annually on team merchandise, prioritizing apparel. They shop at big box stores and online.
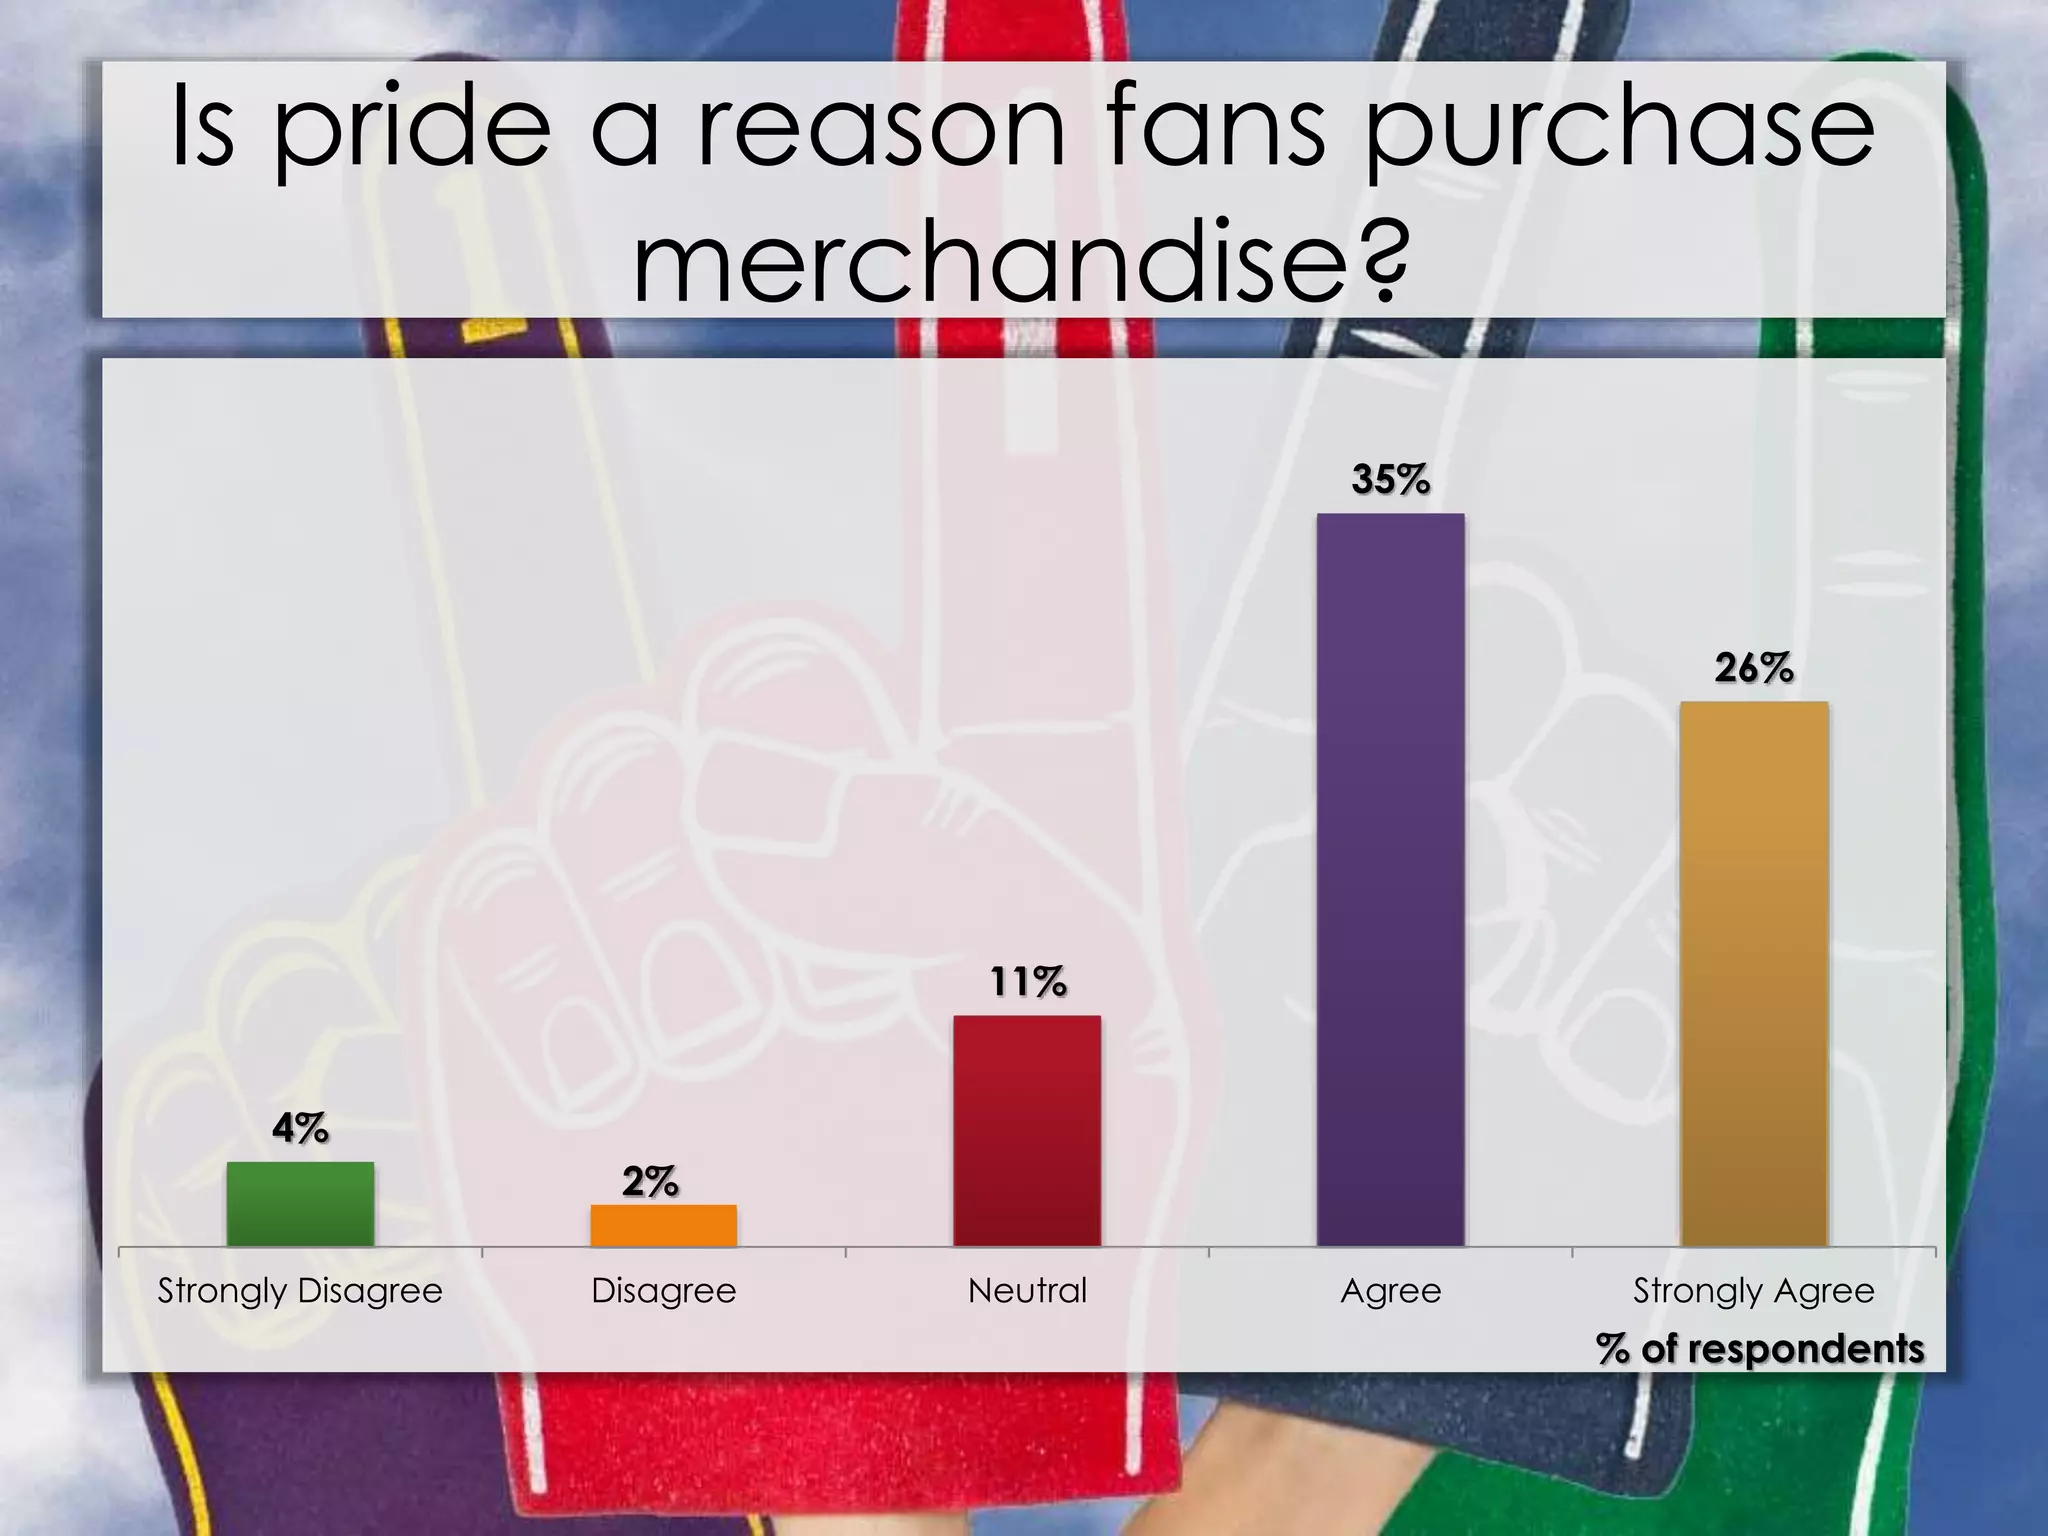
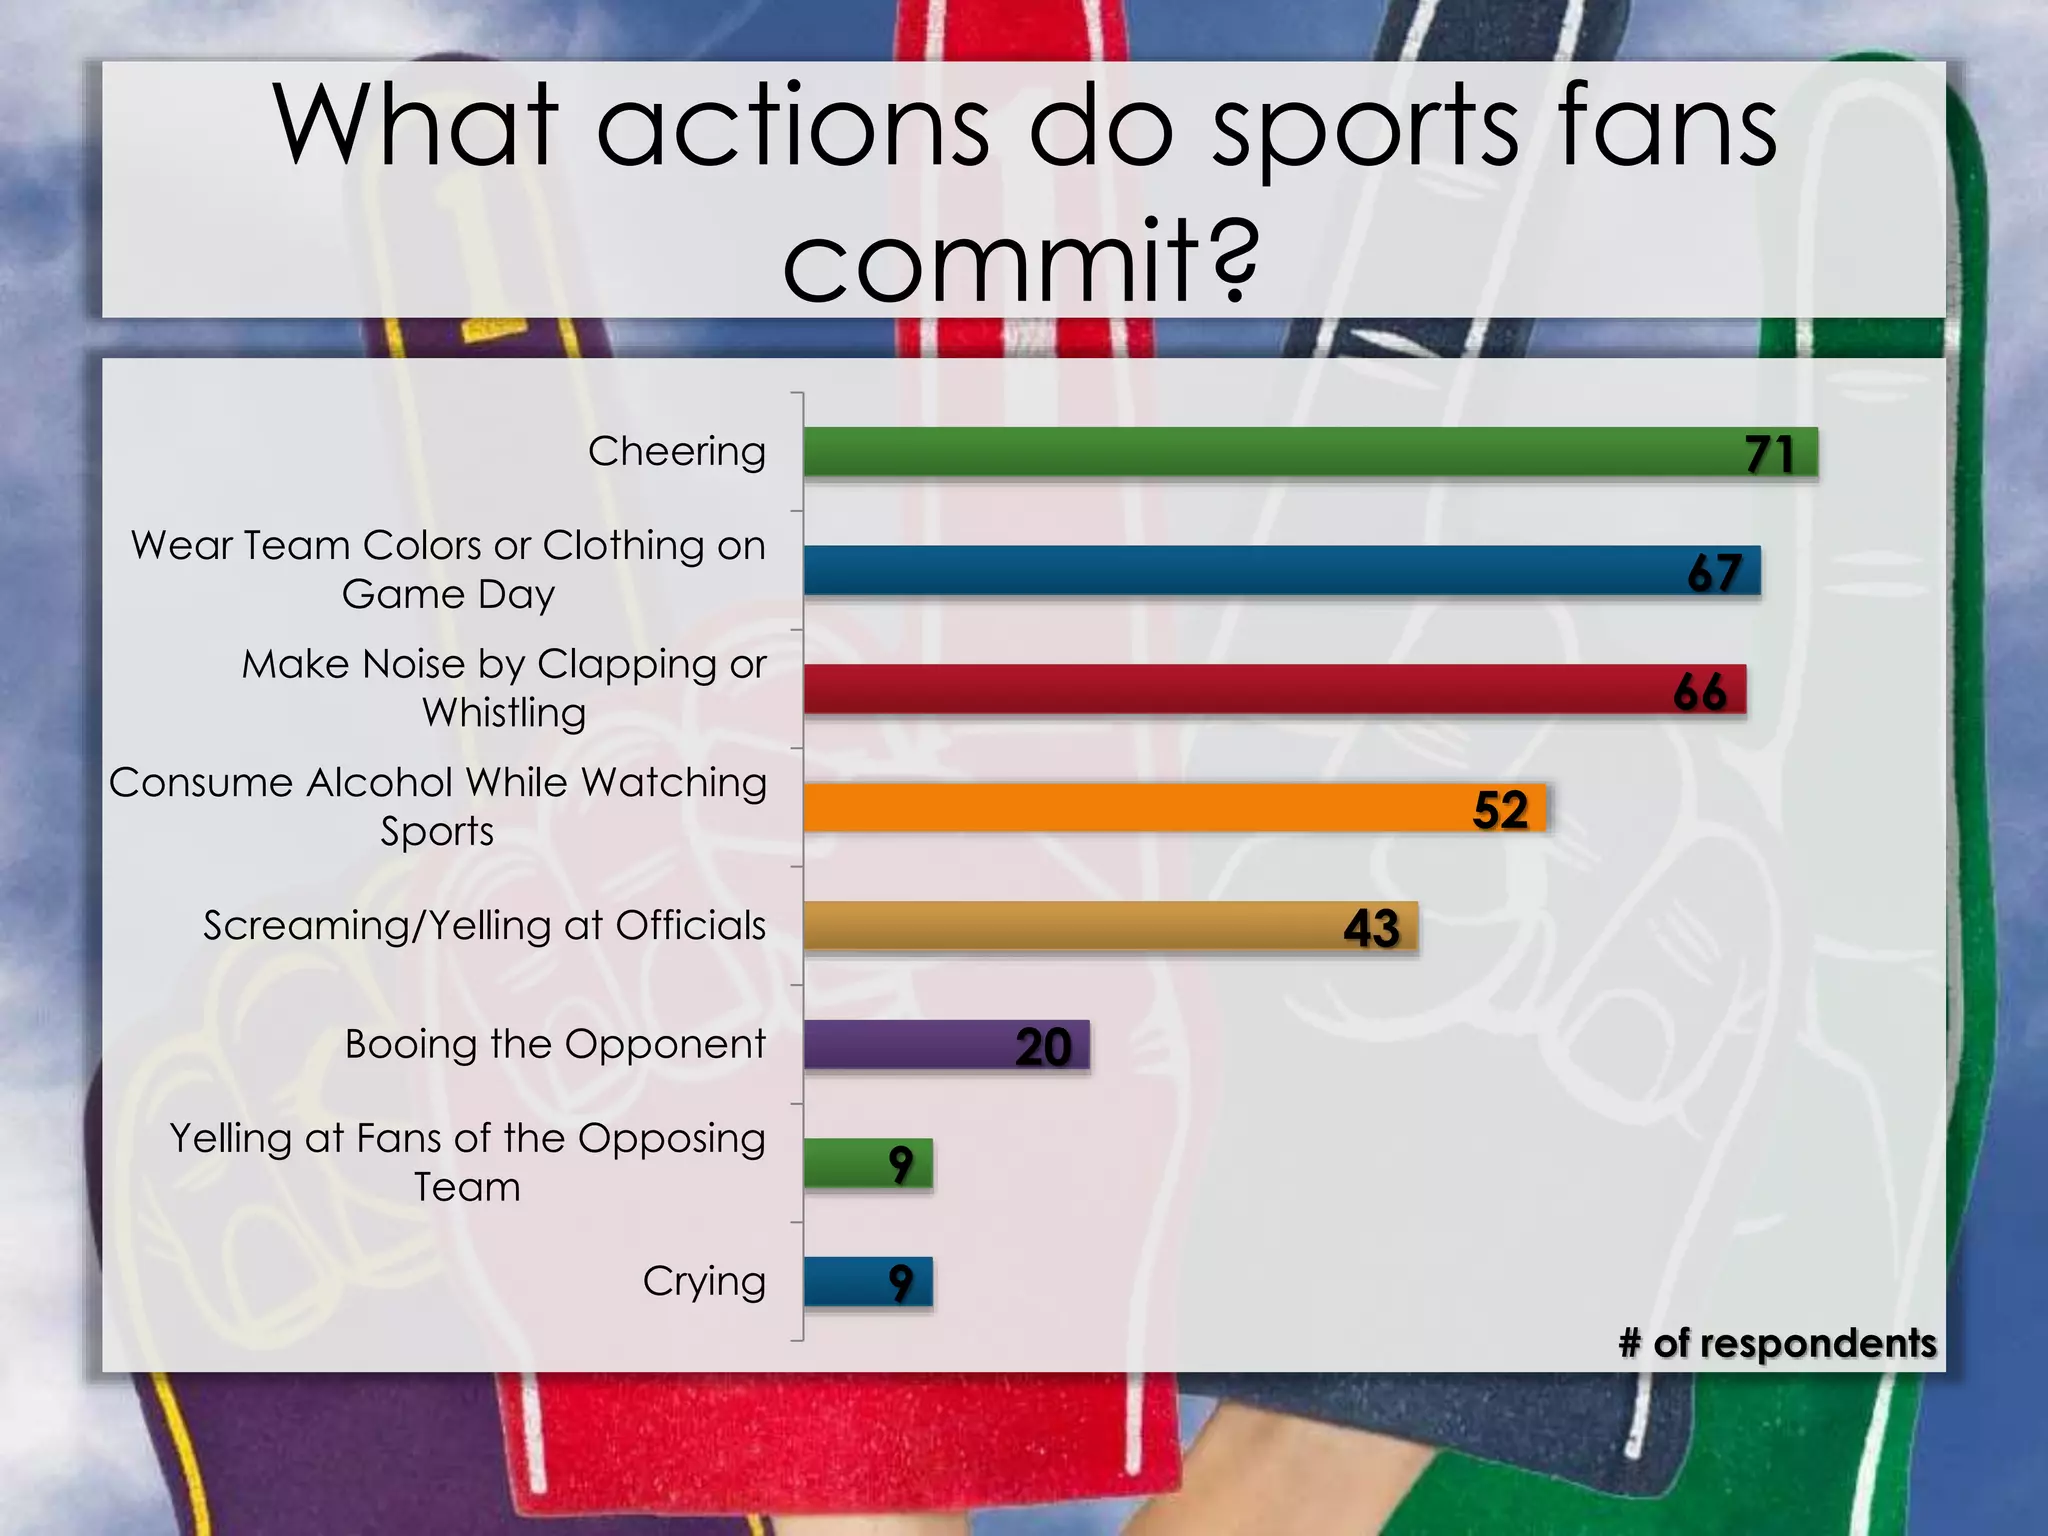
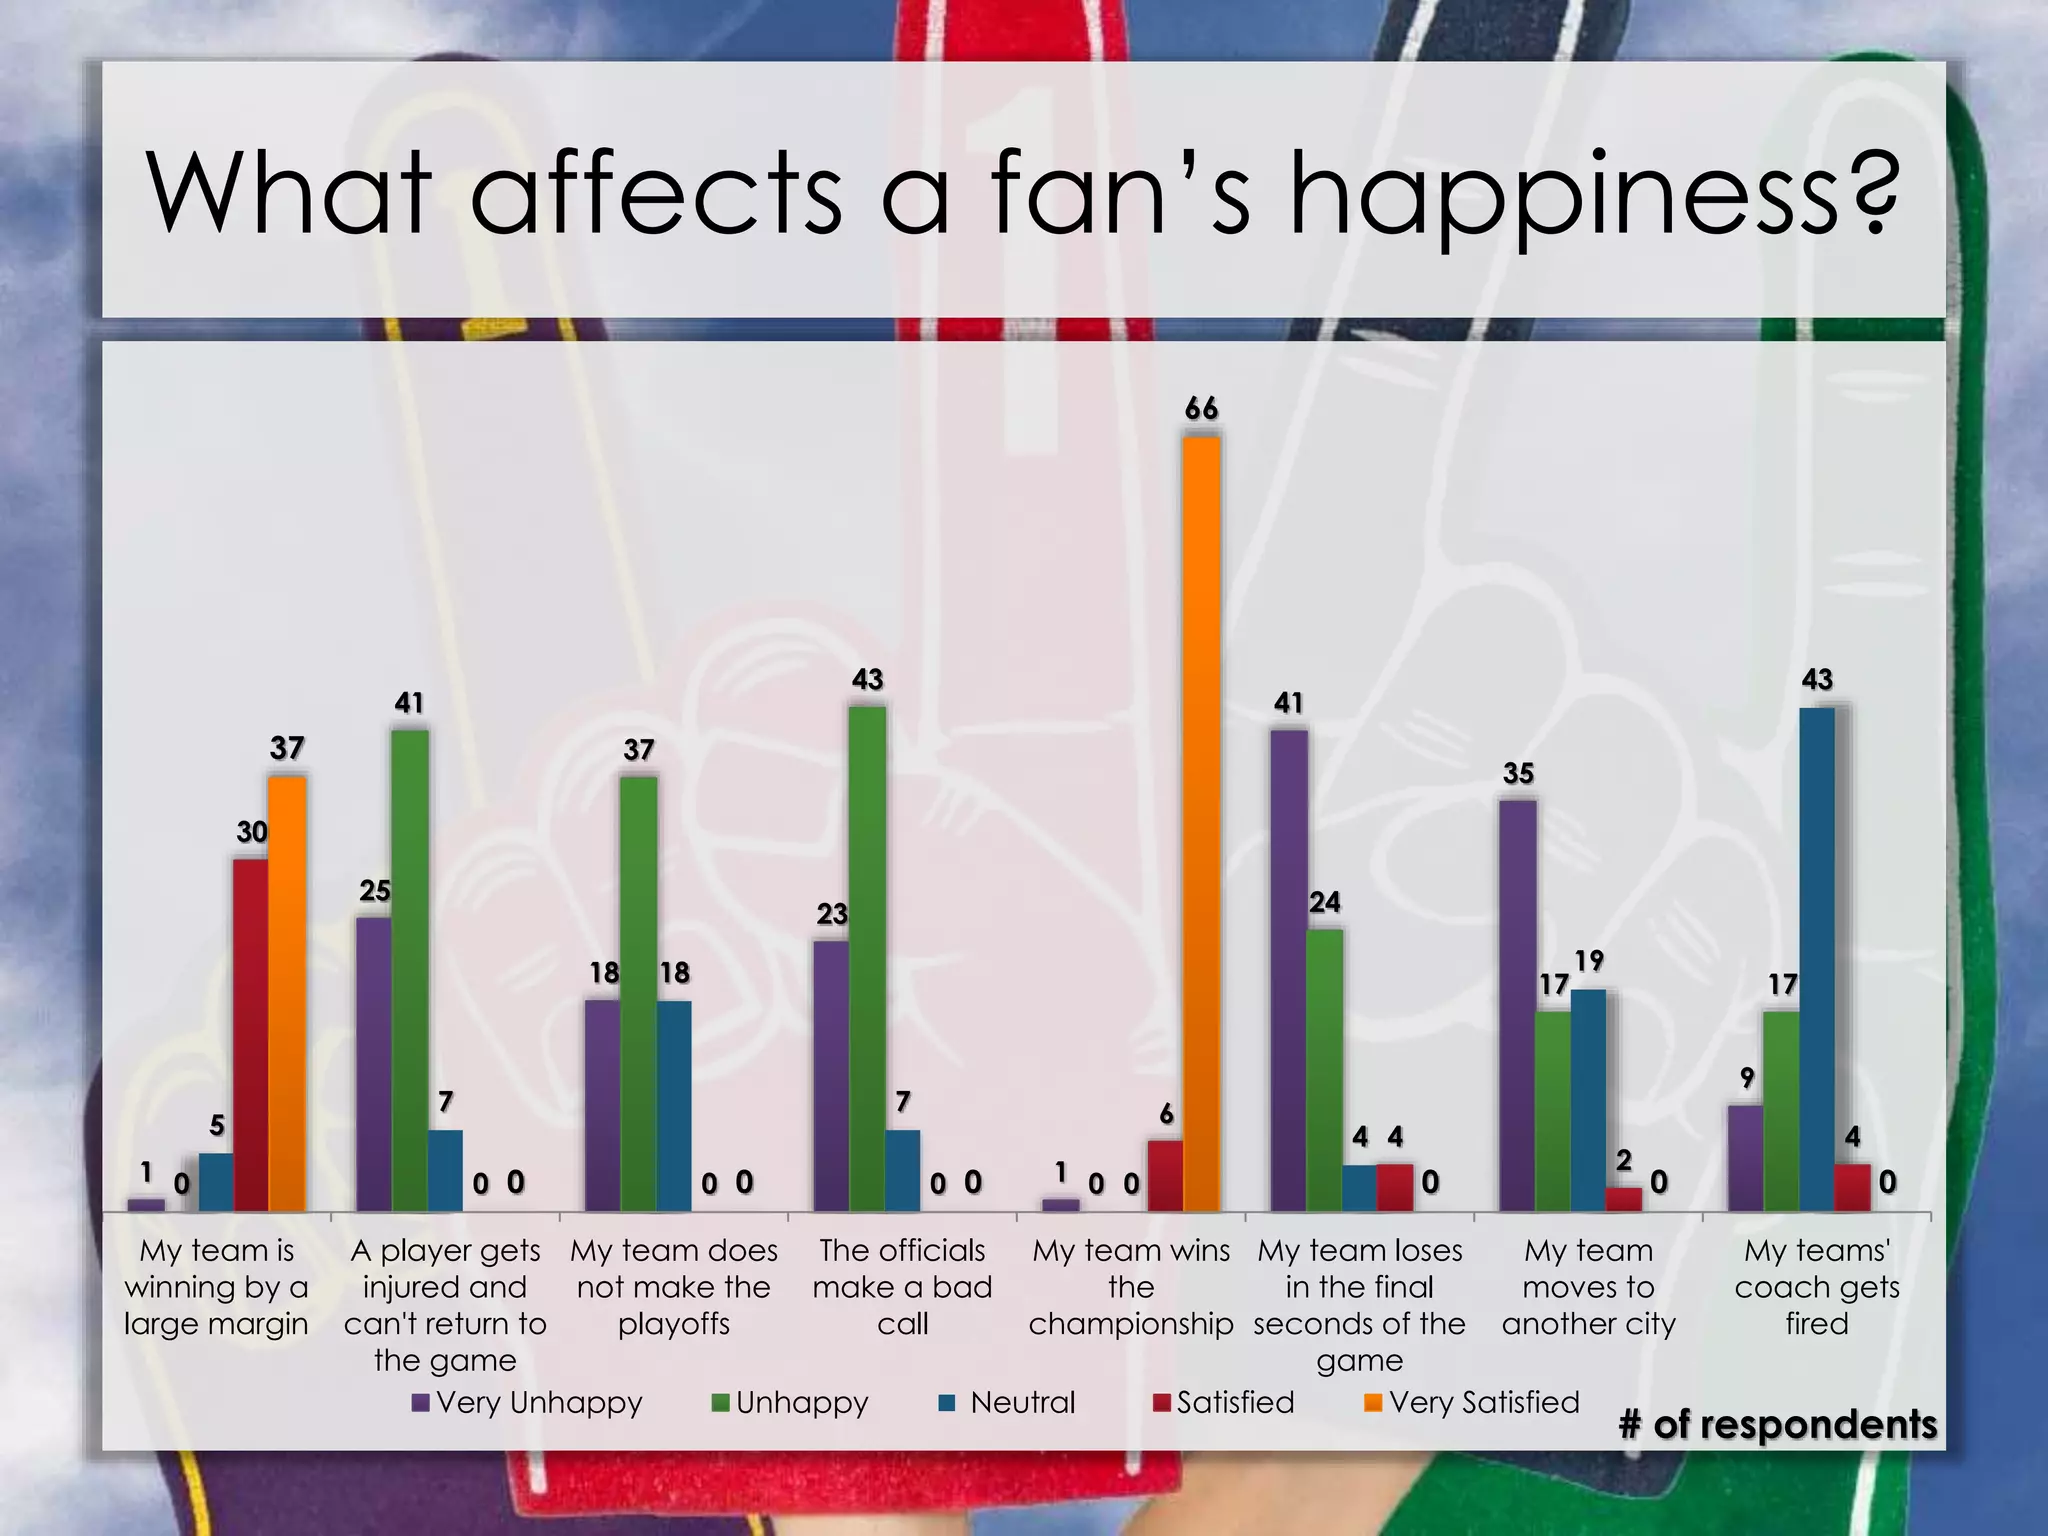
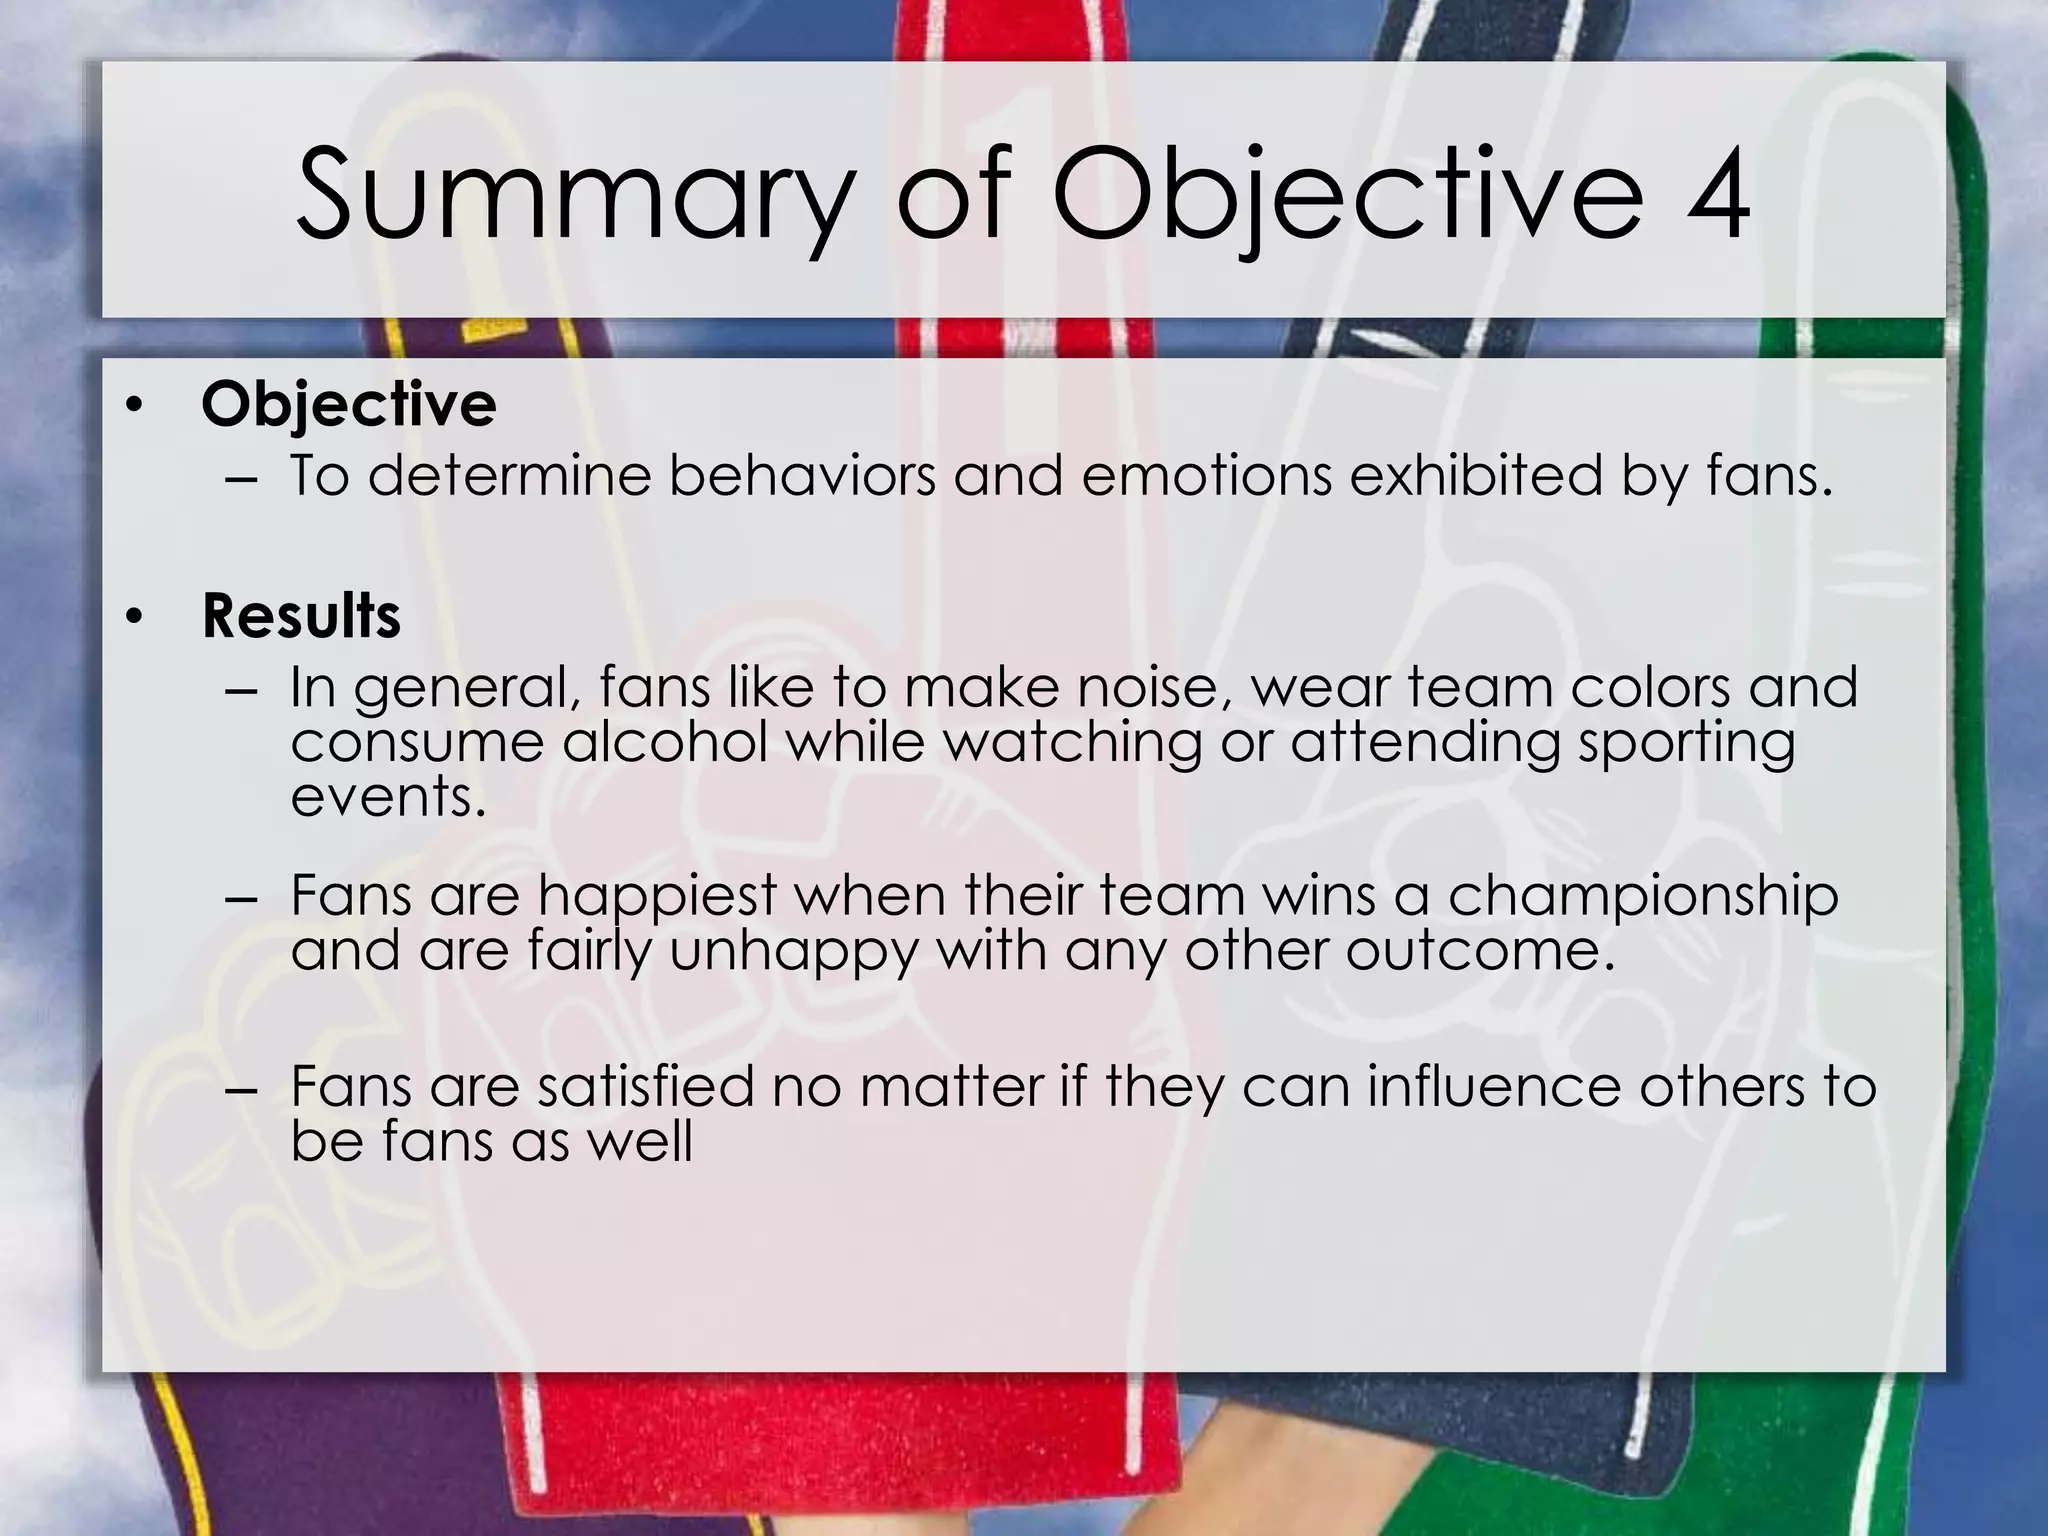
- Fans experience a range of emotions from their team's performance and enjoy cheering, wearing team gear, and consuming alcohol while watching.
In many ways, athletes, teams, and leagues invented the idea of loyalty. They have engendered the sort of passion and engagement that today’s consumer loyalty programs work hard to achieve. However, sports organizations cannot only rely on the loyalty that is generated by winning seasons and championship trophies. It will be increasingly important for organizations to understand fan behaviors and preferences to deliver experiences that nurture fans’ loyalty and extend it beyond the field.
For more visit: www.deloitte.com/us/SportsLoyalty
MIT Sloan Sports Analytics Conference Leah Raphael
I had the opportunity to attend the 2016 MIT Sloan Sports Conference and wanted to share the notes I took to summarize all the panels I sat in on. The conference is a great opportunity for students to network with the sports industry's top professionals and I highly recommend attending if you are interested in working in sports and want to gain an understanding of how the industry is evolving!
Contrary to popular belief, technology is actually making people more empathetic. The Internet is not driving people apart; rather, it's bringing people together. In an effort to humanize their web experience, consumers are volunteering more information—and that's good news for forward-thinking brands. To embrace this warming web, digital marketers must strive for emotional engagement with their customers to establish connections that are more meaningful than likes and retweets.
Thanksgiving weekend is the biggest shopping weekend of the year, with consumers taking advantage of the sales to complete their holiday shopping. This year, we surveyed our network to find out how people are spending their money this holiday weekend. About 50% of people will shop on both Black Friday and Cyber Monday, with electronics and apparel making up the bulk of purchases.
When it comes to acquiring and retaining customers, the goal should be to develop strategies that scale efficiently and make the most of every dollar. But to do that, you first need to
understand your target consumers.
So we surveyed 1,800 U.S. consumers, illuminating trends on how they discover new retailers, why they decide to try a retailer, and what convinces them to recommend a retailer to others. From there, we developed strategies and tactics that capitalize on those behaviors to help you maintain a steady flow of new and repeat customers.
ThinkNow Retail™ Asian Holiday Shopping Trends 2016 [Snapshot]ThinkNow
40% of Asian-American consumers will be spending more during the holidays this year than last, preferring to buy gifts online.
The National Retail Federation expects sales in November and December (excluding autos, gas and restaurants) to jump 3.6 percent from last year to $655 billion. The NRF’s Holiday Forecast 2016 has non-store sales — 90 percent of which is e-commerce — growing by seven to 10 percent to as much as $117 billion. And one demographic, in particular, is driving a significant amount of that growth: Asian-American consumers, the fastest growing minority segment in the U.S.
In our recent in-depth research series, ThinkNow Retail™ – Total Market Holiday Shopping Trends, we conducted an online survey of 253 Asian, 245 non-Hispanic white, 249 African-American, and 502 U.S. Hispanic consumers. We explored the holiday shopping habits of multicultural consumers in the U.S. to help brands and companies better understand these super holiday consumers and how they compare to the rest of the country. This report highlights the top 5 key holiday shopping habits and behavioral insights we uncovered among the Asian-American cohort.
Asian-American consumers represent $825 billion in consumer buying power — which is expected to rise to $1.1 trillion by 2020. They display unique holiday shopping habits that allow points of entry for marketers to connect with them this holiday season, which is a major factor because almost 40% of Asian-American consumers will be spending more this year than last. A significant portion of those sales will be online. And not only are they purchasing their gifts online, but they are also researching their gift list online, and are more likely to move on to the next item if the gift they are looking for is not available for purchase online.
Download Our Other Reports Here - http://www.thinknowresearch.com/reports/
LIMRA/LOMA Conference Presentation: Rising above the Noise: Facebook’s EdgeRa...Augie Ray
Today, brands focus on likes and fans, but rising above the social media noise has never been more difficult. At the same time, financial services firms face a crisis of trust with consumers — a problem social media is particularly well suited to help resolve. What is the trust gap and how can financial services companies leverage social media to close it? In this presentation, you'll find data from Forrester, Edelman and others that define the trust crisis in insurance, banking and financial services and also provide the basis for the solution--using social media to build trust.
Men's use of medias in purchase process / NRS spring 2017Aikakausmedia
Use of medias as information sources during the purchase prosess in 11 branhces / all, NRS Spring 2017
Medias: Print magazines, Magazine Websites, Blogs, Newspapers, Newspaper Websites, Television, Radio
Branches: Cars | Style & Fashion | Travelling | Health & Well-being | Food & Cooking | Cosmetics & Cosmetic Brands | Furniture & Decorating | Building & Renovating | Gardening | Home entertainment electronics & Information technology | Saving & investing
Source: National Readership Survey, MG + total, S2017 (Finland).
Back in 2006 when Twitter launched people didn't know what hash tags were, or in 2004 when Facebook launched, fan pages didn't exist!.
Since then technology has moved on. Learn the latest trends in social media, from Like gating on Facebook to Market research.
It goes without saying that every brand should have a presence on social media. Learn how brands can build awareness, engagement, and sales by using the right platform, posting relevant content, and authentically communicating with their followers.
The popularity of social media has continued to increase since last year's social media report was released. This highlights the importance of understanding how live event attendees engage with social media and using this information to enhance their live event experiences. This report presents valuable and interesting findings on social media usage and compares this year's findings to those from last year.
Esports U.S. Fan Profile - Free Version - MRI-Simmons 2020Ben Paro
Complimentary version of MRI-Simmons in-depth profile of American Esports Fans. Includes:
- Comparison to traditional sports fans (18+ and 18-34)
- Fan Demographics
- Psychographics and other defining characteristics
- Motivations for being an Esports Fan
- Attitudes toward sponsorship and advertising
- Top media behaviors
- Covid-19 Insights
- How to get the Full Report
Market Research Service Learning Project: Loyola University Chicago and Chica...Stacy Neier
Market & Consumer Survey students at Loyola University Chicago partnered with Chicago Fair Trade (CFT) to explore how to launch a fair trade soccer ball product line to generate new revenue streams and increase awareness of the fair trade mission. Initial results from a descriptive survey are presented here representing a 10% response rate with 189 cases of data collected from people who have opted into CFT's email list as well as undergraduate business and communications students. This represents an application of service-learning in the context of a required marketing course to earn a Bachelors of Business Administration. Eighty-two students participated in the project to be renewed in the Fall of 2010.
Fan Engagement: The Role Of Professional Athletes In Your Fan Engagement Stra...Savage Marketing
By Jos Verschueren Founder, IFBI and Pieter Maenhout Managing Partner, 90/24 Sports
It’s really important to understand that Fan Engagement is no ordinary customer relationship and needs to be properly understood if you’re going to put the fan first and stay ahead of the game. We live in a unique time where athletes and their personal branding has become essence in your marketing mix. Use their online presences to create an extra touch point for your organization in conversation with your fans.
How do marketers perceive fan engagement, how do fans and brands benefit from it? AUTHENTICITY, LOYALTY and DIALOGUE are attributes often mentioned.
Build your own opinion and share any best practices with the author.
Anz Stadium Case Study - SeatShare Concept Test - CheckinLineCheckinLine
Outlines the concept test on CheckinLine's new SeatShare concept with ANZ Stadium.
“We’d like to introduce you to a new concept for seating arrangements at ANZ Stadium called SeatShare, where you share a block of premium seating with other fans and only use them for the games you want.
Your SeatShare subscription fee allows you to lock in 2 tickets to a game in the future. CheckinLine will then run an active standby list for each game to allocate the leftover seats not already taken by SeatShare subscribers.
If you want to go to a particular game, you'll request seats for that game and check-in if required (if demand outstrips supply). You will pay a set fee for each seat you use beyond the initial sign-up.”
This test resulted in the rollout of a full SeatShare pilot trial and an increase in seat yield of 48-95% for ANZ Stadium.
The popularity of social media has continued to increase since last year's social media report was released. This highlights the importance of understanding how live event attendees engage with social media and using this information to enhance their live event experiences. This report presents valuable and interesting findings on social media usage and compares this year's findings to those from last year.
In early 2017, Bath City FC asked an independent researcher to carry out research into supporters' hopes and expectations for the newly community-owned club. The purpose was to:
- Encourage supporters, trust members, community shareholders and others to think about what the club means to them, and what they would most like to see in the future
- Help the incoming board develop a “vision and values” statement that would clarify the club’s future direction and guide decision-making
- Make the new community-owned club stronger and more durable by clearly demonstrating how the new board and management are taking into account the views of supporters and the community
Here are the results of research, based on a survey to which 527 people responded, and a focus group of about 15 people. More detail about who took part is given in the presentation.
1. The Spectrum of a Sports Fan
By Talia McGill
MSMK620-603S Marketing Analytics
Bellevue University
2. Hypothesis & Objectives
• Summary
– A survey was conducted to discover the motivations and
behaviors of sports fans.
• Hypothesis
– Consumers who are sports fans are motivated by the idea
of being a part of the team.
• Objectives
– To collect data on how fans watch sports.
– To collect data on how fans use social media to connect
with sports.
– To determine shopping behavior by fans who invest in
sports licensed consumer goods and merchandise.
– To determine behaviors and emotions exhibited by fans.
3. How do fans view their favorite
sports?
83%
13%
21%
44%
52%
4% TV Broadcast
Streaming Service
Radio and/or Podcast
Attend Sporting Events
Watch at a
Bar/Restaurant
Other
% of respondents
4. What are some deciding factors
when going to a sporting event?
5
5
6
10
15
33
43
47
72
72
Win/Loss Record of Team
Other
Concession Prices
Family Tradition
Size of Crowds
Proximity to Venue
Weather
Cost of Travel
Cost of Admission
Personal Schedule
# of respondents
5. How do fans feel when
watching sports?
24
11
24
2 3 5
28
21
22
2
10
19
21
15
13
10
35
27
12
32
22
38
37
36
8
14
12
41
8
6
I need to view/listen
to sports daily
I am a fan of
multiple sports and
view/listen to them
all
I fell I contribute to
my teams' win/loss
when I watch
Sports are better
when watching
with others
I enjoy watching
with fans of the
opposing team
Sports
commentators are
essential to the
viewing/listening
experience
# of respondents
Strongly Disagree Disagree Neutral Agree Strongly Agree
6. Are fans satisfied with the channels
available to view sports?
2%5%
43%
36%
14%
Very Unsatisfied
Unsatisfied
Neutral
Satisfied
Very
Satisfied
% of respondents
7. How many hours do fans spend
watching sports?
5%
9%
16%
70%
16 or More
11-15
6-10
0-5
% of respondents
8. Summary of Objective 1
• Objective
– To collect data on how fans watch sports.
• Results
– Fans spend the majority of their time viewing sports on TV,
at a bar or restaurant or physically attending the event. This
shows that fans want a visual experience.
– Fans will attend sporting events as long as it is affordable
and fits within their schedule.
– Fans enjoy watching and listening to sports but it is not a
necessity.
– If fans are watching sports, they prefer to watch them with
others.
9. Do sports fans use social media?
9%
10%
29%15%
26%
Low Medium-Low
Medium Medium High
High
Usage Rate
% of respondents
67
23
11
1931167
47
19
25
10
Facebook Twitter Snapchat
Instagram Tumblr Reddit
Vine Blogs Pinterest
ESPN Google+ YouTube
Other
Usage Type
# of respondents
10. Do fans create user-generated
content online?
16%
35%
19%
11%
4%
2%
Never Rarely About Half
of the Time
Sometimes Very Often Frequently
%ofrespondents
Frequency of online content
generation
15%
73%
% of respondents who use social
media to interact with sports-related
personalities
Yes No
11. How do sports fans feel about
social media and sports?
15
7
15
11
13
0
33
10
21
13
23
1
18
22
16
24
20
8
10
33
21
31
25
49
4
10 9
3 1
24
I feel connected to
my favorite players
through social media
I post content
because I want
others to know I am
a proud fan
It is important to
have access to my
favorite sports 24/7
Connecting to my
favorite sports teams
through social media
feels personal
I feel a responsibility
to share content
with others to keep
them informed
Fan power can be
spread through
social media
# of respondents
Strongly Disagree Disagree Neutral Agree Strongly Agree
12. Summary of Objective 2
• Objective
– To collect data on how fans use social media to connect
with sports.
• Results
– Sports fans are typically high users of social media and
spend most of that time utilizing Facebook, ESPN and
YouTube.
– While they are active in finding information, they are not as
involved in creating and posting content. When they do,
they believe it adds to their teams’ success.
– The fans do not feel a personal connection with players
through social media.
13. How does the fan spend on
sports merchandise?
2%
2%
12%
17%
18%
19%
20%
30%
76%
Custom Furniture
N/A - I do not purchase
Other
Autographed Memorabilia
Jewelry
Lawn Accessories
Video Games
Kitchenware
Apparel
% of respondents
14. How do fans prefer to purchase
merchandise?
16 15
8
18
12
2 3
13 17
18
10
14
1 1
18 14
16 13
9
4 0
16
15
12 14
12
3
2
8
9
17
11
20
6
3
2 4 2
6 5
52
3
1 0 1 2 2
6
62
0
10
20
30
40
50
60
70
80
Online - Team
Website
Online -
Marketplace
(e.g. Amazon)
Merchandise
Shop at Sporting
Event Venue
Big Box Store
(e.g. Walmart)
Independently
Owned Fan
Shop
Other N/A - I do not
purchase
#ofrespondents
1st Choice 2nd Choice 3rd Choice 4th Choice 5th Choice 6th Choice 7th Choice
15. Who do fans shop for and how
much do they spend?
19%
31%
18%
11%
$50 or less $51-$100 $101-$200 $201 or more
Average Annual Spend
% of respondents
19%
11%
58%
Yourself Others Both
% of respondents
16. Influencers on the sports fans’
purchase decisions.
2
6
3
1 1
2
1
22
0
12
7
2
0
10
0
26
6
28
20
12
10
27
6
16
43
23
34
41
28
27
31
8
23
5
10
18
35
8
36
2
Quality of
product
Quantity of
product
Uniqueness of
product
Product VarietyCost of Product Shipping Time How much you
favor the team
The teams'
win/loss record
# of respondents
Very Unimportant Unimportant Neutral Important Very Important
17. Is pride a reason fans purchase
merchandise?
4%
2%
11%
35%
26%
Strongly Disagree Disagree Neutral Agree Strongly Agree
% of respondents
18. Summary of Objective 3
• Objective
– To determine shopping behavior by fans who invest in sports
licensed consumer goods and merchandise.
• Results
– Almost all sports fans purchase merchandise, particularly apparel.
– Fans prefer to shop at big box stores or online for their sports
merchandise. This is likely because the prices of merchandise in
those stores are lower than at the venue or a small business.
– Fans buy merchandise for themselves and others. The majority will
spend up to $100.
– How much a fan likes a team is very important in their purchase
decision. This is followed closely by cost, variety and quality of
product.
19. What actions do sports fans
commit?
9
9
20
43
52
66
67
71
Crying
Yelling at Fans of the Opposing
Team
Booing the Opponent
Screaming/Yelling at Officials
Consume Alcohol While Watching
Sports
Make Noise by Clapping or
Whistling
Wear Team Colors or Clothing on
Game Day
Cheering
# of respondents
20. Do fans believe in superstition?
25%
54%
Yes No
% of respondents
21. What affects a fan’s happiness?
1
25
18
23
1
41
35
9
0
41
37
43
0
24
17 17
5
7
18
7
0
4
19
43
30
0 0 0
6
4
2
4
37
0 0 0
66
0 0 0
My team is
winning by a
large margin
A player gets
injured and
can't return to
the game
My team does
not make the
playoffs
The officials
make a bad
call
My team wins
the
championship
My team loses
in the final
seconds of the
game
My team
moves to
another city
My teams'
coach gets
fired
# of respondents
Very Unhappy Unhappy Neutral Satisfied Very Satisfied
22. Do fans try and influence others
to be fans?
12%
18%
30%
14%
4%
Strongly Disagree Disagree Neutral Agree Strongly Agree
% of respondents
23. Summary of Objective 4
• Objective
– To determine behaviors and emotions exhibited by fans.
• Results
– In general, fans like to make noise, wear team colors and
consume alcohol while watching or attending sporting
events.
– Fans are happiest when their team wins a championship
and are fairly unhappy with any other outcome.
– Fans are satisfied no matter if they can influence others to
be fans as well
25. Demographics
3%
30% 29%
16%
Less than
$25,000
$25,001 -
$49,000
$50,000 -
$99,999
$100,000 and
above
Annual Household Income
% of respondents
9%
8%
27%
36%
0%
Single
Dating a sports fan
Married to a non-
sports fan
Married to a sports
fan
Dating/married to
someone in the
sports industry
Marital Status
% of respondents
27. Conclusion
• The sports industry has highly involved fans. While
they may not be a fan to be a part of the team,
they value social experiences surrounding sports
activities.
• Marketers will have to continue to find ways to push
fans past content consumption to content
generation. The key will be making the fan feel that
they are having a personal connection with the
team, its players or other well-known sports figures.
• Marketers must also develop strategies to re-create
the fans need to experience sports amongst others
in a social setting through online engagement.
28. Conclusion
• Fans are willing to spend money to support their
team. It is the responsibility of merchandisers to
make the product available, affordable and full of
variety in order to keep purchases flowing. Fans will
pay more for products they believe are unique.
• Since the majority of respondents have a household
income of at least $25,000, it is likely sports are
currently being viewed on cable television in most
homes. Media companies will need to adapt to
changes in consumer media consumption to
address alternatives to cable television.
Follow this link to view this presentation on Slide Share.