
![P a g e | 27
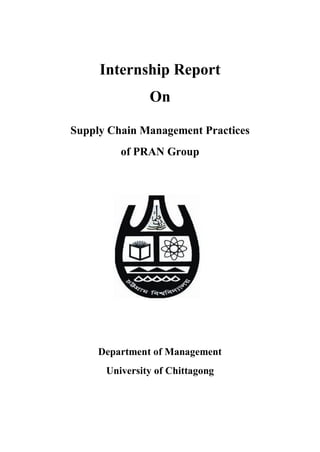
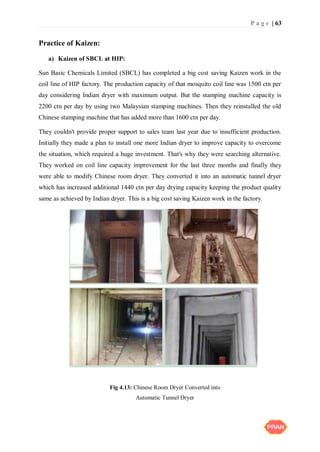
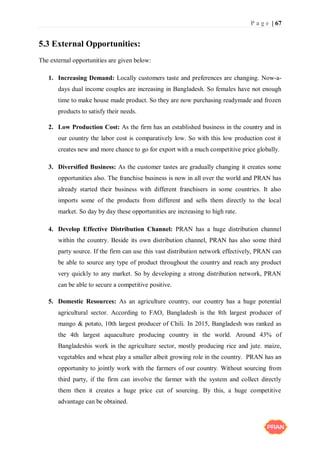
6. Order System and Cycle Time: Placing orders with a supplier should be easy, quick
and effective. Delivery lead time should be short, so that small lot sizes can be ordered
on a frequent basis to reduce inventory holding costs.
7. Capacity: The firm should also consider whether the supplier has the capacity to fill
orders to meet requirements and the ability to fill large orders if needed.
8. Communication Capabilities: Suppliers should also possess a communication
capability that facilities between the parties.
9. Location: Geographical location is another important factor in supplier selection, as it
impacts delivery lead-time, transportation and logistical costs. Some firms require their
suppliers to be located within a certain distance from their facilities.
10. Service: Suppliers must be able to back up their products by providing good services
when needed.
There are numerous other factors – some strategies, other tactical – that a firm must consider
when choosing suppliers. The ability to select competent strategic supplier directly affect
firm’s competitive success.
3.5 Internal Operation:
Internal operation consists of several issues. These are:
Demand Forecasting
Resource Planning System
3.5.1 Demand Forecasting:
Forecasting is only one of three key activities in CPFR [Collaborative Planning, Forecasting
and Replenishment]. Planning is the process of working together to organize and to resolve
key barrier to rapid and effective delivery of goods in the supply chain. Replenishment is the
activity of accomplishing timely, accurate and complete fulfillment between partners in the
supply chain and between distribution centre and selling location. The middle activity,
Forecasting, has to have as its end result a reliable order forecast that the supplier actually
uses to drive acquisition and manufacturing to support on time and complete shipment.](https://image.slidesharecdn.com/mbainternshipreport13302020supervisorscopy-201101175656/85/Supply-Chain-Management-practice-On-PRAN-Group-36-320.jpg)
![P a g e | 50
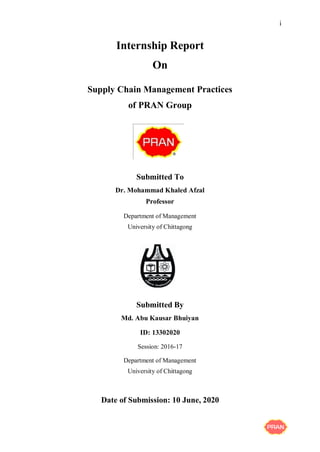
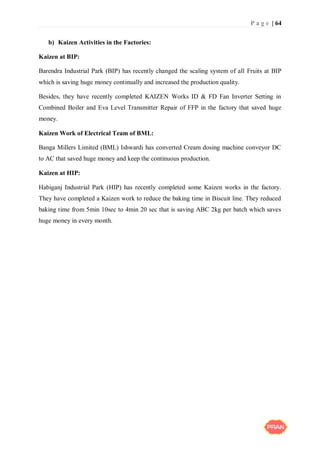
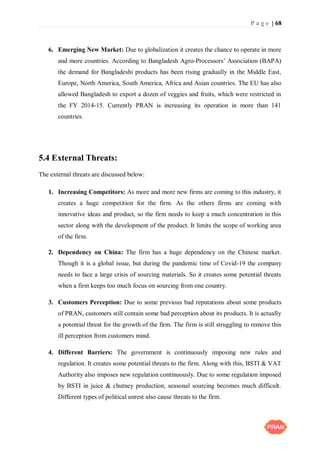
The moisture content of a carton means the ability to resist water. The types and quality of
the paper used to make the carton provides a great effect here. There are different types of
paper used in the packaging sector, among them most commonly used paper are:
Liner Paper - 150 gsm
Media Paper - 120 gsm
Virgin Liner Paper - 300 gsm
Here, gsm means Gram per Square Meter. The denser papers have the ability to resist
moister.
ii. Unit cost of production:
The unit cost of production depends on the cost of materials used in production, that is-
paper, glue, pin, printing, overhead cost etc. Before selecting vendor, the SCM provides the
vendor a unit price for the product and ask the party whether their firm is capable of
providing the carton based this price. If the supplier agrees to give the product on this price,
then the supplier is going to get orders.
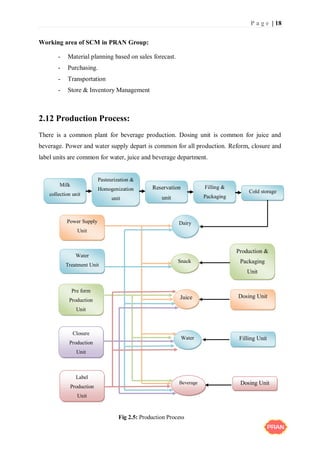
The formula to find out the cost of carton is:
[{(Length + Width + wastage) × (Width + Height + wastage) ÷ 2.54} ÷ 1550] × Carton
Quantity × Price.
Here, 1 inch = 2.54 cm
1 sq. meter = 1550 sq.inch
iii. Capacity of the vendor:
The capacity of a vendor is determined through the machineries they have. Based their
factory status it is calculated that whether the vendor is able to deliver the product on-time in
right quantity and right quality. The basic machines that each of the vendor required is given
below:
a) Corrugation Machine
b) Pesting Machine
c) Die-cutting Machine
d) Stitching Machine](https://image.slidesharecdn.com/mbainternshipreport13302020supervisorscopy-201101175656/85/Supply-Chain-Management-practice-On-PRAN-Group-59-320.jpg)

![P a g e | 74
7.2 References
Agricultural Marketing Co Ltd. (2019). AMCL Annual Report 2018-19. Retrieved from
https://www.amclpran.com/investor.php
Ahsan, A.N.M Emrose. (2018). Evaluating Marketing Strategies of PRAN – RFL Group
[PDF File]. Retrieved from
http://dspace.daffodilvarsity.edu.bd:8080/handle/123456789/2846
Alam, Imtiaz, & Setu, & Adnan, Tarik, & Anindita, Hoque,& Mahadi, Masud, & Mostofa,
Mahrin. (2017). Report On PRAN – RFL Group [PowerPoint slides]. Retrieved from
https://www.slideshare.net/imtiazx1/report-on-pranrfl-group
Amjad Khan–A pioneer in setting new business trend. (2016, July 10). “Daily Sun”.
Retrieved from https://www.daily-sun.com/
Bangladesh Small & Cottage Industries Corporation. (2018, June 27). “THE GUARDIAN”
Retrieved from http://www.theguardianbd.com/
Chopra, S., & Meindl, P. (2013). Supply Chain Management Strategy, Planning & Operation
(3rd
ed.) New Jersey : Pearson
Christopher, M. (2011). Logistics & Supply Chain Management (4th
ed.). London: Pearson
Essays, UK. (November 2018). Role Of Distribution In Supply Chain Information
Technology Essay. Retrieved from https://www.ukessays.com/essays/information-
technology/role-of-distribution-in-supply-chain-information-technology-
essay.php?vref=1
Export of agro-products rises 53pc in nine months. (2019, April 28), “RMG Bangladesh”.
Retrieved from https://rmgbd.net/
Faiz, M. Shahryar, & Haque, Md. Asrarul, & Kabir, Mohammad Rehan, & Rahman, Tajkera,
& Sakib, Md. Nazmus, & Ashik, Asaduzzaman, & Laizu, Farzana Hossain. (2018).](https://image.slidesharecdn.com/mbainternshipreport13302020supervisorscopy-201101175656/85/Supply-Chain-Management-practice-On-PRAN-Group-83-320.jpg)
![P a g e | 75
FMCG Industry Review of Bangladesh [PDF File]. Retrieved from
https://databd.co/resources/fmcg-industry-review-of-bangladesh
Hossain, Md. Amzad, & Ahmed, Rifat, & Shawon, Azizur Rohman, & Islam, Md. Tarikul, &
Jahid, Inamul Haque, & Islam, Rashedul. (2018). Overall Marketing Strategies of
PRAN – RFL GROUP. [PowerPoint sildes] Retrieved from
https://www.slideshare.net/amzadhossainfbd95/overall-marketing-strategies-of-
pranrfl-group
Hossain, Zahid. (2015). The Marketing Plan Of PRAN Drinks. [PowerPoint slides] Retrieved
from https://www.slideshare.net/Zahid541/pran-55697293
Innovision Consulting Private Limited. (2016). Study on the Roles and Opportunities for
Private Sector in Agro-food Processing Industry of Bangladesh. [PDF File] Retrieved
from http://katalyst.com.bd/wp-content/uploads/2017/01/Roles-and-Opportunities-
for-Private-Sector-in-Agro-food-Processing-Industry-of-Bangladesh.pdf
Mukit, Md. Mushfiqul Haque, & Ferdous, Arafa, & Ahmed, Mahfuz. (2012). Term Paper On
Management Function In PRAN. [PowerPoint slides] Retrieved from
https://www.slideshare.net/MushfiqMukit1/pran-rfl-term-paper-by-mushfiqul-haque-
mukit
PRAN GROUP. (2020, April). Kaizen Activities in the Factories. PRAN – MESSAGE A
Corporate Publication of PRAN GROUP, 41, 45-46.
Rahman, Maksudur. (2017). Entry Strategy of PRAN company into overseas counties: A
study on Drinks, Bakery and confectionary items. Retrieved from
https://maksudurrahmanblog.wordpress.com/2017/08/05/my-assignment-about-pran-
company-jagannath-university-global-marketing-how-to-entry-global-market/
Rahman, Ziaur. (2015). Term Paper On Financial Performance Analysis Of PRAN [PDF
File]. Retrieved from](https://image.slidesharecdn.com/mbainternshipreport13302020supervisorscopy-201101175656/85/Supply-Chain-Management-practice-On-PRAN-Group-84-320.jpg)
![P a g e | 76
https://www.academia.edu/22501773/Term_Paper_On_Financial_Performance_Anal
ysis_Of_PRAN
Rose, Regan. (2013). Organizational Structure of PRAN Group Retrieved from
https://www.lawyersnjurists.com/article/organizational-structure-pran-group/
Sakif & Ifti & Imam. (2012). An Assignment on PRAN – RFL Group A RISING MARKET
GIANT of BANGLADESH. [PDF File]. Retrieved from
https://www.academia.edu/11539891/13717552966_BUS_101_Term_paper_on_PRA
N-RFL_Group
Wisner, J. D., Tan, K. C., & Leong, G. K. (2012). Principles of Supply Chain Management –
A Balanced Approach (3rd
ed.) USA: South – Western Cengage Learning.](https://image.slidesharecdn.com/mbainternshipreport13302020supervisorscopy-201101175656/85/Supply-Chain-Management-practice-On-PRAN-Group-85-320.jpg)

This internship report details the supply chain management practices of Pran Group, based on an 8-week attachment with the company. It covers various aspects such as sourcing, supplier selection, payment processes, distribution strategies, and the challenges faced by the organization, combined with recommendations for improvement. The study also includes a SWOT analysis and is grounded in both primary and secondary data sources.


