Download to read offline
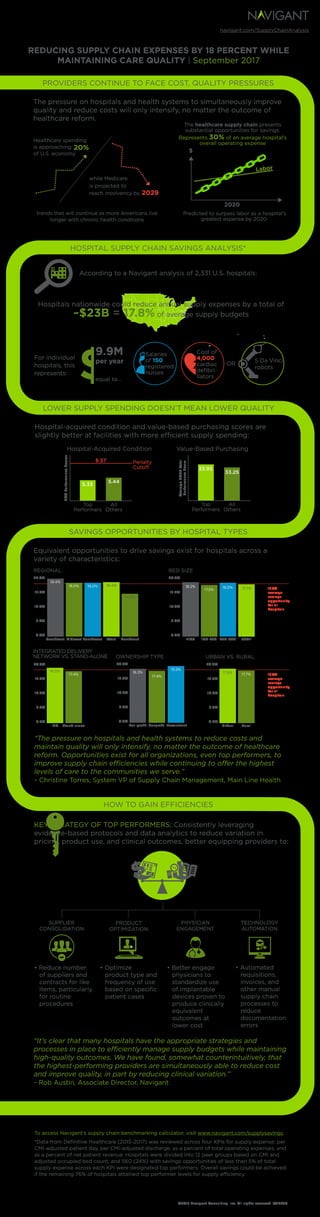

Hospitals have an average opportunity to reduce supply chain expenses by 17.8%, equating to approximately $23 billion in total potential savings. The pressure to enhance care quality while lowering costs will continue to grow, necessitating streamlined supply chain efficiencies across various hospital types. Implementing strategies such as supplier consolidation, product optimization, and technology automation can help improve performance and cost-effectiveness in healthcare settings.


