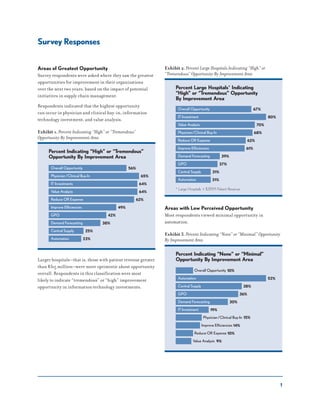
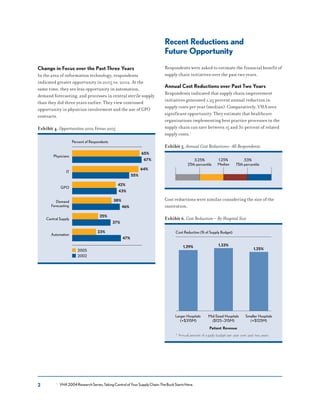
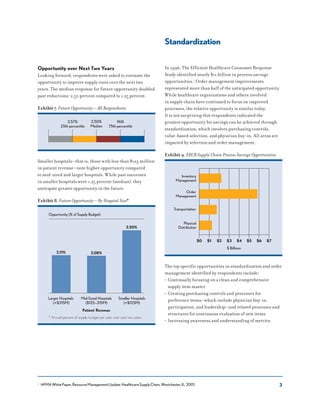
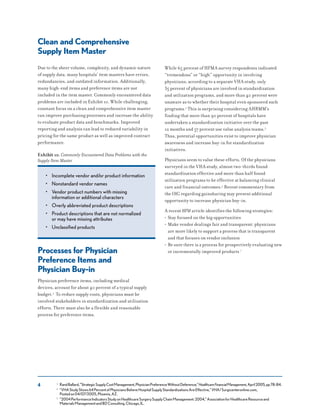
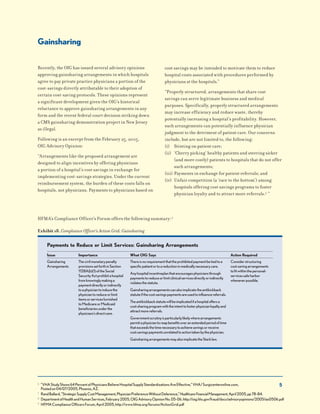
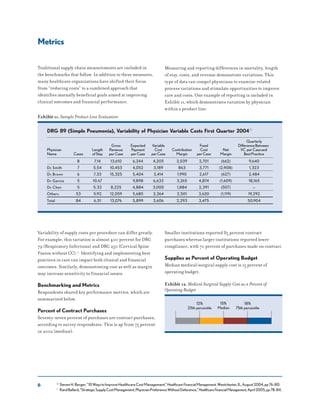
Synopsis
This paper summarizes benchmarking metrics
and industry perceptions based on HFMA’s 2005
Supply Chain Benchmarking Survey.
Sponsored through an educational
grant by McKesson
HFMA’s 2005
Supply Chain
Benchmarking Survey
Managing Resources to
Achieve Improved
Economic Outcomes and
High-Quality Care
healthcare financial management association
July 2005
Summary
Background
A growing number of environmental concerns have
led to increased focus on the healthcare supply chain: a
growing uninsured population, labor shortages and costs,
reimbursement and payer trends, challenges related to
reimbursement for new treatments and technologies,
and escalating utilization. Progressive materials and
purchasing leaders are succeeding in aligning economic
interests with those of physicians and clinicians, and
achieving targeted expense reduction. But to make more
significant progress in this area, organizations must lift
systemic barriers and align goals to maximize supply chain
effectiveness. Fortunately, the effectiveness of supply chain
operations has assumed a higher priority among senior-
level management. As a result of this increased attention,
the role supply chain leaders play in the success of an
organization has become more recognized and respected.
This paper highlights findings of HFMA’s 2005 Supply
Chain Survey, made possible through an educational grant
by McKesson. Based on the feedback of 225 respondents,
the study identified recent successes, future opportunities,
and benchmarking metrics; it also includes specific
examples of respondents’ successes. Furthermore, recent
OIG commentary on gainsharing is highlighted in order to
present potential opportunities to align incentives and thus
increase physician buy-in.
The survey builds on the findings of a 2002 study, which
delineated the state of supply chain management and
identified best practices. Made possible by an educational
grant from McKesson, the 2002 study provided the
perspectives of 600 financial executives and supply
chain leaders (www.hfma.org/FeaturedTopic/resource_
management.htm).
This paper also compares the findings from the 2005
survey to findings from 2002.
Respondents indicated that supply chain initiatives
reduced their supply chain budget by 1.25 percent per
year over the past two years (median). Looking forward,
respondents estimate twice as much opportunity to
improve supply savings.
Top opportunities exist in physician and clinical buy-in,
information technology investments, and value analysis.
Developing buy-in was the most prominent concern, with
many respondents indicating that true collaboration
is essential for success. Investments in information
technology were noted to provide more significant
opportunities in the 2005 survey compared to 2002 results.
At the same time, 2005 respondents found significantly
fewer opportunities in automation compared to 2002.
The leading opportunities in standardization and order
management include clean and comprehensive supply
item master, purchasing controls/processes/structure
for preference items, and cultivating awareness and
understanding of metrics.
The survey’s findings reveal that although almost all
hospitals have undertaken a standardization initiative
and most are using value analysis teams, physicians
possess relatively low awareness of these initiatives. The
study also highlights examples of clinical and financial
outcome variations by product line and by physician as a
way to encourage physician involvement in identifying best
practices.
Overview
1
Areas of Greatest Opportunity
Survey respondents were asked where they saw the greatest
opportunities for improvement in their organizations
over the next two years, based on the impact of potential
initiatives in supply chain management.
Respondents indicated that the highest opportunity
can occur in physician and clinical buy-in, information
technology investment, and value analysis.
Exhibit 1. Percent Indicating “High” or “Tremendous”
Opportunity By Improvement Area
Percent Indicating “High” or “Tremendous”
Opportunity By Improvement Area
Overall Opportunity 56%
Physician/Clinical Buy-In 65%
IT Investments 64%
Value Analysis 64%
Reduce OR Expense 62%
Improve Efficiencies 49%
GPO 42%
Demand Forecasting 38%
Central Supply 25%
Automation 23%
Larger hospitals—that is, those with patient revenue greater
than $315 million—were more optimistic about opportunity
overall. Respondents in this classification were most
likely to indicate “tremendous” or “high” improvement
opportunity in information technology investments.
Exhibit 2. Percent Large Hospitals Indicating “High” or
“Tremendous” Opportunity By Improvement Area
* Large Hospitals > $315M Patient Revenue
Percent Large Hospitals* Indicating
“High” or “Tremendous” Opportunity
By Improvement Area
Overall Opportunity 67%
IT Investment 80%
Value Analysis 70%
Physician/Clinical Buy-In 68%
Reduce OR Expense 62%
Improve Efficiencies 61%
Demand Forecasting 39%
GPO 37%
Central Supply 31%
Automation 31%
Areas with Low Perceived Opportunity
Most respondents viewed minimal opportunity in
automation.
Exhibit 3. Percent Indicating “None” or “Minimal” Opportunity
By Improvement Area
Percent Indicating “None” or “Minimal”
Opportunity By Improvement Area
Overall Opportunity 10%
Automation 52%
Central Supply 38%
GPO 36%
Demand Forecasting 30%
IT Investment 19%
Physician/Clinical Buy-In 15%
Improve Efficiencies 14%
Reduce OR Expense 10%
Value Analysis 9%
Survey Responses
2
Change in Focus over the Past Three Years
In the area of information technology, respondents
indicated greater opportunity in 2005 vs. 2002. At the
same time, they see less opportunity in automation,
demand forecasting, and processes in central sterile supply
than they did three years earlier. They view continued
opportunity in physician involvement and the use of GPO
contracts.
Exhibit 4. Opportunities 2002 Versus 2005
Percent of Respondents
65%
67%
Physicians
64%
55%
IT
42%
43%
GPO
38%
46%
Demand
Forecasting
25%
37%
Central Supply
23%
47%
Automation
2005
2002
Recent Reductions and
Future Opportunity
Respondents were asked to estimate the financial benefit of
supply chain initiatives over the past two years.
Annual Cost Reductions over Past Two Years
Respondents indicated that supply chain improvement
initiatives generated 1.25 percent annual reduction in
supply costs per year (median). Comparatively, VHA sees
significant opportunity. They estimate that healthcare
organizations implementing best practice processes in the
supply chain can save between 15 and 30 percent of related
supply costs.1
Exhibit 5. Annual Cost Reductions- All Respondents
3.25%
25th percentile
1.25%
Median
.53%
75th percentile
Cost reductions were similar considering the size of the
institution.
Exhibit 6. Cost Reduction – By Hospital Size
Cost Reduction (% of Supply Budget)
1.29% 1.33%
1.25%
Larger Hospitals
(>$315M)
Mid-Sized Hospitals
($125–315M)
Patient Revenue
Smaller Hospitals
(<$125M)
* Annual percent of supply budget per year over past two years.
1 VHA2004ResearchSeries,TakingControlofYourSupplyChain:TheBuckStartsHere.
3
Opportunity over Next Two Years
Looking forward, respondents were asked to estimate the
opportunity to improve supply costs over the next two
years. The median response for future opportunity doubled
past reductions: 2.50 percent compared to 1.25 percent.
Exhibit 7. Future Opportunity – All Respondents
3.57%
25th percentile
2.50%
Median
.96%
75th percentile
Smaller hospitals—that is, those with less than $125 million
in patient revenue—note higher opportunity compared
to mid-sized and larger hospitals. While past successes
in smaller hospitals were 1.25 percent (median), they
anticipate greater opportunity in the future.
Exhibit 8. Future Opportunity – By Hospital Size*
Opportunity (% of Supply Budget)
2.11% 2.08%
3.50%
Larger Hospitals
(>$315M)
Mid-Sized Hospitals
($125–315M)
Patient Revenue
Smaller Hospitals
(<$125M)
* Annual percent of supply budget per year over next two years.
Standardization
In 1996, The Efficient Healthcare Consumer Response
Study identified nearly $11 billion in process savings
opportunities.2 Order management improvements
represented more than half of the anticipated opportunity.
While healthcare organizations and others involved
in supply chain have continued to focus on improved
processes, the relative opportunity is similar today.
It is not surprising that respondents indicated the
greatest opportunity for savings can be achieved through
standardization, which involves purchasing controls,
value-based selection, and physician buy-in. All areas are
impacted by selection and order management.
Exhibit 9. EHCR Supply Chain Process Savings Opportunities
$ Billions
$0 $1 $2 $3 $4 $5 $6 $7
Transportation
Physical
Distribution
Inventory
Management
Order
Management
The top specific opportunities in standardization and order
management identified by respondents include:
• Continually focusing on a clean and comprehensive
supply item master
• Creating purchasing controls and processes for
preference items—which include physician buy-in,
participation, and leadership—and related processes and
structures for continuous evaluation of new items
• Increasing awareness and understanding of metrics
2 HFMAWhitePaper,ResourceManagementUpdate:HealthcareSupplyChain,Westchester,IL,2001.
4
Clean and Comprehensive
Supply Item Master
Due to the sheer volume, complexity, and dynamic nature
of supply data, many hospitals’ item masters have errors,
redundancies, and outdated information. Additionally,
many high-end items and preference items are not
included in the item master. Commonly encountered data
problems are included in Exhibit 10. While challenging,
constant focus on a clean and comprehensive item master
can improve purchasing processes and increase the ability
to evaluate product data and benchmarks. Improved
reporting and analysis can lead to reduced variability in
pricing for the same product as well as improved contract
performance.
Exhibit 10. Commonly Encountered Data Problems with the
Supply Item Master
• Incomplete vendor and/or product information
• Nonstandard vendor names
• Vendor product numbers with missing
information or additional characters
• Overly abbreviated product descriptions
• Product descriptions that are not normalized
or may have missing attributes
• Unclassified products
Processes for Physician
Preference Items and
Physician Buy-in
Physician preference items, including medical
devices, account for about 40 percent of a typical supply
budget.3 To reduce supply costs, physicians must be
involved stakeholders in standardization and utilization
efforts. There must also be a flexible and reasonable
process for preference items.
While 65 percent of HFMA survey respondents indicated
“tremendous” or “high” opportunity in involving
physicians, according to a separate VHA study, only
35 percent of physicians are involved in standardization
and utilization programs, and more than 40 percent were
unaware as to whether their hospital even sponsored such
programs.4 This is surprising considering AHRMM’s
finding that more than 90 percent of hospitals have
undertaken a standardization initiative over the past
12 months and 57 percent use value analysis teams.5
Thus, potential opportunities exist to improve physician
awareness and increase buy-in for standardization
initiatives.
Physicians seem to value these efforts. Of the physicians
surveyed in the VHA study, almost two-thirds found
standardization effective and more than half found
utilization programs to be effective at balancing clinical
care and financial outcomes.6 Recent commentary from
the OIG regarding gainsharing may present additional
opportunity to increase physician buy-in.
A recent HFM article identifies the following strategies:
• Stay focused on the big opportunities
• Make vendor dealings fair and transparent: physicians
are more likely to support a process that is transparent
and that focuses on vendor inclusion
• Be sure there is a process for prospectively evaluating new
or incrementally improved products 7
3 RandBallard,“StrategicSupplyCostManagement,PhysicianPreferenceWithoutDeference,”HealthcareFinancialManagement,April2005,pp78-84.
4 “VHAStudyShows64PercentofPhysiciansBelieveHospitalSupplyStandardizationsAreEffective,”VHA/Surgicenteronline.com,
Postedon04/07/2005,Phoenix,AZ.
5 “2004PerformanceIndicatorsStudyonHealthcareSurgerySupplyChainManagement:2004,”AssociationforHealthcareResourceand
MaterialsManagementandBDConsulting.Chicago,IL.
5
Gainsharing
Recently, the OIG has issued several advisory opinions
approving gainsharing arrangements in which hospitals
agree to pay private practice physicians a portion of the
cost-savings directly attributable to their adoption of
certain cost-saving protocols. These opinions represent
a significant development given the OIG’s historical
reluctance to approve gainsharing arrangements in any
form and the recent federal court decision striking down
a CMS gainsharing demonstration project in New Jersey
as illegal.
Following is an excerpt from the February 25, 2005,
OIG Advisory Opinion:
“Arrangements like the proposed arrangement are
designed to align incentives by offering physicians
a portion of a hospital’s cost savings in exchange for
implementing cost-savings strategies. Under the current
reimbursement system, the burden of these costs falls on
hospitals, not physicians. Payments to physicians based on
cost savings may be intended to motivate them to reduce
hospital costs associated with procedures performed by
physicians at the hospitals.”
“Properly structured, arrangements that share cost
savings can serve legitimate business and medical
purposes. Specifically, properly structured arrangements
may increase efficiency and reduce waste, thereby
potentially increasing a hospital’s profitability. However,
such arrangements can potentially influence physician
judgment to the detriment of patient care. Our concerns
include, but are not limited to, the following:
(i) Stinting on patient care;
(ii) ‘Cherry picking’ healthy patients and steering sicker
(and more costly) patients to hospitals that do not offer
such arrangements;
(iii) Payments in exchange for patient referrals; and
(iv) Unfair competition (a ‘race to the bottom’) among
hospitals offering cost savings programs to foster
physician loyalty and to attract more referrals.8 ”
HFMA’s Compliance Officer’s Forum offers the following summary:9
Exhibit 18. Compliance Officer’s Action Grid: Gainsharing
Issue Importance What OIG Says Action Required
Gainsharing
Arrangements
Thecivilmonetarypenalty
provisionssetforthinSection
1128A(b)(1)oftheSocial
SecurityActprohibitahospital
fromknowinglymakinga
paymentdirectlyorindirectly
toaphysiciantoinducethe
physiciantoreduceorlimit
itemsorservicesfurnished
toMedicareorMedicaid
beneficiariesunderthe
physicians’sdirectcare.
Thereisnorequirementthattheprohibitedpaymentbetiedtoa
specificpatientortoareductioninmedicallynecessarycare.
Anyhospitalincentiveplanthatencouragesphysiciansthrough
paymentstoreduceorlimitclinicalservicesdirectlyorindirectly
violatesthestatute.
Gainsharingarrangementscanalsoimplicatetheantikickback
statuteifthecost-savingspaymentsareusedtoinfluencereferrals.
Theantikickbackstatutewillbeimplicatedifahospitaloffersa
cost-sharingprogramwiththeintenttofosterphysicianloyaltyand
attractmorereferrals.
Governmentscrutinyisparticularlylikelywherearrangements
permitaphysiciantoreapbenefitsoveranextendedperiodoftime
thatexceedsthetimenecessarytoachievesavingsorreceive
cost-savingspaymentsunrelatedtoactiontakenbythephysician.
GainsharingarrangementsmayalsoimplicatetheStarklaw.
Considerstructuring
cost-savingarrangements
tofitwithinthepersonal-
servicessafeharbor
wheneverpossible.
Payments to Reduce or Limit Services: Gainsharing Arrangements
6 “VHAStudyShows64PercentofPhysiciansBelieveHospitalSupplyStandardizationsAreEffective,”VHA/Surgicenteronline.com,
Postedon04/07/2005,Phoenix,AZ.
7 RandBallard,“StrategicSupplyCostManagement,PhysicianPreferenceWithoutDeference,”HealthcareFinancialManagement,April2005,pp78-84.
8 DepartmentofHealthandHumanServices,February2005,OIGAdvisoryOpinionNo.05-06.http://oig.hhs.gov/fraud/docs/advisoryopinions/2005/ao0506.pdf
9 HFMAComplianceOfficersForum,April2005,http://www.hfma.org/forums/ActionGrid.pdf
6
Metrics
Traditional supply chain measurements are included in
the benchmarks that follow. In addition to these measures,
many healthcare organizations have shifted their focus
from “reducing costs” to a combined approach that
identifies mutually beneficial goals aimed at improving
clinical outcomes and financial performance.
Exhibit 11. Sample Product Line Evaluation
Quarterly
Gross Expected Variable Fixed DifferenceBetween
Physician Length Revenue Payment Cost Contribution Cost Net VC perCaseand
Name Cases ofStay perCase perCase perCase Margin perCase Margin BestPractice
8 7.14 13,610 6,244 4,205 2,039 2,701 (662) 9,640
Dr. Smith 7 5.54 10,453 4,052 3,189 863 3,771 (2,908) 1,323
Dr. Brown 6 7.33 15,325 5,404 3,414 1,990 2,617 (627) 2,484
Dr. Garcia 5 10.67 9,898 6,633 3,265 4,874 (1,609) 18,165
Dr. Chen 5 5.33 8,225 4,884 3,000 1,884 2,391 (507) —
Others 53 5.92 12,059 5,685 3,364 2,501 3,620 (1,119) 19,292
Total 84 6.51 13,076 5,899 3,606 2,293 3,475 50,904
DRG 89 (Simple Pneumonia), Variability of Physician Variable Costs First Quarter 200410
Smaller institutions reported 85 percent contract
purchases whereas larger institutions reported lower
compliance, with 70 percent of purchases made on contract.
Supplies as Percent of Operating Budget
Median medical/surgical supply cost is 15 percent of
operating budget.
Exhibit 12. Medical Surgical Supply Cost as a Percent of
Operating Budget
12%
25th percentile
15%
Median
18%
75th percentile
Measuring and reporting differences in mortality, length
of stay, costs, and revenue demonstrate variations. This
type of data can compel physicians to examine related
process variations and stimulate opportunities to improve
care and costs. One example of reporting is included in
Exhibit 11, which demonstrates variation by physician
within a product line.
Variability of supply costs per procedure can differ greatly.
For example, this variation is almost 400 percent for DRG
79 (Respiratory Infections) and DRG 250 (Cervical Spine
Fusion without CC).11 Identifying and implementing best
practices in care can impact both clinical and financial
outcomes. Similarly, demonstrating cost as well as margin
may increase sensitivity to financial issues.
Benchmarking and Metrics
Respondents shared key performance metrics, which are
summarized below.
Percent of Contract Purchases
Seventy-seven percent of purchases are contract purchases,
according to survey respondents. This is up from 75 percent
in 2002 (median).
10 StevenH.Berger,“10WaystoImproveHealthcareCostManagement,”HealthcareFinancialManagement,Westchester,IL,August2004,pp76-80.
1 1 RandBallard,“StrategicSupplyCostManagement,PhysicianPreferenceWithoutDeference,”HealthcareFinancialManagement,April2005,pp78-84.
7
Larger hospitals indicated that medical/surgical supplies
represented a higher percentage of their operating budgets.
Exhibit 13. Supplies as a Percent of Operating Budget
13% 13%
15%
Small
(<$35M)
Mid-Sized/
Small
($35–125M)
Mid-Sized
($125–315M)
17%
Large
(>$315M)
Exhibit 14. Supply Expense per Adjusted Patient Day
25th 75th
Percentile Median Percentile
All $194 $259 $326
>$314M 244 315 369
$125–$315M 243 271 301
<$125M 140 196 244
Rural 164 211 298
Exhibit 15. Supply Expense per Adjusted Discharge
25th 75th
Percentile Median Percentile
AllRespondents $769 $1,014 $1,299
>$315M 1,114 1,360 1,601
$125–$315M 933 1,198 1,211
<$125M 459 669 883
Rural 594 818 1,198
Rural<$125M 581 766 905
Exhibit 16. Pharmaceutical Expense per Adjusted Patient Day
25th 75th
Percentile Median Percentile
All 46.2 $51.5 $97.5
>$325M 52.9 66.2 52.9
$125–$325M 47.6 49.7 51.6
<$125M 45.6 50.5 101.5
Significant variation in response
Exhibit 17. Pharmaceutical Expense per Adjusted Discharge
25th 75th
Percentile Median Percentile
All $182.8 $216.5 $280.3
>$315M 214.2 272 401.4
$125–$315M 184.3 213.9 238.0
<$315M 122.6 186.1 238.0
Significant variation in response
8
Metrics Viewpoint
Jamie C. Kowalski, MBA
Vice President, Practice & Market Development
McKesson Provider Technologies
Wheeling, Illinois
Supply chain management has many important and
interdependent components, which have been described
in these survey results. Specific, selected measures
provide data that can help drive decisions, identify areas
of vulnerability, and determine the overall effectiveness of
supply chain operations. Therefore, despite executive calls
for a single metric for measuring supply chain management
performance, distilling these components into one metric
is not beneficial.
The metrics selected by an organization should be
meaningful to all stakeholders (executives, customers,
supply chain team), measurable (preferably via
automation), and manageable (able to help the team make
changes that will improve performance). Furthermore,
such metrics must track all outcomes of the supply chain:
service/customer satisfaction, quality/effectiveness,
resource productivity/efficiency, and financial results.
Benchmarks can be synonymous with best practices, or
lead to them. They can be based on internal levels (for
example, one patient care unit has achieved inventory turns
of 33 times per year; all patient care units are expected to
achieve that) and/or external sources (a hospital/IDN in
the peer group has achieved supply expense as a percentage
of total hospital operating expense of 14.3 percent). But
caution is required when using “national benchmarks”
because ensuring that the metrics are actually reporting
and measuring the same items, in the same manner, may
be impossible.
What is most important is to continue striving for
improvement to reach best practice levels of performance.
Throughout that process, organizations must be sure to
recognize and celebrate positive performance. But at the
same time, caution should be exercised about intensity
and timing. If the pace is too slow, it will be difficult to
reach and maintain momentum. This can lead to morale
problems, but even worse, can be quite costly to the
organization from a financial perspective. For example,
if the goal is to reduce annual operating expenses by
$1 million through supply spending, every month that the
target level is not achieved costs the organization $83,000
that could have been avoided. Thus, a bit of impatience can
be a good thing.
Best practices in the use of metrics include:
• Support from senior executives (CEO, CFO, CNO,
etc.), including providing attention and coaching, and
developing accountability for staff roles
• Supply chain management metrics that cover the scope
of the supply chain (see Exhibit below); each major
component can and should be measured
• Metrics that are customized for, reported to, and tracked
by all stakeholders: executives, customers, supply chain
leaders, and team
• Appropriate measurement of performance at the
individual employee level (e.g., productivity, quality)
• Recognition, rewards, and as indicated, sanctions
• Accountability for performance at the point of control—
For example, if a service department fails to reduce supply
spending or exceeds supply budgets, holding the supply
chain leader and team accountable is not appropriate,
unless the products used by that department are being
purchased for noncompetitive prices. Consumption is
the responsibility of the consumer.
9
Examples of Supply Chain Metrics are shown below:
Area Metric Comment
Financial SupplyExpenseas%of
TotalOperatingExpense
Indicatoroftheimpactofsupplyoptimization:supplycostsshoulddrop atagreaterrate
thanoverall costs.Alsoprovidesassurance thatsupplystandardization does not increase
costsinotherareas.
SupplyExpenseperAdjusted
PatientDay
Mostcommonlyusedsupplychainindicatorformeasuringcost.
SupplyExpense per AdjustedDischarge Can track/trend costvariationacrosspatient types and severity
BestSystem Price Pricemanagementtoensurelowestavailable price ispaidwithinyourhealthcareenterprise
BestMarketPrice Pricemanagementtoensurelowestavailable price ispaidwithinyourmarket
Pricing Variance Constantpricing changes can have a detrimental effectonassuringbestprice
Non-contractspend–$ MeasurescompliancewithpurchasesthroughaGPOcontract
Off tierlossestotal $ Measureoflossesasa resultofnot achieving tierlevels
Non consolidatedtierlosses Measure oflossesasa resultofnot achieving tierlevels
Lossdue tovendorselection Dollars associatedwithoff contractpurchases
ItemStandardizationRebateLoss Dollarlostasaresultofnotmeetingrebatethresholdsbyproductcategory
VendorStandardizationRebateLoss Dollars lostata resultofnot meeting rebatethresholds atthe vendorlevel
On-hand Inventory Value Measures how muchcashistiedupininventory and unavailable for other uses
Value ofConsignmentInventory Tracks the value ofconsigned inventory;important tomonitor vendormanagement
Outcomes Priceinflationindex(marketbasket)
Costper PO Productivitymeaure; efficient managementofordersshouldresultinlower costper PO
AccountsPayable$onholdpending
invoicediscrepancyresolution
Potential for lostrevenue increases;timespent onresolving discrepancies results in
highermanagementcosts
% purchases without invoice discrepancies Measuresthe results ofinvoicing practices
AvailableRebatesnotcollected(TBD) Measuresresultsofeffectiverebatemanagement
GPOholdbacks
Numberofvendors used Measuresthe results ofvendorstandardization; the fewer the vendors,the morelikely
totakeadvantageofvolumepurchasesandrebates
NumberofOrtho used Measuresthe resutls ofOrtho vendorstandardization
NumberofCardioused Measuresthe results ofCardiologyvendorstandardization
RebateIndex Indicatoroftheresultsofcontractcomplianceeffortsandtierachievements
Stock-outs Measure ofthe results ofmanaging PAR levelsand stockingprotocols
Throughput POLinesperpaidhour Monitorstheefficiencyofsupplydistribution
DistributionLinesPicked
perpaidhour
Monitorsthetimelydistributionandstockingofsupplieswithinthe organization
Inventory Turns Ameasure ofaccuratestockingand PAR levelsand helps toreducecarriedinventories.
Mosteffectivewhentrackedattheproductcategorylevel.
Volumeand
Capacity
Requisitionsprocessedelectronically Tracksthevolumeofrequisitionsprocessedandtheeffectivesofe-supplymanagement
% purchasetransactions via “e-commerce” Tracksthe volumeofrequisitions processed electronicallycomparedtototal transactions
Noncontract as% oftotal spend Monitors the rateofpurchases thatoccur froma noncontract vendor; increases in
noncontractmayindicatenewproductsorroguebuying
Non-compliantpurchase Monitorsthedollarsassociatedwithnoncontractpurchases
LOCActivation
LOCActivation%
Total Inventory $/Average
PatientDays
% ofConsignment Inventory High dollar, complex products, suchasimplantsand orthopedics require significant
investmenttostock inaninstitution. Consignmenthelps withinventory management
butmustbemonitoredforreimbursementandproductavailability.
10
When asked to describe recent projects that have led to the
greatest improvements, respondents most frequently cited
the following:
• GPO utilization and pricing
• Centralization of supply chain functions
• Investments and utilization of information technology
• Revising structure, adding staffing, developing teams
• Increasing value based selection
• Revising and standardizing item master
• Developing physician/clinical buy-in
• Developing reporting and metrics
Successes Achieved
GPO utilization and pricing
“We reviewed all contracts and suppliers used in the past
18 months to improve efficiencies and identify cost savings
through GPO contracts. Reduced overall supply costs by
approximately 10 percent.”
—Mid-sized Hospital Respondent
“Reduced contract pricing for orthotics. Continue to review
make-up of packs and alter components as required.”
—Mid-sized Hospital Respondent
“We re-bid services to bring down cost of telephone and
other services. Continued standardization of supplies. We
have a committee to limit the number of companies we
work with. This increases the volume at each company and
leads to better pricing.”
— Mid-sized Hospital Respondent
“Negotiating a new contract on urinary stents. Should
save us 30 percent. Also, going to consignment on cardiac
stents. Previously we purchased in bulk in order to get
a reduced price. Didn’t prove successful, so we went to
consignment.”
—Small Hospital Respondent
“Use of online requisitions tied into our MMIS system.
User sees items they need, materials management
doesn’t need to re-enter information. Non-stock items
automatically produce PO’s.”
— Mid-sized Hospital Respondent
Revision and standardization of the item master
“We undertook a formal 18-month Strategic Sourcing
engagement that has involved 17 cross-functional teams
to examine and improve our spending in clinical and
non-clinical categories. We looked at about $300 million
in spending and produced over 28 million in documented
annualized savings. It also has changed the way our
organization views the role of procurement and strategic
sourcing.”
— Hospital Respondent
Centralization of supply chain functions
“Materials management staff has taken over distribution of
I.V. tubing from the pharmacy. This removes one ‘hand-off’
in the process. Savings are not yet determined. Materials
management took over the ordering and stocking of the OR
department. This reduced overstocking and improved lines
of communication reducing overall inventory.”
— Hospital Respondent
“We migrated our purchasing and A/P functions to a
centralized supply chain environment in March 2001. At
this point, the operation is working very well. Chain in top
leadership went from last to first in customer satisfaction
in 15 months.”
—Mid-sized Hospital Respondent
“Identified supply chain manager for operational oversight
of purchase order throughput, receiving dock flows, charge
capture of various floor stock/patient charge items and
floor stocking/ordering. We call him our control tower
manager, having impact of all facets of supply chain status.
Priceless—from user satisfaction and elimination of
‘surprise situations’.”
— Hospital Respondent
Information technology projects
“We installed perpetual inventory this has improved
control on supply use and charge capture.”
“Installed automated replenishment system in CSD.
Reduced inventory by 30 percent by eliminating
duplicating inventory in storeroom and on exchange carts.”
—Mid-sized Hospital Respondent
In Your Words…What’s Worked, What Hasn’t?
11
“Installation of automated purchasing/inventory system
two years ago. Began value analysis within purchasing
and materials assessment and accountability for waste
compliance within our purchasing contracts.”
—Large Hospital Respondent
“Improved automation of managed care authorizations
process. Contractual allowances for unauthorized services
denials have decreased dramatically.”
—Mid-sized Hospital
Restructuring, adding staff, or developing teams
“We have an MM team, composed of MM, clinical, and
financial personnel. Our first project was to review in
depth the MM item list. As a result of this, we identified a
number of items that were obsolete and we have developed
a standardized process of ‘naming’ so we know what we are
talking about.”
—Large Hospital Respondent
“Development of director of Inventory Management
program. Reduced imaging supply costs by 25 percent .”
—Mid-sized Hospital Respondent
“We used our GPO’s special services to gain a team (SG
leader, MM leader, senior management, pharmacy leader)
who would work together to lower implant costs. By working
together and networking with other hospitals, we were able
to achieve a capitated contract with two vendors.”
—Hospital Respondent
Value-based selection
“Have started to utilize a new system for laparoscopy
equipment. We reduced disposable and equipment repair
costs. Improved physician satisfaction because equipment
is in better condition. Led to savings of $100,000. Also, our
pharmacy went from IV to PO for certain drugs.”
—Mid-sized Hospital Respondent
Physician/clinical buy-in
“We had our first physician preference item contract
negotiations to narrow the number of vendors down and
guarantee 95 percent utilization of one vendor through
engaging the physicians, resulting in an annual savings of
$300,000.”
—Mid-sized Hospital Respondent
“We engaged general surgeons to select one vendor for
spinal implants, which led to an average per case reduction
of 15 percent.”
—Hospital Survey Respondent
“Current project to ensure that all parties involved in use
of the supply item have input and buy-in to the product
selected. This process has resulted in five of our high-use
items being standardized throughout the facility. Not only
saving on the product but the amount of items that we need
to keep in stock.”
—Large Hospital Respondent
“Developed an employee supply saving bonus, which
rewards qualifying employees for ideas leading to supply
savings. Bonus varies depending upon ultimate savings to
the hospital.”
—Large Hospital Respondent
Metrics and objectives
“Addition of clinical resources (RN) to MM staff.
Developing physician profiles—working on cost and
reimbursement profiles.”
—Mid-sized Hospital Respondent
“We have instituted monthly departmental metrics for
linen, distribution, receiving, and mailroom to better track
our own performance. Ultimately it will serve as a source
of whether we are moving things in the right direction in
terms of efficiency.”
—Small Hospital Respondent
Extensive review of supply chain processes
“Undergoing a supply chain study currently. We have
identified one-time savings of $600,000 to $1 million
in inventory reductions and potential savings in product
standardization and best price practices.”
—Mid-sized Hospital Respondent
12
Advice based on past projects
Feedback centered on a handful of themes:
• Ensuring buy-in before product launch
• Building review of item master into major projects
• Preparing information technology; specifically, ensuring
clean data and building time and budget for training and
ramp-up.
Buy-in
Developing buy-in was the most prominent concern. Most
indicated that early buy-in and true collaboration are
essential to success:
“We struggled with doctor buy-in. At first we focused
on reducing supply costs. We replaced this with a more
open forum. In this, we discuss top issues from both
administration and from doctors. Helped us surface key
issues from both sides. The open exchange has really
helped us rebuild the culture.”
—Large Hospital Respondent
“We really wanted to go to one vendor but doctors wanted
more flexibility and choice. We compromised and went with
two vendors.”
—Hospital Respondent
“Too many ‘workarounds’ were allowed in the system that
was designed and the core process was not well defined and
syndicated.”
—Mid-sized Hospital Respondent
“In our capitated ortho knee program, one ‘outlier’ was
recently approved by administration (with our intense
involvement) at a higher price.”
—Mid-sized Hospital Respondent
“Suture/endo product conversion. Ask if they are even
interested in the thought of switching otherwise, doomed
from the beginning.”
—Hospital Respondent
“Point-of-use supply management. Nursing compliance
is not where it should be—they don’t own this yet. Advice:
VERY worthwhile but it takes a lot to get buy-in. Challenges
are getting accountability at department manager level and
not just in mm.”
—Hospital Respondent
Review of Item Master
Standardization involves a thorough review of the item
master file:
“We have tried to manage our item file master much better
and put a lot of emphasis on this. However, we realized that
not having items like implants from the vendors we use in
the item file does not work. Now we are adding them all to
have better information both for utilization management
and cost/charge capture.”
—Mid-sized Hospital Respondent
Centralized Functions
A handful noted concerns about centralized purchasing
functions without planned involvement:
“Consolidated purchasing through parent corporation.
This has yet to yield expense decrease, only increases.”
—Small Hospital Respondent
“Do not allow a regional office to dictate all improvements.
End users and physicians MUST be involved.”
—Small Hospital Respondent
Preparing for New Technology
And adequate preparation for new technology was a noted
learning from past projects:
“We needed better training before system install. Led to
confusion and slow start up.”
—Hospital Respondent
“Supply chain software installation was problematic. We
should have had a sufficient implementation team to plan
(back fill). I’d advise taking time to build a comprehensive
master file. START with clean data.”
—Hospital Respondent
Additional Advice from Respondents:
“Tried to move to reprocessing in the hospital. There is still
a lot of concern. No progress has been made.”
—Hospital Respondent
“As an organization, we partnered with one distributor for
all nine of our regions. The distributor was not capable of
bringing the entire organization on at one time. Better due
diligence.”
—Hospital Respondent
Top Practices
• Inform and train to build buy-in from the back office to
the boardroom
• Select metrics and benchmarks that the clinical staff,
physicians, administration, and others value
• Integrate physicians in evaluating programs through a
review of variations in clinical and financial outcomes by
program and by physician
• Establish a continual focus on a clean and comprehensive
item master
• Evaluate technologies to improve and integrate
information for decision-making
• Continually examine processes and structures for review
of preference items
• Evaluate opportunities to improve asset tracking
• Continue focusing on core supply chain management
functions and structure, such as purchasing control,
inventory control, transportation, and GPO utilization
• Celebrate successes to build awareness and collaboration
• Interact and share best practices with peers
Additional HFMA Resources
• HFMA Education
— Conferences, Seminars, Audio Webcasts and the
Annual National Institute
http://www.hfma.org/education/national_education_
calendar.htm
— HFMA Chapter/ Local Education
http://www.hfma.org/education/chapter_education_
calendar.cfm
• HFMA e-Learning lessons:
http://commerce.webinservice.com/hfmacommerce/
• Newsletters
— HFMA’s Supply Chain Solutions Newsletter
http://www.hfma.org/publications/Supply_Chain_Solutions_
Newsletter.htm
— HFMA’s Managing the Margin Newsletter
http://www.hfma.org/publications/newsletters/managing_
the_margin/index_2.htm
— HFMA’s Executive Insights Newsletter
http://www.hfma.org/publications/newsletters/executive_
insights/index_2.htm
— HFMA’s Revenue Cycle Strategist Newsletter
http://www.hfma.org/rcs
• HFMA Membership
http://www.hfma.org/join
• HFMA’s Comprehensive Guide to Cost Control
http://www.hfma.org/resource/cost_control.htm
Exhibit 19. Response by Size
Size Responses
Less than 35M . . . . . . . . . . . . . . . . . . . . . . . . . . . . . . . . . . . . . . . . . . . . . 53
35-125M . . . . . . . . . . . . . . . . . . . . . . . . . . . . . . . . . . . . . . . . . . . . . . . . . . . . 47
125-315M . . . . . . . . . . . . . . . . . . . . . . . . . . . . . . . . . . . . . . . . . . . . . . . . . . 50
315-750M. . . . . . . . . . . . . . . . . . . . . . . . . . . . . . . . . . . . . . . . . . . . . . . . . . .30
>750M. . . . . . . . . . . . . . . . . . . . . . . . . . . . . . . . . . . . . . . . . . . . . . . . . . . . . .20
Unknown . . . . . . . . . . . . . . . . . . . . . . . . . . . . . . . . . . . . . . . . . . . . . . . . . . 25
(Survey organization matched to 2003 Medicare Cost Report)
Representation of Rural Hospitals
Rural . . . . . . . . . . . . . . . . . . . . . . . . . . . . . . . . . . . . . . . . . . . . . . 94
(Survey organization matched to AHA demographic data using
AHA QuickDisc 2004)
About HFMA
HFMA is the nation’s leading membership organization for more than 34,000 healthcare financial management
professionals employed by hospitals, integrated delivery systems, managed care organizations, ambulatory and long-term
care facilities, physician practices, accounting and consulting firms, and insurance companies. Members’ positions include
chief executive officer, chief financial officer, controller, patient accounts manager, accountant, and consultant. HFMA
offers educational and professional development opportunities; information on key issues affecting healthcare financial
managers; resources, such as technical data, checklists and research reports; and networking opportunities—all of which
provide our members with the practical tools and ideas they need to ensure career and organizational successes. For more
information, visit HFMA’s website at www.hfma.org.
About McKesson
To truly optimize all areas of your business–clinical, operational and fiscal–you must evaluate the efficiency of your
processes and the performance of your staff, while building in the flexibility to handle all of those “contributing issues,”
those emergencies and last-minute changes that derail your strategic business objectives and put further pressure on your
staff. McKesson’s Resource Management solutions specifically focus on uncovering opportunities to improve operational
efficiency, clinical effectiveness, and fiscal viability. We offer an outcomes-based approach to solving your business
performance objectives. Our comprehensive solution set includes advanced operational, financial and clinical analytic
tools, and specialized departmental software and process improvement experts committed to achieving your organizations’
business initiatives. To learn more about McKesson, please contact us at 800.861.9801 or http://infosolutions.mckesson.com.
Survey Response
Two hundred twenty-five CFOs, financial leaders, and
materials management leaders responded to the survey.

Benchmark Study

  • 1.
    Synopsis This paper summarizesbenchmarking metrics and industry perceptions based on HFMA’s 2005 Supply Chain Benchmarking Survey. Sponsored through an educational grant by McKesson HFMA’s 2005 Supply Chain Benchmarking Survey Managing Resources to Achieve Improved Economic Outcomes and High-Quality Care healthcare financial management association July 2005
  • 2.
    Summary Background A growing numberof environmental concerns have led to increased focus on the healthcare supply chain: a growing uninsured population, labor shortages and costs, reimbursement and payer trends, challenges related to reimbursement for new treatments and technologies, and escalating utilization. Progressive materials and purchasing leaders are succeeding in aligning economic interests with those of physicians and clinicians, and achieving targeted expense reduction. But to make more significant progress in this area, organizations must lift systemic barriers and align goals to maximize supply chain effectiveness. Fortunately, the effectiveness of supply chain operations has assumed a higher priority among senior- level management. As a result of this increased attention, the role supply chain leaders play in the success of an organization has become more recognized and respected. This paper highlights findings of HFMA’s 2005 Supply Chain Survey, made possible through an educational grant by McKesson. Based on the feedback of 225 respondents, the study identified recent successes, future opportunities, and benchmarking metrics; it also includes specific examples of respondents’ successes. Furthermore, recent OIG commentary on gainsharing is highlighted in order to present potential opportunities to align incentives and thus increase physician buy-in. The survey builds on the findings of a 2002 study, which delineated the state of supply chain management and identified best practices. Made possible by an educational grant from McKesson, the 2002 study provided the perspectives of 600 financial executives and supply chain leaders (www.hfma.org/FeaturedTopic/resource_ management.htm). This paper also compares the findings from the 2005 survey to findings from 2002. Respondents indicated that supply chain initiatives reduced their supply chain budget by 1.25 percent per year over the past two years (median). Looking forward, respondents estimate twice as much opportunity to improve supply savings. Top opportunities exist in physician and clinical buy-in, information technology investments, and value analysis. Developing buy-in was the most prominent concern, with many respondents indicating that true collaboration is essential for success. Investments in information technology were noted to provide more significant opportunities in the 2005 survey compared to 2002 results. At the same time, 2005 respondents found significantly fewer opportunities in automation compared to 2002. The leading opportunities in standardization and order management include clean and comprehensive supply item master, purchasing controls/processes/structure for preference items, and cultivating awareness and understanding of metrics. The survey’s findings reveal that although almost all hospitals have undertaken a standardization initiative and most are using value analysis teams, physicians possess relatively low awareness of these initiatives. The study also highlights examples of clinical and financial outcome variations by product line and by physician as a way to encourage physician involvement in identifying best practices. Overview
  • 3.
    1 Areas of GreatestOpportunity Survey respondents were asked where they saw the greatest opportunities for improvement in their organizations over the next two years, based on the impact of potential initiatives in supply chain management. Respondents indicated that the highest opportunity can occur in physician and clinical buy-in, information technology investment, and value analysis. Exhibit 1. Percent Indicating “High” or “Tremendous” Opportunity By Improvement Area Percent Indicating “High” or “Tremendous” Opportunity By Improvement Area Overall Opportunity 56% Physician/Clinical Buy-In 65% IT Investments 64% Value Analysis 64% Reduce OR Expense 62% Improve Efficiencies 49% GPO 42% Demand Forecasting 38% Central Supply 25% Automation 23% Larger hospitals—that is, those with patient revenue greater than $315 million—were more optimistic about opportunity overall. Respondents in this classification were most likely to indicate “tremendous” or “high” improvement opportunity in information technology investments. Exhibit 2. Percent Large Hospitals Indicating “High” or “Tremendous” Opportunity By Improvement Area * Large Hospitals > $315M Patient Revenue Percent Large Hospitals* Indicating “High” or “Tremendous” Opportunity By Improvement Area Overall Opportunity 67% IT Investment 80% Value Analysis 70% Physician/Clinical Buy-In 68% Reduce OR Expense 62% Improve Efficiencies 61% Demand Forecasting 39% GPO 37% Central Supply 31% Automation 31% Areas with Low Perceived Opportunity Most respondents viewed minimal opportunity in automation. Exhibit 3. Percent Indicating “None” or “Minimal” Opportunity By Improvement Area Percent Indicating “None” or “Minimal” Opportunity By Improvement Area Overall Opportunity 10% Automation 52% Central Supply 38% GPO 36% Demand Forecasting 30% IT Investment 19% Physician/Clinical Buy-In 15% Improve Efficiencies 14% Reduce OR Expense 10% Value Analysis 9% Survey Responses
  • 4.
    2 Change in Focusover the Past Three Years In the area of information technology, respondents indicated greater opportunity in 2005 vs. 2002. At the same time, they see less opportunity in automation, demand forecasting, and processes in central sterile supply than they did three years earlier. They view continued opportunity in physician involvement and the use of GPO contracts. Exhibit 4. Opportunities 2002 Versus 2005 Percent of Respondents 65% 67% Physicians 64% 55% IT 42% 43% GPO 38% 46% Demand Forecasting 25% 37% Central Supply 23% 47% Automation 2005 2002 Recent Reductions and Future Opportunity Respondents were asked to estimate the financial benefit of supply chain initiatives over the past two years. Annual Cost Reductions over Past Two Years Respondents indicated that supply chain improvement initiatives generated 1.25 percent annual reduction in supply costs per year (median). Comparatively, VHA sees significant opportunity. They estimate that healthcare organizations implementing best practice processes in the supply chain can save between 15 and 30 percent of related supply costs.1 Exhibit 5. Annual Cost Reductions- All Respondents 3.25% 25th percentile 1.25% Median .53% 75th percentile Cost reductions were similar considering the size of the institution. Exhibit 6. Cost Reduction – By Hospital Size Cost Reduction (% of Supply Budget) 1.29% 1.33% 1.25% Larger Hospitals (>$315M) Mid-Sized Hospitals ($125–315M) Patient Revenue Smaller Hospitals (<$125M) * Annual percent of supply budget per year over past two years. 1 VHA2004ResearchSeries,TakingControlofYourSupplyChain:TheBuckStartsHere.
  • 5.
    3 Opportunity over NextTwo Years Looking forward, respondents were asked to estimate the opportunity to improve supply costs over the next two years. The median response for future opportunity doubled past reductions: 2.50 percent compared to 1.25 percent. Exhibit 7. Future Opportunity – All Respondents 3.57% 25th percentile 2.50% Median .96% 75th percentile Smaller hospitals—that is, those with less than $125 million in patient revenue—note higher opportunity compared to mid-sized and larger hospitals. While past successes in smaller hospitals were 1.25 percent (median), they anticipate greater opportunity in the future. Exhibit 8. Future Opportunity – By Hospital Size* Opportunity (% of Supply Budget) 2.11% 2.08% 3.50% Larger Hospitals (>$315M) Mid-Sized Hospitals ($125–315M) Patient Revenue Smaller Hospitals (<$125M) * Annual percent of supply budget per year over next two years. Standardization In 1996, The Efficient Healthcare Consumer Response Study identified nearly $11 billion in process savings opportunities.2 Order management improvements represented more than half of the anticipated opportunity. While healthcare organizations and others involved in supply chain have continued to focus on improved processes, the relative opportunity is similar today. It is not surprising that respondents indicated the greatest opportunity for savings can be achieved through standardization, which involves purchasing controls, value-based selection, and physician buy-in. All areas are impacted by selection and order management. Exhibit 9. EHCR Supply Chain Process Savings Opportunities $ Billions $0 $1 $2 $3 $4 $5 $6 $7 Transportation Physical Distribution Inventory Management Order Management The top specific opportunities in standardization and order management identified by respondents include: • Continually focusing on a clean and comprehensive supply item master • Creating purchasing controls and processes for preference items—which include physician buy-in, participation, and leadership—and related processes and structures for continuous evaluation of new items • Increasing awareness and understanding of metrics 2 HFMAWhitePaper,ResourceManagementUpdate:HealthcareSupplyChain,Westchester,IL,2001.
  • 6.
    4 Clean and Comprehensive SupplyItem Master Due to the sheer volume, complexity, and dynamic nature of supply data, many hospitals’ item masters have errors, redundancies, and outdated information. Additionally, many high-end items and preference items are not included in the item master. Commonly encountered data problems are included in Exhibit 10. While challenging, constant focus on a clean and comprehensive item master can improve purchasing processes and increase the ability to evaluate product data and benchmarks. Improved reporting and analysis can lead to reduced variability in pricing for the same product as well as improved contract performance. Exhibit 10. Commonly Encountered Data Problems with the Supply Item Master • Incomplete vendor and/or product information • Nonstandard vendor names • Vendor product numbers with missing information or additional characters • Overly abbreviated product descriptions • Product descriptions that are not normalized or may have missing attributes • Unclassified products Processes for Physician Preference Items and Physician Buy-in Physician preference items, including medical devices, account for about 40 percent of a typical supply budget.3 To reduce supply costs, physicians must be involved stakeholders in standardization and utilization efforts. There must also be a flexible and reasonable process for preference items. While 65 percent of HFMA survey respondents indicated “tremendous” or “high” opportunity in involving physicians, according to a separate VHA study, only 35 percent of physicians are involved in standardization and utilization programs, and more than 40 percent were unaware as to whether their hospital even sponsored such programs.4 This is surprising considering AHRMM’s finding that more than 90 percent of hospitals have undertaken a standardization initiative over the past 12 months and 57 percent use value analysis teams.5 Thus, potential opportunities exist to improve physician awareness and increase buy-in for standardization initiatives. Physicians seem to value these efforts. Of the physicians surveyed in the VHA study, almost two-thirds found standardization effective and more than half found utilization programs to be effective at balancing clinical care and financial outcomes.6 Recent commentary from the OIG regarding gainsharing may present additional opportunity to increase physician buy-in. A recent HFM article identifies the following strategies: • Stay focused on the big opportunities • Make vendor dealings fair and transparent: physicians are more likely to support a process that is transparent and that focuses on vendor inclusion • Be sure there is a process for prospectively evaluating new or incrementally improved products 7 3 RandBallard,“StrategicSupplyCostManagement,PhysicianPreferenceWithoutDeference,”HealthcareFinancialManagement,April2005,pp78-84. 4 “VHAStudyShows64PercentofPhysiciansBelieveHospitalSupplyStandardizationsAreEffective,”VHA/Surgicenteronline.com, Postedon04/07/2005,Phoenix,AZ. 5 “2004PerformanceIndicatorsStudyonHealthcareSurgerySupplyChainManagement:2004,”AssociationforHealthcareResourceand MaterialsManagementandBDConsulting.Chicago,IL.
  • 7.
    5 Gainsharing Recently, the OIGhas issued several advisory opinions approving gainsharing arrangements in which hospitals agree to pay private practice physicians a portion of the cost-savings directly attributable to their adoption of certain cost-saving protocols. These opinions represent a significant development given the OIG’s historical reluctance to approve gainsharing arrangements in any form and the recent federal court decision striking down a CMS gainsharing demonstration project in New Jersey as illegal. Following is an excerpt from the February 25, 2005, OIG Advisory Opinion: “Arrangements like the proposed arrangement are designed to align incentives by offering physicians a portion of a hospital’s cost savings in exchange for implementing cost-savings strategies. Under the current reimbursement system, the burden of these costs falls on hospitals, not physicians. Payments to physicians based on cost savings may be intended to motivate them to reduce hospital costs associated with procedures performed by physicians at the hospitals.” “Properly structured, arrangements that share cost savings can serve legitimate business and medical purposes. Specifically, properly structured arrangements may increase efficiency and reduce waste, thereby potentially increasing a hospital’s profitability. However, such arrangements can potentially influence physician judgment to the detriment of patient care. Our concerns include, but are not limited to, the following: (i) Stinting on patient care; (ii) ‘Cherry picking’ healthy patients and steering sicker (and more costly) patients to hospitals that do not offer such arrangements; (iii) Payments in exchange for patient referrals; and (iv) Unfair competition (a ‘race to the bottom’) among hospitals offering cost savings programs to foster physician loyalty and to attract more referrals.8 ” HFMA’s Compliance Officer’s Forum offers the following summary:9 Exhibit 18. Compliance Officer’s Action Grid: Gainsharing Issue Importance What OIG Says Action Required Gainsharing Arrangements Thecivilmonetarypenalty provisionssetforthinSection 1128A(b)(1)oftheSocial SecurityActprohibitahospital fromknowinglymakinga paymentdirectlyorindirectly toaphysiciantoinducethe physiciantoreduceorlimit itemsorservicesfurnished toMedicareorMedicaid beneficiariesunderthe physicians’sdirectcare. Thereisnorequirementthattheprohibitedpaymentbetiedtoa specificpatientortoareductioninmedicallynecessarycare. Anyhospitalincentiveplanthatencouragesphysiciansthrough paymentstoreduceorlimitclinicalservicesdirectlyorindirectly violatesthestatute. Gainsharingarrangementscanalsoimplicatetheantikickback statuteifthecost-savingspaymentsareusedtoinfluencereferrals. Theantikickbackstatutewillbeimplicatedifahospitaloffersa cost-sharingprogramwiththeintenttofosterphysicianloyaltyand attractmorereferrals. Governmentscrutinyisparticularlylikelywherearrangements permitaphysiciantoreapbenefitsoveranextendedperiodoftime thatexceedsthetimenecessarytoachievesavingsorreceive cost-savingspaymentsunrelatedtoactiontakenbythephysician. GainsharingarrangementsmayalsoimplicatetheStarklaw. Considerstructuring cost-savingarrangements tofitwithinthepersonal- servicessafeharbor wheneverpossible. Payments to Reduce or Limit Services: Gainsharing Arrangements 6 “VHAStudyShows64PercentofPhysiciansBelieveHospitalSupplyStandardizationsAreEffective,”VHA/Surgicenteronline.com, Postedon04/07/2005,Phoenix,AZ. 7 RandBallard,“StrategicSupplyCostManagement,PhysicianPreferenceWithoutDeference,”HealthcareFinancialManagement,April2005,pp78-84. 8 DepartmentofHealthandHumanServices,February2005,OIGAdvisoryOpinionNo.05-06.http://oig.hhs.gov/fraud/docs/advisoryopinions/2005/ao0506.pdf 9 HFMAComplianceOfficersForum,April2005,http://www.hfma.org/forums/ActionGrid.pdf
  • 8.
    6 Metrics Traditional supply chainmeasurements are included in the benchmarks that follow. In addition to these measures, many healthcare organizations have shifted their focus from “reducing costs” to a combined approach that identifies mutually beneficial goals aimed at improving clinical outcomes and financial performance. Exhibit 11. Sample Product Line Evaluation Quarterly Gross Expected Variable Fixed DifferenceBetween Physician Length Revenue Payment Cost Contribution Cost Net VC perCaseand Name Cases ofStay perCase perCase perCase Margin perCase Margin BestPractice 8 7.14 13,610 6,244 4,205 2,039 2,701 (662) 9,640 Dr. Smith 7 5.54 10,453 4,052 3,189 863 3,771 (2,908) 1,323 Dr. Brown 6 7.33 15,325 5,404 3,414 1,990 2,617 (627) 2,484 Dr. Garcia 5 10.67 9,898 6,633 3,265 4,874 (1,609) 18,165 Dr. Chen 5 5.33 8,225 4,884 3,000 1,884 2,391 (507) — Others 53 5.92 12,059 5,685 3,364 2,501 3,620 (1,119) 19,292 Total 84 6.51 13,076 5,899 3,606 2,293 3,475 50,904 DRG 89 (Simple Pneumonia), Variability of Physician Variable Costs First Quarter 200410 Smaller institutions reported 85 percent contract purchases whereas larger institutions reported lower compliance, with 70 percent of purchases made on contract. Supplies as Percent of Operating Budget Median medical/surgical supply cost is 15 percent of operating budget. Exhibit 12. Medical Surgical Supply Cost as a Percent of Operating Budget 12% 25th percentile 15% Median 18% 75th percentile Measuring and reporting differences in mortality, length of stay, costs, and revenue demonstrate variations. This type of data can compel physicians to examine related process variations and stimulate opportunities to improve care and costs. One example of reporting is included in Exhibit 11, which demonstrates variation by physician within a product line. Variability of supply costs per procedure can differ greatly. For example, this variation is almost 400 percent for DRG 79 (Respiratory Infections) and DRG 250 (Cervical Spine Fusion without CC).11 Identifying and implementing best practices in care can impact both clinical and financial outcomes. Similarly, demonstrating cost as well as margin may increase sensitivity to financial issues. Benchmarking and Metrics Respondents shared key performance metrics, which are summarized below. Percent of Contract Purchases Seventy-seven percent of purchases are contract purchases, according to survey respondents. This is up from 75 percent in 2002 (median). 10 StevenH.Berger,“10WaystoImproveHealthcareCostManagement,”HealthcareFinancialManagement,Westchester,IL,August2004,pp76-80. 1 1 RandBallard,“StrategicSupplyCostManagement,PhysicianPreferenceWithoutDeference,”HealthcareFinancialManagement,April2005,pp78-84.
  • 9.
    7 Larger hospitals indicatedthat medical/surgical supplies represented a higher percentage of their operating budgets. Exhibit 13. Supplies as a Percent of Operating Budget 13% 13% 15% Small (<$35M) Mid-Sized/ Small ($35–125M) Mid-Sized ($125–315M) 17% Large (>$315M) Exhibit 14. Supply Expense per Adjusted Patient Day 25th 75th Percentile Median Percentile All $194 $259 $326 >$314M 244 315 369 $125–$315M 243 271 301 <$125M 140 196 244 Rural 164 211 298 Exhibit 15. Supply Expense per Adjusted Discharge 25th 75th Percentile Median Percentile AllRespondents $769 $1,014 $1,299 >$315M 1,114 1,360 1,601 $125–$315M 933 1,198 1,211 <$125M 459 669 883 Rural 594 818 1,198 Rural<$125M 581 766 905 Exhibit 16. Pharmaceutical Expense per Adjusted Patient Day 25th 75th Percentile Median Percentile All 46.2 $51.5 $97.5 >$325M 52.9 66.2 52.9 $125–$325M 47.6 49.7 51.6 <$125M 45.6 50.5 101.5 Significant variation in response Exhibit 17. Pharmaceutical Expense per Adjusted Discharge 25th 75th Percentile Median Percentile All $182.8 $216.5 $280.3 >$315M 214.2 272 401.4 $125–$315M 184.3 213.9 238.0 <$315M 122.6 186.1 238.0 Significant variation in response
  • 10.
    8 Metrics Viewpoint Jamie C.Kowalski, MBA Vice President, Practice & Market Development McKesson Provider Technologies Wheeling, Illinois Supply chain management has many important and interdependent components, which have been described in these survey results. Specific, selected measures provide data that can help drive decisions, identify areas of vulnerability, and determine the overall effectiveness of supply chain operations. Therefore, despite executive calls for a single metric for measuring supply chain management performance, distilling these components into one metric is not beneficial. The metrics selected by an organization should be meaningful to all stakeholders (executives, customers, supply chain team), measurable (preferably via automation), and manageable (able to help the team make changes that will improve performance). Furthermore, such metrics must track all outcomes of the supply chain: service/customer satisfaction, quality/effectiveness, resource productivity/efficiency, and financial results. Benchmarks can be synonymous with best practices, or lead to them. They can be based on internal levels (for example, one patient care unit has achieved inventory turns of 33 times per year; all patient care units are expected to achieve that) and/or external sources (a hospital/IDN in the peer group has achieved supply expense as a percentage of total hospital operating expense of 14.3 percent). But caution is required when using “national benchmarks” because ensuring that the metrics are actually reporting and measuring the same items, in the same manner, may be impossible. What is most important is to continue striving for improvement to reach best practice levels of performance. Throughout that process, organizations must be sure to recognize and celebrate positive performance. But at the same time, caution should be exercised about intensity and timing. If the pace is too slow, it will be difficult to reach and maintain momentum. This can lead to morale problems, but even worse, can be quite costly to the organization from a financial perspective. For example, if the goal is to reduce annual operating expenses by $1 million through supply spending, every month that the target level is not achieved costs the organization $83,000 that could have been avoided. Thus, a bit of impatience can be a good thing. Best practices in the use of metrics include: • Support from senior executives (CEO, CFO, CNO, etc.), including providing attention and coaching, and developing accountability for staff roles • Supply chain management metrics that cover the scope of the supply chain (see Exhibit below); each major component can and should be measured • Metrics that are customized for, reported to, and tracked by all stakeholders: executives, customers, supply chain leaders, and team • Appropriate measurement of performance at the individual employee level (e.g., productivity, quality) • Recognition, rewards, and as indicated, sanctions • Accountability for performance at the point of control— For example, if a service department fails to reduce supply spending or exceeds supply budgets, holding the supply chain leader and team accountable is not appropriate, unless the products used by that department are being purchased for noncompetitive prices. Consumption is the responsibility of the consumer.
  • 11.
    9 Examples of SupplyChain Metrics are shown below: Area Metric Comment Financial SupplyExpenseas%of TotalOperatingExpense Indicatoroftheimpactofsupplyoptimization:supplycostsshoulddrop atagreaterrate thanoverall costs.Alsoprovidesassurance thatsupplystandardization does not increase costsinotherareas. SupplyExpenseperAdjusted PatientDay Mostcommonlyusedsupplychainindicatorformeasuringcost. SupplyExpense per AdjustedDischarge Can track/trend costvariationacrosspatient types and severity BestSystem Price Pricemanagementtoensurelowestavailable price ispaidwithinyourhealthcareenterprise BestMarketPrice Pricemanagementtoensurelowestavailable price ispaidwithinyourmarket Pricing Variance Constantpricing changes can have a detrimental effectonassuringbestprice Non-contractspend–$ MeasurescompliancewithpurchasesthroughaGPOcontract Off tierlossestotal $ Measureoflossesasa resultofnot achieving tierlevels Non consolidatedtierlosses Measure oflossesasa resultofnot achieving tierlevels Lossdue tovendorselection Dollars associatedwithoff contractpurchases ItemStandardizationRebateLoss Dollarlostasaresultofnotmeetingrebatethresholdsbyproductcategory VendorStandardizationRebateLoss Dollars lostata resultofnot meeting rebatethresholds atthe vendorlevel On-hand Inventory Value Measures how muchcashistiedupininventory and unavailable for other uses Value ofConsignmentInventory Tracks the value ofconsigned inventory;important tomonitor vendormanagement Outcomes Priceinflationindex(marketbasket) Costper PO Productivitymeaure; efficient managementofordersshouldresultinlower costper PO AccountsPayable$onholdpending invoicediscrepancyresolution Potential for lostrevenue increases;timespent onresolving discrepancies results in highermanagementcosts % purchases without invoice discrepancies Measuresthe results ofinvoicing practices AvailableRebatesnotcollected(TBD) Measuresresultsofeffectiverebatemanagement GPOholdbacks Numberofvendors used Measuresthe results ofvendorstandardization; the fewer the vendors,the morelikely totakeadvantageofvolumepurchasesandrebates NumberofOrtho used Measuresthe resutls ofOrtho vendorstandardization NumberofCardioused Measuresthe results ofCardiologyvendorstandardization RebateIndex Indicatoroftheresultsofcontractcomplianceeffortsandtierachievements Stock-outs Measure ofthe results ofmanaging PAR levelsand stockingprotocols Throughput POLinesperpaidhour Monitorstheefficiencyofsupplydistribution DistributionLinesPicked perpaidhour Monitorsthetimelydistributionandstockingofsupplieswithinthe organization Inventory Turns Ameasure ofaccuratestockingand PAR levelsand helps toreducecarriedinventories. Mosteffectivewhentrackedattheproductcategorylevel. Volumeand Capacity Requisitionsprocessedelectronically Tracksthevolumeofrequisitionsprocessedandtheeffectivesofe-supplymanagement % purchasetransactions via “e-commerce” Tracksthe volumeofrequisitions processed electronicallycomparedtototal transactions Noncontract as% oftotal spend Monitors the rateofpurchases thatoccur froma noncontract vendor; increases in noncontractmayindicatenewproductsorroguebuying Non-compliantpurchase Monitorsthedollarsassociatedwithnoncontractpurchases LOCActivation LOCActivation% Total Inventory $/Average PatientDays % ofConsignment Inventory High dollar, complex products, suchasimplantsand orthopedics require significant investmenttostock inaninstitution. Consignmenthelps withinventory management butmustbemonitoredforreimbursementandproductavailability.
  • 12.
    10 When asked todescribe recent projects that have led to the greatest improvements, respondents most frequently cited the following: • GPO utilization and pricing • Centralization of supply chain functions • Investments and utilization of information technology • Revising structure, adding staffing, developing teams • Increasing value based selection • Revising and standardizing item master • Developing physician/clinical buy-in • Developing reporting and metrics Successes Achieved GPO utilization and pricing “We reviewed all contracts and suppliers used in the past 18 months to improve efficiencies and identify cost savings through GPO contracts. Reduced overall supply costs by approximately 10 percent.” —Mid-sized Hospital Respondent “Reduced contract pricing for orthotics. Continue to review make-up of packs and alter components as required.” —Mid-sized Hospital Respondent “We re-bid services to bring down cost of telephone and other services. Continued standardization of supplies. We have a committee to limit the number of companies we work with. This increases the volume at each company and leads to better pricing.” — Mid-sized Hospital Respondent “Negotiating a new contract on urinary stents. Should save us 30 percent. Also, going to consignment on cardiac stents. Previously we purchased in bulk in order to get a reduced price. Didn’t prove successful, so we went to consignment.” —Small Hospital Respondent “Use of online requisitions tied into our MMIS system. User sees items they need, materials management doesn’t need to re-enter information. Non-stock items automatically produce PO’s.” — Mid-sized Hospital Respondent Revision and standardization of the item master “We undertook a formal 18-month Strategic Sourcing engagement that has involved 17 cross-functional teams to examine and improve our spending in clinical and non-clinical categories. We looked at about $300 million in spending and produced over 28 million in documented annualized savings. It also has changed the way our organization views the role of procurement and strategic sourcing.” — Hospital Respondent Centralization of supply chain functions “Materials management staff has taken over distribution of I.V. tubing from the pharmacy. This removes one ‘hand-off’ in the process. Savings are not yet determined. Materials management took over the ordering and stocking of the OR department. This reduced overstocking and improved lines of communication reducing overall inventory.” — Hospital Respondent “We migrated our purchasing and A/P functions to a centralized supply chain environment in March 2001. At this point, the operation is working very well. Chain in top leadership went from last to first in customer satisfaction in 15 months.” —Mid-sized Hospital Respondent “Identified supply chain manager for operational oversight of purchase order throughput, receiving dock flows, charge capture of various floor stock/patient charge items and floor stocking/ordering. We call him our control tower manager, having impact of all facets of supply chain status. Priceless—from user satisfaction and elimination of ‘surprise situations’.” — Hospital Respondent Information technology projects “We installed perpetual inventory this has improved control on supply use and charge capture.” “Installed automated replenishment system in CSD. Reduced inventory by 30 percent by eliminating duplicating inventory in storeroom and on exchange carts.” —Mid-sized Hospital Respondent In Your Words…What’s Worked, What Hasn’t?
  • 13.
    11 “Installation of automatedpurchasing/inventory system two years ago. Began value analysis within purchasing and materials assessment and accountability for waste compliance within our purchasing contracts.” —Large Hospital Respondent “Improved automation of managed care authorizations process. Contractual allowances for unauthorized services denials have decreased dramatically.” —Mid-sized Hospital Restructuring, adding staff, or developing teams “We have an MM team, composed of MM, clinical, and financial personnel. Our first project was to review in depth the MM item list. As a result of this, we identified a number of items that were obsolete and we have developed a standardized process of ‘naming’ so we know what we are talking about.” —Large Hospital Respondent “Development of director of Inventory Management program. Reduced imaging supply costs by 25 percent .” —Mid-sized Hospital Respondent “We used our GPO’s special services to gain a team (SG leader, MM leader, senior management, pharmacy leader) who would work together to lower implant costs. By working together and networking with other hospitals, we were able to achieve a capitated contract with two vendors.” —Hospital Respondent Value-based selection “Have started to utilize a new system for laparoscopy equipment. We reduced disposable and equipment repair costs. Improved physician satisfaction because equipment is in better condition. Led to savings of $100,000. Also, our pharmacy went from IV to PO for certain drugs.” —Mid-sized Hospital Respondent Physician/clinical buy-in “We had our first physician preference item contract negotiations to narrow the number of vendors down and guarantee 95 percent utilization of one vendor through engaging the physicians, resulting in an annual savings of $300,000.” —Mid-sized Hospital Respondent “We engaged general surgeons to select one vendor for spinal implants, which led to an average per case reduction of 15 percent.” —Hospital Survey Respondent “Current project to ensure that all parties involved in use of the supply item have input and buy-in to the product selected. This process has resulted in five of our high-use items being standardized throughout the facility. Not only saving on the product but the amount of items that we need to keep in stock.” —Large Hospital Respondent “Developed an employee supply saving bonus, which rewards qualifying employees for ideas leading to supply savings. Bonus varies depending upon ultimate savings to the hospital.” —Large Hospital Respondent Metrics and objectives “Addition of clinical resources (RN) to MM staff. Developing physician profiles—working on cost and reimbursement profiles.” —Mid-sized Hospital Respondent “We have instituted monthly departmental metrics for linen, distribution, receiving, and mailroom to better track our own performance. Ultimately it will serve as a source of whether we are moving things in the right direction in terms of efficiency.” —Small Hospital Respondent Extensive review of supply chain processes “Undergoing a supply chain study currently. We have identified one-time savings of $600,000 to $1 million in inventory reductions and potential savings in product standardization and best price practices.” —Mid-sized Hospital Respondent
  • 14.
    12 Advice based onpast projects Feedback centered on a handful of themes: • Ensuring buy-in before product launch • Building review of item master into major projects • Preparing information technology; specifically, ensuring clean data and building time and budget for training and ramp-up. Buy-in Developing buy-in was the most prominent concern. Most indicated that early buy-in and true collaboration are essential to success: “We struggled with doctor buy-in. At first we focused on reducing supply costs. We replaced this with a more open forum. In this, we discuss top issues from both administration and from doctors. Helped us surface key issues from both sides. The open exchange has really helped us rebuild the culture.” —Large Hospital Respondent “We really wanted to go to one vendor but doctors wanted more flexibility and choice. We compromised and went with two vendors.” —Hospital Respondent “Too many ‘workarounds’ were allowed in the system that was designed and the core process was not well defined and syndicated.” —Mid-sized Hospital Respondent “In our capitated ortho knee program, one ‘outlier’ was recently approved by administration (with our intense involvement) at a higher price.” —Mid-sized Hospital Respondent “Suture/endo product conversion. Ask if they are even interested in the thought of switching otherwise, doomed from the beginning.” —Hospital Respondent “Point-of-use supply management. Nursing compliance is not where it should be—they don’t own this yet. Advice: VERY worthwhile but it takes a lot to get buy-in. Challenges are getting accountability at department manager level and not just in mm.” —Hospital Respondent Review of Item Master Standardization involves a thorough review of the item master file: “We have tried to manage our item file master much better and put a lot of emphasis on this. However, we realized that not having items like implants from the vendors we use in the item file does not work. Now we are adding them all to have better information both for utilization management and cost/charge capture.” —Mid-sized Hospital Respondent Centralized Functions A handful noted concerns about centralized purchasing functions without planned involvement: “Consolidated purchasing through parent corporation. This has yet to yield expense decrease, only increases.” —Small Hospital Respondent “Do not allow a regional office to dictate all improvements. End users and physicians MUST be involved.” —Small Hospital Respondent Preparing for New Technology And adequate preparation for new technology was a noted learning from past projects: “We needed better training before system install. Led to confusion and slow start up.” —Hospital Respondent “Supply chain software installation was problematic. We should have had a sufficient implementation team to plan (back fill). I’d advise taking time to build a comprehensive master file. START with clean data.” —Hospital Respondent
  • 15.
    Additional Advice fromRespondents: “Tried to move to reprocessing in the hospital. There is still a lot of concern. No progress has been made.” —Hospital Respondent “As an organization, we partnered with one distributor for all nine of our regions. The distributor was not capable of bringing the entire organization on at one time. Better due diligence.” —Hospital Respondent Top Practices • Inform and train to build buy-in from the back office to the boardroom • Select metrics and benchmarks that the clinical staff, physicians, administration, and others value • Integrate physicians in evaluating programs through a review of variations in clinical and financial outcomes by program and by physician • Establish a continual focus on a clean and comprehensive item master • Evaluate technologies to improve and integrate information for decision-making • Continually examine processes and structures for review of preference items • Evaluate opportunities to improve asset tracking • Continue focusing on core supply chain management functions and structure, such as purchasing control, inventory control, transportation, and GPO utilization • Celebrate successes to build awareness and collaboration • Interact and share best practices with peers Additional HFMA Resources • HFMA Education — Conferences, Seminars, Audio Webcasts and the Annual National Institute http://www.hfma.org/education/national_education_ calendar.htm — HFMA Chapter/ Local Education http://www.hfma.org/education/chapter_education_ calendar.cfm • HFMA e-Learning lessons: http://commerce.webinservice.com/hfmacommerce/ • Newsletters — HFMA’s Supply Chain Solutions Newsletter http://www.hfma.org/publications/Supply_Chain_Solutions_ Newsletter.htm — HFMA’s Managing the Margin Newsletter http://www.hfma.org/publications/newsletters/managing_ the_margin/index_2.htm — HFMA’s Executive Insights Newsletter http://www.hfma.org/publications/newsletters/executive_ insights/index_2.htm — HFMA’s Revenue Cycle Strategist Newsletter http://www.hfma.org/rcs • HFMA Membership http://www.hfma.org/join • HFMA’s Comprehensive Guide to Cost Control http://www.hfma.org/resource/cost_control.htm
  • 16.
    Exhibit 19. Responseby Size Size Responses Less than 35M . . . . . . . . . . . . . . . . . . . . . . . . . . . . . . . . . . . . . . . . . . . . . 53 35-125M . . . . . . . . . . . . . . . . . . . . . . . . . . . . . . . . . . . . . . . . . . . . . . . . . . . . 47 125-315M . . . . . . . . . . . . . . . . . . . . . . . . . . . . . . . . . . . . . . . . . . . . . . . . . . 50 315-750M. . . . . . . . . . . . . . . . . . . . . . . . . . . . . . . . . . . . . . . . . . . . . . . . . . .30 >750M. . . . . . . . . . . . . . . . . . . . . . . . . . . . . . . . . . . . . . . . . . . . . . . . . . . . . .20 Unknown . . . . . . . . . . . . . . . . . . . . . . . . . . . . . . . . . . . . . . . . . . . . . . . . . . 25 (Survey organization matched to 2003 Medicare Cost Report) Representation of Rural Hospitals Rural . . . . . . . . . . . . . . . . . . . . . . . . . . . . . . . . . . . . . . . . . . . . . . 94 (Survey organization matched to AHA demographic data using AHA QuickDisc 2004) About HFMA HFMA is the nation’s leading membership organization for more than 34,000 healthcare financial management professionals employed by hospitals, integrated delivery systems, managed care organizations, ambulatory and long-term care facilities, physician practices, accounting and consulting firms, and insurance companies. Members’ positions include chief executive officer, chief financial officer, controller, patient accounts manager, accountant, and consultant. HFMA offers educational and professional development opportunities; information on key issues affecting healthcare financial managers; resources, such as technical data, checklists and research reports; and networking opportunities—all of which provide our members with the practical tools and ideas they need to ensure career and organizational successes. For more information, visit HFMA’s website at www.hfma.org. About McKesson To truly optimize all areas of your business–clinical, operational and fiscal–you must evaluate the efficiency of your processes and the performance of your staff, while building in the flexibility to handle all of those “contributing issues,” those emergencies and last-minute changes that derail your strategic business objectives and put further pressure on your staff. McKesson’s Resource Management solutions specifically focus on uncovering opportunities to improve operational efficiency, clinical effectiveness, and fiscal viability. We offer an outcomes-based approach to solving your business performance objectives. Our comprehensive solution set includes advanced operational, financial and clinical analytic tools, and specialized departmental software and process improvement experts committed to achieving your organizations’ business initiatives. To learn more about McKesson, please contact us at 800.861.9801 or http://infosolutions.mckesson.com. Survey Response Two hundred twenty-five CFOs, financial leaders, and materials management leaders responded to the survey.