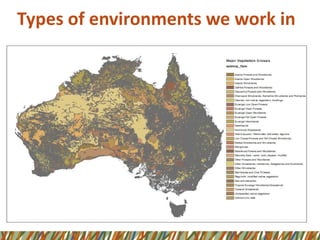
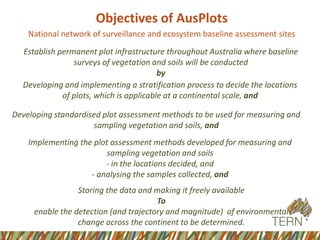
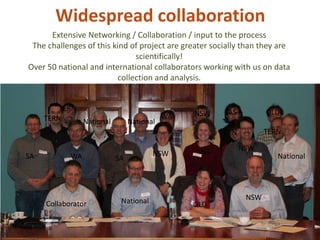
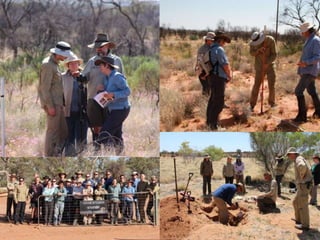
2. AusPlots
Designing a surveillance monitoring
network for Australia.
Presentation by Ben Sparrow
With help from the Ausplots Team
ben.sparrow@adelaide.edu.au
3. Political/Historical context
• Global Financial Crisis
• Australian Government response -Stimulus
• Favoured Infrastructure – NCRIS (National
Collaborative Research Infrastructure Scheme)
• Research infrastructure – Environmental =
TERN
• Not tangible infrastructure eg. Roads, but not
classical research either research – need to
deliver Data – Different measures of Success
4. Primarily funded to support / develop ecological research
infrastructure
– integrate existing data and make it accessible to the
national and global ecosystem sciences community in a
common format; and
– collect new data strategically in areas of high priority to
allow subsequent analysis and modeling of the assimilated
data.
In the context of AusPlots the Plots and their associated data are
considered to be infrastructure.
TERN
the Terrestrial Ecosystem Research Network
5. What is TERN?
• A Network of scientists and practitioners
collecting and delivering ecological research
infrastructure.
• Delivered as a number of facilities:
• Auscover: Ecological/ biophysical remote
sensing products
• Ausplots: Surveillance monitoring of
Australian ecosystems
• ACEAS – A Synthesis facility similar to NCEAS
6. • Coasts: Info in the interface between
terrestrial and marine
• Australian Supersite Network (ASN): Highly
instrumented study sites.
• Australian Transect Network (ATN): Data and
questions on environmental gradients; Space
as a proxy for time
• Eco-informatics – Data delivery warehouse;
Fully integrated data
• E-Mast – Ecological and biophysical modelling
7. • Long Term Ecological Research Network
(LTERN): Brings together scientists working on
long term sites – Question based targeted
monitoring
• Ozflux: a series of flux towers to understand
fluxes between land and atmosphere
• Soil and Landscape Grid: Delivering Australian
Soil information in line from plot to continent
• Many facilities collaborate together on aspects
of their work.
8. After Eyre et. al. 2011
Population Ecology
Community
Ecology
Biogeography/
Landscape Ecology
Types of monitoring
Auscover/ E-mast/ ACEAS/ Soil Grid
LTERN/OzFlux/ASN
ATN
Ausplots
9. Monitoring
There is ongoing tension between different types of monitoring
regarding their relative merits.
Often a monitoring program is judged on what would define a
successful monitoring program for a different type of
monitoring.
Each type of monitoring needs to be judged against its aims and
objectives.
10. Which is better?
They all have their Place!
All are needed and provide useful contributions to our
knowledge of Australian environments.
Each of these endeavours need to cooperate/ collaborate with
the others to provide a holistic solution to monitoring.
The most
important parts
are actually the
arrows!
11. Surveillance Monitoring
• Looks at entire communities ( Is more likely to be concerned with
the trajectory of communities rather than individuals or species)
• Versatile and reusable – Useful for many purposes
• Drivers unknown (May provide some insight, but that is not the
focus of design)
• Broad stakeholder base, given multiple purposes
• Detect and quantify change that we don’t know about and weren’t
anticipating
• Some hope of method standardisation – If method broad in scope
12. • Likely to be able to adapt to emerging issues – If method
broad in scope
• Has focus areas rather than tightly defined questions – it is
likely that this information will inform on many questions.
• Aims to detect and quantify environmental change across
large geographical areas.
• Less likely for the same sites to be regularly revisited –
Longer re-visit time. (Duration of many years)
• More often assessing long term change rather than shorter
term dynamics.
13. NOT
Because we want to know if there is a problem, but
we don’t have the resources to have the fire
department everywhere all the time!
52. Objectives of AusPlots
National network of surveillance and ecosystem baseline assessment sites
Developing standardised plot assessment methods to be used for measuring and
sampling vegetation and soils, and
Developing and implementing a stratification process to decide the locations
of plots, which is applicable at a continental scale, and
Establish permanent plot infrastructure throughout Australia where baseline
surveys of vegetation and soils will be conducted
by
Implementing the plot assessment methods developed for measuring and
sampling vegetation and soils
- in the locations decided, and
- analysing the samples collected, and
Storing the data and making it freely available
To
enable the detection (and trajectory and magnitude) of environmental
change across the continent to be determined.
53. Two Programs
• Ausplots Forests
– 48 plots in Tall Eucalypt Forrest – Accurately
quantify Growth of Trees – 1 week a site
• Ausplots Rangelands
– Rangelands a management – using FAO definition
½ forest
– 500+ Sites across the country
– 1 day per site
– Focus of this presentation
54. 81% of Australia
Wide variety of environments
Wide climatic variation
Generally Data poor / gaps
Where we work
56. Stage 1. Determining
Bioregional groupings using
hierarchical clustering
techniques
Stage 2. Decisions on which
bioregions to sample
Stage 3. GIS analysis within
each bioregion
Stage 4. Field Location whilst
on ground.
Where? - Stratification
62. Since the creation of the Rangelands protocols, and their
widespread acceptance we’ve added:
» A Tall Eucalypt Forest protocol
» A Condition assessment protocol
» A Woodlands Protocol
» A Vertebrate Fauna Survey Protocol,
With ongoing work on:
» A Fungi Protocol
» A Ground Dwelling Invertebrates
» A Core attributes (quicker) method
» Identifying and articulating what re-visits entail.
New Method Development
63.
64. Use new / innovative techniques where sensible
65. Consistent and accurate data
Standards, Collection and
Curation
A Nationally accepted method
Details all aspects of method
Easy to use and well illustrated
Explains reasoning
Regularly updated
Available at:
http://www.ausplots.org/
useourinfrastructure/
Designed to be used with our training
course
New modules being added – Check back
regularly.
72. Widespread collaboration
Extensive Networking / Collaboration / input to the process
The challenges of this kind of project are greater socially than they are
scientifically!
Over 50 national and international collaborators working with us on data
collection and analysis.
SA SA
National
NationalNational
Collaborator
TAS QLD
NSW
NSW
NSWNT
WA
WA NSW
National
TERN
TERN
TERN TERN
QLD
73. Field team
• Based in Adelaide
• Provides consistency
• Best way to use
scarce resources –
Would prefer to have
state based teams in
the future if funding
allowed.
• Well equipped
• Can train others
• Work in conjunction
with state agencies
where possible.
• Work well together in
trying conditions.
74. Training
courses
• At least one per
year
• A day of lectures
explaining all
aspects of the
method
• A day learning
each component
of our method
(Vegetation,
Soils and
Technical
Aspects)
• Focuses on
theoretical and
practical aspects
• Pragmatic
• Held in the
Rangelands
75.
76. Outputs
Still early days for the project given that re-visits are
only just starting (along with further roll out)
Currently used for validation of groundcover
Rangeland management programs
Taxonomy – New species and range extensions
Modelling of climate change scenarios
Government are supporting surveillance monitoring
as an essential input to future state of
environment reporting.
Inform on soil crust ( and hence erosion)
77. …and many publications
2015
Christmas M., Breed M., and Lowe A.J. (In review) Constraints and conservation implications for climate change adaptation in plants. Biological Conservation
Guerin G.R., Sweeney S.M., Pisanu P., Caddy-Retalic S., and Lowe A.J. (In review) Establishment of an ecosystem transect to address climate change policy
questions for natural resource management. Environmental Management
Guerin G.R. and Lowe A.J. (In review) Mapping phylogenetic endemism using georeferenced branch extents. Methods in Ecology and Evolution
Guerin G.R., Ruokolainen L. and Lowe A.J. (In press) A georeferenced implementation of weighted endemism. Methods in Ecology and Evolution
2014
Bowman D.M.J.S., Williamson G.J., Keenan R.J. and Prior L.D. (2014) A warmer world will reduce tree growth in evergreen broadleaf forests: Evidence from
Australian temperate and subtropical eucalypt forests. Global Ecology and Biogeography, 23(8): 925-934. (DOI: 10.1111/geb.12171)
Breed M.F., Christmas M.J. and Lowe A.J. (2014) Higher levels of multiple paternities increase seedling survival in the long-lived tree Eucalyptus gracilis.PLOS
ONE, 9(2) e90478 (DOI:10.1371/journal.pone.0090478)
Guerin G.R., Martín-Forés I., Biffin E., Baruch Z., Breed M.F., Christmas M.J., Cross H.B. and Lowe A.J. (2014) Global change community ecology beyond
species sorting: a quantitative framework based on Mediterranean Biome examples. Global Ecology and Biogeography, 23: 1062–
1072.http://dx.doi.org/10.1111/geb.12184
Guerin G.R., Biffin E., Jardine D.I., Cross H.B. and Lowe A.J. (2014) A spatially predictive baseline for monitoring multivariate species occurrences and
phylogenetic shifts in Mediterranean southern Australia. Journal of Vegetation Science, 25: 338–348. http://dx.doi.org/10.1111/jvs.12111
McCallum K., Guerin G.R., Breed M.F. and Lowe A.J. (2014) Combining population genetics, species distribution modelling and field assessments to
understand a species vulnerability to climate change. Austral Ecology, 39: 17–28. http://dx.doi.org/10.1111/aec.12041
Prior L.D. and Bowman D.M.J.S. (2014) Across a macro-ecological gradient forest competition is strongest at the most productive sites. Frontiers in Plant
Science, 5: 260. (DOI: 10.3389/fpls.2014.00260)
Prior L.D. and Bowman D.M.J.S. (2014) Big eucalypts grow more slowly in a warm climate: evidence of an interaction between tree size and
temperature. Global Change Biology, 20(9): 2793-2799. (DOI: 10.1111/gcb.12540)
Schut A.G.T., Wardell-Johnson G.W., Yates C.J., Keppel G., Baran I., Franklin S.E., Hopper S.D., Van Neil K., Mucina L. and Byrne M. (2014) Rapid
characterisation of vegetation structure to predict refugia and climate change impacts across a global biodiversity hotspot. PLOS ONE, 9: e82778.
(DOI: 10.1371/journal.pone.0082778)
Tapper S-L., Byrne M., Yates C.J., Keppel G., Hopper S.D., Van Niel K., Schut A.G.T., Mucina L. and Wardell-Johnson G.W. (2014) Isolated with persistence or
dynamically connected? Genetic patterns in a common granite outcrop endemic. Diversity and Distributions, 20(9): 987-1001 (DOI:
10.1111/ddi.12185)
Tapper S-L., Byrne M., Yates C.J., Keppel G., Hopper S.D., Van Niel K., Schut A.G.T., Mucina L. and Wardell-Johnson G.W. (2014) Long-term isolation and
persistence of Stypandra glauca R.Br. (Hemerocallidaceae) on granite outcrops in both mesic and arid environments in southwestern Australia.
Journal of Biogeography, 41: 2032-2044. (DOI: 10.1111/jbi.12343)
78. Getting our
message out
• Presentations to
community groups.
• Workshops
• Targeted
presentations (state
agencies, fed Govt.)
• Briefing ministerial
advisors
• Well maintained website
• Conference presentations
• International reference groups /
tours
• Regular TERN Newsletter articles
to large mailing list.
79.
80. About Our Method
• Practicality/pragmatism has had to prevail
• “It’s not about developing the perfect method, but rather
understanding how imperfect the method is.”
Modular Methods
• The method has been designed in modules
• Ease of use in the field
• For your own purposes (not AusPlots funded) there is the
possibility of only including some modules
• For AusPlots and training purposes we will cover all modules
85. Vouchers for genetic and isotope analysis
1. Take around 10 cm2 from
each voucher specimen
2. Place into a synthetic
tea bag and seal
3. Label with adhesive voucher
label and scan with app
4. Place bag in box with ⅓ cup
silica granules (self indicating
and non-indicating granules)
5. Seal box and ensure it is
labelled with plot identifier.
Preferably 1 box per plot.
Change silica every few days
until indicator no longer
changes colour.
6. Samples can then be
used for isotope and
DNA analyses
+ Duplicates for
Dominant
species
86. Laying out the measuring tape between the transect end pegs
First point taken at the ‘0’ Meter mark
Point Intercept
88. Assesses canopy cover above the device
Indicates height
Assesses Cover below the device
Field Cover Assessment Device
(Gandalf’s Staff)
Any vegetation touching the
device between the laser
pointer and the densitometer is
also included
89. In this example the substrate is litter as that
is what the laser is intersecting
Height is read from the staff
90. Assessing Cover
above the device
• Uses a
densitometer
• Ensure the
device is level
using the bubble
level
• Use the cross
hairs and small
circle to identify
what is
intersected.
105. Ways it is currently obtained
10
5
Basal Wedge
DBH Measurement
Terrestrial LiDAR
106. An Alternative:
A New Photopoint method
Photo Layout
10
6
•24mm Focal Length
•Aperture = F11
•ISO 100
•Raw Format (+/- JPG)
•1.3m to centre of lens
•Calibration target used
•2.5m Baseline
•DGPS Location recorded
107. A New Photopoint method
The Tripod
10
7
Tripod and
Star Picket
setup
If terrain not flat
then attempt to
copy the average
slope.
109. The Scene Reconstruction Process
10
9
Identifes Like features in images pairs
Uses this to calculate camera location
Using Camera location information projects information into
3d space
110. DBH Calculations
Trunks then identified Spectrally, but including 3D
information
A Cylinder is fitted to each trunk
The Cylinder is cut at 1.3m (DBH) and the area of the
cross section is calculated (DBH for the individual tree)
These DBH’s are then summed for the whole site.
Currently hasa max depth of view, but improvements
being worked on.
116. Future work
11
6
Take account of Occlusion
Trial and accuracy assess in a variety of ecosystems
Determine method variation needed for different environments
Automate processing (Work Commenced)
– Submission for the public using a web interface
Manage Huge Datasets
Process our archive of 300+ Sites
With your help: Assess performance in snow
Non – Australian environments
Performance in urban environments.
118. How to get samples
At Present have collected approximately:
>10,000 Soil samples
~2700 Soil metagenomic Samples
>15000 Voucher specimens
~ 15000 Genetic Samples
~ 16000 Dominant Genetic replicates
All of which can be access following standard protocols
Information pack available for download at our website
Details how to get access.
119. What can AusPlots offer you?
www.ausplots.org.au
For details including Volunteering, HDR, Data, methods,
Samples, Training, App etc.
Ben.sparrow@adelaide.edu.au
08 8313 1201