SlideShare a Scribd company logo
1 of 38
Summary of Chapter 5
In chapter five of The Signal and the Noise, the author Nate
Silver explains the difficulties of predicting earthquakes. Due to
the lack of comprehensive understanding of earth’s crust,
seismologists are unable to make timely predictions on
earthquakes. Many people have tried but failed, and their false
predictions cause huge consequences. Giampaolo Giuliani’s
false alarm prediction caused the public to panic and put the
local government under high pressure. Fear of making another
false alarm warning, the authority hesitated to issue an
earthquake warning when the real earthquake hit, causing huge
casualties and severe damage to the city. Other examples of
failed predictions mentioned by Silver include Brain Brandy’s
prediction on Lima Peru, Parkfield, and Mojave Desert,
California. Although the current technologies and
understandings are insufficient to predict earthquakes,
seismologists can forecast earthquakes in a larger time frame
using statistical analysis. In the chapter, Silver also discusses
the current model and method used by seismologists to forecast
and the downside of this approach.
One of the key challenges with earthquake predictions is the
narrow definition of prediction. According to Silver, prediction
and forecast have different meanings in seismology. Prediction
needs to be accurate to a given time and place. Forecast, on the
other hand, can simply be a probability over a long timeframe.
Given the high accuracy requirement in seismology, earthquake
prediction seems impossible with the current technology,
Another difficulty with earthquake prediction is the lack of
observation of the earth's crust. Similar to the weather forecast,
Chaos theory applies to seismic activities as well, meaning one
crustal activity might lead to another. Unlike the weather, the
earth's crust is underneath the earth, making it difficult to
observe. Due to a lack of understanding, seismologists depend
solely on statistical methods to forecast future earthquakes.
Since the statistical method only provides the probability of the
event, thus, with the current technology, seismologists are not
able to predict earthquakes.
Furthermore, there are many downsides to the current statistical
model. The earthquake model, Gutenberg-Richter law, uses
historical earthquake data to identify earthquake patterns and
then calculates the probability of earthquakes. However, some
major earthquakes only happen once in a thousand years. With
limited data, the pattern generated is not as accurate because the
model might treat those rare events as outliers. Oftentimes,
those outliers got ignored. The earthquake that struck Tohoku
Japan is a classic example of ignoring the outlier as
seismologists believed that it was rare. Semistoligists did pick
up some patterns of the foreshock. However, the pattern of the
foreshock was not as discernable, and thus it was overlooked.
As a result, the earthquake caused severe damage. One lesson
from the Tohoku earthquake is that every data point should not
be overlooked. Sometimes, patterns are not as obvious as the
public expects. Even some semiologists tried to find the perfect
pattern by manipulating the data because it would give them a
good reputation in the academic world. However, the perfect
pattern found by overfitting or underfitting the data usually
produces less accurate forecasts, which do more harm to the
public.
Since earthquake prediction is still at the preliminary stage, one
way to reduce the catastrophic damage caused by earthquakes is
through government policies. Silver mentions one of the best
measures can be to increase the readiness for earthquakes. Some
of the sample policies to improve readiness include setting an
earthquake-resisting building requirement in areas where
earthquakes are likely to happen to reduce the damage to
housing; issuing earthquake protocols and instructions to local
government; setting a minimum requirement on the emergency
supplies needed to be stocked by each city; educating the public
on how to evacuate when an earthquake strikes. Another
measure the government should take is to carefully evaluate the
forecast before issuing an earthquake warning to avoid causing
public panic.
The key takeaway from Chapter 5 is when using a statistical
model to forecast the future try to avoid finding the perfect
pattern by manipulating data. The real world is more
complicated than the model and often filled with outliers.
Moreover, sometimes patterns are less discernable and to be
sure to examine all data points carefully.
6
HOW TO DROWN IN THREE
FEET OF WATER
Political polls are dutifully reported with a margin of error,
which gives us a clue that they contain some uncertainty. Most
of
the time when an economic prediction is presented, however,
only a single number is mentioned. The economy will create
150,000 jobs next month. GDP will grow by 3 percent next year.
Oil will rise to $120 per barrel.
This creates the perception that these forecasts are amazingly
accurate. Headlines expressing surprise at any minor deviation
from the prediction are common in coverage of the economy:
Unexpected Jump in Unemployment
Rate to 9.2% Stings Markets
---Denver Post, July 9, 20111
If you read the fine print of that article, you'd discover that the
"unexpected" result was that the unemployment rate had come
in
at 9.2 percent---rather than 9.1 percent2 as economists had
forecasted. If a one-tenth of a percentage point error is enough
to
make headlines, it seems like these forecasts must ordinarily be
very reliable.
Instead, economic forecasts are blunt instruments at best,
rarely being able to anticipate economic turning points more
than
a few months in advance. Fairly often, in fact, these forecasts
have failed to "predict" recessions even once they were already
under way: a majority of economists did not think we were in
one when the three most recent recessions, in 1990, 2001, and
2007, were later determined to have begun.3
Forecasting something as large and complex as the American
economy is a very challenging task. The gap between how well
these forecasts actually do and how well they are perceived to
do is substantial.
Some economic forecasters wouldn't want you to know that.
Like forecasters in most other disciplines, they see uncertainty
as
the enemy---something that threatens their reputation. They
don't
estimate it accurately, making assumptions that lower the
amount
of uncertainty in their forecast models but that don't improve
their predictions in the real world. This tends to leave us less
prepared when a deluge hits.
The Importance of Communicating Uncertainty
In April 1997, the Red River of the North flooded Grand Forks,
North Dakota, overtopping the town's levees and spilling more
than two miles into the city.*4 Although there was no loss of
life,
nearly all of the city's 50,000 residents had to be evacuated,
cleanup costs ran into the billions of dollars,5 and 75 percent of
the city's homes were damaged or destroyed.6
Unlike a hurricane or an earthquake, the Grand Forks flood
may have been a preventable disaster. The city's floodwalls
could have been reinforced using sandbags.7 It might also have
been possible to divert the overflow into depopulated areas---
into farmland instead of schools, churches, and homes.
Residents of Grand Forks had been aware of the flood threat
for months. Snowfall had been especially heavy in the Great
Plains that winter, and the National Weather Service,
anticipating runoff as the snow melted, had predicted the waters
of the Red River would crest to forty-nine feet, close to the
alltime record.
There was just one small problem. The levees in Grand Forks
had been built to handle a flood of fifty-one feet. Even a small
miss in the forty-nine-foot prediction could prove catastrophic.
In fact, the river crested to fifty-four feet. The Weather
Service's forecast hadn't been perfect by any means, but a five-
foot miss, two months in advance of a flood, is pretty
reasonable---about as well as these predictions had done on
average historically. The margin of error on the Weather
Service's forecast---based on how well their flood forecasts had
done in the past---was about plus or minus nine feet. That
implied about a 35 percent chance of the levees being
overtopped.8
FIGURE 6-1: FLOOD PREDICTION WITH MARGIN OF
ERROR9
The problem is that the Weather Service had explicitly
avoided communicating the uncertainty in their forecast to the
public, emphasizing only the forty-nine-foot prediction. The
forecasters later told researchers that they were afraid the
public
might lose confidence in the forecast if they had conveyed any
uncertainty in the outlook.
Instead, of course, it would have made the public much better
prepared---and possibly able to prevent the flooding by
reinforcing the levees or diverting the river flow. Left to their
own devices, many residents became convinced they didn't have
anything to worry about. (Very few of them bought flood
insurance.10) A prediction of a forty-nine-foot crest in the
river,
expressed without any reservation, seemed to imply that the
flood would hit forty-nine feet exactly; the fifty-one-foot levees
would be just enough to keep them safe. Some residents even
interpreted the forecast of forty-nine feet as representing the
maximum possible extent of the flood.11
An oft-told joke: a statistician drowned crossing a river that
was only three feet deep on average. On average, the flood
might be forty-nine feet in the Weather Service's forecast
model,
but just a little bit higher and the town would be inundated.
The National Weather Service has since come to recognize
the importance of communicating the uncertainty in their
forecasts accurately and honestly to the public, as we saw in
chapter 4. But this sort of attitude is rare among other kinds of
forecasters, especially when they predict the course of the
economy.
Are Economists Rational?
Now consider what happened in November 2007. It was just one
month before the Great Recession officially began. There were
already clear signs of trouble in the housing market:
foreclosures
had doubled,12 and the mortgage lender Countrywide was on
the
verge of bankruptcy.13 There were equally ominous signs in
credit markets.14
Economists in the Survey of Professional Forecasters, a
quarterly poll put out by the Federal Reserve Bank of
Philadelphia, nevertheless foresaw a recession as relatively
unlikely. Instead, they expected the economy to grow at a just
slightly below average rate of 2.4 percent in 2008. And they
thought there was almost no chance of a recession as severe as
the one that actually unfolded.
The Survey of Professional Forecasters is unique in that it
asks economists to explicitly indicate a range of outcomes for
where they see the economy headed. As I have emphasized
throughout this book, a probabilistic consideration of outcomes
is an essential part of a scientific forecast. If I asked you to
forecast the total that will be produced when you roll a pair of
six-sided dice, the correct answer is not any single number but
an enumeration of possible outcomes and their respective
probabilities, as in figure 6-2. Although you will roll 7 more
often than any other number, it is not intrinsically any more or
any less consistent with your forecast than a roll of 2 or 12,
provided that each number comes up in accordance with the
probability you assign it over the long run.
The economists in the Survey of Professional Forecasters are
asked to do something similar when they forecast GDP and
other
variables---estimating, for instance, the probability that GDP
might come in at between 2 percent and 3 percent, or between 3
percent and 4 percent. This is what their forecast for GDP
looked like in November 2007 (figure 6-3):
As I mentioned, the economists in this survey thought that
GDP would end up at about 2.4 percent in 2008, slightly below
its long-term trend. This was a very bad forecast: GDP actually
shrank by 3.3 percent once the financial crisis hit. What may be
worse is that the economists were extremely confident in their
bad prediction. They assigned only a 3 percent chance to the
economy's shrinking by any margin over the whole of 2008.15
And they gave it only about a 1-in-500 chance of shrinking by
at
least 2 percent, as it did.16
Indeed, economists have for a long time been much too
confident in their ability to predict the direction of the
economy.
In figure 6-4, I've plotted the forecasts of GDP growth from the
Survey of Professional Forecasters for the eighteen years
between 1993 and 2010.17 The bars in the chart represent the 90
percent prediction intervals as stated by the economists.
A prediction interval is a range of the most likely outcomes
that a forecast provides for, much like the margin of error in a
poll. A 90 percent prediction interval, for instance, is supposed
to cover 90 percent of the possible real-world outcomes, leaving
only the 10 percent of outlying cases at the tail ends of the
distribution. If the economists' forecasts were as accurate as
they
claimed, we'd expect the actual value for GDP to fall within
their prediction interval nine times out of ten, or all but about
twice in eighteen years.
FIGURE 6-4: GDP FORECASTS: 90 PERCENT PREDICTION
INTERVALS AGAINST ACTUAL
RESULTS
In fact, the actual value for GDP fell outside the economists'
prediction interval six times in eighteen years, or fully one-third
of the time. Another study, 18 which ran these numbers back to
the
beginnings of the Survey of Professional Forecasters in 1968,
found even worse results: the actual figure for GDP fell outside
the prediction interval almost half the time. There is almost no
chance19 that the economists have simply been unlucky; they
fundamentally overstate the reliability of their predictions.
In reality, when a group of economists give you their GDP
forecast, the true 90 percent prediction interval---based on how
these forecasts have actually performed20 and not on how
accurate the economists claim them to be---spans about 6.4
points of GDP (equivalent to a margin of error of plus or minus
3.2 percent).*
When you hear on the news that GDP will grow by 2.5
percent next year, that means it could quite easily grow at a
spectacular rate of 5.7 percent instead. Or it could fall by 0.7
percent---a fairly serious recession. Economists haven't been
able to do any better than that, and there isn't much evidence
that
their forecasts are improving. The old joke about economists'
having called nine out of the last six recessions correctly has
some truth to it; one actual statistic is that in the 1990s,
economists predicted only 2 of the 60 recessions around the
world a year ahead of time.21
Economists aren't unique in this regard. Results like these are
the rule; experts either aren't very good at providing an honest
description of the uncertainty in their forecasts, or they aren't
very interested in doing so. This property of overconfident
predictions has been identified in many other fields, including
medical research, political science, finance, and psychology. It
seems to apply both when we use our judgment to make a
forecast (as Phil Tetlock's political scientists did) and when we
use a statistical model to do so (as in the case of the failed
earthquake forecasts that I described in chapter 5).
But economists, perhaps, have fewer excuses than those in
other professions for making these mistakes. For one thing,
their
predictions have not just been overconfident but also quite poor
in a real-world sense, often missing the actual GDP figure by a
very large and economically meaningful margin. For another,
organized efforts to predict variables like GDP have been
around for many years, dating back to the Livingston Survey in
1946, and these results are well-documented and freely
available. Getting feedback about how well our predictions have
done is one way---perhaps the essential way---to improve them.
Economic forecasters get more feedback than people in most
other professions, but they haven't chosen to correct for their
bias toward overconfidence.
Isn't economics supposed to be the field that studies the
rationality of human behavior? Sure, you might expect someone
in another field---an anthropologist, say---to show bias when he
makes a forecast. But not an economist.
Actually, however, that may be part of the problem.
Economists understand a lot about rationality---which means
they also understand a lot about how our incentives work. If
they're making biased forecasts, perhaps this is a sign that they
don't have much incentive to make good ones.
"Nobody Has a Clue"
Given the track record of their forecasts, there was one type of
economist I was most inclined to seek out---an economist who
would be honest about how difficult his job is and how easily
his forecast might turn out to be wrong. I was able to find one:
Jan Hatzius, the chief economist at Goldman Sachs.
Hatzius can at least claim to have been more reliable than his
competitors in recent years. In November 2007, a time when
most economists still thought a recession of any kind to be
unlikely, Hatzius penned a provocative memo entitled
"Leveraged Losses: Why Mortgage Defaults Matter." It warned
of a scenario in which millions of homeowners could default on
their mortgages and trigger a domino effect on credit and
financial markets, producing trillions of dollars in losses and a
potentially very severe recession---pretty much exactly the
scenario that unfolded. Hatzius and his team were also quick to
discount the possibility of a miraculous postcrisis recovery. In
February 2009, a month after the stimulus package had been
passed and the White House had claimed it would reduce
unemployment to 7.8 percent by the end of 2009, Hatzius
projected unemployment to rise to 9.5 percent22 (quite close to
the actual figure of 9.9 percent).
Hatzius, a mellow to the point of melancholy German who
became Goldman Sachs's chief economist in 2005,23 eight years
after starting at the firm, draws respect even from those who
take
a skeptical view of the big banks. "[Jan is] very good," Paul
Krugman told me. "I hope that Lloyd Blankfein's malevolence
won't spill over to Jan and his people." Hatzius also has a
refreshingly humble attitude about his ability to forecast the
direction of the U.S. economy.
"Nobody has a clue," he told me when I met him at Goldman's
glassy office on West Street in New York. "It's hugely difficult
to forecast the business cycle. Understanding an organism as
complex as the economy is very hard."
As Hatzius sees it, economic forecasters face three
fundamental challenges. First, it is very hard to determine cause
and effect from economic statistics alone. Second, the economy
is always changing, so explanations of economic behavior that
hold in one business cycle may not apply to future ones. And
third, as bad as their forecasts have been, the data that
economists have to work with isn't much good either.
Correlations Without Causation
The government produces data on literally 45,000 economic
indicators each year.24 Private data providers track as many as
four million statistics.25 The temptation that some economists
succumb to is to put all this data into a blender and claim that
the
resulting gruel is haute cuisine. There have been only eleven
recessions since the end of World War II. 26 If you have a
statistical model that seeks to explain eleven outputs but has to
choose from among four million inputs to do so, many of the
relationships it identifies are going to be spurious. (This is
another classic case of overfitting---mistaking noise for a
signal-
--the problem that befell earthquake forecasters in chapter 5.)
Consider how creative you might be when you have a stack of
economic variables as thick as a phone book. A once-famous
"leading indicator" of economic performance, for instance, was
the winner of the Super Bowl. From Super Bowl I in 1967
through Super Bowl XXXI in 1997, the stock market27 gained
an
average of 14 percent for the rest of the year when a team from
the original National Football League (NFL) won the game.28
But
it fell by almost 10 percent when a team from the original
American Football League (AFL) won instead.
Through 1997, this indicator had correctly "predicted" the
direction of the stock market in twenty-eight of thirty-one
years.
A standard test of statistical significance,29 if taken literally,
would have implied that there was only about a 1-in-4,700,000
possibility that the relationship had emerged from chance alone.
I t was just a coincidence, of course. And eventually, the
indicator began to perform badly. In 1998, the Denver Broncos,
an original AFL team, won the Super Bowl---supposedly a bad
omen. But rather than falling, the stock market gained 28
percent
amid the dot-com boom. In 2008, the NFL's New York Giants
came from behind to upset the AFL's New England Patriots on
David Tyree's spectacular catch---but Tyree couldn't prevent the
collapse of the housing bubble, which caused the market to
crash
by 35 percent. Since 1998, in fact, the stock market has done
about 10 percent better when the AFL team won the Super
Bowl, exactly the opposite of what the indicator was fabled to
predict.
How does an indicator that supposedly had just a 1-in-
4,700,000 chance of failing flop so badly? For the same reason
that, even though the odds of winning the Powerball lottery are
only 1 chance in 195 million,30 somebody wins it every few
weeks. The odds are hugely against any one person winning the
lottery---but millions of tickets are bought, so somebody is
going
to get lucky. Likewise, of the millions of statistical indicators in
the world, a few will have happened to correlate especially
well with stock prices or GDP or the unemployment rate. If not
the winner of the Super Bowl, it might be chicken production in
Uganda. But the relationship is merely coincidental.
Although economists might not take the Super Bowl indicator
seriously, they can talk themselves into believing that other
types
of variables---anything that has any semblance of economic
meaning---are critical "leading indicators" foretelling a
recession or recovery months in advance. One forecasting firm
brags about how it looks at four hundred such variables,31 far
more than the two or three dozen major ones that Hatzius says
contain most of the economic substance.* Other forecasters
have
touted the predictive power of such relatively obscure indicators
as the ratio of bookings-to-billings at semiconductor
companies.32 With so many economic variables to pick from,
you're sure to find something that fits the noise in the past data
well.
It's much harder to find something that identifies the signal;
variables that are leading indicators in one economic cycle often
turn out to be lagging ones in the next. Of the seven so-called
leading indicators in a 2003 Inc. magazine article,33 all of
which
had been good predictors of the 1990 and 2001 recessions, only
two---housing prices and temporary hiring---led the recession
that began in 2007 to any appreciable degree. Others, like
commercial lending, did not begin to turn downward until a year
after the recession began.
Even the well-regarded Leading Economic Index, a composite
of ten economic indicators published by the Conference Board,
has had its share of problems. The Leading Economic Index has
generally declined a couple of months in advance of recessions.
But it has given roughly as many false alarms---including most
infamously in 1984, when it sharply declined for three straight
months,34 signaling a recession, but the economy continued to
zoom upward at a 6 percent rate of growth. Some studies have
even claimed that the Leading Economic Index has no
predictive
power at all when applied in real time.35
"There's very little that's really predictive," Hatzius told me.
"Figuring out what's truly causal and what's correlation is very
difficult to do."
Most of you will have heard the maxim "correlation does not
imply causation." Just because two variables have a statistical
relationship with each other does not mean that one is
responsible for the other. For instance, ice cream sales and
forest fires are correlated because both occur more often in the
summer heat. But there is no causation; you don't light a patch
of
the Montana brush on fire when you buy a pint of Häagen-Dazs.
If this concept is easily expressed, however, it can be hard to
apply in practice, particularly when it comes to understanding
the causal relationships in the economy. Hatzius noted, for
instance, that the unemployment rate is usually taken to be a
lagging indicator. And sometimes it is. After a recession,
businesses may not hire new employees until they are confident
about the prospects for recovery, and it can take a long time to
get all the unemployed back to work again. But the
unemployment rate can also be a leading indicator for consumer
demand, since unemployed people don't have much ability to
purchase new goods and services. During recessions, the
economy can fall into a vicious cycle: businesses won't hire
until
they see more consumer demand, but consumer demand is low
because businesses aren't hiring and consumers can't afford
their
products.
Consumer confidence is another notoriously tricky variable.
Sometimes consumers are among the first to pick up warning
signs in the economy. But they can also be among the last to
detect recoveries, with the public often perceiving the economy
to be in recession long after a recession is technically over.
Thus, economists debate whether consumer confidence is a
leading or lagging indicator,36 and the answer may be
contingent
on the point in the business cycle the economy finds itself at.
Moreover, since consumer confidence affects consumer
behavior, there may be all kinds of feedback loops between
expectations about the economy and the reality of it.
An Economic Uncertainty Principle
Perhaps an even more problematic set of feedback loops are
those between economic forecasts and economic policy. If, for
instance, the economy is forecasted to go into recession, the
government and the Federal Reserve will presumably take steps
to ameliorate the risk or at least soften the blow. Part of the
problem, then, is that forecasters like Hatzius have to predict
political decisions as well as economic ones, which can be a
challenge in a country where the Congress has a 10 percent
approval rating.
But this issue also runs a little deeper. As pointed out by the
Nobel Prize--winning economist Robert Lucas37 in 1976, the
past
data that an economic model is premised on resulted in part
from
policy decisions in place at the time. Thus, it may not be
enough
to know what current policy makers will do; you also need to
know what fiscal and monetary policy looked like during the
Nixon administration. A related doctrine known as Goodhart's
law, after the London School of Economics professor who
proposed it,38 holds that once policy makers begin to target a
particular variable, it may begin to lose its value as an
economic
indicator. For instance, if the government artificially takes steps
to inflate housing prices, they might well increase, but they will
no longer be good measures of overall economic health.
At its logical extreme, this is a bit like the observer effect
(often mistaken for a related concept, the Heisenberg
uncertainty
principle): once we begin to measure something, its behavior
starts to change. Most statistical models are built on the notion
that there are independent variables and dependent variables,
inputs and outputs, and they can be kept pretty much separate
from one another.39 When it comes to the economy, they are all
lumped together in one hot mess.
An Ever-Changing Economy
Even if they could resolve all these problems, economists would
still have to contend with a moving target. The American and
global economies are always evolving, and the relationships
between different economic variables can change over the
course of time.
Historically, for instance, there has been a reasonably strong
correlation between GDP growth and job growth. Economists
refer to this as Okun's law. During the Long Boom of 1947
through 1999, the rate of job growth40 had normally been about
half the rate of GDP growth, so if GDP increased by 4 percent
during a year, the number of jobs would increase by about 2
percent.
The relationship still exists---more growth is certainly better
for job seekers. But its dynamics seem to have changed. After
each of the last couple of recessions, considerably fewer jobs
were created than would have been expected during the Long
Boom years. In the year after the stimulus package was passed
in
2009, for instance, GDP was growing fast enough to create
about
two million jobs according to Okun's law.41 Instead, an
additional 3.5 million jobs were lost during the period.
Economists often debate about what the change means. The
most pessimistic interpretation, advanced by economists
including Jeffrey Sachs of Columbia University, is that the
pattern reflects profound structural problems in the American
economy: among them, increasing competition from other
countries, an imbalance between the service and manufacturing
sectors, an aging population, a declining middle class, and a
rising national debt. Under this theory, we have entered a new
and unhealthy normal, and the problems may get worse unless
fundamental changes are made. "We were underestimating the
role of global change in causing U.S. change," Sachs told me.
"The loss of jobs internationally to China and emerging markets
have really jolted the American economy."
The bigger question is whether the volatility of the 2000s is
more representative of the long-run condition of the economy---
perhaps the long boom years had been the outlier. During the
Long Boom, the economy was in recession only 15 percent of
the
time. But the rate was more than twice that---36 percent---from
1900 through 1945.42
Although most economists believe that some progress has
been made in stabilizing the business cycle, we may have been
lucky to avoid more problems. This particularly holds in the
period between 1983 and 2006---a subset of the Long Boom that
is sometimes called the Great Moderation---when the economy
was in recession just 3 percent of the time. But much of the
growth was fueled by large increases in government and
consumer debt, as well as by various asset-price bubbles.
Advanced economies have no divine right to grow at Great
Moderation rates: Japan's, which grew at 5 percent annually
during the 1980s, has grown by barely one percent per year
since then.43
This may be one reason why forecasters and policy makers
were taken so much by surprise by the depth of the 2007
recession. Not only were they failing to account for events like
the Great Depression*---they were sometimes calibrating their
forecasts according to the Great Moderation years, which were
an outlier, historically speaking.
Don't Throw Out Data
The Federal Open Market Committee, which is charged with
setting interest rates, is required by law to release
macroeconomic forecasts to Congress at least twice per year.
The Fed was in some ways ahead of the curve by late 2007:
their forecasts of GDP growth were slightly more bearish than
those issued by private-sector forecasters, prompting them to
lower interest rates four times toward the end of the year.
Still, in the Fed's extensive minutes from a late October 2007
meeting, the term "recession" was not used even once in its
discussion of the economy.44 The Fed is careful with its
language,
and the possibility of a recession may nevertheless have been
implied through the use of phrases like downside risks. But they
were not betting on a recession (their forecast still projected
growth), and there was little indication that they were
entertaining the possibility of as severe a recession as actually
unfolded.
Part of the reason may have been that the Fed was looking at
data from the Great Moderation years to set their expectations
for the accuracy of their forecasts. In particular, they relied
heavily upon a paper that looked at how economic forecasts had
performed from 1986 through 2006.45 The problem with
looking
at only these years is that they contained very little economic
volatility: just two relatively mild recessions in 1990--1991 and
in 2001. "By gauging current uncertainty with data from the
mid-
1980s on," the authors warned, "we are implicitly assuming that
the calm conditions since the Great Moderation will persist into
the future." This was an awfully big assumption to make. The
Fed may have concluded that a severe recession was unlikely in
2007 in part because they had chosen to ignore years in which
there were severe recessions.
A forecaster should almost never ignore data, especially when
she is studying rare events like recessions or presidential
elections, about which there isn't very much data to begin with.
Ignoring data is often a tip-off that the forecaster is
overconfident, or is overfitting her model---that she is
interested
in showing off rather than trying to be accurate.
In this particular case, it was not obvious that economists had
improved much at forecasting the business cycle. In figure 6-5a,
I've compared predicted levels of GDP growth from the Survey
of Professional Forecasters against the actual figures for the
years 1968 through 1985---these are the years the Fed could
have looked at but chose to throw out. You'll see there's quite a
lot of economic volatility in this period, such as during the
inflation-driven recessions of the mid-1970s and early 1980s.
Still, the results are not completely discouraging for forecasters,
in that the forecasted and actual outcomes have a reasonably
strong correlation with one another.
If you make the same plot for the years 1986 through 2006 (as
in figure 6-5b), you'll find just the reverse. Most of the data
points---both the forecasted values for GDP and the actual ones-
--are bunched closely together in a narrow range between about
2 percent and 5 percent annual growth. Because there was so
little volatility during this time, the average error in the forecast
was less than in the previous period.* However, to the extent
there was any variability in the economy, like the mild
recessions of 1990--91 or in 2001, the forecasts weren't doing a
very good job of capturing it---in fact, there was almost no
correlation between the predicted and actual results. There was
little indication that economists had become more skilled at
forecasting the course of the economy. Instead, their jobs had
become temporarily easier because of the calm economic winds,
as a weather forecaster in Honolulu faces an easier task than
one
in Buffalo.
The other rationale you'll sometimes hear for throwing out
data is that there has been some sort of fundamental shift in the
problem you are trying to solve. Sometimes these arguments are
valid to a certain extent: the American economy is a constantly
evolving thing and periodically undergoes structural shifts
(recently, for instance, from an economy dominated by
manufacturing to one dominated by its service sector). This isn't
baseball, where the game is always played by the same rules.
The problem with this is that you never know when the next
paradigm shift will occur, and whether it will tend to make the
economy more volatile or less so, stronger or weaker. An
economic model conditioned on the notion that nothing major
will change is a useless one. But anticipating these turning
points
is not easy.
Economic Data Is Very Noisy
The third major challenge for economic forecasters is that their
raw data isn't much good. I mentioned earlier that economic
forecasters rarely provide their prediction intervals when they
produce their forecasts---probably because doing so would
undermine the public's confidence in their expertise. "Why do
people not give intervals? Because they're embarrassed,"
Hatzius says. "I think that's the reason. People are
embarrassed."
The uncertainty, however, applies not just to economic
forecasts but also to the economic variables themselves. Most
economic data series are subject to revision, a process that can
go on for months and even years after the statistics are first
published. The revisions are sometimes enormous.46 One
somewhat infamous example was the government's estimate of
GDP growth in the last quarter of 2008. Initially reported as
"only" a 3.8 percent rate of decline, the economy is now
believed to have been declining at almost 9 percent. Had they
known the real size of the economic hole, the White House's
economists might have pushed for a larger stimulus package in
January 2009, or they might have realized how deep the
problems were and promoted a longer-term solution rather than
attempting a quick fix.
Large errors like these have been fairly common. Between
1965 and 2009,47 the government's initial estimates of quarterly
GDP were eventually revised, on average, by 1.7 points. That is
the average change; the range of possible changes in each
quarterly GDP is higher still, and the margin of error 48 on an
initial quarterly GDP estimate is plus or minus 4.3 percent. That
means there's a chance that the economy will turn out to have
been in recession even if the government had initially reported
above-average growth, or vice versa. The government first
reported that the economy had grown by 4.2 percent in the
fourth
quarter of 1977, for instance, but that figure was later revised to
negative 0.1 percent.49
So we should have some sympathy for economic forecasters.50
It's hard enough to know where the economy is going. But it's
much, much harder if you don't know where it is to begin with.
A Butterfly Flaps Its Wings in Brazil and Someone
Loses a Job in Texas
The challenge to economists might be compared to the one
faced
by weather forecasters. They face two of the same fundamental
problems.
First, the economy, like the atmosphere, is a dynamic system:
everything affects everything else and the systems are
perpetually in motion. In meteorology, this problem is quite
literal, since the weather is subject to chaos theory---a butterfly
flapping its wings in Brazil can theoretically cause a tornado in
Texas. But in loosely the same way, a tsunami in Japan or a
longshoreman's strike in Long Beach can affect whether
someone
in Texas finds a job.
Second, weather forecasts are subject to uncertain initial
conditions. The probabilistic expression of weather forecasts
("there's a 70 percent chance of rain") arises not because there
is
any inherent randomness in the weather. Rather, the problem is
that meteorologists assume they have imprecise measurements
of
what the initial conditions were like, and weather patterns
(because they are subject to chaos theory) are extremely
sensitive to changes in the initial conditions. In economic
forecasting, likewise, the quality of the initial data is frequently
quite poor.
Weather prediction, however, is one of the real success
stories in this book. Forecasts of everything from hurricane
trajectories to daytime high temperatures have gotten much
better
than they were even ten or twenty years ago, thanks to a
combination of improved computer power, better data-collection
methods, and old-fashioned hard work.
The same cannot be said for economic forecasting. Any
illusion that economic forecasts were getting better ought to
have
been shattered by the terrible mistakes economists made in
advance of the recent financial crisis.51
If the meteorologist shares some of the economist's problems
of a dynamic system with uncertain initial conditions, she has a
wealth of hard science to make up for it. The physics and
chemistry of something like a tornado are not all that
complicated. That does not mean that tornadoes are easy to
predict. But meteorologists have a strong fundamental
understanding of what causes tornadoes to form and what causes
them to dissipate.
Economics is a much softer science. Although economists
have a reasonably sound understanding of the basic systems that
govern the economy, the cause and effect are all blurred
together, especially during bubbles and panics when the system
is flushed with feedback loops contingent on human behavior.
Nevertheless, if discerning cause and effect is difficult for
economists, it is probably better to try than just give up.
Consider again, for instance, what Hatzius wrote on November
15, 2007:
The likely mortgage credit losses pose a significantly
bigger macroeconomic risk than generally recognized.
. . . The macroeconomic consequences could be quite
dramatic. If leveraged investors see $200 [billion in]
aggregate credit loss, they might need to scale back
their lending by $2 trillion. This is a large shock. . . . It
is easy to see how such a shock could produce a
substantial recession or a long period of very sluggish
growth.
Consumers had been extended too much credit, Hatzius wrote,
to pay for homes that the housing bubble had made
unaffordable.
Many of them had stopped making their mortgage payments,
and
there were likely to be substantial losses from this. The degree
of leverage in the system would compound the problem,
paralyzing the credit market and the financial industry more
broadly. The shock might be large enough to trigger a severe
recession.
And this is exactly how the financial crisis played out. Not
only was Hatzius's forecast correct, but it was also right for the
right reasons, explaining the causes of the collapse and
anticipating the effects. Hatzius refers to this chain of cause and
effect as a "story." It is a story about the economy---and
although
it might be a data-driven story, it is one grounded in the real
world.
In contrast, if you just look at the economy as a series of
variables and equations without any underlying structure, you
are
almost certain to mistake noise for a signal and may delude
yourself (and gullible investors) into thinking you are making
good forecasts when you are not. Consider what happened to
one
of Hatzius's competitors, the forecasting firm ECRI.
In September 2011, ECRI predicted a near certainty of a
"double dip" recession. "There's nothing that policy makers can
do to head it off," it advised.52 "If you think this is a bad
economy, you haven't seen anything yet." In interviews, the
managing director of the firm, Lakshman Achuthan, suggested
the
recession would begin almost immediately if it hadn't started
already.53 The firm described the reasons for its prediction in
this
way:
ECRI's recession call isn't based on just one or two
leading indexes, but on dozens of specialized leading
indexes, including the U.S. Long Leading Index . . . to
be followed by downturns in the Weekly Leading
Index and other shorter-leading indexes. In fact, the
most reliable forward-looking indicators are now
collectively behaving as they did on the cusp of full-
blown recessions.54
There's plenty of jargon, but what is lacking in this description
is any actual economic substance. Theirs was a story about data-
--as though data itself caused recessions---and not a story about
the economy. ECRI actually seems quite proud of this approach.
"Just as you do not need to know exactly how a car engine
works
in order to drive safely," it advised its clients in a 2004 book,
"You do not need to understand all the intricacies of the
economy to accurately read those gauges."55
This kind of statement is becoming more common in the age of
Big Data.56 Who needs theory when you have so much
information? But this is categorically the wrong attitude to take
toward forecasting, especially in a field like economics where
the data is so noisy. Statistical inferences are much stronger
when backed up by theory or at least some deeper thinking
about
their root causes. There were certainly reasons for economic
pessimism in September 201157---for instance, the unfolding
debt
crisis in Europe---but ECRI wasn't looking at those. Instead, it
had a random soup of variables that mistook correlation for
causation.58
Indeed, the ECRI forecast seemed to demark an economic
turning point---but it was a positive one. The S&P 500 gained
21
percent in the five months after ECRI announced its recession
call,59 while GDP growth registered at a fairly healthy clip of
3.0
percent in the last quarter of 2011 instead of going into
recession. ECRI kicked the can down the road, "clarifying" the
call to say that it extended all the way into 2012 even though
this
is not what they had implied originally.60
When Biased Forecasts Are Rational
If you're looking for an economic forecast, the best place to turn
is the average or aggregate prediction rather than that of any
one
economist. My research into the Survey of Professional
Forecasters suggests that these aggregate forecasts are about 20
percent more accurate61 than the typical individual's forecast at
predicting GDP, 10 percent better at predicting unemployment,
and 30 percent better at predicting inflation. This property---
group forecasts beat individual ones---has been found to be true
in almost every field in which it has been studied.
And yet while the notion that aggregate forecasts beat
individual ones is an important empirical regularity, it is
sometimes used as a cop-out when forecasts might be improved.
The aggregate forecast is made up of individual forecasts; if
those improve, so will the group's performance. Moreover, even
the aggregate economic forecasts have been quite poor in any
real-world sense, so there is plenty of room for progress.
Most economists rely on their judgment to some degree when
they make a forecast, rather than just take the output of a
statistical model as is. Given how noisy the data is, this is
probably helpful. A study62 by Stephen K. McNess, the former
vice president of the Federal Reserve Bank of Boston, found
that
judgmental adjustments to statistical forecasting methods
resulted in forecasts that were about 15 percent more accurate.
The idea that a statistical model would be able to "solve" the
problem of economic forecasting was somewhat in vogue during
the 1970s and 1980s when computers came into wider use. But
as was the case in other fields, like earthquake forecasting
during that time period, improved technology did not cover for
the lack of theoretical understanding about the economy; it only
gave economists faster and more elaborate ways to mistake
noise for a signal. Promising-seeming models failed badly at
some point or another and were consigned to the dustbin.63
Invoking one's judgment, however, also introduces the
potential for bias. You may make the forecast that happens to fit
your economic incentives or your political beliefs. Or you may
be too proud to change your story even when the facts and
circumstances demand it. "I do think that people have the
tendency, which needs to be actively fought," Hatzius told me,
"to see the information flow the way you want to see it."
Are some economists better at managing this trade-off than
others? Is the economist who called the last recession right
more
likely to get the next one too? This question has an interesting
answer.
Statistical tests designed to identify predictive skill have
generally come up with negative results when applied to the
Survey of Professional Forecasters.64 That is, if you look at
that
survey, there doesn't seem to be much evidence that some
economists are consistently better than others. Studies of
another
panel, the Blue Chip Economic Survey, have more often come
up
with positive findings, however.65 There is clearly a lot of luck
involved in economic forecasting---economists who are
permanently bearish or bullish are guaranteed to be right every
now and then. But the studies of the Blue Chip panel seem to
find
that some economists do a little bit better than others over the
long run.
What is the difference between the two surveys? The Survey
of Professional Forecasters is conducted anonymously: each
economist is assigned a random ID number that remains
constant
from survey to survey, but nothing is revealed about just who he
is or what he does. In the Blue Chip panel, on the other hand,
everybody's forecast has his name and reputation attached to it.
When you have your name attached to a prediction, your
incentives may change. For instance, if you work for a poorly
known firm, it may be quite rational for you to make some wild
forecasts that will draw big attention when they happen to be
right, even if they aren't going to be right very often. Firms like
Goldman Sachs, on the other hand, might be more conservative
in order to stay within the consensus.
Indeed, this exact property has been identified in the Blue
Chip forecasts:66 one study terms the phenomenon "rational
bias."67 The less reputation you have, the less you have to lose
by
taking a big risk when you make a prediction. Even if you know
that the forecast is dodgy, it might be rational for you to go
after
the big score. Conversely, if you have already established a
good reputation, you might be reluctant to step too far out of
line
even when you think the data demands it.
Either of these reputational concerns potentially distracts you
from the goal of making the most honest and accurate forecasts-
--
and they probably worsen forecasts on balance. Although the
differences are modest, historically the anonymous participants
in the Survey of Professional Forecasters have done slightly
better at predicting GDP and unemployment than the reputation-
minded Blue Chip panelists.68
Overcoming Bias
If it can be rational to produce bad forecasts, that implies there
are consumers of these forecasts who aid and abet them. Just as
there are political pundits who make careers out of making
implausible claims to partisan audiences, there are bears, bulls,
and contrarians who will always have a constituency in the
marketplace for economic ideas. (Sometimes economic forecasts
have expressly political purposes too. It turns out that the
economic forecasts produced by the White House, for instance,
have historically been among the least accurate of all,69
regardless of whether it's a Democrat or a Republican in
charge.)
When it comes to economic forecasting, however, the stakes
are higher than for political punditry. As Robert Lucas pointed
out, the line between economic forecasting and economic policy
is very blurry; a bad forecast can make the real economy worse.
There may be some hope at the margin for economic
forecasting to benefit from further technological improvements.
Things like Google search traffic patterns, for instance, can
serve as leading indicators for economic data series like
unemployment.
"The way we think about it is if you take something like initial
claims on unemployment insurance, that's a very good predictor
for unemployment rates, which is a good predictor for economic
activity," I was told by Google's chief economist, Hal Varian, at
Google's headquarters in Mountain View, California. "We can
predict unemployment initial claims earlier because if you're in
a company and a rumor goes around that there are going to be
layoffs, then people start searching 'where's the unemployment
office,' 'how am I going to apply for unemployment,' and so on.
It's a slightly leading indicator."
Still, the history of forecasting in economics and other fields
suggests that technological improvements may not help much if
they are offset by human biases, and there is little indication
that
economic forecasters have overcome these. For instance, they
do
not seem to have been chastened much by their experience with
the Great Recession. If you look at the forecasts for GDP
growth
that the Survey of Professional Forecasters made in November
2011 (figure 6-6), it still exhibited the same tendency toward
overconfidence that we saw in 2007, with forecasters
discounting both upside and downside economic scenarios far
more than is justified by the historical accuracy of their
forecasts.70
If we want to reduce these biases---we will never be rid of
them entirely---we have two fundamental alternatives. One
might
be thought of as a supply-side approach---creating a market for
accurate economic forecasts. The other might be a demand-side
alternative: reducing demand for inaccurate and overconfident
ones.
Robin Hanson, an economist at George Mason University, is
an advocate of the supply-side alternative. I met him for lunch
at
one of his favorite Moroccan places in northern Virginia. He's
in
his early fifties but looks much younger (despite being quite
bald), and is a bit of an eccentric. He plans to have his head
cryogenically frozen when he dies.71 He is also an advocate of
a
system he calls "futarchy" in which decisions on policy issues
are made by prediction markets72 rather than politicians. He is
clearly not a man afraid to challenge the conventional wisdom.
Instead, Hanson writes a blog called Overcoming Bias, in which
he presses his readers to consider which cultural taboos,
ideological beliefs, or misaligned incentives might constrain
them from making optimal decisions.
"I think the most interesting question is how little effort we
actually put into forecasting, even on the things we say are
important to us," Hanson told me as the food arrived.
"In an MBA school you present this image of a manager as a
great decision maker---the scientific decision maker. He's got
his spreadsheet and he's got his statistical tests and he's going to
weigh the various options. But in fact real management is
mostly
about managing coalitions, maintaining support for a project so
it
doesn't evaporate. If they put together a coalition to do a
project,
and then at the last minute the forecasts fluctuate, you can't
dump
the project at the last minute, right?
"Even academics aren't very interested in collecting a track
record of forecasts---they're not very interested in making clear
enough forecasts to score," he says later. "What's in it for them?
The more fundamental problem is that we have a demand for
experts in our society but we don't actually have that much of a
demand for accurate forecasts."
Hanson, in order to address this deficiency, is an advocate of
prediction markets---systems where you can place bets on a
particular economic or policy outcome, like whether Israel will
go to war with Iran, or how much global temperatures will rise
because of climate change. His argument for these is pretty
simple: they ensure that we have a financial stake in being
accurate when we make forecasts, rather than just trying to look
good to our peers.
We will revisit the idea of prediction markets in chapter 11;
they are not a panacea, particularly if we make the mistake of
assuming that they can never go wrong. But as Hansen says,
they
can yield some improvement by at least getting everyone's
incentives in order.
One of the most basic applications might simply be markets
for predicting macroeconomic variables like GDP and
unemployment. There are already a variety of direct and
indirect
ways to bet on things like inflation, interest rates, and
commodities prices, but no high-volume market for GDP exists.
There could be a captive audience for these markets: common
stocks have become more highly correlated with macroeconomic
risks in recent years,73 so they could provide a means of
hedging
against them. These markets would also provide real-time
information to policy makers, essentially serving as
continuously
updated forecasts of GDP. Adding options to the markets---bets
on, say, whether GDP might grow by 5 percent, or decline by 2
percent---would punish overconfident forecasters and yield
more reliable estimates of the uncertainties inherent in
forecasting the economy.
The other solution, the "demand-side" approach, is slower
and more incremental. It simply means that we have to be better
consumers of forecasts. In the context of the economic
forecasting, that might mean turning the spotlight away from
charlatans with "black box" models full of random assortments
of leading indicators and toward people like Jan Hatzius who
are actually talking economic substance. It might also mean
placing more emphasis on the noisiness of economic indicators
and economic forecasts. Perhaps initial estimates of GDP should
be reported with margins of error, just as political polls are.
More broadly, it means recognizing that the amount of
confidence someone expresses in a prediction is not a good
indication of its accuracy---to the contrary, these qualities are
often inversely correlated. Danger lurks, in the economy and
elsewhere, when we discourage forecasters from making a full
and explicit account of the risks inherent in the world around
us.

More Related Content

Similar to Summary of Chapter 5In chapter five of The Signal and the No

116[6]W O R K W I T H   H U M A N   N AT U R EIn
116[6]W O R K  W I T H   H U M A N   N AT U R EIn 116[6]W O R K  W I T H   H U M A N   N AT U R EIn
116[6]W O R K W I T H   H U M A N   N AT U R EIn BenitoSumpter862
 
116[6]W O R K W I T H   H U M A N   N AT U R EIn
116[6]W O R K  W I T H   H U M A N   N AT U R EIn 116[6]W O R K  W I T H   H U M A N   N AT U R EIn
116[6]W O R K W I T H   H U M A N   N AT U R EIn SantosConleyha
 
Running head PBAD201-1303B-03 P4IPP4IP .docx
Running head  PBAD201-1303B-03 P4IPP4IP                      .docxRunning head  PBAD201-1303B-03 P4IPP4IP                      .docx
Running head PBAD201-1303B-03 P4IPP4IP .docxjoellemurphey
 
ADAM PARRISHowHurricane SandyTamed tneBureaucracy.docx
ADAM PARRISHowHurricane SandyTamed tneBureaucracy.docxADAM PARRISHowHurricane SandyTamed tneBureaucracy.docx
ADAM PARRISHowHurricane SandyTamed tneBureaucracy.docxcoubroughcosta
 
Preparing New Zealand for rising seas: Certainty and Uncertainty
Preparing New Zealand for rising seas: Certainty and UncertaintyPreparing New Zealand for rising seas: Certainty and Uncertainty
Preparing New Zealand for rising seas: Certainty and UncertaintyBlair Mayston
 
2013.38 roger a. pielke jr.
2013.38 roger a. pielke  jr.2013.38 roger a. pielke  jr.
2013.38 roger a. pielke jr.Anochi.com.
 
Expect the unexpected: Scientific facts and economic impacts of natural disas...
Expect the unexpected: Scientific facts and economic impacts of natural disas...Expect the unexpected: Scientific facts and economic impacts of natural disas...
Expect the unexpected: Scientific facts and economic impacts of natural disas...Munich Re
 
Watch newsletter nov2014
Watch newsletter nov2014Watch newsletter nov2014
Watch newsletter nov2014Alan Milligan
 
James Stuart Full paper(1)
James Stuart Full paper(1)James Stuart Full paper(1)
James Stuart Full paper(1)James Stuart
 
Con artistry in predictive science
Con artistry in predictive scienceCon artistry in predictive science
Con artistry in predictive scienceKapernicus AB
 
PDF of PPT - Identification of Flood Prone Roads.pdf
PDF of PPT - Identification of Flood Prone Roads.pdfPDF of PPT - Identification of Flood Prone Roads.pdf
PDF of PPT - Identification of Flood Prone Roads.pdfSiddeshAvSiddeshAv
 
Dealing with Mother Nature's Attitude Problem - v.17
Dealing with Mother Nature's Attitude Problem - v.17Dealing with Mother Nature's Attitude Problem - v.17
Dealing with Mother Nature's Attitude Problem - v.17Brian Gongol
 
The quake phenomenon
The quake phenomenonThe quake phenomenon
The quake phenomenonAbirmanu
 

Similar to Summary of Chapter 5In chapter five of The Signal and the No (19)

20120816 london.pptx
20120816 london.pptx20120816 london.pptx
20120816 london.pptx
 
116[6]W O R K W I T H   H U M A N   N AT U R EIn
116[6]W O R K  W I T H   H U M A N   N AT U R EIn 116[6]W O R K  W I T H   H U M A N   N AT U R EIn
116[6]W O R K W I T H   H U M A N   N AT U R EIn
 
116[6]W O R K W I T H   H U M A N   N AT U R EIn
116[6]W O R K  W I T H   H U M A N   N AT U R EIn 116[6]W O R K  W I T H   H U M A N   N AT U R EIn
116[6]W O R K W I T H   H U M A N   N AT U R EIn
 
WEATHER FORECASTING
WEATHER FORECASTINGWEATHER FORECASTING
WEATHER FORECASTING
 
Running head PBAD201-1303B-03 P4IPP4IP .docx
Running head  PBAD201-1303B-03 P4IPP4IP                      .docxRunning head  PBAD201-1303B-03 P4IPP4IP                      .docx
Running head PBAD201-1303B-03 P4IPP4IP .docx
 
ADAM PARRISHowHurricane SandyTamed tneBureaucracy.docx
ADAM PARRISHowHurricane SandyTamed tneBureaucracy.docxADAM PARRISHowHurricane SandyTamed tneBureaucracy.docx
ADAM PARRISHowHurricane SandyTamed tneBureaucracy.docx
 
Essay On Drought As A Natural Disaster
Essay On Drought As A Natural DisasterEssay On Drought As A Natural Disaster
Essay On Drought As A Natural Disaster
 
Davosstein
DavossteinDavosstein
Davosstein
 
Preparing New Zealand for rising seas: Certainty and Uncertainty
Preparing New Zealand for rising seas: Certainty and UncertaintyPreparing New Zealand for rising seas: Certainty and Uncertainty
Preparing New Zealand for rising seas: Certainty and Uncertainty
 
2013.38 roger a. pielke jr.
2013.38 roger a. pielke  jr.2013.38 roger a. pielke  jr.
2013.38 roger a. pielke jr.
 
Expect the unexpected: Scientific facts and economic impacts of natural disas...
Expect the unexpected: Scientific facts and economic impacts of natural disas...Expect the unexpected: Scientific facts and economic impacts of natural disas...
Expect the unexpected: Scientific facts and economic impacts of natural disas...
 
Watch newsletter nov2014
Watch newsletter nov2014Watch newsletter nov2014
Watch newsletter nov2014
 
01katrina
01katrina01katrina
01katrina
 
James Stuart Full paper(1)
James Stuart Full paper(1)James Stuart Full paper(1)
James Stuart Full paper(1)
 
Con artistry in predictive science
Con artistry in predictive scienceCon artistry in predictive science
Con artistry in predictive science
 
PDF of PPT - Identification of Flood Prone Roads.pdf
PDF of PPT - Identification of Flood Prone Roads.pdfPDF of PPT - Identification of Flood Prone Roads.pdf
PDF of PPT - Identification of Flood Prone Roads.pdf
 
Dealing with Mother Nature's Attitude Problem - v.17
Dealing with Mother Nature's Attitude Problem - v.17Dealing with Mother Nature's Attitude Problem - v.17
Dealing with Mother Nature's Attitude Problem - v.17
 
Essay On Drought
Essay On DroughtEssay On Drought
Essay On Drought
 
The quake phenomenon
The quake phenomenonThe quake phenomenon
The quake phenomenon
 

More from daniatrappit

Assignment 1 Victims’ Rights and the Dos and Don’ts of Interviewing.docx
Assignment 1 Victims’ Rights and the Dos and Don’ts of Interviewing.docxAssignment 1 Victims’ Rights and the Dos and Don’ts of Interviewing.docx
Assignment 1 Victims’ Rights and the Dos and Don’ts of Interviewing.docxdaniatrappit
 
Assignment 1 Trends in the WorkplaceDue Week 3 and worth 200 .docx
Assignment 1 Trends in the WorkplaceDue Week 3 and worth 200 .docxAssignment 1 Trends in the WorkplaceDue Week 3 and worth 200 .docx
Assignment 1 Trends in the WorkplaceDue Week 3 and worth 200 .docxdaniatrappit
 
Assignment 1 The Cold War and U.S. DiplomacyDue 11-02-15 and wort.docx
Assignment 1 The Cold War and U.S. DiplomacyDue 11-02-15 and wort.docxAssignment 1 The Cold War and U.S. DiplomacyDue 11-02-15 and wort.docx
Assignment 1 The Cold War and U.S. DiplomacyDue 11-02-15 and wort.docxdaniatrappit
 
Assignment 1 Socioeconomic StatusInterestingly, researchers have .docx
Assignment 1 Socioeconomic StatusInterestingly, researchers have .docxAssignment 1 Socioeconomic StatusInterestingly, researchers have .docx
Assignment 1 Socioeconomic StatusInterestingly, researchers have .docxdaniatrappit
 
Assignment 1 Trust and BoundariesIn this module, you learned ab.docx
Assignment 1 Trust and BoundariesIn this module, you learned ab.docxAssignment 1 Trust and BoundariesIn this module, you learned ab.docx
Assignment 1 Trust and BoundariesIn this module, you learned ab.docxdaniatrappit
 
Assignment 1 The Problems of Evil and SufferingAll human bein.docx
Assignment 1 The Problems of Evil and SufferingAll human bein.docxAssignment 1 The Problems of Evil and SufferingAll human bein.docx
Assignment 1 The Problems of Evil and SufferingAll human bein.docxdaniatrappit
 
Assignment 1 The Primary Care ClinicDue Week 4 and worth 160 poin.docx
Assignment 1 The Primary Care ClinicDue Week 4 and worth 160 poin.docxAssignment 1 The Primary Care ClinicDue Week 4 and worth 160 poin.docx
Assignment 1 The Primary Care ClinicDue Week 4 and worth 160 poin.docxdaniatrappit
 
Assignment 1 the sociological viewpoint toward social problems (Due.docx
Assignment 1 the sociological viewpoint toward social problems (Due.docxAssignment 1 the sociological viewpoint toward social problems (Due.docx
Assignment 1 the sociological viewpoint toward social problems (Due.docxdaniatrappit
 
Assignment 1 The Role of Weak Institutions in Underdevelopment .docx
Assignment 1 The Role of Weak Institutions in Underdevelopment .docxAssignment 1 The Role of Weak Institutions in Underdevelopment .docx
Assignment 1 The Role of Weak Institutions in Underdevelopment .docxdaniatrappit
 
Assignment 1 White-Collar CrimeVictor and John work as software i.docx
Assignment 1 White-Collar CrimeVictor and John work as software i.docxAssignment 1 White-Collar CrimeVictor and John work as software i.docx
Assignment 1 White-Collar CrimeVictor and John work as software i.docxdaniatrappit
 
Assignment 1 Special Interest GroupsGroups advancing specific.docx
Assignment 1 Special Interest GroupsGroups advancing specific.docxAssignment 1 Special Interest GroupsGroups advancing specific.docx
Assignment 1 Special Interest GroupsGroups advancing specific.docxdaniatrappit
 
Assignment 1 Should the U.S. Convert to a Zero Personal Income Ta.docx
Assignment 1 Should the U.S. Convert to a Zero Personal Income Ta.docxAssignment 1 Should the U.S. Convert to a Zero Personal Income Ta.docx
Assignment 1 Should the U.S. Convert to a Zero Personal Income Ta.docxdaniatrappit
 
Assignment 1 Resource and Competitive Position AnalysisUsing your.docx
Assignment 1 Resource and Competitive Position AnalysisUsing your.docxAssignment 1 Resource and Competitive Position AnalysisUsing your.docx
Assignment 1 Resource and Competitive Position AnalysisUsing your.docxdaniatrappit
 
Assignment 1 Research PaperDue Week 3 and worth 200 points.docx
Assignment 1 Research PaperDue Week 3 and worth 200 points.docxAssignment 1 Research PaperDue Week 3 and worth 200 points.docx
Assignment 1 Research PaperDue Week 3 and worth 200 points.docxdaniatrappit
 
Assignment 1 RaceAs you work in the human services delivery secto.docx
Assignment 1 RaceAs you work in the human services delivery secto.docxAssignment 1 RaceAs you work in the human services delivery secto.docx
Assignment 1 RaceAs you work in the human services delivery secto.docxdaniatrappit
 
Assignment 1 Political Belief Profile The relationship betwee.docx
Assignment 1 Political Belief Profile The relationship betwee.docxAssignment 1 Political Belief Profile The relationship betwee.docx
Assignment 1 Political Belief Profile The relationship betwee.docxdaniatrappit
 
Assignment 1 Procedural Law and the Bill of RightsDue Week 4 and .docx
Assignment 1 Procedural Law and the Bill of RightsDue Week 4 and .docxAssignment 1 Procedural Law and the Bill of RightsDue Week 4 and .docx
Assignment 1 Procedural Law and the Bill of RightsDue Week 4 and .docxdaniatrappit
 
Assignment 1 Objectives Log in to and out of a Linux system. U.docx
Assignment 1 Objectives Log in to and out of a Linux system. U.docxAssignment 1 Objectives Log in to and out of a Linux system. U.docx
Assignment 1 Objectives Log in to and out of a Linux system. U.docxdaniatrappit
 
Assignment 1 Linux GUIDue Week 2 and worth 90 pointsAs explaine.docx
Assignment 1 Linux GUIDue Week 2 and worth 90 pointsAs explaine.docxAssignment 1 Linux GUIDue Week 2 and worth 90 pointsAs explaine.docx
Assignment 1 Linux GUIDue Week 2 and worth 90 pointsAs explaine.docxdaniatrappit
 
Assignment 1 LASA 2—Exceptionality PresentationIn this course, yo.docx
Assignment 1 LASA 2—Exceptionality PresentationIn this course, yo.docxAssignment 1 LASA 2—Exceptionality PresentationIn this course, yo.docx
Assignment 1 LASA 2—Exceptionality PresentationIn this course, yo.docxdaniatrappit
 

More from daniatrappit (20)

Assignment 1 Victims’ Rights and the Dos and Don’ts of Interviewing.docx
Assignment 1 Victims’ Rights and the Dos and Don’ts of Interviewing.docxAssignment 1 Victims’ Rights and the Dos and Don’ts of Interviewing.docx
Assignment 1 Victims’ Rights and the Dos and Don’ts of Interviewing.docx
 
Assignment 1 Trends in the WorkplaceDue Week 3 and worth 200 .docx
Assignment 1 Trends in the WorkplaceDue Week 3 and worth 200 .docxAssignment 1 Trends in the WorkplaceDue Week 3 and worth 200 .docx
Assignment 1 Trends in the WorkplaceDue Week 3 and worth 200 .docx
 
Assignment 1 The Cold War and U.S. DiplomacyDue 11-02-15 and wort.docx
Assignment 1 The Cold War and U.S. DiplomacyDue 11-02-15 and wort.docxAssignment 1 The Cold War and U.S. DiplomacyDue 11-02-15 and wort.docx
Assignment 1 The Cold War and U.S. DiplomacyDue 11-02-15 and wort.docx
 
Assignment 1 Socioeconomic StatusInterestingly, researchers have .docx
Assignment 1 Socioeconomic StatusInterestingly, researchers have .docxAssignment 1 Socioeconomic StatusInterestingly, researchers have .docx
Assignment 1 Socioeconomic StatusInterestingly, researchers have .docx
 
Assignment 1 Trust and BoundariesIn this module, you learned ab.docx
Assignment 1 Trust and BoundariesIn this module, you learned ab.docxAssignment 1 Trust and BoundariesIn this module, you learned ab.docx
Assignment 1 Trust and BoundariesIn this module, you learned ab.docx
 
Assignment 1 The Problems of Evil and SufferingAll human bein.docx
Assignment 1 The Problems of Evil and SufferingAll human bein.docxAssignment 1 The Problems of Evil and SufferingAll human bein.docx
Assignment 1 The Problems of Evil and SufferingAll human bein.docx
 
Assignment 1 The Primary Care ClinicDue Week 4 and worth 160 poin.docx
Assignment 1 The Primary Care ClinicDue Week 4 and worth 160 poin.docxAssignment 1 The Primary Care ClinicDue Week 4 and worth 160 poin.docx
Assignment 1 The Primary Care ClinicDue Week 4 and worth 160 poin.docx
 
Assignment 1 the sociological viewpoint toward social problems (Due.docx
Assignment 1 the sociological viewpoint toward social problems (Due.docxAssignment 1 the sociological viewpoint toward social problems (Due.docx
Assignment 1 the sociological viewpoint toward social problems (Due.docx
 
Assignment 1 The Role of Weak Institutions in Underdevelopment .docx
Assignment 1 The Role of Weak Institutions in Underdevelopment .docxAssignment 1 The Role of Weak Institutions in Underdevelopment .docx
Assignment 1 The Role of Weak Institutions in Underdevelopment .docx
 
Assignment 1 White-Collar CrimeVictor and John work as software i.docx
Assignment 1 White-Collar CrimeVictor and John work as software i.docxAssignment 1 White-Collar CrimeVictor and John work as software i.docx
Assignment 1 White-Collar CrimeVictor and John work as software i.docx
 
Assignment 1 Special Interest GroupsGroups advancing specific.docx
Assignment 1 Special Interest GroupsGroups advancing specific.docxAssignment 1 Special Interest GroupsGroups advancing specific.docx
Assignment 1 Special Interest GroupsGroups advancing specific.docx
 
Assignment 1 Should the U.S. Convert to a Zero Personal Income Ta.docx
Assignment 1 Should the U.S. Convert to a Zero Personal Income Ta.docxAssignment 1 Should the U.S. Convert to a Zero Personal Income Ta.docx
Assignment 1 Should the U.S. Convert to a Zero Personal Income Ta.docx
 
Assignment 1 Resource and Competitive Position AnalysisUsing your.docx
Assignment 1 Resource and Competitive Position AnalysisUsing your.docxAssignment 1 Resource and Competitive Position AnalysisUsing your.docx
Assignment 1 Resource and Competitive Position AnalysisUsing your.docx
 
Assignment 1 Research PaperDue Week 3 and worth 200 points.docx
Assignment 1 Research PaperDue Week 3 and worth 200 points.docxAssignment 1 Research PaperDue Week 3 and worth 200 points.docx
Assignment 1 Research PaperDue Week 3 and worth 200 points.docx
 
Assignment 1 RaceAs you work in the human services delivery secto.docx
Assignment 1 RaceAs you work in the human services delivery secto.docxAssignment 1 RaceAs you work in the human services delivery secto.docx
Assignment 1 RaceAs you work in the human services delivery secto.docx
 
Assignment 1 Political Belief Profile The relationship betwee.docx
Assignment 1 Political Belief Profile The relationship betwee.docxAssignment 1 Political Belief Profile The relationship betwee.docx
Assignment 1 Political Belief Profile The relationship betwee.docx
 
Assignment 1 Procedural Law and the Bill of RightsDue Week 4 and .docx
Assignment 1 Procedural Law and the Bill of RightsDue Week 4 and .docxAssignment 1 Procedural Law and the Bill of RightsDue Week 4 and .docx
Assignment 1 Procedural Law and the Bill of RightsDue Week 4 and .docx
 
Assignment 1 Objectives Log in to and out of a Linux system. U.docx
Assignment 1 Objectives Log in to and out of a Linux system. U.docxAssignment 1 Objectives Log in to and out of a Linux system. U.docx
Assignment 1 Objectives Log in to and out of a Linux system. U.docx
 
Assignment 1 Linux GUIDue Week 2 and worth 90 pointsAs explaine.docx
Assignment 1 Linux GUIDue Week 2 and worth 90 pointsAs explaine.docxAssignment 1 Linux GUIDue Week 2 and worth 90 pointsAs explaine.docx
Assignment 1 Linux GUIDue Week 2 and worth 90 pointsAs explaine.docx
 
Assignment 1 LASA 2—Exceptionality PresentationIn this course, yo.docx
Assignment 1 LASA 2—Exceptionality PresentationIn this course, yo.docxAssignment 1 LASA 2—Exceptionality PresentationIn this course, yo.docx
Assignment 1 LASA 2—Exceptionality PresentationIn this course, yo.docx
 

Recently uploaded

On National Teacher Day, meet the 2024-25 Kenan Fellows
On National Teacher Day, meet the 2024-25 Kenan FellowsOn National Teacher Day, meet the 2024-25 Kenan Fellows
On National Teacher Day, meet the 2024-25 Kenan FellowsMebane Rash
 
This PowerPoint helps students to consider the concept of infinity.
This PowerPoint helps students to consider the concept of infinity.This PowerPoint helps students to consider the concept of infinity.
This PowerPoint helps students to consider the concept of infinity.christianmathematics
 
How to Manage Call for Tendor in Odoo 17
How to Manage Call for Tendor in Odoo 17How to Manage Call for Tendor in Odoo 17
How to Manage Call for Tendor in Odoo 17Celine George
 
Jamworks pilot and AI at Jisc (20/03/2024)
Jamworks pilot and AI at Jisc (20/03/2024)Jamworks pilot and AI at Jisc (20/03/2024)
Jamworks pilot and AI at Jisc (20/03/2024)Jisc
 
The basics of sentences session 3pptx.pptx
The basics of sentences session 3pptx.pptxThe basics of sentences session 3pptx.pptx
The basics of sentences session 3pptx.pptxheathfieldcps1
 
HMCS Max Bernays Pre-Deployment Brief (May 2024).pptx
HMCS Max Bernays Pre-Deployment Brief (May 2024).pptxHMCS Max Bernays Pre-Deployment Brief (May 2024).pptx
HMCS Max Bernays Pre-Deployment Brief (May 2024).pptxEsquimalt MFRC
 
Spellings Wk 4 and Wk 5 for Grade 4 at CAPS
Spellings Wk 4 and Wk 5 for Grade 4 at CAPSSpellings Wk 4 and Wk 5 for Grade 4 at CAPS
Spellings Wk 4 and Wk 5 for Grade 4 at CAPSAnaAcapella
 
How to Add New Custom Addons Path in Odoo 17
How to Add New Custom Addons Path in Odoo 17How to Add New Custom Addons Path in Odoo 17
How to Add New Custom Addons Path in Odoo 17Celine George
 
21st_Century_Skills_Framework_Final_Presentation_2.pptx
21st_Century_Skills_Framework_Final_Presentation_2.pptx21st_Century_Skills_Framework_Final_Presentation_2.pptx
21st_Century_Skills_Framework_Final_Presentation_2.pptxJoelynRubio1
 
80 ĐỀ THI THỬ TUYỂN SINH TIẾNG ANH VÀO 10 SỞ GD – ĐT THÀNH PHỐ HỒ CHÍ MINH NĂ...
80 ĐỀ THI THỬ TUYỂN SINH TIẾNG ANH VÀO 10 SỞ GD – ĐT THÀNH PHỐ HỒ CHÍ MINH NĂ...80 ĐỀ THI THỬ TUYỂN SINH TIẾNG ANH VÀO 10 SỞ GD – ĐT THÀNH PHỐ HỒ CHÍ MINH NĂ...
80 ĐỀ THI THỬ TUYỂN SINH TIẾNG ANH VÀO 10 SỞ GD – ĐT THÀNH PHỐ HỒ CHÍ MINH NĂ...Nguyen Thanh Tu Collection
 
On_Translating_a_Tamil_Poem_by_A_K_Ramanujan.pptx
On_Translating_a_Tamil_Poem_by_A_K_Ramanujan.pptxOn_Translating_a_Tamil_Poem_by_A_K_Ramanujan.pptx
On_Translating_a_Tamil_Poem_by_A_K_Ramanujan.pptxPooja Bhuva
 
COMMUNICATING NEGATIVE NEWS - APPROACHES .pptx
COMMUNICATING NEGATIVE NEWS - APPROACHES .pptxCOMMUNICATING NEGATIVE NEWS - APPROACHES .pptx
COMMUNICATING NEGATIVE NEWS - APPROACHES .pptxannathomasp01
 
Graduate Outcomes Presentation Slides - English
Graduate Outcomes Presentation Slides - EnglishGraduate Outcomes Presentation Slides - English
Graduate Outcomes Presentation Slides - Englishneillewis46
 
General Principles of Intellectual Property: Concepts of Intellectual Proper...
General Principles of Intellectual Property: Concepts of Intellectual  Proper...General Principles of Intellectual Property: Concepts of Intellectual  Proper...
General Principles of Intellectual Property: Concepts of Intellectual Proper...Poonam Aher Patil
 
Interdisciplinary_Insights_Data_Collection_Methods.pptx
Interdisciplinary_Insights_Data_Collection_Methods.pptxInterdisciplinary_Insights_Data_Collection_Methods.pptx
Interdisciplinary_Insights_Data_Collection_Methods.pptxPooja Bhuva
 
Food safety_Challenges food safety laboratories_.pdf
Food safety_Challenges food safety laboratories_.pdfFood safety_Challenges food safety laboratories_.pdf
Food safety_Challenges food safety laboratories_.pdfSherif Taha
 
Basic Intentional Injuries Health Education
Basic Intentional Injuries Health EducationBasic Intentional Injuries Health Education
Basic Intentional Injuries Health EducationNeilDeclaro1
 
Basic Civil Engineering first year Notes- Chapter 4 Building.pptx
Basic Civil Engineering first year Notes- Chapter 4 Building.pptxBasic Civil Engineering first year Notes- Chapter 4 Building.pptx
Basic Civil Engineering first year Notes- Chapter 4 Building.pptxDenish Jangid
 
Towards a code of practice for AI in AT.pptx
Towards a code of practice for AI in AT.pptxTowards a code of practice for AI in AT.pptx
Towards a code of practice for AI in AT.pptxJisc
 
Single or Multiple melodic lines structure
Single or Multiple melodic lines structureSingle or Multiple melodic lines structure
Single or Multiple melodic lines structuredhanjurrannsibayan2
 

Recently uploaded (20)

On National Teacher Day, meet the 2024-25 Kenan Fellows
On National Teacher Day, meet the 2024-25 Kenan FellowsOn National Teacher Day, meet the 2024-25 Kenan Fellows
On National Teacher Day, meet the 2024-25 Kenan Fellows
 
This PowerPoint helps students to consider the concept of infinity.
This PowerPoint helps students to consider the concept of infinity.This PowerPoint helps students to consider the concept of infinity.
This PowerPoint helps students to consider the concept of infinity.
 
How to Manage Call for Tendor in Odoo 17
How to Manage Call for Tendor in Odoo 17How to Manage Call for Tendor in Odoo 17
How to Manage Call for Tendor in Odoo 17
 
Jamworks pilot and AI at Jisc (20/03/2024)
Jamworks pilot and AI at Jisc (20/03/2024)Jamworks pilot and AI at Jisc (20/03/2024)
Jamworks pilot and AI at Jisc (20/03/2024)
 
The basics of sentences session 3pptx.pptx
The basics of sentences session 3pptx.pptxThe basics of sentences session 3pptx.pptx
The basics of sentences session 3pptx.pptx
 
HMCS Max Bernays Pre-Deployment Brief (May 2024).pptx
HMCS Max Bernays Pre-Deployment Brief (May 2024).pptxHMCS Max Bernays Pre-Deployment Brief (May 2024).pptx
HMCS Max Bernays Pre-Deployment Brief (May 2024).pptx
 
Spellings Wk 4 and Wk 5 for Grade 4 at CAPS
Spellings Wk 4 and Wk 5 for Grade 4 at CAPSSpellings Wk 4 and Wk 5 for Grade 4 at CAPS
Spellings Wk 4 and Wk 5 for Grade 4 at CAPS
 
How to Add New Custom Addons Path in Odoo 17
How to Add New Custom Addons Path in Odoo 17How to Add New Custom Addons Path in Odoo 17
How to Add New Custom Addons Path in Odoo 17
 
21st_Century_Skills_Framework_Final_Presentation_2.pptx
21st_Century_Skills_Framework_Final_Presentation_2.pptx21st_Century_Skills_Framework_Final_Presentation_2.pptx
21st_Century_Skills_Framework_Final_Presentation_2.pptx
 
80 ĐỀ THI THỬ TUYỂN SINH TIẾNG ANH VÀO 10 SỞ GD – ĐT THÀNH PHỐ HỒ CHÍ MINH NĂ...
80 ĐỀ THI THỬ TUYỂN SINH TIẾNG ANH VÀO 10 SỞ GD – ĐT THÀNH PHỐ HỒ CHÍ MINH NĂ...80 ĐỀ THI THỬ TUYỂN SINH TIẾNG ANH VÀO 10 SỞ GD – ĐT THÀNH PHỐ HỒ CHÍ MINH NĂ...
80 ĐỀ THI THỬ TUYỂN SINH TIẾNG ANH VÀO 10 SỞ GD – ĐT THÀNH PHỐ HỒ CHÍ MINH NĂ...
 
On_Translating_a_Tamil_Poem_by_A_K_Ramanujan.pptx
On_Translating_a_Tamil_Poem_by_A_K_Ramanujan.pptxOn_Translating_a_Tamil_Poem_by_A_K_Ramanujan.pptx
On_Translating_a_Tamil_Poem_by_A_K_Ramanujan.pptx
 
COMMUNICATING NEGATIVE NEWS - APPROACHES .pptx
COMMUNICATING NEGATIVE NEWS - APPROACHES .pptxCOMMUNICATING NEGATIVE NEWS - APPROACHES .pptx
COMMUNICATING NEGATIVE NEWS - APPROACHES .pptx
 
Graduate Outcomes Presentation Slides - English
Graduate Outcomes Presentation Slides - EnglishGraduate Outcomes Presentation Slides - English
Graduate Outcomes Presentation Slides - English
 
General Principles of Intellectual Property: Concepts of Intellectual Proper...
General Principles of Intellectual Property: Concepts of Intellectual  Proper...General Principles of Intellectual Property: Concepts of Intellectual  Proper...
General Principles of Intellectual Property: Concepts of Intellectual Proper...
 
Interdisciplinary_Insights_Data_Collection_Methods.pptx
Interdisciplinary_Insights_Data_Collection_Methods.pptxInterdisciplinary_Insights_Data_Collection_Methods.pptx
Interdisciplinary_Insights_Data_Collection_Methods.pptx
 
Food safety_Challenges food safety laboratories_.pdf
Food safety_Challenges food safety laboratories_.pdfFood safety_Challenges food safety laboratories_.pdf
Food safety_Challenges food safety laboratories_.pdf
 
Basic Intentional Injuries Health Education
Basic Intentional Injuries Health EducationBasic Intentional Injuries Health Education
Basic Intentional Injuries Health Education
 
Basic Civil Engineering first year Notes- Chapter 4 Building.pptx
Basic Civil Engineering first year Notes- Chapter 4 Building.pptxBasic Civil Engineering first year Notes- Chapter 4 Building.pptx
Basic Civil Engineering first year Notes- Chapter 4 Building.pptx
 
Towards a code of practice for AI in AT.pptx
Towards a code of practice for AI in AT.pptxTowards a code of practice for AI in AT.pptx
Towards a code of practice for AI in AT.pptx
 
Single or Multiple melodic lines structure
Single or Multiple melodic lines structureSingle or Multiple melodic lines structure
Single or Multiple melodic lines structure
 

Summary of Chapter 5In chapter five of The Signal and the No

  • 1. Summary of Chapter 5 In chapter five of The Signal and the Noise, the author Nate Silver explains the difficulties of predicting earthquakes. Due to the lack of comprehensive understanding of earth’s crust, seismologists are unable to make timely predictions on earthquakes. Many people have tried but failed, and their false predictions cause huge consequences. Giampaolo Giuliani’s false alarm prediction caused the public to panic and put the local government under high pressure. Fear of making another false alarm warning, the authority hesitated to issue an earthquake warning when the real earthquake hit, causing huge casualties and severe damage to the city. Other examples of failed predictions mentioned by Silver include Brain Brandy’s prediction on Lima Peru, Parkfield, and Mojave Desert, California. Although the current technologies and understandings are insufficient to predict earthquakes, seismologists can forecast earthquakes in a larger time frame using statistical analysis. In the chapter, Silver also discusses the current model and method used by seismologists to forecast and the downside of this approach. One of the key challenges with earthquake predictions is the narrow definition of prediction. According to Silver, prediction and forecast have different meanings in seismology. Prediction needs to be accurate to a given time and place. Forecast, on the other hand, can simply be a probability over a long timeframe. Given the high accuracy requirement in seismology, earthquake prediction seems impossible with the current technology, Another difficulty with earthquake prediction is the lack of observation of the earth's crust. Similar to the weather forecast, Chaos theory applies to seismic activities as well, meaning one
  • 2. crustal activity might lead to another. Unlike the weather, the earth's crust is underneath the earth, making it difficult to observe. Due to a lack of understanding, seismologists depend solely on statistical methods to forecast future earthquakes. Since the statistical method only provides the probability of the event, thus, with the current technology, seismologists are not able to predict earthquakes. Furthermore, there are many downsides to the current statistical model. The earthquake model, Gutenberg-Richter law, uses historical earthquake data to identify earthquake patterns and then calculates the probability of earthquakes. However, some major earthquakes only happen once in a thousand years. With limited data, the pattern generated is not as accurate because the model might treat those rare events as outliers. Oftentimes, those outliers got ignored. The earthquake that struck Tohoku Japan is a classic example of ignoring the outlier as seismologists believed that it was rare. Semistoligists did pick up some patterns of the foreshock. However, the pattern of the foreshock was not as discernable, and thus it was overlooked. As a result, the earthquake caused severe damage. One lesson from the Tohoku earthquake is that every data point should not be overlooked. Sometimes, patterns are not as obvious as the public expects. Even some semiologists tried to find the perfect pattern by manipulating the data because it would give them a good reputation in the academic world. However, the perfect pattern found by overfitting or underfitting the data usually produces less accurate forecasts, which do more harm to the public. Since earthquake prediction is still at the preliminary stage, one way to reduce the catastrophic damage caused by earthquakes is through government policies. Silver mentions one of the best measures can be to increase the readiness for earthquakes. Some of the sample policies to improve readiness include setting an earthquake-resisting building requirement in areas where
  • 3. earthquakes are likely to happen to reduce the damage to housing; issuing earthquake protocols and instructions to local government; setting a minimum requirement on the emergency supplies needed to be stocked by each city; educating the public on how to evacuate when an earthquake strikes. Another measure the government should take is to carefully evaluate the forecast before issuing an earthquake warning to avoid causing public panic. The key takeaway from Chapter 5 is when using a statistical model to forecast the future try to avoid finding the perfect pattern by manipulating data. The real world is more complicated than the model and often filled with outliers. Moreover, sometimes patterns are less discernable and to be sure to examine all data points carefully. 6 HOW TO DROWN IN THREE FEET OF WATER Political polls are dutifully reported with a margin of error, which gives us a clue that they contain some uncertainty. Most of the time when an economic prediction is presented, however, only a single number is mentioned. The economy will create 150,000 jobs next month. GDP will grow by 3 percent next year. Oil will rise to $120 per barrel. This creates the perception that these forecasts are amazingly accurate. Headlines expressing surprise at any minor deviation from the prediction are common in coverage of the economy: Unexpected Jump in Unemployment
  • 4. Rate to 9.2% Stings Markets ---Denver Post, July 9, 20111 If you read the fine print of that article, you'd discover that the "unexpected" result was that the unemployment rate had come in at 9.2 percent---rather than 9.1 percent2 as economists had forecasted. If a one-tenth of a percentage point error is enough to make headlines, it seems like these forecasts must ordinarily be very reliable. Instead, economic forecasts are blunt instruments at best, rarely being able to anticipate economic turning points more than a few months in advance. Fairly often, in fact, these forecasts have failed to "predict" recessions even once they were already under way: a majority of economists did not think we were in one when the three most recent recessions, in 1990, 2001, and 2007, were later determined to have begun.3 Forecasting something as large and complex as the American economy is a very challenging task. The gap between how well these forecasts actually do and how well they are perceived to do is substantial. Some economic forecasters wouldn't want you to know that. Like forecasters in most other disciplines, they see uncertainty as the enemy---something that threatens their reputation. They don't estimate it accurately, making assumptions that lower the amount
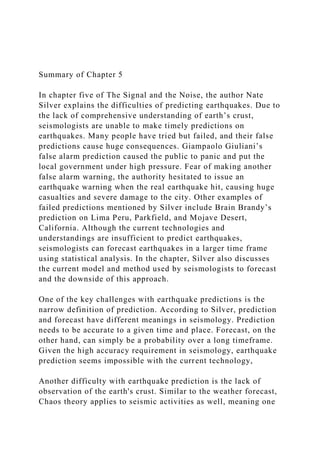
  • 5. of uncertainty in their forecast models but that don't improve their predictions in the real world. This tends to leave us less prepared when a deluge hits. The Importance of Communicating Uncertainty In April 1997, the Red River of the North flooded Grand Forks, North Dakota, overtopping the town's levees and spilling more than two miles into the city.*4 Although there was no loss of life, nearly all of the city's 50,000 residents had to be evacuated, cleanup costs ran into the billions of dollars,5 and 75 percent of the city's homes were damaged or destroyed.6 Unlike a hurricane or an earthquake, the Grand Forks flood may have been a preventable disaster. The city's floodwalls could have been reinforced using sandbags.7 It might also have been possible to divert the overflow into depopulated areas--- into farmland instead of schools, churches, and homes. Residents of Grand Forks had been aware of the flood threat for months. Snowfall had been especially heavy in the Great Plains that winter, and the National Weather Service, anticipating runoff as the snow melted, had predicted the waters of the Red River would crest to forty-nine feet, close to the alltime record. There was just one small problem. The levees in Grand Forks had been built to handle a flood of fifty-one feet. Even a small miss in the forty-nine-foot prediction could prove catastrophic. In fact, the river crested to fifty-four feet. The Weather
  • 6. Service's forecast hadn't been perfect by any means, but a five- foot miss, two months in advance of a flood, is pretty reasonable---about as well as these predictions had done on average historically. The margin of error on the Weather Service's forecast---based on how well their flood forecasts had done in the past---was about plus or minus nine feet. That implied about a 35 percent chance of the levees being overtopped.8 FIGURE 6-1: FLOOD PREDICTION WITH MARGIN OF ERROR9 The problem is that the Weather Service had explicitly avoided communicating the uncertainty in their forecast to the public, emphasizing only the forty-nine-foot prediction. The forecasters later told researchers that they were afraid the public might lose confidence in the forecast if they had conveyed any uncertainty in the outlook. Instead, of course, it would have made the public much better prepared---and possibly able to prevent the flooding by reinforcing the levees or diverting the river flow. Left to their own devices, many residents became convinced they didn't have anything to worry about. (Very few of them bought flood insurance.10) A prediction of a forty-nine-foot crest in the river, expressed without any reservation, seemed to imply that the flood would hit forty-nine feet exactly; the fifty-one-foot levees would be just enough to keep them safe. Some residents even
  • 7. interpreted the forecast of forty-nine feet as representing the maximum possible extent of the flood.11 An oft-told joke: a statistician drowned crossing a river that was only three feet deep on average. On average, the flood might be forty-nine feet in the Weather Service's forecast model, but just a little bit higher and the town would be inundated. The National Weather Service has since come to recognize the importance of communicating the uncertainty in their forecasts accurately and honestly to the public, as we saw in chapter 4. But this sort of attitude is rare among other kinds of forecasters, especially when they predict the course of the economy. Are Economists Rational? Now consider what happened in November 2007. It was just one month before the Great Recession officially began. There were already clear signs of trouble in the housing market: foreclosures had doubled,12 and the mortgage lender Countrywide was on the verge of bankruptcy.13 There were equally ominous signs in credit markets.14 Economists in the Survey of Professional Forecasters, a quarterly poll put out by the Federal Reserve Bank of Philadelphia, nevertheless foresaw a recession as relatively unlikely. Instead, they expected the economy to grow at a just slightly below average rate of 2.4 percent in 2008. And they thought there was almost no chance of a recession as severe as the one that actually unfolded.
  • 8. The Survey of Professional Forecasters is unique in that it asks economists to explicitly indicate a range of outcomes for where they see the economy headed. As I have emphasized throughout this book, a probabilistic consideration of outcomes is an essential part of a scientific forecast. If I asked you to forecast the total that will be produced when you roll a pair of six-sided dice, the correct answer is not any single number but an enumeration of possible outcomes and their respective probabilities, as in figure 6-2. Although you will roll 7 more often than any other number, it is not intrinsically any more or any less consistent with your forecast than a roll of 2 or 12, provided that each number comes up in accordance with the probability you assign it over the long run. The economists in the Survey of Professional Forecasters are asked to do something similar when they forecast GDP and other variables---estimating, for instance, the probability that GDP might come in at between 2 percent and 3 percent, or between 3 percent and 4 percent. This is what their forecast for GDP looked like in November 2007 (figure 6-3): As I mentioned, the economists in this survey thought that GDP would end up at about 2.4 percent in 2008, slightly below its long-term trend. This was a very bad forecast: GDP actually shrank by 3.3 percent once the financial crisis hit. What may be worse is that the economists were extremely confident in their bad prediction. They assigned only a 3 percent chance to the economy's shrinking by any margin over the whole of 2008.15
  • 9. And they gave it only about a 1-in-500 chance of shrinking by at least 2 percent, as it did.16 Indeed, economists have for a long time been much too confident in their ability to predict the direction of the economy. In figure 6-4, I've plotted the forecasts of GDP growth from the Survey of Professional Forecasters for the eighteen years between 1993 and 2010.17 The bars in the chart represent the 90 percent prediction intervals as stated by the economists. A prediction interval is a range of the most likely outcomes that a forecast provides for, much like the margin of error in a poll. A 90 percent prediction interval, for instance, is supposed to cover 90 percent of the possible real-world outcomes, leaving only the 10 percent of outlying cases at the tail ends of the distribution. If the economists' forecasts were as accurate as they claimed, we'd expect the actual value for GDP to fall within their prediction interval nine times out of ten, or all but about twice in eighteen years. FIGURE 6-4: GDP FORECASTS: 90 PERCENT PREDICTION INTERVALS AGAINST ACTUAL RESULTS In fact, the actual value for GDP fell outside the economists' prediction interval six times in eighteen years, or fully one-third of the time. Another study, 18 which ran these numbers back to
  • 10. the beginnings of the Survey of Professional Forecasters in 1968, found even worse results: the actual figure for GDP fell outside the prediction interval almost half the time. There is almost no chance19 that the economists have simply been unlucky; they fundamentally overstate the reliability of their predictions. In reality, when a group of economists give you their GDP forecast, the true 90 percent prediction interval---based on how these forecasts have actually performed20 and not on how accurate the economists claim them to be---spans about 6.4 points of GDP (equivalent to a margin of error of plus or minus 3.2 percent).* When you hear on the news that GDP will grow by 2.5 percent next year, that means it could quite easily grow at a spectacular rate of 5.7 percent instead. Or it could fall by 0.7 percent---a fairly serious recession. Economists haven't been able to do any better than that, and there isn't much evidence that their forecasts are improving. The old joke about economists' having called nine out of the last six recessions correctly has some truth to it; one actual statistic is that in the 1990s, economists predicted only 2 of the 60 recessions around the world a year ahead of time.21 Economists aren't unique in this regard. Results like these are the rule; experts either aren't very good at providing an honest description of the uncertainty in their forecasts, or they aren't very interested in doing so. This property of overconfident
  • 11. predictions has been identified in many other fields, including medical research, political science, finance, and psychology. It seems to apply both when we use our judgment to make a forecast (as Phil Tetlock's political scientists did) and when we use a statistical model to do so (as in the case of the failed earthquake forecasts that I described in chapter 5). But economists, perhaps, have fewer excuses than those in other professions for making these mistakes. For one thing, their predictions have not just been overconfident but also quite poor in a real-world sense, often missing the actual GDP figure by a very large and economically meaningful margin. For another, organized efforts to predict variables like GDP have been around for many years, dating back to the Livingston Survey in 1946, and these results are well-documented and freely available. Getting feedback about how well our predictions have done is one way---perhaps the essential way---to improve them. Economic forecasters get more feedback than people in most other professions, but they haven't chosen to correct for their bias toward overconfidence. Isn't economics supposed to be the field that studies the rationality of human behavior? Sure, you might expect someone in another field---an anthropologist, say---to show bias when he makes a forecast. But not an economist. Actually, however, that may be part of the problem. Economists understand a lot about rationality---which means they also understand a lot about how our incentives work. If they're making biased forecasts, perhaps this is a sign that they don't have much incentive to make good ones. "Nobody Has a Clue"
  • 12. Given the track record of their forecasts, there was one type of economist I was most inclined to seek out---an economist who would be honest about how difficult his job is and how easily his forecast might turn out to be wrong. I was able to find one: Jan Hatzius, the chief economist at Goldman Sachs. Hatzius can at least claim to have been more reliable than his competitors in recent years. In November 2007, a time when most economists still thought a recession of any kind to be unlikely, Hatzius penned a provocative memo entitled "Leveraged Losses: Why Mortgage Defaults Matter." It warned of a scenario in which millions of homeowners could default on their mortgages and trigger a domino effect on credit and financial markets, producing trillions of dollars in losses and a potentially very severe recession---pretty much exactly the scenario that unfolded. Hatzius and his team were also quick to discount the possibility of a miraculous postcrisis recovery. In February 2009, a month after the stimulus package had been passed and the White House had claimed it would reduce unemployment to 7.8 percent by the end of 2009, Hatzius projected unemployment to rise to 9.5 percent22 (quite close to the actual figure of 9.9 percent). Hatzius, a mellow to the point of melancholy German who became Goldman Sachs's chief economist in 2005,23 eight years after starting at the firm, draws respect even from those who take a skeptical view of the big banks. "[Jan is] very good," Paul Krugman told me. "I hope that Lloyd Blankfein's malevolence won't spill over to Jan and his people." Hatzius also has a refreshingly humble attitude about his ability to forecast the direction of the U.S. economy.
  • 13. "Nobody has a clue," he told me when I met him at Goldman's glassy office on West Street in New York. "It's hugely difficult to forecast the business cycle. Understanding an organism as complex as the economy is very hard." As Hatzius sees it, economic forecasters face three fundamental challenges. First, it is very hard to determine cause and effect from economic statistics alone. Second, the economy is always changing, so explanations of economic behavior that hold in one business cycle may not apply to future ones. And third, as bad as their forecasts have been, the data that economists have to work with isn't much good either. Correlations Without Causation The government produces data on literally 45,000 economic indicators each year.24 Private data providers track as many as four million statistics.25 The temptation that some economists succumb to is to put all this data into a blender and claim that the resulting gruel is haute cuisine. There have been only eleven recessions since the end of World War II. 26 If you have a statistical model that seeks to explain eleven outputs but has to choose from among four million inputs to do so, many of the relationships it identifies are going to be spurious. (This is another classic case of overfitting---mistaking noise for a signal- --the problem that befell earthquake forecasters in chapter 5.) Consider how creative you might be when you have a stack of economic variables as thick as a phone book. A once-famous "leading indicator" of economic performance, for instance, was
  • 14. the winner of the Super Bowl. From Super Bowl I in 1967 through Super Bowl XXXI in 1997, the stock market27 gained an average of 14 percent for the rest of the year when a team from the original National Football League (NFL) won the game.28 But it fell by almost 10 percent when a team from the original American Football League (AFL) won instead. Through 1997, this indicator had correctly "predicted" the direction of the stock market in twenty-eight of thirty-one years. A standard test of statistical significance,29 if taken literally, would have implied that there was only about a 1-in-4,700,000 possibility that the relationship had emerged from chance alone. I t was just a coincidence, of course. And eventually, the indicator began to perform badly. In 1998, the Denver Broncos, an original AFL team, won the Super Bowl---supposedly a bad omen. But rather than falling, the stock market gained 28 percent amid the dot-com boom. In 2008, the NFL's New York Giants came from behind to upset the AFL's New England Patriots on David Tyree's spectacular catch---but Tyree couldn't prevent the collapse of the housing bubble, which caused the market to crash by 35 percent. Since 1998, in fact, the stock market has done about 10 percent better when the AFL team won the Super Bowl, exactly the opposite of what the indicator was fabled to predict. How does an indicator that supposedly had just a 1-in-
  • 15. 4,700,000 chance of failing flop so badly? For the same reason that, even though the odds of winning the Powerball lottery are only 1 chance in 195 million,30 somebody wins it every few weeks. The odds are hugely against any one person winning the lottery---but millions of tickets are bought, so somebody is going to get lucky. Likewise, of the millions of statistical indicators in the world, a few will have happened to correlate especially well with stock prices or GDP or the unemployment rate. If not the winner of the Super Bowl, it might be chicken production in Uganda. But the relationship is merely coincidental. Although economists might not take the Super Bowl indicator seriously, they can talk themselves into believing that other types of variables---anything that has any semblance of economic meaning---are critical "leading indicators" foretelling a recession or recovery months in advance. One forecasting firm brags about how it looks at four hundred such variables,31 far more than the two or three dozen major ones that Hatzius says contain most of the economic substance.* Other forecasters have touted the predictive power of such relatively obscure indicators as the ratio of bookings-to-billings at semiconductor companies.32 With so many economic variables to pick from, you're sure to find something that fits the noise in the past data well. It's much harder to find something that identifies the signal; variables that are leading indicators in one economic cycle often turn out to be lagging ones in the next. Of the seven so-called
  • 16. leading indicators in a 2003 Inc. magazine article,33 all of which had been good predictors of the 1990 and 2001 recessions, only two---housing prices and temporary hiring---led the recession that began in 2007 to any appreciable degree. Others, like commercial lending, did not begin to turn downward until a year after the recession began. Even the well-regarded Leading Economic Index, a composite of ten economic indicators published by the Conference Board, has had its share of problems. The Leading Economic Index has generally declined a couple of months in advance of recessions. But it has given roughly as many false alarms---including most infamously in 1984, when it sharply declined for three straight months,34 signaling a recession, but the economy continued to zoom upward at a 6 percent rate of growth. Some studies have even claimed that the Leading Economic Index has no predictive power at all when applied in real time.35 "There's very little that's really predictive," Hatzius told me. "Figuring out what's truly causal and what's correlation is very difficult to do." Most of you will have heard the maxim "correlation does not imply causation." Just because two variables have a statistical relationship with each other does not mean that one is responsible for the other. For instance, ice cream sales and forest fires are correlated because both occur more often in the summer heat. But there is no causation; you don't light a patch of the Montana brush on fire when you buy a pint of Häagen-Dazs.
  • 17. If this concept is easily expressed, however, it can be hard to apply in practice, particularly when it comes to understanding the causal relationships in the economy. Hatzius noted, for instance, that the unemployment rate is usually taken to be a lagging indicator. And sometimes it is. After a recession, businesses may not hire new employees until they are confident about the prospects for recovery, and it can take a long time to get all the unemployed back to work again. But the unemployment rate can also be a leading indicator for consumer demand, since unemployed people don't have much ability to purchase new goods and services. During recessions, the economy can fall into a vicious cycle: businesses won't hire until they see more consumer demand, but consumer demand is low because businesses aren't hiring and consumers can't afford their products. Consumer confidence is another notoriously tricky variable. Sometimes consumers are among the first to pick up warning signs in the economy. But they can also be among the last to detect recoveries, with the public often perceiving the economy to be in recession long after a recession is technically over. Thus, economists debate whether consumer confidence is a leading or lagging indicator,36 and the answer may be contingent on the point in the business cycle the economy finds itself at. Moreover, since consumer confidence affects consumer behavior, there may be all kinds of feedback loops between expectations about the economy and the reality of it. An Economic Uncertainty Principle
  • 18. Perhaps an even more problematic set of feedback loops are those between economic forecasts and economic policy. If, for instance, the economy is forecasted to go into recession, the government and the Federal Reserve will presumably take steps to ameliorate the risk or at least soften the blow. Part of the problem, then, is that forecasters like Hatzius have to predict political decisions as well as economic ones, which can be a challenge in a country where the Congress has a 10 percent approval rating. But this issue also runs a little deeper. As pointed out by the Nobel Prize--winning economist Robert Lucas37 in 1976, the past data that an economic model is premised on resulted in part from policy decisions in place at the time. Thus, it may not be enough to know what current policy makers will do; you also need to know what fiscal and monetary policy looked like during the Nixon administration. A related doctrine known as Goodhart's law, after the London School of Economics professor who proposed it,38 holds that once policy makers begin to target a particular variable, it may begin to lose its value as an economic indicator. For instance, if the government artificially takes steps to inflate housing prices, they might well increase, but they will no longer be good measures of overall economic health. At its logical extreme, this is a bit like the observer effect (often mistaken for a related concept, the Heisenberg uncertainty principle): once we begin to measure something, its behavior starts to change. Most statistical models are built on the notion
  • 19. that there are independent variables and dependent variables, inputs and outputs, and they can be kept pretty much separate from one another.39 When it comes to the economy, they are all lumped together in one hot mess. An Ever-Changing Economy Even if they could resolve all these problems, economists would still have to contend with a moving target. The American and global economies are always evolving, and the relationships between different economic variables can change over the course of time. Historically, for instance, there has been a reasonably strong correlation between GDP growth and job growth. Economists refer to this as Okun's law. During the Long Boom of 1947 through 1999, the rate of job growth40 had normally been about half the rate of GDP growth, so if GDP increased by 4 percent during a year, the number of jobs would increase by about 2 percent. The relationship still exists---more growth is certainly better for job seekers. But its dynamics seem to have changed. After each of the last couple of recessions, considerably fewer jobs were created than would have been expected during the Long Boom years. In the year after the stimulus package was passed in 2009, for instance, GDP was growing fast enough to create about two million jobs according to Okun's law.41 Instead, an additional 3.5 million jobs were lost during the period. Economists often debate about what the change means. The
  • 20. most pessimistic interpretation, advanced by economists including Jeffrey Sachs of Columbia University, is that the pattern reflects profound structural problems in the American economy: among them, increasing competition from other countries, an imbalance between the service and manufacturing sectors, an aging population, a declining middle class, and a rising national debt. Under this theory, we have entered a new and unhealthy normal, and the problems may get worse unless fundamental changes are made. "We were underestimating the role of global change in causing U.S. change," Sachs told me. "The loss of jobs internationally to China and emerging markets have really jolted the American economy." The bigger question is whether the volatility of the 2000s is more representative of the long-run condition of the economy--- perhaps the long boom years had been the outlier. During the Long Boom, the economy was in recession only 15 percent of the time. But the rate was more than twice that---36 percent---from 1900 through 1945.42 Although most economists believe that some progress has been made in stabilizing the business cycle, we may have been lucky to avoid more problems. This particularly holds in the period between 1983 and 2006---a subset of the Long Boom that is sometimes called the Great Moderation---when the economy was in recession just 3 percent of the time. But much of the growth was fueled by large increases in government and consumer debt, as well as by various asset-price bubbles. Advanced economies have no divine right to grow at Great Moderation rates: Japan's, which grew at 5 percent annually during the 1980s, has grown by barely one percent per year
  • 21. since then.43 This may be one reason why forecasters and policy makers were taken so much by surprise by the depth of the 2007 recession. Not only were they failing to account for events like the Great Depression*---they were sometimes calibrating their forecasts according to the Great Moderation years, which were an outlier, historically speaking. Don't Throw Out Data The Federal Open Market Committee, which is charged with setting interest rates, is required by law to release macroeconomic forecasts to Congress at least twice per year. The Fed was in some ways ahead of the curve by late 2007: their forecasts of GDP growth were slightly more bearish than those issued by private-sector forecasters, prompting them to lower interest rates four times toward the end of the year. Still, in the Fed's extensive minutes from a late October 2007 meeting, the term "recession" was not used even once in its discussion of the economy.44 The Fed is careful with its language, and the possibility of a recession may nevertheless have been implied through the use of phrases like downside risks. But they were not betting on a recession (their forecast still projected growth), and there was little indication that they were entertaining the possibility of as severe a recession as actually unfolded. Part of the reason may have been that the Fed was looking at
  • 22. data from the Great Moderation years to set their expectations for the accuracy of their forecasts. In particular, they relied heavily upon a paper that looked at how economic forecasts had performed from 1986 through 2006.45 The problem with looking at only these years is that they contained very little economic volatility: just two relatively mild recessions in 1990--1991 and in 2001. "By gauging current uncertainty with data from the mid- 1980s on," the authors warned, "we are implicitly assuming that the calm conditions since the Great Moderation will persist into the future." This was an awfully big assumption to make. The Fed may have concluded that a severe recession was unlikely in 2007 in part because they had chosen to ignore years in which there were severe recessions. A forecaster should almost never ignore data, especially when she is studying rare events like recessions or presidential elections, about which there isn't very much data to begin with. Ignoring data is often a tip-off that the forecaster is overconfident, or is overfitting her model---that she is interested in showing off rather than trying to be accurate. In this particular case, it was not obvious that economists had improved much at forecasting the business cycle. In figure 6-5a, I've compared predicted levels of GDP growth from the Survey of Professional Forecasters against the actual figures for the years 1968 through 1985---these are the years the Fed could have looked at but chose to throw out. You'll see there's quite a lot of economic volatility in this period, such as during the inflation-driven recessions of the mid-1970s and early 1980s. Still, the results are not completely discouraging for forecasters,
  • 23. in that the forecasted and actual outcomes have a reasonably strong correlation with one another. If you make the same plot for the years 1986 through 2006 (as in figure 6-5b), you'll find just the reverse. Most of the data points---both the forecasted values for GDP and the actual ones- --are bunched closely together in a narrow range between about 2 percent and 5 percent annual growth. Because there was so little volatility during this time, the average error in the forecast was less than in the previous period.* However, to the extent there was any variability in the economy, like the mild recessions of 1990--91 or in 2001, the forecasts weren't doing a very good job of capturing it---in fact, there was almost no correlation between the predicted and actual results. There was little indication that economists had become more skilled at forecasting the course of the economy. Instead, their jobs had become temporarily easier because of the calm economic winds, as a weather forecaster in Honolulu faces an easier task than one in Buffalo. The other rationale you'll sometimes hear for throwing out data is that there has been some sort of fundamental shift in the problem you are trying to solve. Sometimes these arguments are valid to a certain extent: the American economy is a constantly evolving thing and periodically undergoes structural shifts
  • 24. (recently, for instance, from an economy dominated by manufacturing to one dominated by its service sector). This isn't baseball, where the game is always played by the same rules. The problem with this is that you never know when the next paradigm shift will occur, and whether it will tend to make the economy more volatile or less so, stronger or weaker. An economic model conditioned on the notion that nothing major will change is a useless one. But anticipating these turning points is not easy. Economic Data Is Very Noisy The third major challenge for economic forecasters is that their raw data isn't much good. I mentioned earlier that economic forecasters rarely provide their prediction intervals when they produce their forecasts---probably because doing so would undermine the public's confidence in their expertise. "Why do people not give intervals? Because they're embarrassed," Hatzius says. "I think that's the reason. People are embarrassed." The uncertainty, however, applies not just to economic forecasts but also to the economic variables themselves. Most economic data series are subject to revision, a process that can go on for months and even years after the statistics are first published. The revisions are sometimes enormous.46 One somewhat infamous example was the government's estimate of GDP growth in the last quarter of 2008. Initially reported as "only" a 3.8 percent rate of decline, the economy is now believed to have been declining at almost 9 percent. Had they known the real size of the economic hole, the White House's
  • 25. economists might have pushed for a larger stimulus package in January 2009, or they might have realized how deep the problems were and promoted a longer-term solution rather than attempting a quick fix. Large errors like these have been fairly common. Between 1965 and 2009,47 the government's initial estimates of quarterly GDP were eventually revised, on average, by 1.7 points. That is the average change; the range of possible changes in each quarterly GDP is higher still, and the margin of error 48 on an initial quarterly GDP estimate is plus or minus 4.3 percent. That means there's a chance that the economy will turn out to have been in recession even if the government had initially reported above-average growth, or vice versa. The government first reported that the economy had grown by 4.2 percent in the fourth quarter of 1977, for instance, but that figure was later revised to negative 0.1 percent.49 So we should have some sympathy for economic forecasters.50 It's hard enough to know where the economy is going. But it's much, much harder if you don't know where it is to begin with. A Butterfly Flaps Its Wings in Brazil and Someone Loses a Job in Texas The challenge to economists might be compared to the one faced by weather forecasters. They face two of the same fundamental problems. First, the economy, like the atmosphere, is a dynamic system: everything affects everything else and the systems are
  • 26. perpetually in motion. In meteorology, this problem is quite literal, since the weather is subject to chaos theory---a butterfly flapping its wings in Brazil can theoretically cause a tornado in Texas. But in loosely the same way, a tsunami in Japan or a longshoreman's strike in Long Beach can affect whether someone in Texas finds a job. Second, weather forecasts are subject to uncertain initial conditions. The probabilistic expression of weather forecasts ("there's a 70 percent chance of rain") arises not because there is any inherent randomness in the weather. Rather, the problem is that meteorologists assume they have imprecise measurements of what the initial conditions were like, and weather patterns (because they are subject to chaos theory) are extremely sensitive to changes in the initial conditions. In economic forecasting, likewise, the quality of the initial data is frequently quite poor. Weather prediction, however, is one of the real success stories in this book. Forecasts of everything from hurricane trajectories to daytime high temperatures have gotten much better than they were even ten or twenty years ago, thanks to a combination of improved computer power, better data-collection methods, and old-fashioned hard work. The same cannot be said for economic forecasting. Any illusion that economic forecasts were getting better ought to have been shattered by the terrible mistakes economists made in
  • 27. advance of the recent financial crisis.51 If the meteorologist shares some of the economist's problems of a dynamic system with uncertain initial conditions, she has a wealth of hard science to make up for it. The physics and chemistry of something like a tornado are not all that complicated. That does not mean that tornadoes are easy to predict. But meteorologists have a strong fundamental understanding of what causes tornadoes to form and what causes them to dissipate. Economics is a much softer science. Although economists have a reasonably sound understanding of the basic systems that govern the economy, the cause and effect are all blurred together, especially during bubbles and panics when the system is flushed with feedback loops contingent on human behavior. Nevertheless, if discerning cause and effect is difficult for economists, it is probably better to try than just give up. Consider again, for instance, what Hatzius wrote on November 15, 2007: The likely mortgage credit losses pose a significantly bigger macroeconomic risk than generally recognized. . . . The macroeconomic consequences could be quite dramatic. If leveraged investors see $200 [billion in] aggregate credit loss, they might need to scale back their lending by $2 trillion. This is a large shock. . . . It is easy to see how such a shock could produce a substantial recession or a long period of very sluggish growth. Consumers had been extended too much credit, Hatzius wrote,
  • 28. to pay for homes that the housing bubble had made unaffordable. Many of them had stopped making their mortgage payments, and there were likely to be substantial losses from this. The degree of leverage in the system would compound the problem, paralyzing the credit market and the financial industry more broadly. The shock might be large enough to trigger a severe recession. And this is exactly how the financial crisis played out. Not only was Hatzius's forecast correct, but it was also right for the right reasons, explaining the causes of the collapse and anticipating the effects. Hatzius refers to this chain of cause and effect as a "story." It is a story about the economy---and although it might be a data-driven story, it is one grounded in the real world. In contrast, if you just look at the economy as a series of variables and equations without any underlying structure, you are almost certain to mistake noise for a signal and may delude yourself (and gullible investors) into thinking you are making good forecasts when you are not. Consider what happened to one of Hatzius's competitors, the forecasting firm ECRI. In September 2011, ECRI predicted a near certainty of a "double dip" recession. "There's nothing that policy makers can do to head it off," it advised.52 "If you think this is a bad economy, you haven't seen anything yet." In interviews, the managing director of the firm, Lakshman Achuthan, suggested
  • 29. the recession would begin almost immediately if it hadn't started already.53 The firm described the reasons for its prediction in this way: ECRI's recession call isn't based on just one or two leading indexes, but on dozens of specialized leading indexes, including the U.S. Long Leading Index . . . to be followed by downturns in the Weekly Leading Index and other shorter-leading indexes. In fact, the most reliable forward-looking indicators are now collectively behaving as they did on the cusp of full- blown recessions.54 There's plenty of jargon, but what is lacking in this description is any actual economic substance. Theirs was a story about data- --as though data itself caused recessions---and not a story about the economy. ECRI actually seems quite proud of this approach. "Just as you do not need to know exactly how a car engine works in order to drive safely," it advised its clients in a 2004 book, "You do not need to understand all the intricacies of the economy to accurately read those gauges."55 This kind of statement is becoming more common in the age of Big Data.56 Who needs theory when you have so much information? But this is categorically the wrong attitude to take toward forecasting, especially in a field like economics where the data is so noisy. Statistical inferences are much stronger
  • 30. when backed up by theory or at least some deeper thinking about their root causes. There were certainly reasons for economic pessimism in September 201157---for instance, the unfolding debt crisis in Europe---but ECRI wasn't looking at those. Instead, it had a random soup of variables that mistook correlation for causation.58 Indeed, the ECRI forecast seemed to demark an economic turning point---but it was a positive one. The S&P 500 gained 21 percent in the five months after ECRI announced its recession call,59 while GDP growth registered at a fairly healthy clip of 3.0 percent in the last quarter of 2011 instead of going into recession. ECRI kicked the can down the road, "clarifying" the call to say that it extended all the way into 2012 even though this is not what they had implied originally.60 When Biased Forecasts Are Rational If you're looking for an economic forecast, the best place to turn is the average or aggregate prediction rather than that of any one economist. My research into the Survey of Professional Forecasters suggests that these aggregate forecasts are about 20 percent more accurate61 than the typical individual's forecast at predicting GDP, 10 percent better at predicting unemployment, and 30 percent better at predicting inflation. This property--- group forecasts beat individual ones---has been found to be true in almost every field in which it has been studied.
  • 31. And yet while the notion that aggregate forecasts beat individual ones is an important empirical regularity, it is sometimes used as a cop-out when forecasts might be improved. The aggregate forecast is made up of individual forecasts; if those improve, so will the group's performance. Moreover, even the aggregate economic forecasts have been quite poor in any real-world sense, so there is plenty of room for progress. Most economists rely on their judgment to some degree when they make a forecast, rather than just take the output of a statistical model as is. Given how noisy the data is, this is probably helpful. A study62 by Stephen K. McNess, the former vice president of the Federal Reserve Bank of Boston, found that judgmental adjustments to statistical forecasting methods resulted in forecasts that were about 15 percent more accurate. The idea that a statistical model would be able to "solve" the problem of economic forecasting was somewhat in vogue during the 1970s and 1980s when computers came into wider use. But as was the case in other fields, like earthquake forecasting during that time period, improved technology did not cover for the lack of theoretical understanding about the economy; it only gave economists faster and more elaborate ways to mistake noise for a signal. Promising-seeming models failed badly at some point or another and were consigned to the dustbin.63 Invoking one's judgment, however, also introduces the potential for bias. You may make the forecast that happens to fit your economic incentives or your political beliefs. Or you may be too proud to change your story even when the facts and circumstances demand it. "I do think that people have the tendency, which needs to be actively fought," Hatzius told me,
  • 32. "to see the information flow the way you want to see it." Are some economists better at managing this trade-off than others? Is the economist who called the last recession right more likely to get the next one too? This question has an interesting answer. Statistical tests designed to identify predictive skill have generally come up with negative results when applied to the Survey of Professional Forecasters.64 That is, if you look at that survey, there doesn't seem to be much evidence that some economists are consistently better than others. Studies of another panel, the Blue Chip Economic Survey, have more often come up with positive findings, however.65 There is clearly a lot of luck involved in economic forecasting---economists who are permanently bearish or bullish are guaranteed to be right every now and then. But the studies of the Blue Chip panel seem to find that some economists do a little bit better than others over the long run. What is the difference between the two surveys? The Survey of Professional Forecasters is conducted anonymously: each economist is assigned a random ID number that remains constant from survey to survey, but nothing is revealed about just who he is or what he does. In the Blue Chip panel, on the other hand, everybody's forecast has his name and reputation attached to it.
  • 33. When you have your name attached to a prediction, your incentives may change. For instance, if you work for a poorly known firm, it may be quite rational for you to make some wild forecasts that will draw big attention when they happen to be right, even if they aren't going to be right very often. Firms like Goldman Sachs, on the other hand, might be more conservative in order to stay within the consensus. Indeed, this exact property has been identified in the Blue Chip forecasts:66 one study terms the phenomenon "rational bias."67 The less reputation you have, the less you have to lose by taking a big risk when you make a prediction. Even if you know that the forecast is dodgy, it might be rational for you to go after the big score. Conversely, if you have already established a good reputation, you might be reluctant to step too far out of line even when you think the data demands it. Either of these reputational concerns potentially distracts you from the goal of making the most honest and accurate forecasts- -- and they probably worsen forecasts on balance. Although the differences are modest, historically the anonymous participants in the Survey of Professional Forecasters have done slightly better at predicting GDP and unemployment than the reputation- minded Blue Chip panelists.68 Overcoming Bias If it can be rational to produce bad forecasts, that implies there are consumers of these forecasts who aid and abet them. Just as
  • 34. there are political pundits who make careers out of making implausible claims to partisan audiences, there are bears, bulls, and contrarians who will always have a constituency in the marketplace for economic ideas. (Sometimes economic forecasts have expressly political purposes too. It turns out that the economic forecasts produced by the White House, for instance, have historically been among the least accurate of all,69 regardless of whether it's a Democrat or a Republican in charge.) When it comes to economic forecasting, however, the stakes are higher than for political punditry. As Robert Lucas pointed out, the line between economic forecasting and economic policy is very blurry; a bad forecast can make the real economy worse. There may be some hope at the margin for economic forecasting to benefit from further technological improvements. Things like Google search traffic patterns, for instance, can serve as leading indicators for economic data series like unemployment. "The way we think about it is if you take something like initial claims on unemployment insurance, that's a very good predictor for unemployment rates, which is a good predictor for economic activity," I was told by Google's chief economist, Hal Varian, at Google's headquarters in Mountain View, California. "We can predict unemployment initial claims earlier because if you're in a company and a rumor goes around that there are going to be layoffs, then people start searching 'where's the unemployment office,' 'how am I going to apply for unemployment,' and so on. It's a slightly leading indicator."
  • 35. Still, the history of forecasting in economics and other fields suggests that technological improvements may not help much if they are offset by human biases, and there is little indication that economic forecasters have overcome these. For instance, they do not seem to have been chastened much by their experience with the Great Recession. If you look at the forecasts for GDP growth that the Survey of Professional Forecasters made in November 2011 (figure 6-6), it still exhibited the same tendency toward overconfidence that we saw in 2007, with forecasters discounting both upside and downside economic scenarios far more than is justified by the historical accuracy of their forecasts.70 If we want to reduce these biases---we will never be rid of them entirely---we have two fundamental alternatives. One might be thought of as a supply-side approach---creating a market for accurate economic forecasts. The other might be a demand-side alternative: reducing demand for inaccurate and overconfident ones. Robin Hanson, an economist at George Mason University, is an advocate of the supply-side alternative. I met him for lunch at one of his favorite Moroccan places in northern Virginia. He's
  • 36. in his early fifties but looks much younger (despite being quite bald), and is a bit of an eccentric. He plans to have his head cryogenically frozen when he dies.71 He is also an advocate of a system he calls "futarchy" in which decisions on policy issues are made by prediction markets72 rather than politicians. He is clearly not a man afraid to challenge the conventional wisdom. Instead, Hanson writes a blog called Overcoming Bias, in which he presses his readers to consider which cultural taboos, ideological beliefs, or misaligned incentives might constrain them from making optimal decisions. "I think the most interesting question is how little effort we actually put into forecasting, even on the things we say are important to us," Hanson told me as the food arrived. "In an MBA school you present this image of a manager as a great decision maker---the scientific decision maker. He's got his spreadsheet and he's got his statistical tests and he's going to weigh the various options. But in fact real management is mostly about managing coalitions, maintaining support for a project so it doesn't evaporate. If they put together a coalition to do a project, and then at the last minute the forecasts fluctuate, you can't dump the project at the last minute, right? "Even academics aren't very interested in collecting a track record of forecasts---they're not very interested in making clear enough forecasts to score," he says later. "What's in it for them?
  • 37. The more fundamental problem is that we have a demand for experts in our society but we don't actually have that much of a demand for accurate forecasts." Hanson, in order to address this deficiency, is an advocate of prediction markets---systems where you can place bets on a particular economic or policy outcome, like whether Israel will go to war with Iran, or how much global temperatures will rise because of climate change. His argument for these is pretty simple: they ensure that we have a financial stake in being accurate when we make forecasts, rather than just trying to look good to our peers. We will revisit the idea of prediction markets in chapter 11; they are not a panacea, particularly if we make the mistake of assuming that they can never go wrong. But as Hansen says, they can yield some improvement by at least getting everyone's incentives in order. One of the most basic applications might simply be markets for predicting macroeconomic variables like GDP and unemployment. There are already a variety of direct and indirect ways to bet on things like inflation, interest rates, and commodities prices, but no high-volume market for GDP exists. There could be a captive audience for these markets: common stocks have become more highly correlated with macroeconomic risks in recent years,73 so they could provide a means of hedging against them. These markets would also provide real-time information to policy makers, essentially serving as
  • 38. continuously updated forecasts of GDP. Adding options to the markets---bets on, say, whether GDP might grow by 5 percent, or decline by 2 percent---would punish overconfident forecasters and yield more reliable estimates of the uncertainties inherent in forecasting the economy. The other solution, the "demand-side" approach, is slower and more incremental. It simply means that we have to be better consumers of forecasts. In the context of the economic forecasting, that might mean turning the spotlight away from charlatans with "black box" models full of random assortments of leading indicators and toward people like Jan Hatzius who are actually talking economic substance. It might also mean placing more emphasis on the noisiness of economic indicators and economic forecasts. Perhaps initial estimates of GDP should be reported with margins of error, just as political polls are. More broadly, it means recognizing that the amount of confidence someone expresses in a prediction is not a good indication of its accuracy---to the contrary, these qualities are often inversely correlated. Danger lurks, in the economy and elsewhere, when we discourage forecasters from making a full and explicit account of the risks inherent in the world around us.